Article

Intelligent Assessment of Scientific Creativity by Integrating Data Augmentation and Pseudo-Labeling

1
CAS Key Laboratory of Behavioral Science, Institute of Psychology, Chinese Academy of Sciences, Beijing 100101, China
2
Department of Psychology, University of Chinese Academy of Sciences, Beijing 100049, China
3
Wenzhou Experimental Primary School, Wenzhou 325000, China
*
Author to whom correspondence should be addressed.
These authors contributed equally to this work.
Information 2025, 16(9), 785; https://doi.org/10.3390/info16090785
Submission received: 10 August 2025 / Revised: 31 August 2025 / Accepted: 3 September 2025 / Published: 10 September 2025

Abstract

Scientific creativity is a crucial indicator of adolescents’ potential in science and technology, and its automated evaluation plays a vital role in the early identification of innovative talent. To address challenges such as limited sample sizes, high annotation costs, and modality heterogeneity, this study proposes a multimodal assessment method that integrates data augmentation and pseudo-labeling techniques. For the first time, a joint enhancement approach is introduced that combines textual and visual data with a pseudo-labeling strategy to accommodate the characteristics of text–image integration in elementary students’ cognitive expressions. Specifically, SMOTE is employed to expand questionnaire data, EDA is used to enhance hand-drawn text–image data, and text–image semantic alignment is applied to improve sample quality. Additionally, a confidence-driven pseudo-labeling mechanism is incorporated to optimize the use of unlabeled data. Finally, multiple machine learning models are integrated to predict scientific creativity. The results demonstrate the following: 1. Data augmentation significantly increases sample diversity, and the highest accuracy of information alignment was achieved when text and images were matched. 2. The combination of data augmentation and pseudo-labeling mechanisms improves model robustness and generalization. 3. Family environment, parental education, and curiosity are key factors influencing scientific creativity. This study offers a cost-effective and efficient approach for assessing scientific creativity in elementary students and provides practical guidance for fostering their innovative potential.

1. Introduction

With the rapid advancement of technology, scientific creativity has become a vital indicator for assessing the quality of scientific and technological talent. It also serves as a key driver of technological innovation and social progress. Scientific creativity is generally defined as the ability to generate novel ideas or outcomes through the interaction of general creativity and scientific knowledge [1]. National competitiveness is closely tied to the creativity of its citizens, making the cultivation of scientific creativity a central goal in foundational education for developing scientific and technological talent [2].
The primary school stage is often regarded as a sensitive period for creativity development [3]. As noted by Lubart et al. [4], employing well-designed tools to assess scientific creativity is essential for identifying children’s creative potential and guiding educators in developing effective strategies to foster it. Such tools can also help to critically evaluate practices that may hinder creativity, thereby supporting innovative thinking and the early cultivation of future scientific and technological talents. However, assessing scientific creativity remains a significant challenge. At present, most evaluations rely on questionnaire-based methods that require professional raters to conduct manual assessments using standardized criteria [5,6]. Although this approach has shown some practical success, it presents several limitations, including time-consuming scoring processes, high subjectivity, and difficulties in evaluating mixed text–image responses. These issues hinder both the consistency and efficiency of assessments [2,7].
The rapid advancement of artificial intelligence (AI) has opened new possibilities for assessing scientific creativity. Researchers have investigated the use of machine learning to analyze students’ textual and visual data, developing creativity prediction models to enable automated evaluation [8,9,10]. For example, the deep learning-based AuDrA platform can evaluate children’s drawings with results that closely align with human scoring [11]. However, research on scientific creativity often encounters challenges related to limited sample sizes, which increase the risk of overfitting in machine learning models and reduce their generalizability [10].
In recent years, data augmentation and semi-supervised learning techniques have shown considerable promise in small-sample learning contexts. Data augmentation enhances model robustness by expanding training datasets through techniques such as image transformation or text rewriting [12]. Semi-supervised learning leverages large volumes of unlabeled data and pseudo-labeling strategies to mitigate the issue of label scarcity [13,14,15]. These methods have proven effective in domains such as natural language processing and questionnaire analysis [8,16], yet their systematic application to the assessment of scientific creativity remains limited.
To address this gap, the present study proposes a prediction framework that integrates data augmentation and semi-supervised learning for assessing scientific creativity. The framework combines structured questionnaire data with text–image expression data and employs techniques such as pseudo-label generation and multimodal modeling to improve model performance and generalizability in small-sample scenarios. This approach offers technical support for low-cost, large-scale, and automated assessments of scientific creativity.

2. Related Work

2.1. Scientific Creativity and Its Measurement and Assessment

Research on scientific creativity emphasizes the dynamic interaction between individual traits and environmental factors in fostering its development [17]. Studies have demonstrated that family environments influence the trajectory of creativity by shaping children’s exploratory behaviors [18,19] and cognitive strategies [20]. Moreover, family settings significantly affect children’s interest, motivation (e.g., curiosity), and creative self-efficacy [21,22]. These elements play crucial roles in nurturing and sustaining scientific creativity over time.
Evaluating scientific creativity is essential for understanding its nature and influencing factors. Traditional assessment methods often involve questionnaires and open-ended tasks, typically evaluated through manual scoring. For example, the Torrance Tests of Creative Thinking (TTCT) assess fluency, flexibility, and originality [23]. In addition, several domain-specific tools have been developed, such as the Scientific Creativity Test (SCT) [5], the Creative Scientific Ability Test (C-SAT) [24], and the Figural Scientific Creativity Test (FSCT) [25]. Among these, Hu Weiping’s SCT is widely used with Chinese adolescents. However, these tools face several notable limitations: 1. Assessment depends on manual scoring, which is susceptible to rater subjectivity, fatigue, and environmental interference, compromising objectivity and consistency [2,26]. 2. Primary school students often express ideas through drawings accompanied by captions or image associations [27], increasing the complexity and workload of manual evaluation.
Consequently, developing more objective and efficient methods for assessing scientific creativity—particularly those adapted to the multimodal (text–image) expressions of elementary students—remains a pressing challenge. Advances in artificial intelligence and multimodal analysis offer promising avenues to address these limitations.

2.2. Study of Data Augmentation

In recent years, with the widespread application of deep learning in education, psychology, and creativity assessment, data augmentation has emerged as a vital technique for enhancing model generalization and robustness. Researchers have developed various augmentation strategies for text, image, audio, and multimodal data to address challenges such as sample scarcity and data imbalance [12,28].
In the domain of text, augmentation methods primarily generate diverse expressions through vocabulary replacement, sentence restructuring, insertion, semantic perturbation, and related techniques [16].
In the area of image–text recognition, Wang and Perez [13] demonstrated that traditional augmentation techniques—such as rotation, cropping, and flipping—significantly improve the performance of convolutional neural networks (CNNs) in image classification. Inoue [29] introduced Paired Sample Augmentation, which generates new samples by pairing images. This method maintains semantic consistency while introducing structural variation and has shown superior performance compared to conventional approaches. Zhang et al. [30] applied image augmentation strategies to engineering drawing recognition tasks to address classification challenges resulting from limited samples. Furthermore, Shorten and Khoshgoftaar [28] and Kumar et al. [12] conducted comprehensive reviews of image augmentation methods, covering techniques ranging from geometric transformations to generative adversarial networks (GANs). Looking ahead, the field is expected to advance toward hybrid augmentation methods (e.g., Mixup, CutMix, and AugMix) and interpretable augmentation mechanisms [31].
In questionnaire-based assessment, data augmentation is primarily used to enhance model performance under conditions of small sample sizes or imbalanced data. For instance, Hasan et al. [14] combined SMOTE oversampling with various augmentation algorithms in a classification study based on the DASS-21 psychological questionnaire. This approach significantly improved the accuracy of detecting psychological states such as anxiety and stress. SMOTE generates new samples by performing linear interpolation between instances of the minority class, thereby balancing the data distribution. It has been widely adopted in tasks such as educational assessment, behavioral prediction, and psychological scale classification.
Although data augmentation techniques have been extensively applied in educational and psychological assessments, their application in the field of creativity remains unexplored. To date, no studies have attempted to use data augmentation to address the issue of limited sample sizes in creativity research. This gap highlights an important direction for future inquiry and presents opportunities for advancing the assessment of scientific creativity.

2.3. Semi-Supervised Learning and Pseudo-Labeling

In data-driven educational and psychological research, the scarcity of labeled data and the high cost of manual annotation present significant challenges. To make efficient use of limited annotation resources, semi-supervised learning and pseudo-labeling strategies have been widely applied in areas such as image generation, text evaluation, divergent thinking measurement, and creative graphic recognition. For example, Cropley et al. [2] incorporated weak annotation and pseudo-labeling mechanisms into the automatic scoring system for the TCT-DP (Test of Creative Thinking–Drawing Production), enabling the model to learn scoring patterns from a minimal number of expert ratings. Acar et al. [32] utilized computer vision techniques to process the drawing tasks of the TTCT; by using initial manual ratings as “seed labels” and iteratively generating pseudo-labels, they achieved automated scoring while significantly reducing reliance on human raters.
In multimodal data processing, Zhang et al. [33] combined visual features of images with students’ textual descriptions of graphics to generate pseudo-labels, thereby improving the model’s capacity to interpret complex expressions of creativity. In generative text research, producing student responses using AI and refining pseudo-labels through expert feedback has also been shown to enhance the transferability and cross-cultural reliability of scoring systems [15]. Ben Said et al. [34] and Mudallal et al. [35] applied clustering-based enhancements and pseudo-labeling strategies to predict student academic performance and identify nurse creativity, respectively—demonstrating the value of leveraging large volumes of unlabeled data in predictive modeling. However, in creativity research, the application of pseudo-labeling remains largely confined to single modalities, which limits the effectiveness of questionnaire-based assessment tools.

2.4. Machine Learning Research

In the domain of creativity classification and prediction, advances in machine learning have facilitated automated, objective, and large-scale processing. Existing research primarily focuses on two main approaches: traditional machine learning models and deep learning models.
Traditional machine learning algorithms—such as Random Forest (RF), XGBoost, Support Vector Machine (SVM), and LightGBM—are widely employed in educational and psychological research due to their robustness with small sample sizes and interpretability of feature importance. Ben Said et al. [34] reported that RF and XGBoost achieved superior accuracy and robustness in predicting undergraduate students’ academic performance and innovative abilities. Mudallal et al. [35] demonstrated that RF outperformed traditional linear models in predicting nurses’ creativity under multivariate conditions. Acar et al. [32] used SVM as a baseline model in the automated scoring of graphic creativity tasks, where it showed relatively stable performance. A study based on the Scientific Creativity Test (SCT) revealed that RF and GBDT models accurately predicted students’ creativity levels using semantic network parameters and blink duration, achieving over 90% prediction accuracy [33]. In addition, in evaluating image creativity using Scratch, the XGBoost model even outperformed inter-expert agreement in predicting creativity scores, offering a novel pathway toward the objectification of creativity assessment [36].
Researchers have also increasingly applied deep learning to automate the assessment of scientific creativity, marking a new direction in model-based scoring. Several studies have employed convolutional neural networks (CNNs) to predict scores in creative drawing tasks [2,32]. Beaty and Johnson [8] developed the SemDis platform, which measures divergent thinking through word vector distance calculations. Haase et al. [15] further introduced multilingual Large Language Models (LLMs) into the scoring process, establishing a new paradigm that integrates generative scoring with semantic comparison.
However, researchers have identified several critical limitations in the application of these models. Zhang et al. [10] found that a model trained on approximately 500 pairs of images performed well on training set styles but experienced a significant performance drop when encountering novel styles or open-ended images—demonstrating typical overfitting. Similarly, Patterson et al. [11] observed that, because training datasets are often composed of student artworks from educational settings with relatively homogenous content and styles, models exhibit poor performance when processing atypical drawings, resulting in biased creativity scoring. Cropley et al. [2] reported a marked performance gap in TCT-DP drawing task models between training and validation sets, underscoring the need to expand sample diversity through methods such as pseudo-labeling and data augmentation to improve robustness.
Mudallal et al. [35] applied Random Forest and XGBoost to model nurses’ creativity using only about 200 samples with high-dimensional feature variables. Their findings showed that complex models exhibited high variance and poor generalization under small-sample conditions, in some cases performing less stably than linear models.
In summary, although machine learning techniques have been employed in creativity research, most rely on single-modal data—such as structured questionnaires or image inputs—making it difficult to comprehensively capture children’s multimodal creative expressions that combine graphics and text. While data augmentation and semi-supervised learning have proven effective in fields like natural language processing and image recognition, their application in creativity prediction remains limited. Faced with challenges such as small sample sizes and heterogeneous data modalities, current methods suffer from limited transferability and generalization. To address these issues, this study proposes a multimodal learning framework that integrates data augmentation and pseudo-labeling, aiming to offer an efficient, scalable, and low-cost pathway for assessing scientific creativity.

3. Methodology

3.1. Data Preparation

The original data for this study were collected from students in grades 4 to 6 at a primary school in a city in eastern China. Two classes were randomly selected from each grade, with a total of 262 students participating in the test, but 2 cases were excluded because of missing information on parental education and parenting style, so the final analytic sample, therefore, comprised 260 students, including 129 boys, accounting for 49.6%.
Regarding parental education levels, 42.4% of fathers had a bachelor’s degree or above, 49.6% had education between high school and a bachelor’s degree (excluding bachelor’s), and 8.0% had education below high school; for mothers, 43.1% had a bachelor’s degree or above, 43.9% had education between high school and a bachelor’s degree (excluding bachelor’s), and 13.0% had education below high school.
The assessment tools used included the Scientific Creativity Test, Parental Rearing Style Questionnaire, Curiosity Measurement Questionnaire, and Creative Self-Efficacy Questionnaire. The group testing was conducted by master’s students in psychology, with a testing duration of 45 min. Before the test, detailed instructions were given, informing the participants that the results would only be used for research purposes and would be strictly kept confidential, and they were required to answer honestly. Questionnaires were collected on the spot after the test to ensure the scientificity and reliability of the data. The research framework of the study is shown in Figure 1.

3.2. Feature Engineering

The categorical features employed in this study can be grouped into four categories: (1) demographic characteristics, such as gender (male/female), grade level (4th–6th grade), and family socioeconomic status (scored on a 1–10 scale); (2) family education–related features, including parents’ highest educational attainment (primary school, secondary school, bachelor’s degree, or postgraduate and above); (3) questionnaire items measured on a Likert scale (5-point rating, discretized for analysis); and (4) categorical labels extracted from multimodal data, such as object categories identified from images and topic labels derived from textual content. All categorical features were transformed into numerical variables using one-hot encoding to ensure compatibility with the machine learning models.

3.3. Data Augmentation Strategies

The questionnaire in this study consists of three parts: psychological traits, basic information, and a scientific creativity test. These correspond to structured data and graphic–text data. Based on the characteristics of these two types of data, corresponding data augmentation strategies are designed to improve the performance of the scientific creativity scoring prediction model.

3.3.1. Data Augmentation for Structured Data

To address class imbalance in the Likert scale ratings, where extreme categories, e.g., ratings of 1 and 5, were underrepresented compared with mid-scale ratings, we applied SMOTE. An initial round generated approximately 1500 synthetic samples, followed by an additional oversampling step that increased the total to 2000. This ensured improved class balance while preserving data distribution characteristics. By interpolating between original samples, this method preserves the data distribution characteristics, avoids the risk of overfitting, and retains the original sample IDs for subsequent tracking and processing.
Furthermore, to enhance data diversity and the model’s robustness to rating fluctuations, small random noises within a range of ±0.1 are introduced based on the original ratings. This simulates the subjective variations in actual scoring, thereby improving the model’s generalization ability.

3.3.2. Data Augmentation for Image and Text

In the scientific creativity questionnaire section, researchers designed three open-ended questions, requiring students to list as many relevant ideas as possible within 8 min. Examples of the questions include: “If you could travel to space by spaceship and orbit a certain planet, what scientific questions would you plan to study?” and “Please design the bicycle in the following picture to make it more practical and aesthetically pleasing.” Although the original requirement was to answer in words, primary school students often express themselves through a combination of graphics and text. Therefore, this study constructed a graphic–text multimodal dataset and proposed a set of graphic–text linkage enhancement methods to improve the model’s ability to process graphic–text inputs.
The specific methods are as follows:
  • Definition of original data: Based on bicycle patterns drawn with lines, students could create drawings or add text annotations on them, generating original samples with a mixture of graphics and text.
  • Graphic–text linkage augmentation strategies: Image augmentation, using OpenCV (V 4.10.0) and Albumentations (V 2.0.8) libraries; geometric transformations (e.g., rotation, scaling, translation); brightness adjustment; and noise addition were applied to generate diversified image samples.
  • Each augmented version was assigned a unique image augmentation ID (e.g., rotate_15, scale_1.1) to track the transformation process. Paddle OCR was used to extract handwritten text from the images. To address the difficulty in recognizing Chinese handwritten characters, augmentation strategies were introduced, including synonym replacement, sentence pattern rewriting, and simulation of typos (e.g., “fire-spouting port” → “jet port”). Each augmented text was assigned a unique text augmentation ID (e.g., synonym_1, ocrerror_1), which was paired with the image augmentation ID to ensure consistency between graphics and text.
  • A random sample of augmented data was selected, and its rationality and validity were verified through manual evaluation to ensure that the data quality was suitable for subsequent model training.
  • To ensure the one-to-one correspondence of augmented graphic–text data, facilitate model input, and enable subsequent analysis, a hierarchical numbering system was constructed. The numbering format is as follows: Original ID_Image Augmentation ID_Text Augmentation ID, for example, Bike_001_rotate_15_synonym_1. In addition, a structured table was established to record the numbering mapping relationship of each sample, with fields including the following: Number, Original ID, Image Path, Text Content, Image Augmentation Parameters, and Text Augmentation Method (see Table 1).

3.4. Semi-Supervised Learning: Pseudo-Label Generation and Model Training Process

This paper adopts pseudo-labeling as the semi-supervised learning method, which includes the setup of the initial dataset, the generation of pseudo-labels, and the verification of dataset quality. Table 2 presents the results of the data processing.

3.4.1. Initial Manual Labels

To improve the efficiency of the model in utilizing unlabeled data, this paper designs pseudo-label generation mechanisms for image and text data:
-
Image pseudo-labels: The YOLOv8 model is used to train a component detection model, which is combined with a classifier trained on initially labeled data to predict unlabeled images. Samples with a class confidence score, θ, greater than 0.5 in the prediction results are selected and assigned pseudo-labels.
-
Text pseudo-labels: First, a BERT classifier is trained using manually labeled texts, which is then used to predict unlabeled samples. Results with a confidence score higher than the threshold θ (set to 0.6) are included in the pseudo-label set and, together with the original labeled data, form a new training set to update the model parameters. The thresholds were determined by a grid search on the validation set (θ ∈ {0.3, 0.4, …, 0.8}). The values θ_image = 0.5 and θ_text = 0.6 yielded the highest F1-scores for the image and text tasks, respectively.

3.4.2. Pseudo-Label

Pseudo-label generation uses iterative training, with the model updated via the latest training set in each iteration. The maximum iterations are set to 5, and the process stops early if new pseudo-labels in the current iteration do not exceed the previous ones. Algorithm 1 shows this framework.
Algorithm 1: Pseudo-label generation for semi-supervised learning
Data:   D_  l = labelled dataset(image/text)
          D_  u = unlabelled dataset (image/text)
            θ = confidence threshold # θ_image=0.5, θ_text=0.6
T =task-specific module (image/text)
 Result: D_  l = final enlarged training set
               M   = trained model
  1 Initialize model M
  2 while not terminate do:
  3 M = Train(T, D_l) # Train model using task-specific module
  4 P = Inference(T, M, D_u) # Generate pseudo-labels
  5 for x in D_u do:
  6 if conf(x, P) > θ then:
7       D_l = D_l ∪ {x, P(x)} # Add pseudo-labels to training set
8    end if
9    end for
10 terminate = CheckConvergence(M)
11 end while
12 return D_l, M

3.5. Semi-Supervised Automated Calculation of Scientific Creativity

This study adopts the SSCM (Scientific and Technical Creativity Measurement) scoring rules proposed by Hu Weiping [3] to evaluate scientific creativity, and on this basis, combines semantic clustering and frequency calculation to construct an automated quantification method. This method has been validated as effective in multiple studies on automatic scoring of scientific creativity [6,8]. The specific steps are as follows:
  • Label extraction and deduplication: Conceptual labels from both images and texts in each student’s response are extracted and merged into a label set (L_s = {t1, t2, …, tn}). If the same label appears repeatedly in both the image and text, only one instance is retained to avoid redundant calculations.
  • Semantic clustering and dimensional score calculation:
  • Fluency is measured by the total number of labels. It is defined as follows:
Fluency(s) = ∣Ls∣
  • Flexibility is measured by the number of label categories, and its calculation method is as follows:
Flexibility(s) = ∣Cluster Set(Ls)∣
  • Originality is scored based on the frequency of labels appearing in all samples: if the frequency is less than 5%, the label receives 2 points; if the frequency is less than 10%, it receives 1 point; otherwise, it receives 0 points. The originality score of each sample is the sum of the scores of all labels in its label set:
O r i g i n a l i t y ( s ) = t L S S c o r e ( t )
Scores for all three dimensions were standardized using Z-scores and then combined to form the total score of scientific creativity. The scoring results of all samples were stored in an Excel spreadsheet, which includes sample numbers, graphic–text label sets, and scores for the three dimensions, facilitating subsequent statistical analysis, modeling, and visualization. To verify the reliability of automatic scoring, 150 manually labeled samples were selected to calculate the internal consistency of scores for the three dimensions of “fluency,” “flexibility,” and “originality.” Cronbach’s Alpha coefficient was 0.84, indicating good consistency among the scoring dimensions.

3.6. Predictive Models of Scientific Creativity

3.6.1. Machine Learning Models

This study aims to predict primary school students’ scientific creativity levels, which are categorized into high and low groups based on the composite score of fluency, flexibility, and originality. The predictive features include individual curiosity, creative self-efficacy, and parental education. To model and compare performance, four mainstream machine learning algorithms—Multilayer Perceptron (MLP), Random Forest (RF), XGBoost, and LightGBM—were applied to the graphic–text augmented datasets. These models have been widely applied in education and psychometrics research and have demonstrated favorable performance [10,35]. They represent two mainstream paradigms—ensemble learning and deep learning—making them suitable for training with small- to medium-scale datasets. Moreover, they provide interpretable baseline results while capturing complex nonlinear patterns, thereby ensuring the robustness and reliability of the experimental outcomes.
Multilayer Perceptron (MLP) is a typical feedforward neural network consisting of an input layer, one or more hidden layers, and an output layer. It learns complex relationships between nonlinear features through backpropagation algorithms and is suitable for modeling multidimensional structured data [37].
Random Forest (RF) is an ensemble learning method that constructs multiple decision trees based on bootstrap sampling and random feature selection. By combining these weak classifiers through a majority voting mechanism, RF enhances prediction stability and accuracy, with strong robustness against overfitting and interpretable feature importance [38].
XGBoost (Extreme Gradient Boosting): XGBoost is an efficient gradient-boosting algorithm that sequentially builds decision trees to minimize the loss function. It integrates optimization strategies such as regularization, parallel computing, and effective handling of missing values, thereby improving both training efficiency and predictive accuracy [39].
LightGBM is a lightweight gradient-boosting framework that employs histogram-based decision tree learning and a leaf-wise growth strategy, which significantly accelerates training speed and reduces memory consumption. In addition, it incorporates Gradient-Based One-Side Sampling (GOSS) and Exclusive Feature Bundling (EFB) to further optimize model performance [40].

3.6.2. Model Training Procedure

A strict data partitioning strategy was applied to prevent data leakage. Specifically, the entire dataset was first stratified into a training set (80%) and an independent test set (20%), with the random seed fixed at random_state = 42 for reproducibility. Only the training set contained augmented and pseudo-labeled samples, which were further used for 5-fold stratified cross-validation in hyperparameter tuning and model selection. After optimal hyperparameters were obtained, the models were retrained on the full training set (including augmented and pseudo-labeled data) and subsequently evaluated on the independent test set. Importantly, the test set contained only original human-labeled samples and was never exposed to augmented or pseudo-labeled data throughout the training process.
To ensure fair comparison across models, hyperparameter tuning was performed using GridSearchCV with 5-fold stratified cross-validation, optimizing for the F1-score. For each model, a parameter grid was designed to balance tuning effectiveness and computational efficiency (e.g., number of trees and maximum depth for Random Forest; hidden layer size and learning rate for MLP; and learning rate, number of estimators, and subsampling rate for XGBoost and LightGBM). The optimal configuration was determined by selecting the parameter set that achieved the highest mean F1-score in cross-validation. Detailed parameter grids are provided in Appendix A.

3.6.3. Performance Metrics of Machine Learning Models

To evaluate the effectiveness of models in classification tasks, metrics such as accuracy, precision, recall, and F1-score can be used to measure machine learning models [26]. These metrics are calculated based on a confusion matrix consisting of true positives (TPs), true negatives (TNs), false positives (FPs), and false negatives (FNs). Each metric reflects model performance from a different perspective:
  • Accuracy: This is a reliable metric when the class distribution is balanced, but may be misleading in cases of class imbalance. The calculation formula is as follows:
A c c u r a c y = T P + T N T P + T N + F P + F N
  • Precision: A high precision indicates that the model can effectively avoid misclassifying negative samples as positive, but it fails to reflect the model’s ability to identify all positive samples. The calculation method is as follows:
P r e c i s i o n = T P T P + F P
  • Recall: This quantifies the accuracy with which the model correctly identifies all actual positive samples. The calculation formula is as follows:
Re c a l l = T P T P + F N
  • F1-score: This is calculated as the harmonic mean of precision and recall, as follows:
F 1 = 2 × Pr e c s i o n × r e c a l l Pr e c s i o n + r e c a l l

4. Results

4.1. Data Augmentation

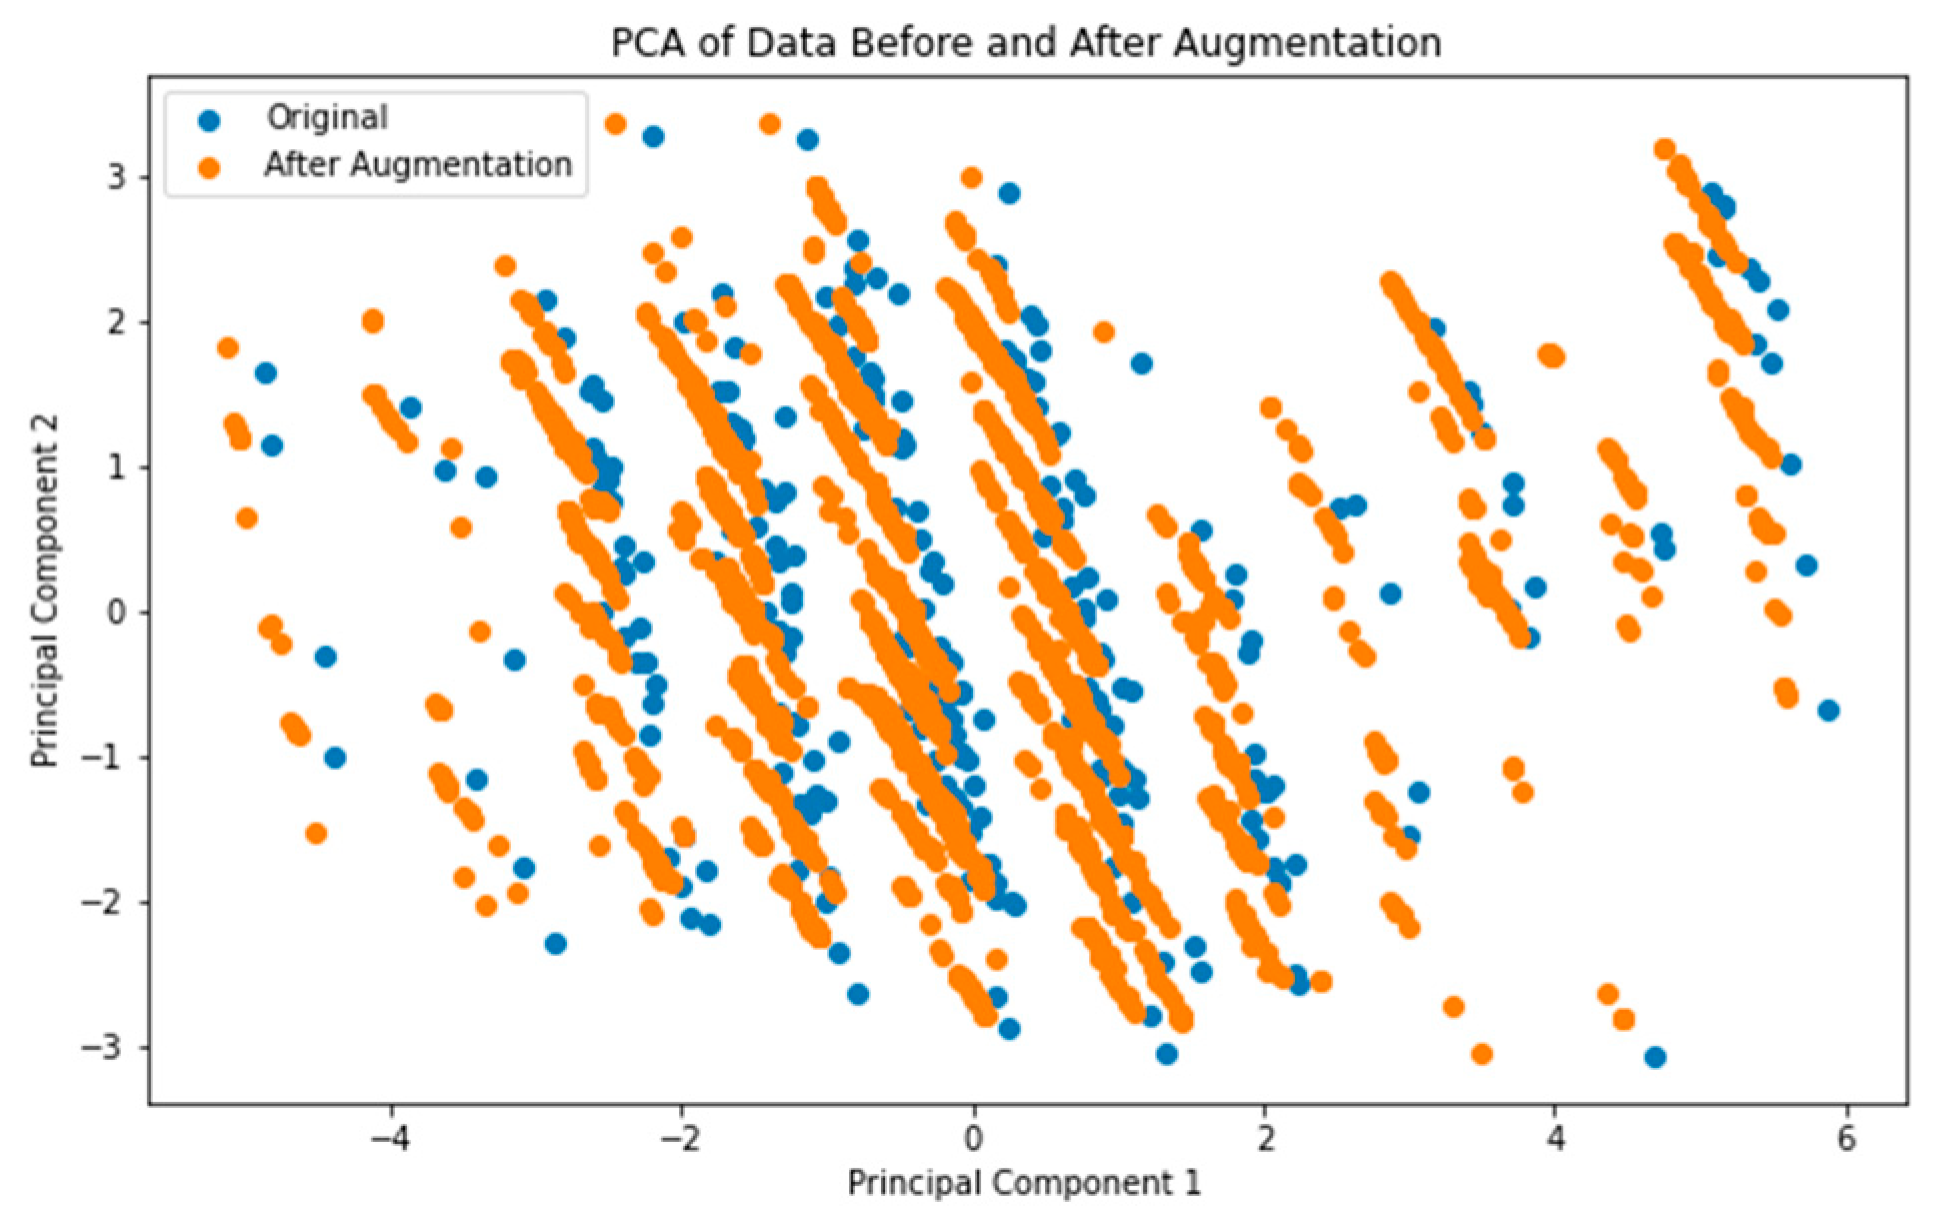
The structured questionnaire data encompass multiple variables, including curiosity, creative self-efficacy, three types of parental rearing behaviors, family economic status, and parental education level. To assess the impact of data augmentation, this study employs Principal Component Analysis (PCA) to visualize the data before augmentation (in blue) and after augmentation (in orange).
As shown in Figure 2, the augmented data in the principal component space exhibit an overall distribution highly consistent with that of the original data. The orange samples are primarily located near the dense regions of the blue samples, indicating that data augmentation effectively preserves the structural characteristics of the original data. Additionally, some augmented data are distributed along the peripheries at both ends of the principal component axes, thereby expanding the coverage of the original data and contributing to improved model generalization.

4.2. Pseudo-Labels

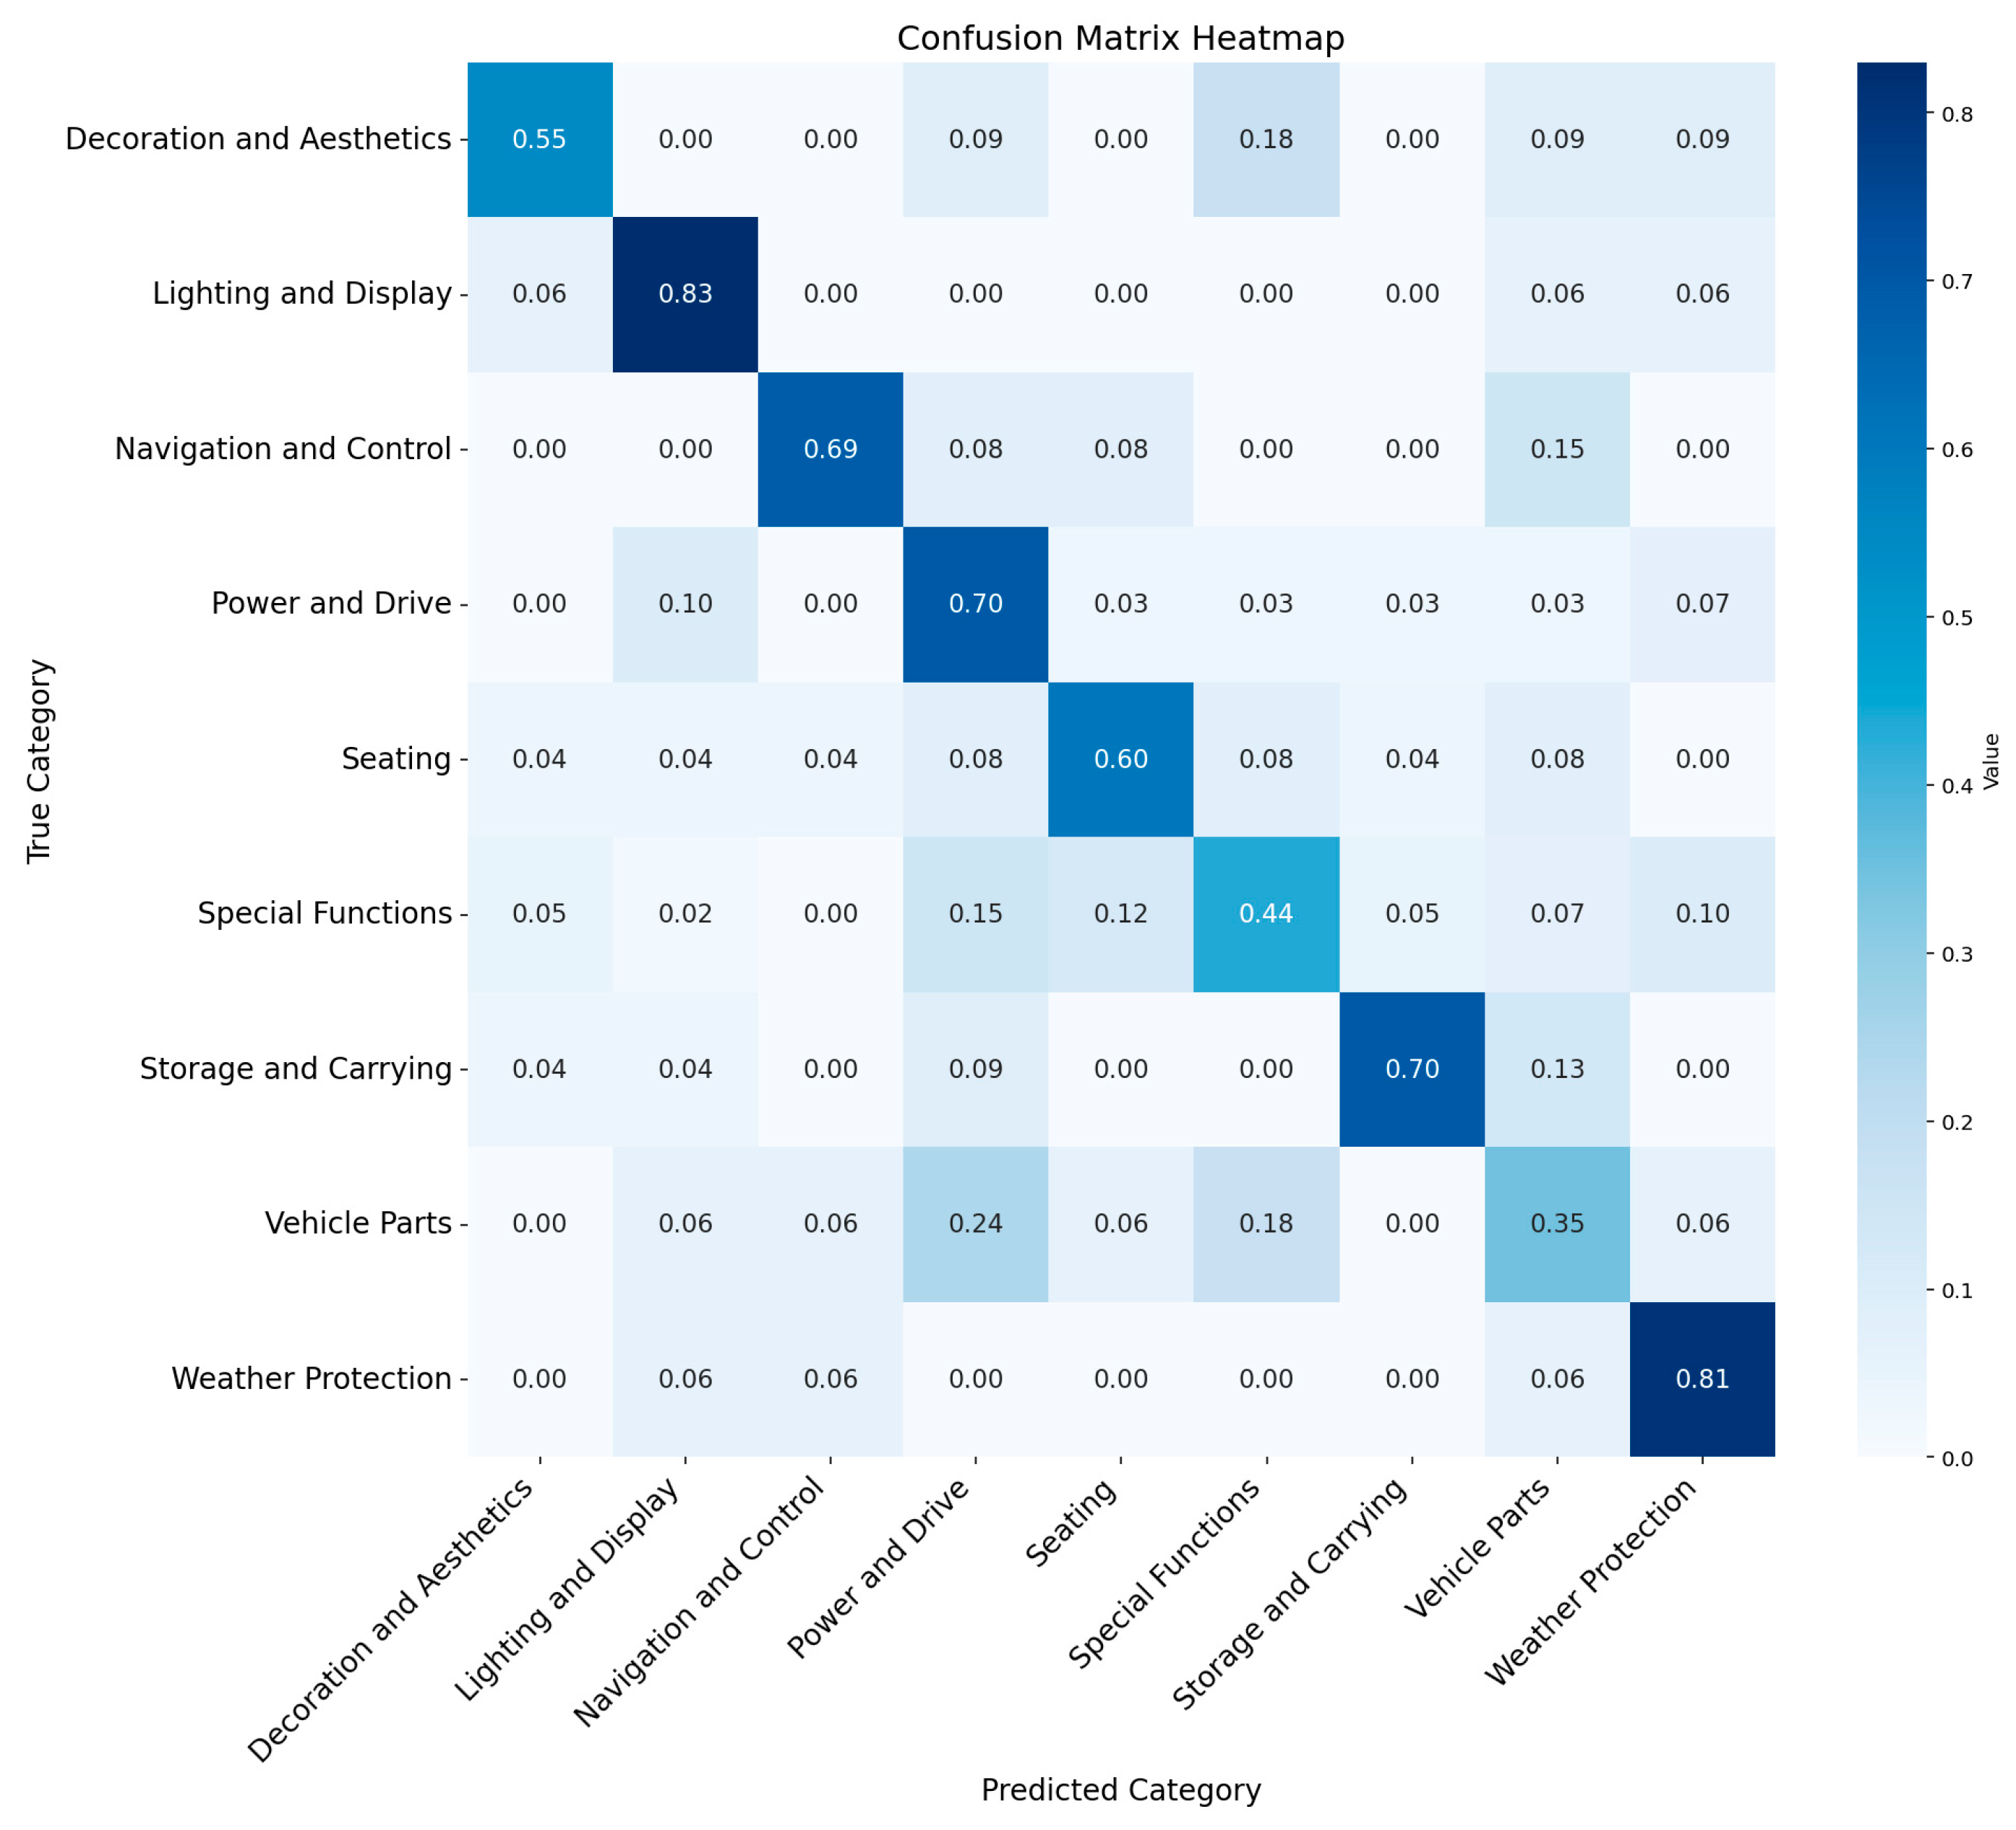
To assess the consistency between manual annotations and pseudo-labels, this study uses bicycle design as an example. Figure 3 presents a confusion matrix heatmap illustrating the model’s performance across ten image label categories. The results show that the model achieves high accuracy in categories such as lighting and display (0.83), Weather protection (0.81), power and drive (0.70), and storage and carrying (0.70), demonstrating a strong ability to recognize categories with distinct features. In contrast, accuracy is notably lower for categories such as Special Functions (0.44) and Vehicle Parts (0.35), with substantial confusion arising primarily from misclassification into semantically similar or ambiguously defined categories.

4.3. Data Augmentation and Pseudo-Labels

Figure 4 presents hybrid violin–box plots illustrating the distributions of fluency, flexibility, and originality across three data types (original, augmented, and augmented + pseudo-label).
Compared with the original dataset, both augmentation and pseudo-labeling expand the distribution range of all three dimensions while maintaining symmetry. Augmentation shows a stronger effect on fluency and originality, whereas pseudo-labeling more substantially broadens flexibility.
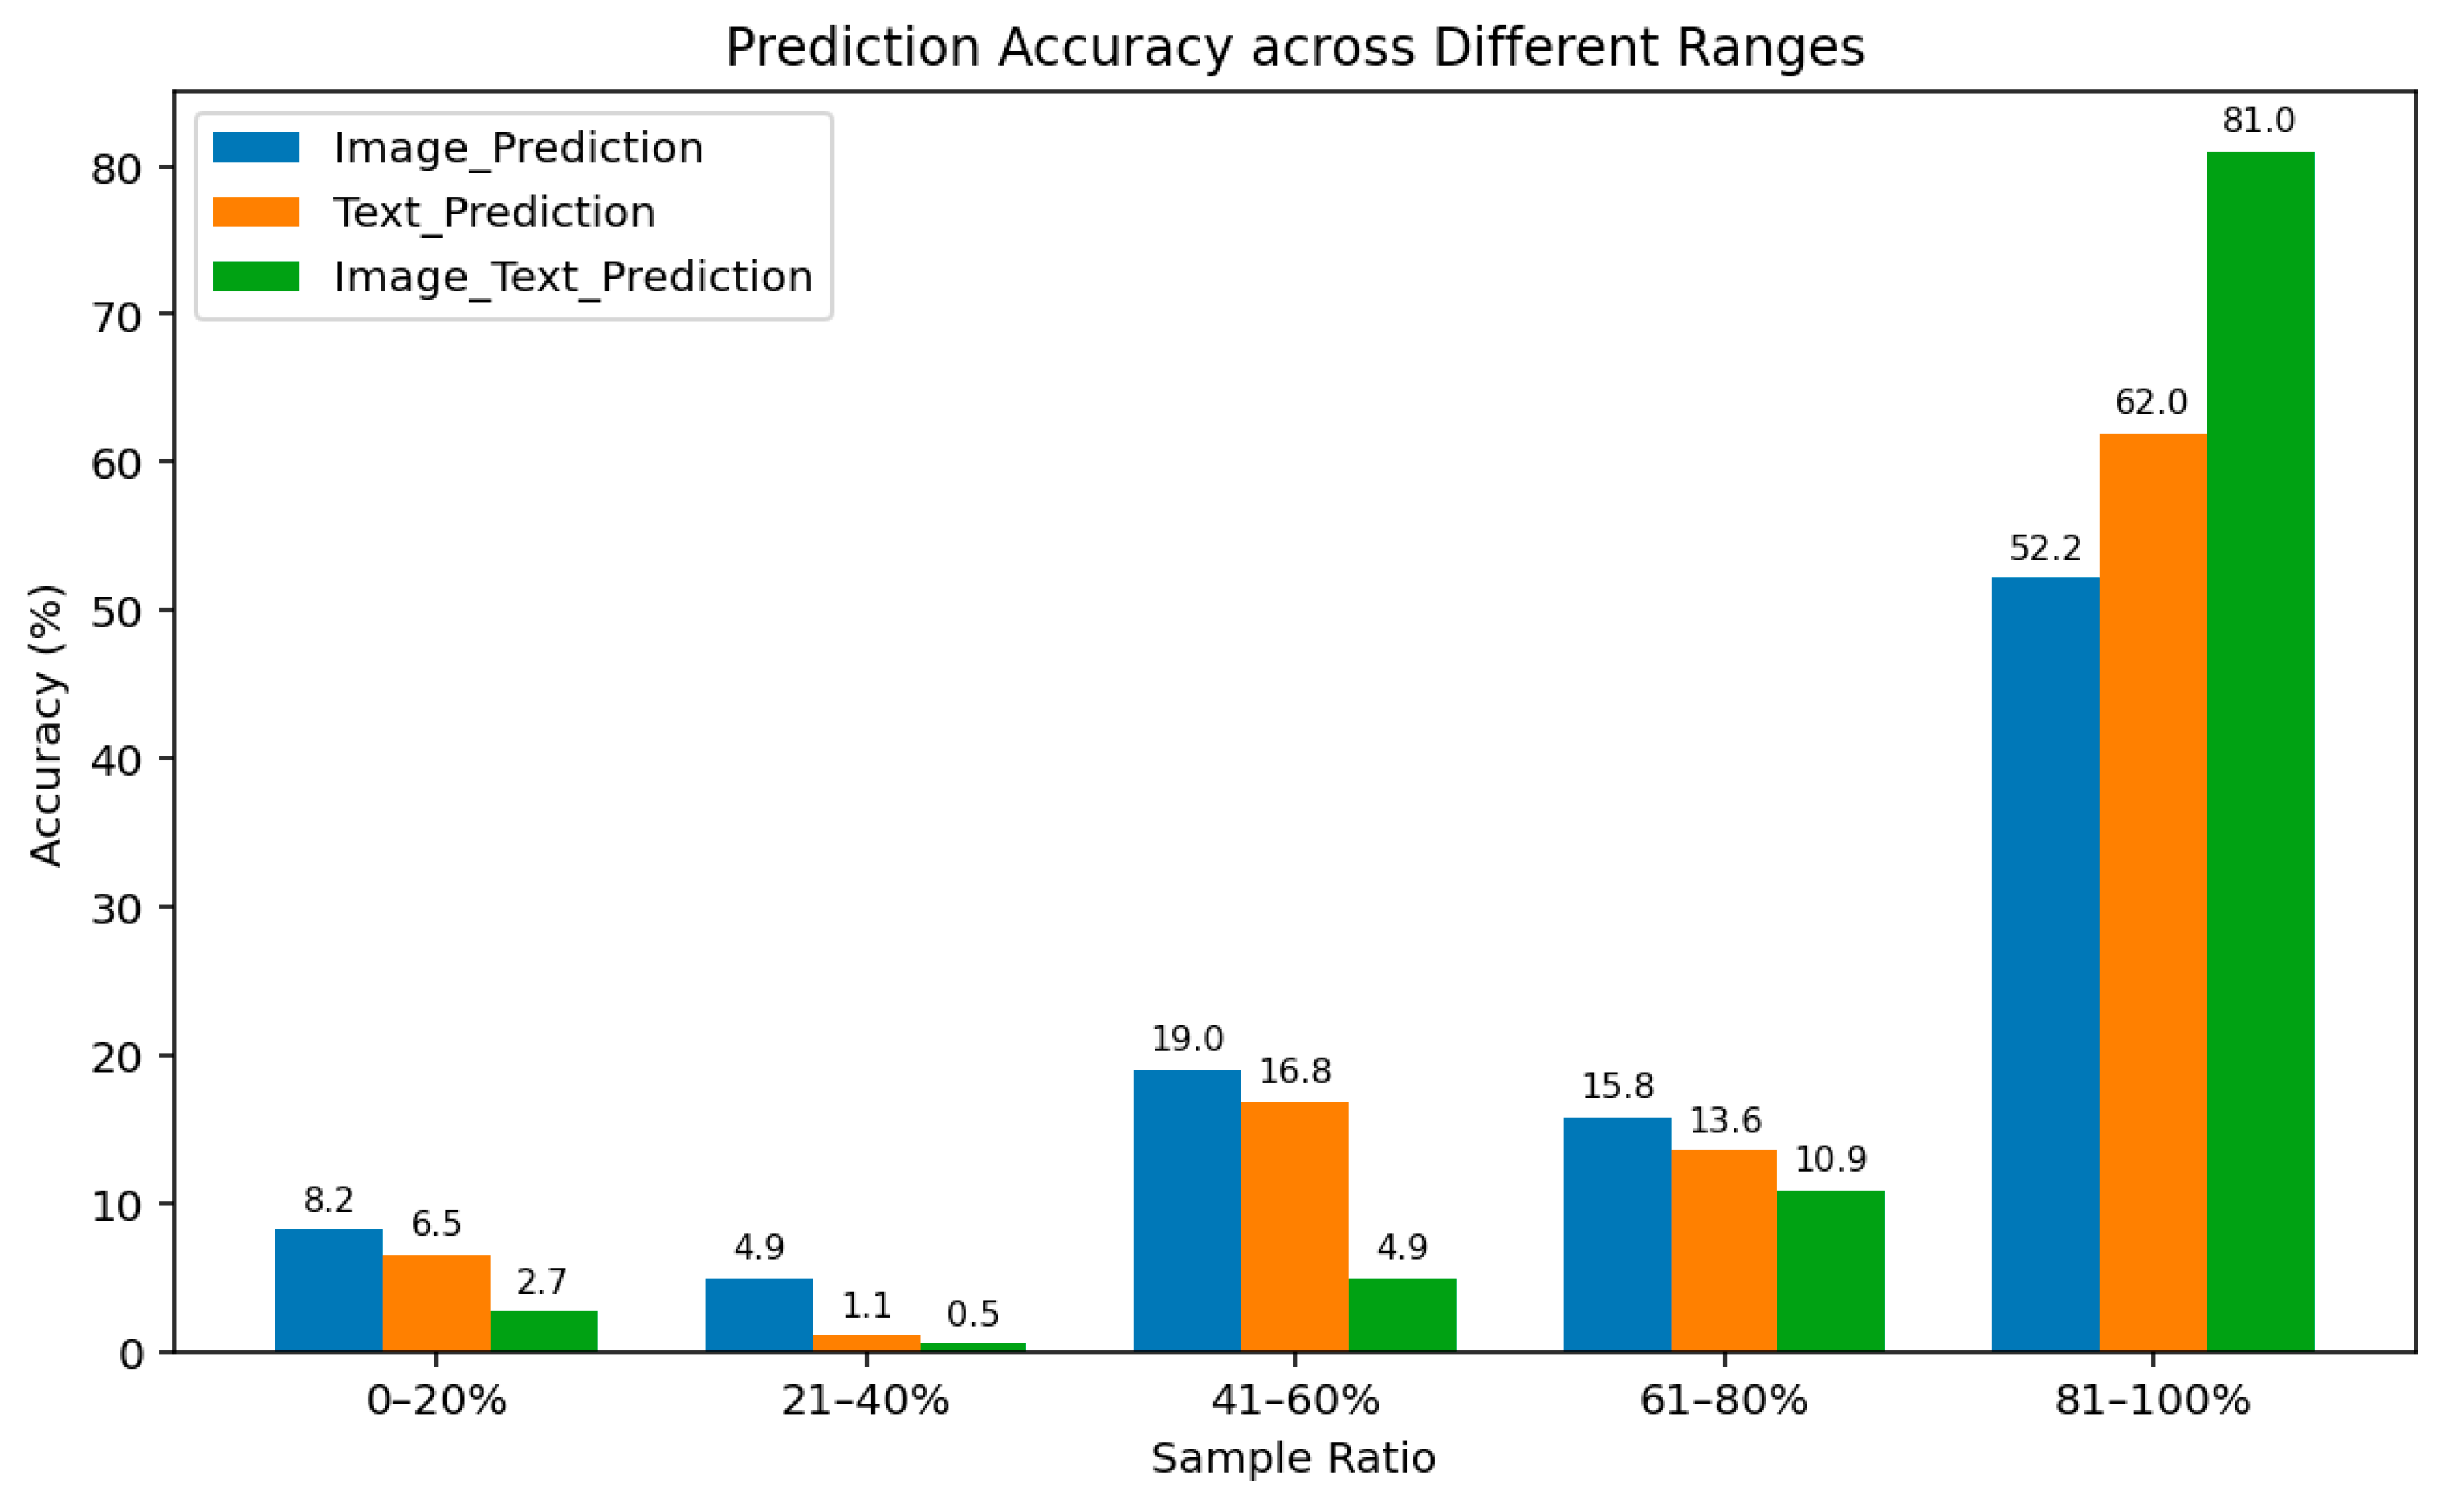
As shown in Figure 5, multimodal alignment demonstrates superior accuracy (81.0%) compared to unimodal image-based prediction (52.2%) and text-based prediction (62.0%). The proportion of low-accuracy samples (0–40%) is also lowest in the multimodal setting (3.2%), indicating greater robustness and stability.

4.4. Machine Learning

This paper evaluates the performance of four machine learning models-Random Forest, MLP, XGBoost, and LightGBM-combined with three data processing methods: original, augmentation, and pseudo-labeling. As shown in Table 3, both data augmentation and pseudo-labeling significantly enhance classification performance.
Data augmentation effectively increases sample diversity and improves the generalization ability of the models. For example, in the LightGBM model, the F1-score rises from 0.83 to 0.92, and the AUC-ROC increases from 0.79 to 0.91. The pseudo-labeling method, which utilizes information from unlabeled data, demonstrates even greater performance gains, particularly in the LightGBM and XGBoost models. Specifically, for LightGBM, pseudo-labeling raises the F1-score to 0.91 and the AUC-ROC to 0.85.
Overall, LightGBM and XGBoost outperform Random Forest and MLP. When combined with pseudo-labeling, LightGBM achieves the highest F1-score (0.91). Although MLP and Random Forest perform relatively poorly on the original data, their performance is substantially improved through data augmentation and pseudo-labeling.

4.5. Importance of Model Features

In educational prediction and creativity classification tasks, XGBoost is recognized as an efficient tool, offering stable performance and strong interpretability of results [34]. Accordingly, XGBoost is employed to analyze feature importance.
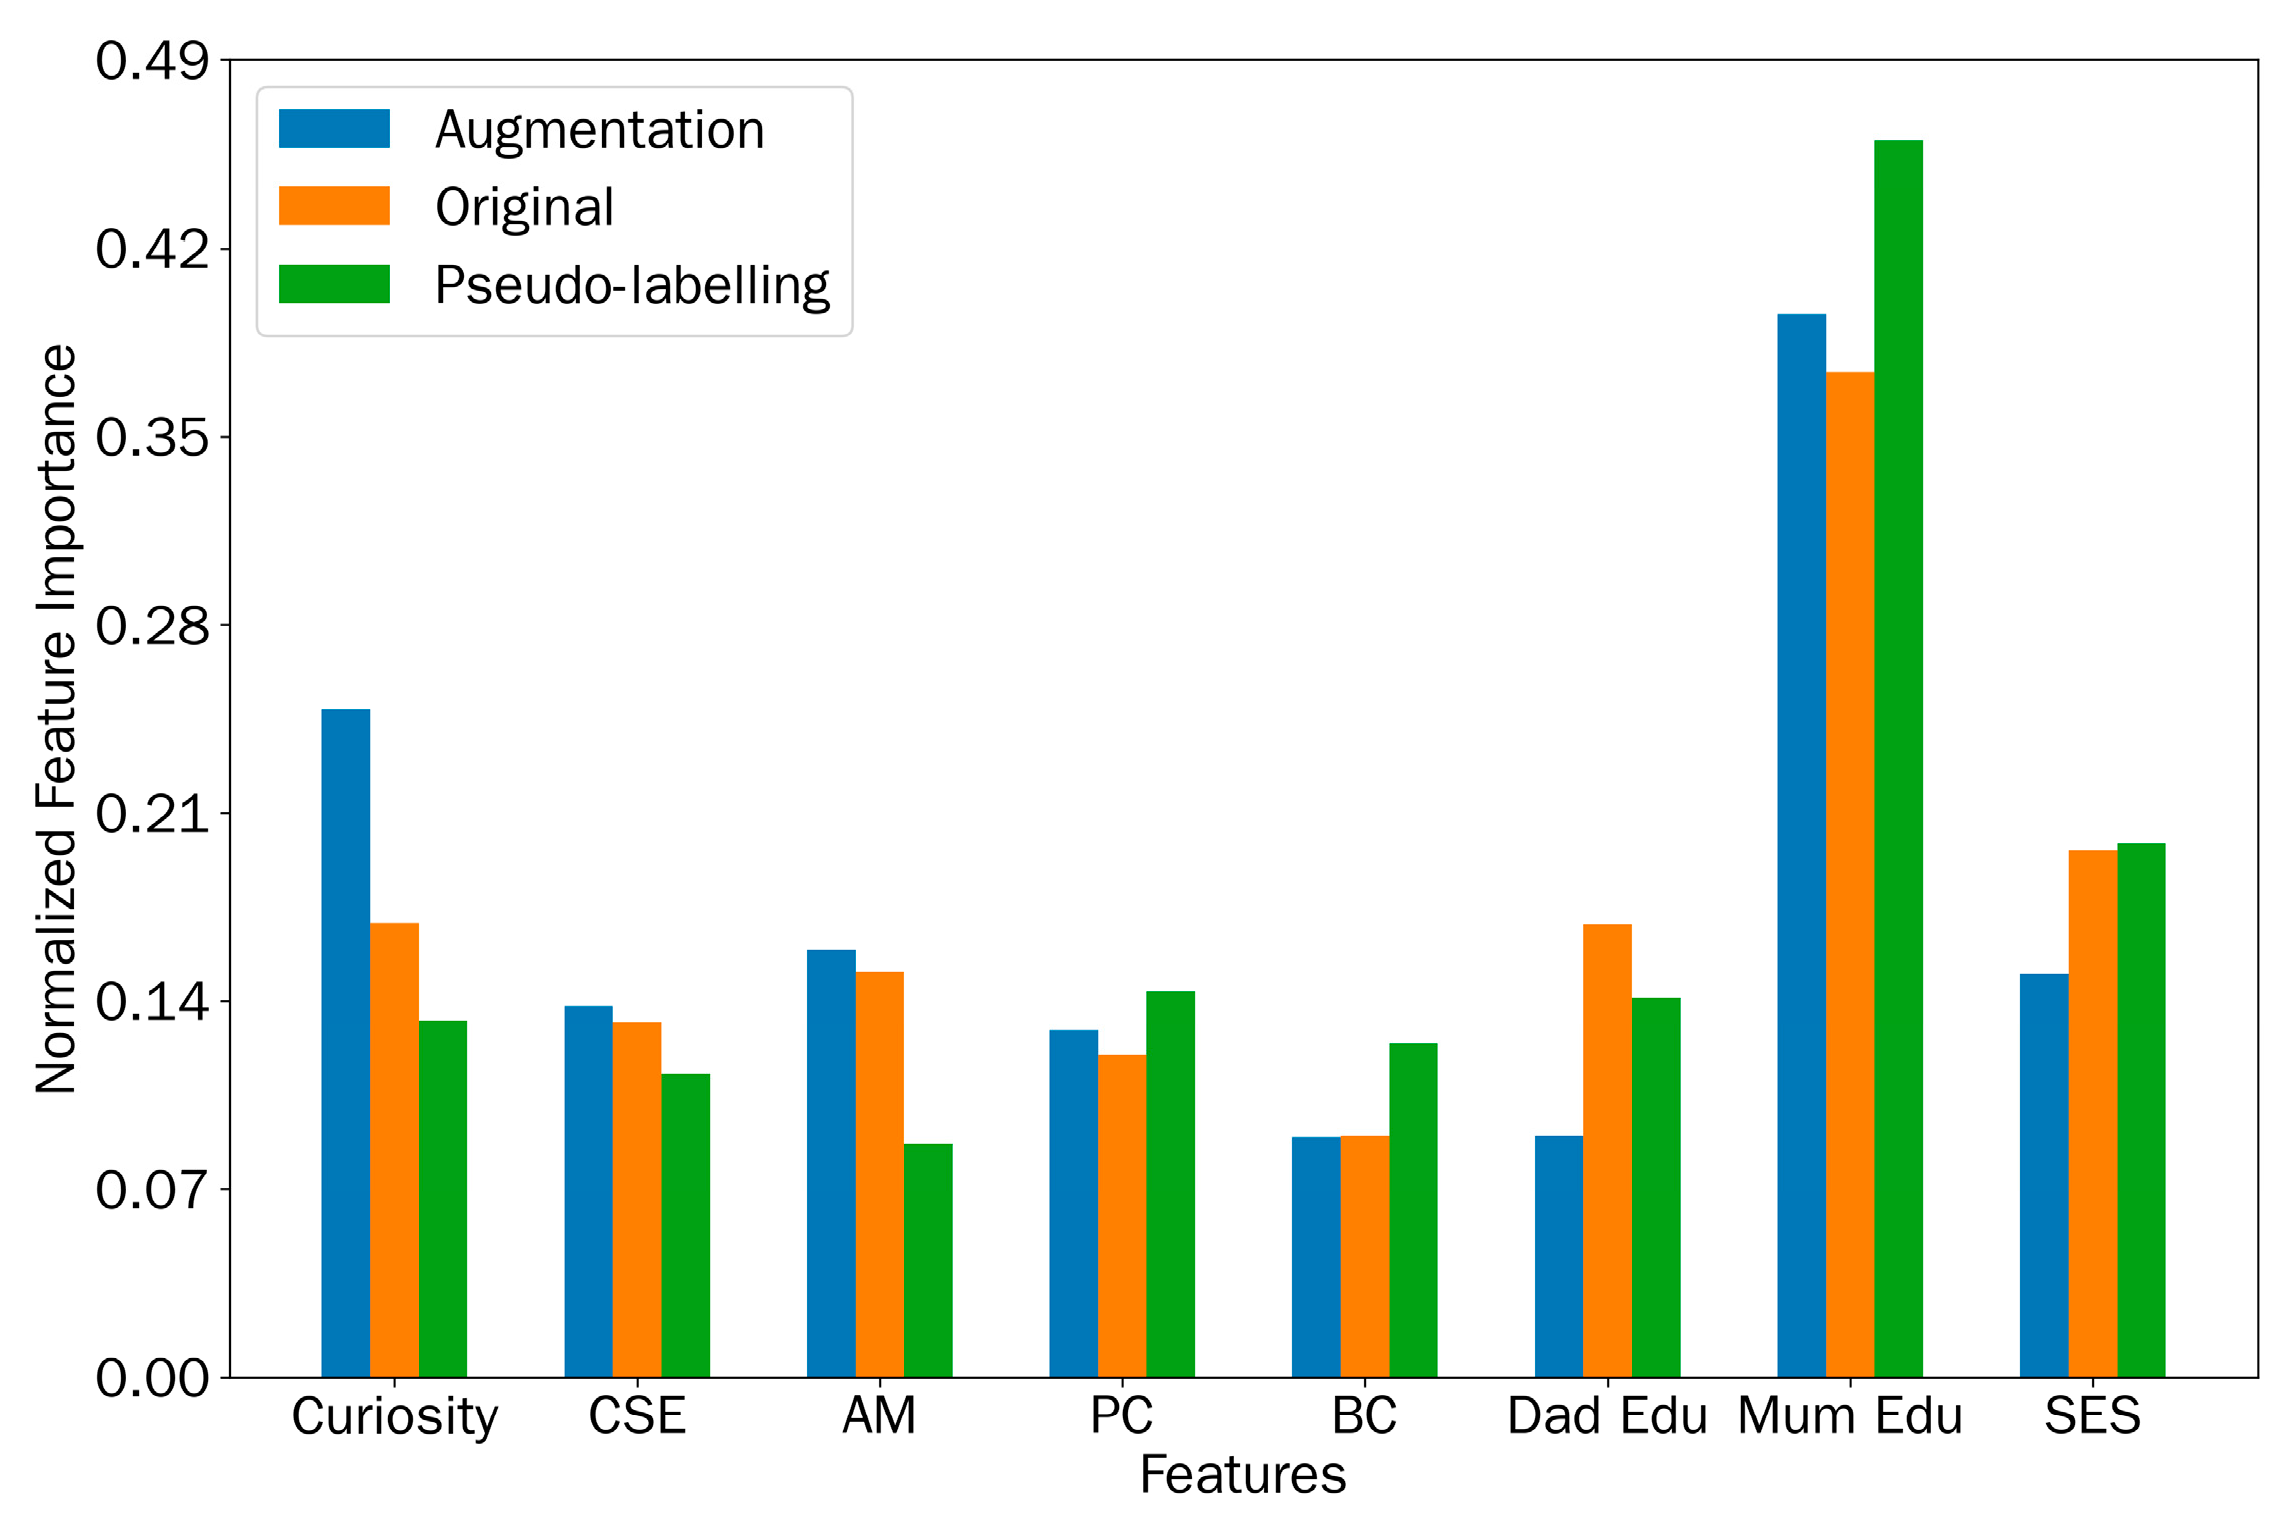
Figure 6 illustrates the distribution of feature importance for psychological and family variables across three training strategies. The horizontal axis represents the input variables under different data processing strategies, while the vertical axis indicates the normalized importance values of each feature.
In the model trained on the original data, mother’s education level exhibits the highest importance (~0.37), followed by SES, Dad education, and curiosity, whereas BC contributes minimally. With augmented data, curiosity emerges as the most influential factor (~0.19), while AM also gains weight, and mother’s education remains substantial though slightly reduced. After incorporating pseudo-labeled data, mother’s education increases sharply in importance (>0.45), surpassing all other features. At the same time, SES and BC rise modestly, while AM, CSE, and curiosity decline. These results indicate that family background variables—particularly mother’s education—play a dominant role, especially in semi-supervised settings.

4.6. Analysis of the Relationship Between Questionnaire Dimensions and Creativity Classifications

Figure 7 depicts the distribution of various variables between the high-creativity group (“H”) and the low-creativity group (“L”). The box plots reveal that several variables display significant differences in median or overall distribution between the two groups, as detailed in the following analysis.
For psychological variables, the H group exhibits higher scores in curiosity and creative self-efficacy compared to the L group. Differences in autonomy support and psychological control are minimal, while behavioral control is slightly higher in the H group.
Concerning family background, parental education levels are generally higher in the H group, whereas SES distributions are similar, with the L group showing more low-value outliers.
In summary, students in the high-creativity group demonstrate superior psychological traits and more advantageous family environments.

5. Discussion

Scientific creativity is a core component of overall creativity [41] and a key objective in science and innovation education [42]. Traditional assessments, such as the Consensual Assessment Technique (CAT), rely on manual scoring but suffer from subjectivity, time intensity, and cognitive bias. To address these issues, recent studies have introduced machine learning to automate the prediction and classification of scientific creativity. However, machine learning models are vulnerable to overfitting under small-sample conditions, and expanding datasets is often costly and time-consuming. Therefore, developing strategies such as data augmentation to alleviate the “small sample size” problem has become a pressing research priority, yet its application in scientific creativity assessment remains largely unexplored.

5.1. Data Augmentation and Pseudo-Label

This study introduces two strategies—data augmentation and pseudo-label generation—to address the challenges of data expansion and label scarcity. The results confirmed their effectiveness in enhancing model robustness. For structured questionnaire data, the SMOTE algorithm generates additional samples by interpolating minority-class data points, yielding a more uniform distribution and extending coverage to edge regions absent in the original dataset. This increases sample diversity and significantly improves generalization compared with relying solely on original data, consistent with findings in market survey research [43].
In image–text data, maintaining multimodal alignment during augmentation proves essential. Proper alignment preserves label accuracy and prevents erroneous cross-modal mapping. Compared with unimodal inputs, multimodal fusion produces richer and more reliable representations, leading to higher predictive accuracy. This pattern aligns with cognitive and educational practices: primary school students often combine drawings and words to express open-ended ideas, reflecting the natural integration of visual and linguistic modalities in creative expression [44]. Prior studies also demonstrate that unimodal recognition is inherently limited, whereas deep multimodal fusion achieves more efficient modeling and precise prediction [10,15].
Compared with manual annotation, pseudo-labeling and multimodal alignment provide notable advantages in efficiency, consistency, and scalability. These algorithm-driven strategies reduce the cost and subjectivity of human scoring while ensuring greater objectivity and reproducibility in large-scale assessments. Moreover, by integrating technical advances with insights from cognitive theory, multimodal fusion not only enhances predictive performance but also offers a more authentic and scalable framework for evaluating scientific creativity.

5.2. Performance Analysis of the Scientific Creativity Model

The results show that data augmentation and pseudo-labeling strategies significantly enhance classification performance; each has its advantages and complements the other.
Data augmentation expands the sample distribution, enhancing the model’s ability to capture semantic boundaries and generalization. As a result, it performs more stably on comprehensive metrics such as F1-score and AUC-ROC.
Pseudo-labeling supplements label information by utilizing high-confidence predictions, thereby improving the model’s capacity to identify potential positives, which leads to greater advantages in recall.
When combined, these approaches can balance generalization and recall. In practical applications, the choice can be flexibly made based on task goals: if stability and overall performance are prioritized, data augmentation should be favored; if coverage and sensitivity are more critical, pseudo-labeling is more applicable.
In summary, the experimental results validate the effectiveness and complementarity of these two strategies in predicting scientific creativity. They demonstrate that, under conditions of moderate sample sizes, the rational use of data augmentation and pseudo-labeling can not only alleviate data scarcity issues but also enhance the accuracy and robustness of predictive models.

5.3. Feature Importance

Across all strategies, mother’s education consistently stands out as the strongest predictor of scientific creativity, underscoring the enduring impact of family educational background in shaping students’ creative potential. This stability contrasts with curiosity and SES, whose influence is more sensitive to data processing strategies—becoming particularly salient under data augmentation.
The pseudo-labeling strategy further amplifies the contribution of family-related variables, suggesting that in semi-supervised environments, models rely more heavily on stable background information to generalize predictions. This shift highlights how different learning strategies alter the model’s focus: augmentation enhances the role of individual traits such as curiosity, whereas pseudo-labeling strengthens the weight of structural family factors.
Taken together, these findings suggest a dual pathway in predicting scientific creativity: curiosity-driven mechanisms reflecting individual cognitive engagement and family background factors offering stable structural support. For educational practice, this implies that both fostering students’ intrinsic curiosity and considering family educational resources are essential for cultivating scientific creativity.

5.4. Performance of High and Low Scientific Creativity

High-creativity students display greater curiosity and creative self-efficacy, reflecting stronger exploration motivation and confidence in their creative abilities, which supports active engagement in creative tasks [22,45].
In the dimension of parental parenting styles, two groups are similar for autonomy support and psychological control, suggesting that these dimensions do not have a significant impact on scientific creativity. This may be attributed to the fact that primary school children possess immature self-regulation mechanisms and insufficient differentiation of autonomy needs [46]. However, behavioral control appears beneficial, providing structure and cognitive scaffolding that enhances problem-solving skills [47].
Family background, particularly parental education, consistently influences scientific creativity, suggesting that enriched educational resources facilitate the development of creative potential. SES, although similar in median, indicates that low-support environments may hinder creativity in some students.
At the primary school stage, emphasis should be placed on cultivating curiosity and self-efficacy, as well as creating a supportive family and social environment to provide optimal conditions for the development of scientific creativity. These findings support the perspective that the interaction of internal and external factors jointly influences the development of scientific creativity [17]

6. Conclusions

This study proposes a semi-supervised learning framework that integrates data augmentation and confidence-driven pseudo-labeling to improve model learning capacity and generalization performance in small-sample scenarios. The main conclusions are as follows:
  • SMOTE and EDA techniques effectively expand both questionnaire and image–text datasets, while the image–text alignment mechanism outperforms single modalities, confirming the advantages of multimodal fusion.
  • Consistent performance gains—particularly in precision and recall—were observed across four mainstream prediction models, suggesting that the proposed method has good adaptability in predicting scientific creativity.
  • Family environment, parental education level, and individual curiosity are identified as important predictors of scientific creativity, highlighting the interaction between internal and external factors.
Beyond methodological advances, the proposed automated system for scientific creativity assessment demonstrates significant societal and educational value. With its low cost, high efficiency, strong scalability, and reduced susceptibility to subjective bias, the system shows clear feasibility for large-scale application in schools. By providing educators and policymakers with reliable data, it supports evidence-based decision-making in curriculum design, teaching strategies, and talent development. Consequently, this framework not only advances research methodology but also contributes to building a systematic pathway for creativity education. To further enhance the generality and robustness of the proposed method, future research will aim to enlarge the dataset, diversify multimodal sources, and develop student-specific hand-drawn image detection models to improve robustness and accuracy.

Author Contributions

Conceptualization, X.Z.; methodology, C.L.; software, W.W.; validation, L.S.; formal analysis, G.Z.; investigation, C.L.; resources, L.S.; data curation, G.Z.; writing—original draft preparation, W.W.; writing—review and editing, X.Z.; supervision, X.Z.; project administration, C.L. All authors have read and agreed to the published version of the manuscript.

Funding

This work was supported by the National Social Science Foundation of China [BHA230119] and the Nationl Key R&D Program of China [2023YFC3341301].

Institutional Review Board Statement

Approval was obtained from the ethics committee of the Institute of Psychology, Chinese Academy of Sciences. The procedures used in this study adhere to the tenets of the Declaration of Helsinki [H250032025-02-25].

Informed Consent Statement

Informed consent was obtained from the participants included in the study.

Data Availability Statement

The datasets generated and analyzed during the current study are available from the corresponding author upon reasonable request.

Acknowledgments

We are grateful to Chan Aiping for investigative arrangements.

Conflicts of Interest

The authors declare no conflicts of interest.

Abbreviations

The following abbreviations are used in this manuscript:
AMAutonomy support
PCPsychological control
BCBehavioral control
CSECreative self-efficacy
SESSocioeconomic status
SMOTESynthetic Minority Oversampling Technique
EDAEasy Data Augmentation
TTCTTorrance Tests of Creative Thinking
C-SATCreative Scientific Ability Test
FSCTFigural Scientific Creativity Test
TCT-DPTest of Creative Thinking–Drawing Production

Appendix A

Table A1. Tuned parameters.
ModelTuned Parameters (Grid)
Random Forestn_estimators ∈ {100, 200}; max_depth ∈ {5, 10, None}
MLPhidden_layer_sizes ∈ {(64,), (64, 32)}; learning_rate_init ∈ {0.001, 0.01}; early_stopping=True
XGBoostn_estimators ∈ {100, 200}; learning_rate ∈ {0.05, 0.1}; subsample ∈ {0.8, 1.0}
LightGBMn_estimators ∈ {100, 200}; learning_rate ∈ {0.05, 0.1}; subsample ∈ {0.8, 1.0}
Table A2. Final hyperparameter settings of machine learning models.
ModelCore HyperparametersFinal Values
Random Forestn_estimators (number of trees)200
max_depth (tree depth)10
min_samples_split (min. samples to split)5
Multilayer Perceptronhidden_layer_sizes (hidden layer structure)(64, 32)
learning_rate_init (initial learning rate)0.01
batch_size32
max_iter (max iterations)300
XGBoostn_estimators (number of weak learners)200
max_depth5
learning_rate0.05
subsample (sampling rate)0.8
LightGBMn_estimators200
num_leaves63
learning_rate0.1
subsample0.8

References

  1. Ayas, M.B.; Sak, U. Objective measure of scientific creativity: Psychometric validity of the Creative Scientific Ability Test. Think. Skills Creat. 2014, 13, 195–205. [Google Scholar] [CrossRef]
  2. Cropley, D.H.; Theurer, C.; Mathijssen, A.C.S.; Marrone, R.L. Fit-for-purpose creativity assessment: Automatic scoring of the test of creative thinking—Drawing production (TCT-DP). Creat. Res. J. 2024, 1–16. [Google Scholar] [CrossRef]
  3. Lee, A.W.; Russ, S.W. Development of creativity in school-age children. In the Cambridge Handbook of Lifespan Development of Creativity; Russ, S.W., Hoffmann, J.D., Kaufman, J.C., Eds.; Cambridge University Press: Cambridge, UK, 2021; pp. 126–138. [Google Scholar] [CrossRef]
  4. Lubart, T.; Kharkhurin, A.V.; Corazza, G.E.; Besançon, M.; Yagolkovskiy, S.R.; Sak, U. Creative potential in science: Conceptual and measurement issues. Front. Psychol. 2022, 13, 750224. [Google Scholar] [CrossRef] [PubMed]
  5. Hu, W.; Adey, P. A scientific creativity test for secondary school students. Int. J. Sci. Educ. 2002, 24, 389–403. [Google Scholar] [CrossRef]
  6. Cai, Q.; Xiong, J.; Luo, L.; Zhang, J. The influence of classroom teaching strategies on middle school students’ scientific creativity. Educ. Meas. Eval. 2021, 2, 43–49. [Google Scholar]
  7. Ismayilzada, M.; Paul, D.; Bosselut, A.; van der Plas, L. Creativity in ai: Progresses and challenges. arXiv 2024, arXiv:2410.17218. [Google Scholar] [CrossRef]
  8. Beaty, R.E.; Johnson, D.R. Automating creativity assessment with SemDis: An open platform for computing semantic distance. Behav. Res. Methods 2021, 53, 757–780. [Google Scholar] [CrossRef] [PubMed]
  9. Uglanova, I.L.; Gel’ver, E.S.; Tarasov, S.V.; Gracheva, D.A.; Vyrva, E.E. Creativity assessment by analyzing images using neural networks. Sci. Tech. Inf. Process. 2022, 49, 371–378. [Google Scholar] [CrossRef]
  10. Zhang, Y.; Li, Y.; Hu, W.; Bai, H.; Lyu, Y. Applying machine learning to intelligent assessment of scientific creativity based on scientific knowledge structure and eye-tracking data. J. Sci. Educ. Technol. 2025, 34, 401–419. [Google Scholar] [CrossRef]
  11. Patterson, J.D.; Barbot, B.; LloydCox, J.; Beaty, R.E. AuDrA: An automated drawing assessment platform for evaluating creativity. Behav. Res. Methods 2024, 56, 3619–3636. [Google Scholar] [CrossRef]
  12. Kumar, T.; Brennan, R.; Mileo, A.; Bendechache, M. Image data augmentation approaches: A comprehensive survey and future directions. IEEE Access 2024, 12, 187536–187571. [Google Scholar] [CrossRef]
  13. Wang, J.; Perez, L. The effectiveness of data augmentation in image classification using deep learning. Convolutional Neural Netw. Vis. Recognit. 2017, 11, 1–8. [Google Scholar] [CrossRef]
  14. Hasan, J.; Das, A.; Matubber, J.; Shifat, S.H.; Morol, K. Enhanced classification of anxiety, depression, and stress levels: A comparative analysis of DASS21 questionnaire data augmentation and classification algorithms. In Proceedings of the 3rd International Conference on Computing Advancements, Dhaka, Bangladesh, 17–18 October 2024. [Google Scholar] [CrossRef]
  15. Haase, J.; Hanel, P.H.P.; Pokutta, S. S-dat: A multilingual, genai-driven framework for automated divergent thinking assessment. arXiv 2025, arXiv:2505.09068. [Google Scholar] [CrossRef]
  16. Wang, M.; Zhang, D.J.; Zhang, H. Large language models for market research: A data-augmentation approach. arXiv 2024, arXiv:2412.19363. [Google Scholar] [CrossRef]
  17. Hu, W.; Han, K. Theoretical Research and Practical Exploration of Adolescents’ Scientific Creativity. Psychol. Dev. Educ. 2015, 31, 44–50. [Google Scholar]
  18. Gute, G.; Gute, D.S.; Nakamura, J.; Csikszentmihályi, M. The Early Lives of Highly Creative Persons: The Influence of the Complex Family. Creat. Res. J. 2008, 20, 343–357. [Google Scholar] [CrossRef]
  19. Dong, Y.; Lin, J.; Li, H.; Cheng, L.; Niu, W.; Tong, Z. How parenting styles affect children’s creativity: Through the lens of self. Think. Ski. Creat. 2022, 45, 101045. [Google Scholar] [CrossRef]
  20. Davies, D.; Jindal-Snape, D.; Collier, C.; Digby, R.; Hay, P.; Howe, A. Creative learning environments in education—A systematic literature review. Think. Ski. Creat. 2013, 8, 80–91. [Google Scholar] [CrossRef]
  21. Parveen, N.; Khalid, M.; Azam, M.; Khalid, A.; Hussain, A.; Ahmad, M. Unravelling the impact of Perceived Parental Styles on Curiosity and Exploration. Bull. Bus. Econ. 2023, 12, 254–263. [Google Scholar] [CrossRef]
  22. Karwowski, M. Development of the creative self-concept. Creativity. Theor. Res. Appl. 2015, 2, 165–179. [Google Scholar] [CrossRef]
  23. Prahani, B.K.; Rizki, I.A.; Suprapto, N.; Irwanto, I.; Kurtuluş, M.A. Mapping research on scientific creativity: A bibliometric review of the literature in the last 20 years. Think. Skills Creat. 2024, 52, 101495. [Google Scholar] [CrossRef]
  24. Sak, U.; Ayas, M.B. Creative Scientific Ability Test (C-SAT): A new measure of scientific creativity. Psychol. Test Assess. Model 2013, 55, 316–329. [Google Scholar]
  25. Siew, A.; Ambo, N. The scientific creativity of fifth graders in a stem project-based cooperative learning approach. Probl. Educ. 21st Cent 2020, 78, 627–643. [Google Scholar] [CrossRef]
  26. Zhai, X.; Yin, Y.; Pellegrino, J.W.; Haudek, K.C.; Shi, L. Applying machine learning in science assessment: A systematic review. Stud. Sci. Educ. 2020, 56, 111–151. [Google Scholar] [CrossRef]
  27. Arizpe, E. A critical review of research into children’s responses to multimodal texts. In Handbook of Research on Teaching Literacy Through the Communicative and Visual Arts; Flood, J., Heath, S.B., Lapp, D., Eds.; Routledge: New York, NY, USA, 2015; Volume II, pp. 391–402. [Google Scholar]
  28. Shorten, C.; Khoshgoftaar, T.M. A survey on image data augmentation for deep learning. J. Big Data 2019, 6, 60. [Google Scholar] [CrossRef]
  29. Inoue, H. Data augmentation by pairing samples for images classification. arXiv 2018, arXiv:1801.02929. [Google Scholar] [CrossRef]
  30. Zhang, W.; Joseph, J.; Chen, Q.; Koz, C.; Xie, L.; Regmi, A.; Yamakawa, S.; Furuhata, T.; Shimada, K.; Kara, L.B. A data augmentation method for data-driven component segmentation of engineering drawings. J. Comput. Inf. Sci. Eng. 2024, 24, 011001. [Google Scholar] [CrossRef]
  31. Cao, C.; Zhou, F.; Dai, Y.; Wang, J.; Zhang, K. A survey of mix-based data augmentation: Taxonomy, methods, applications, and explainability. ACM Comput. Surv. 2024, 57, 1–38. [Google Scholar] [CrossRef]
  32. Acar, S.; Organisciak, P.; Dumas, D. Automated scoring of figural tests of creativity with computer vision. J. Creat. Behav. 2025, 59, e677. [Google Scholar] [CrossRef]
  33. Zhang, H.; Dong, H.; Wang, Y.; Zhang, X.; Yu, F.; Ren, B.; Xu, J. Automated graphic divergent thinking assessment: A multimodal machine learning approach. J. Intell. 2025, 13, 45. [Google Scholar] [CrossRef]
  34. Ben Said, M.; Kacem, Y.H.; Algarni, A.; Masmoudi, A. Early prediction of student academic performance based on machine learning algorithms: A case study of bachelor’s degree students in KSA. Educ. Inf. Technol. 2024, 29, 13247–13270. [Google Scholar] [CrossRef]
  35. Mudallal, R.H.; Mrayyan, M.T.; Kharabsheh, M. Use of machine learning to predict creativity among nurses: A multidisciplinary approach. BMC Nurs. 2025, 24, 539. [Google Scholar] [CrossRef]
  36. Kovalkov, A.; Paasen, B.; Segal, A.; Pinkwart, N.; Gal, K. Automatic creativity measurement in scratch programs across modalities. IEEE Trans. Learn. Technol. 2022, 14, 740–753. [Google Scholar] [CrossRef]
  37. Singh, J.; Banerjee, R. A study on single and multi-layer perceptron neural network. In Proceedings of the 2019 3rd International Conference on Computing Methodologies and Communication (ICCMC), Erode, India, 27–29 March 2019. [Google Scholar] [CrossRef]
  38. Biau, G.; Scornet, E. A random forest guided tour. Test 2016, 25, 197–227. [Google Scholar] [CrossRef]
  39. Chen, T.; Guestrin, C. Xgboost: A scalable tree boosting system. In Proceedings of the 22nd ACM SIGKDD International Conference on Knowledge Discovery and Data Mining, San Francisco, CA, USA, 13–17 August 2016; pp. 785–794. [Google Scholar] [CrossRef]
  40. Ke, G.; Meng, Q.; Finley, T.; Wang, T.; Chen, W.; Ma, W.; Ye, Q.; Liu, T.Y. Lightgbm: A highly efficient gradient boosting decision tree. Adv. Neural Inf. Process. Syst. 2017, 30, 3149–3157. [Google Scholar]
  41. Garcês, S. Creativity in science domains: A reflection. Atenea 2018, 517, 241–253. [Google Scholar] [CrossRef]
  42. Gupta, P.; Sharma, Y. Nurturing scientific creativity in science classroom. Resonance 2019, 24, 561–574. [Google Scholar] [CrossRef]
  43. Watanuki, S.; Edo, K.; Miura, T. Applying deep generative neural networks to data augmentation for consumer survey data with a small sample size. Appl. Sci. 2024, 14, 9030. [Google Scholar] [CrossRef]
  44. Piaget, J. Language and Thought of the Child: Selected Works Vol 5; Routledge: London, UK, 2005. [Google Scholar]
  45. Schutte, N.S.; Malouff, J.M. A meta-analysis of the relationship between curiosity and creativity. J. Creat. Behav. 2020, 54, 940–947. [Google Scholar] [CrossRef]
  46. Zimmerman, B.J. Self-regulated learning: Theories, measures, and outcomes. In International Encyclopedia of the Social & Behavioral Sciences, 2nd ed.; Elsevier: Amsterdam, The Netherlands, 2015; pp. 541–546. [Google Scholar] [CrossRef]
  47. Maksić, S.; Jošić, S. Scaffolding the development of creativity from the students’ perspective. Think. Skills Creat. 2021, 41, 100835. [Google Scholar] [CrossRef]
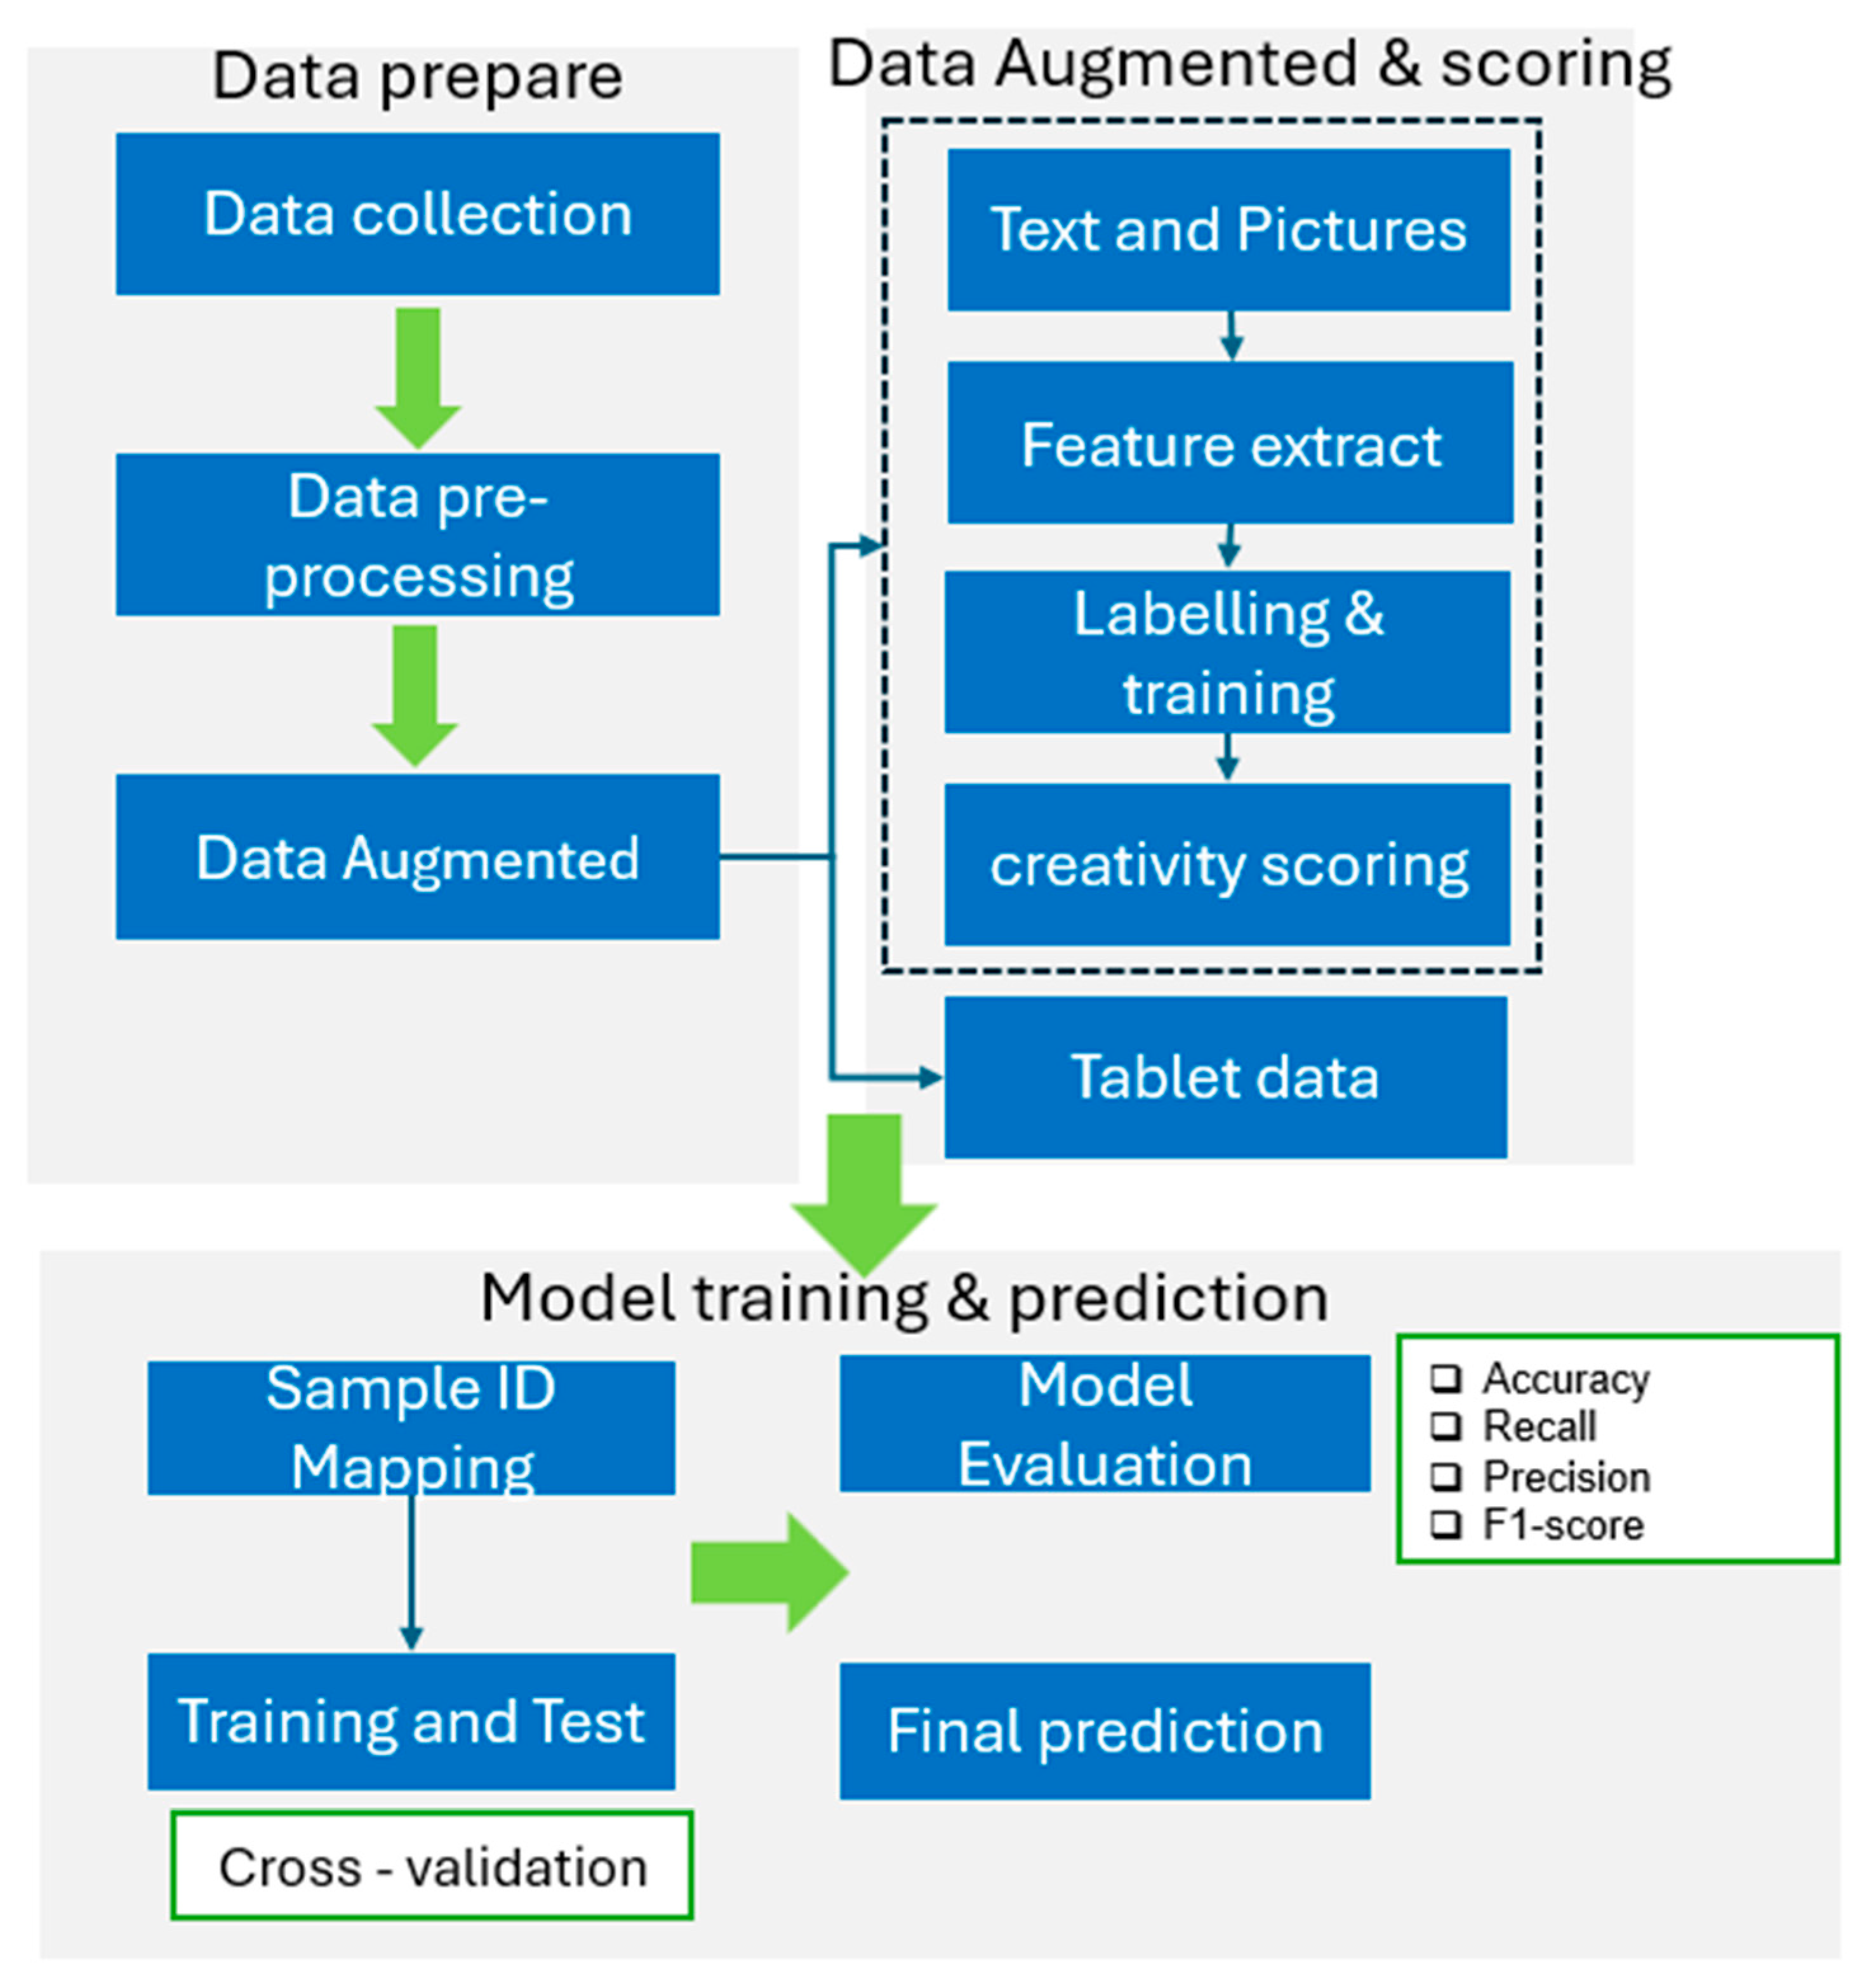
Figure 1. Overview of the proposed process. Solid green arrows indicate the main sequential data flow process, blue arrows represent specific data transfer or connection in modules, the green arrow in the ‘Model training & prediction’ section shows the workflow direction related to model training and prediction.
Information 16 00785 g001
Figure 2. Results of Principal Component Analysis (PCA).
Information 16 00785 g002
Figure 3. Confusion matrix of manual labels vs. pseudo-labels.
Information 16 00785 g003
Figure 4. Distribution comparison of scientific creativity. (a) Violin and box plot of fluency; (b) violin and box plot of flexibility; (c) violin and box plot of originality.
Information 16 00785 g004
Figure 5. Comparison results for image–text alignment.
Information 16 00785 g005
Figure 6. Feature importance of XGBoost.
Information 16 00785 g006
Figure 7. Comparison of high- and low scientific creativity across dimensions. (a) Creativity in curiosity; (b) creativity in CSE; (c) creativity in AM; (d) creativity in PC; (e) creativity in BC; (f) creativity in father’s education; (g) creativity in mother’s education; (h) creativity in SES.
Information 16 00785 g007
Table 1. Mapping relationship table of graphical and textual enhancement numbers.
IDOriginal IDImage_Text PathImage
Augmentation
Text
Augmentation
Bike_001_rotate_15_
synonym_1
Bike_001./images/Bike_001_rotate_15_
synonym_1.png
RotationSynonym replacement
Bike_002_scale_1.1_
rephrase_1
Bike_002./iages/Bike_002_scale_1.1_
rephrase_1.png
ScalingSentence pattern rewriting
Bike_003_noise_0.02_
ocrerror_1
Bike_003./iages/Bike_003_noise_0.02_
ocrerror_1.png
Noise
simulation
OCR error simulation
Table 2. Dataset before and after enhancement.
TypeInitial DatasetDataset Afterward
Original2600
Augmentation0300
Augmentation +
Pseudo-labelling
02000
Table 3. Comparison of model performance.
ModelMethodAccuracyPrecisionRecallF1-ScoreAUC-ROC
Random ForestOriginal0.740.850.810.830.82
Augmentation0.880.950.890.920.93
Pseudo-labeling0.850.880.980.940.86
MLPOriginal0.720.810.830.820.75
Augmentation0.880.90.960.930.81
Pseudo-labeling0.80.810.920.870.8
XGBoostOriginal0.770.860.860.860.82
Augmentation0.850.930.870.90.89
Pseudo-labeling0.860.860.950.90.84
LightGBMOriginal0.740.850.810.830.79
Augmentation0.850.960.940.920.91
Pseudo-labeling0.870.860.970.910.85
Disclaimer/Publisher’s Note: The statements, opinions and data contained in all publications are solely those of the individual author(s) and contributor(s) and not of MDPI and/or the editor(s). MDPI and/or the editor(s) disclaim responsibility for any injury to people or property resulting from any ideas, methods, instructions or products referred to in the content.