Article

Integrating AI and IoT for Predictive Maintenance in Industry 4.0 Manufacturing Environments: A Practical Approach

by
Rajnish Rakholia
*,
Andrés L. Suárez-Cetrulo
,
Manokamna Singh
and
Ricardo Simón Carbajo
Ireland’s Centre for Artificial Intelligence (CeADAR), School of Computer Science, University College Dublin (UCD), Belfield, D04 V2N9 Dublin, Ireland
*
Author to whom correspondence should be addressed.
Information 2025, 16(9), 737; https://doi.org/10.3390/info16090737
Submission received: 28 July 2025 / Revised: 23 August 2025 / Accepted: 25 August 2025 / Published: 26 August 2025

Abstract

Predictive maintenance is a crucial component of smart manufacturing in Industry 4.0, utilizing data from IoT sensor networks and machine learning algorithms to predict equipment failures before they happen. This proactive approach enables timely maintenance of equipment and machinery, reducing unplanned downtime, extending equipment lifespan, and enhancing overall system reliability, ultimately leading to more efficient and cost-effective operations. Conventional machinery and equipment maintenance approaches often rely on periodic manual inspections, human observations, and monitoring, which can be time-consuming, inefficient, and resource-intensive. Therefore, implementing automation through predictive models based on IoT and machine learning techniques is crucial for optimizing the maintenance of machinery and equipment. This paper aims to leverage machine learning techniques to develop predictive maintenance models, including electric motor temperature and vibration prediction, using data from established sensor networks and production data from ERP systems. The models are designed to predict potential issues within the next ten minutes, such as whether temperature or vibration levels will exceed predefined thresholds.

1. Introduction

Predictive maintenance is a crucial component of modern manufacturing, especially in industries with high operational demands, such as food processing. The sausage production process in the studied facility follows a structured sequence of stages, beginning with meat cutting and progressing through blending, stuffing, fermentation, drying, chilling, slicing, and final packaging. At each stage, supervisory control and data acquisition (SCADA) systems and enterprise resource planning (ERP) systems capture complementary process and production information, while additional sensors (e.g., temperature and vibration) monitor equipment conditions in real time. Figure 1 provides a schematic overview of the production line, highlighting both the physical stages of product transformation and the integration points where sensor and production data are collected. This setup forms the foundation for the proposed predictive maintenance framework, where machine learning models leverage the fused sensor and ERP data to anticipate equipment anomalies and ensure continuity of production.
Each stage relies on different types of equipment and machinery to ensure efficient processing. Maintaining this equipment effectively is essential to prevent disruptions and ensure smooth operations. Traditional maintenance methods, which rely on periodic inspections, manual observations, and scheduled servicing, often lead to unnecessary downtime. Equipment is inspected at fixed intervals regardless of its actual condition, resulting in excessive downtime and overlooked issues that may escalate into critical failures.
Sudden equipment failures can result in substantial financial losses, production shutdowns, operational disruptions, compromised product quality, and increased waste. Studies [1] have shown that unplanned downtime can impose significant costs on industries, underscoring the need for a more data-driven and predictive approach to maintenance. Additionally, periodic maintenance is inefficient and resource-intensive, requiring significant staffing and time. Therefore, implementing an automated solution using emerging technologies for real-time equipment monitoring has become a necessity to overcome the limitations of traditional maintenance.
In recent years, the integration of IoT-based sensor networks and machine learning algorithms into manufacturing practices and Industry 4.0 applications has gained significant attention due to their potential to enhance automation, efficiency, and real-time decision-making [2,3,4,5]. These technologies enable predictive maintenance, process optimization, and intelligent monitoring, making industrial operations more adaptive and data-driven. Additionally, researchers have conducted critical, systematic, and comprehensive reviews on machine learning and IoT-based solutions for smart manufacturing [6,7,8,9,10]. These studies provide an in-depth overview of how these technologies are integrated into industrial applications, highlighting key advancements, challenges, and future directions.
The IoT sensors play a crucial role in collecting real-time data on various equipment and machinery components, such as electric motor temperature and vibration levels. When combined with production data, which contains information about the total quantity being processed on the equipment, these datasets provide a more comprehensive understanding of equipment performance and operational conditions.
Machine learning is central to predictive maintenance, as it can analyze vast amounts of data generated by IoT sensors and ERP systems. By leveraging historical data, machine learning algorithms can identify patterns and detect anomalies that indicate potential failures. This predictive capability allows for timely maintenance interventions, reducing downtime and enhancing operational efficiency.
Numerous studies have explored the application of machine learning for predictive maintenance in manufacturing settings. For instance, Ayvaz and Alpay (2021) [11] utilized tree-based ensemble algorithms for predictive tasks, while Jaramillo-Alcazar et al. (2023) [12] focused on anomaly detection in a smart industrial machinery plant using IoT and machine learning. Hassoun et al. (2023) [13] reviewed the impact of the fourth industrial revolution on the food industry.
However, existing reviews indicate a significant research gap; there is limited research on predictive maintenance in the food manufacturing sector. This gap may be attributed to the complexity of implementing predictive maintenance and the unavailability of synchronized real-time and production data in food manufacturing environments. To better understand this gap, it is important to recognize the unique characteristics of the food industry that set it apart from other domains. In contrast to sectors such as automotive or energy, what distinguishes food manufacturing equipment maintenance is the combination of strict hygiene and safety requirements, continuous high-throughput operations, and exposure to variable loads and high-moisture conditions. These factors make equipment more vulnerable to wear and contamination, while even minor deviations can compromise product quality and regulatory compliance. Consequently, predictive maintenance in food environments must be both responsive and adaptable, yet remains underexplored compared to other industrial domains.
Some studies have highlighted the opportunities for applying machine learning in machinery maintenance within the food industry. Kumar et al. (2021) [14] explored AI and ML opportunities in the food sector, emphasizing that while applications are promising, research in this area remains limited. Similarly, Zatsu et al. (2024) [15] reviewed the use of AI and ML in food manufacturing and noted a wide scope for further exploration, particularly in predictive maintenance. Konur et al. (2023) [16] examined the design and implementation of Industry 4.0 in food manufacturing, stressing the importance of digital transformation but also pointing out that practical, domain-specific maintenance applications are still underdeveloped. Collectively, these studies highlight significant opportunities but also reveal a clear research gap, which provides the motivation for our study to develop and validate an AI-driven predictive maintenance framework tailored for food manufacturing environments.
Moreover, Khan et al. (2022) [17] provided a state-of-the-art review of machine learning-based modeling in food processing applications. Their analysis highlighted significant progress in areas like quality prediction and process optimization, but pointed out that equipment-level predictive maintenance has received little attention. This reinforces the notion that maintenance-focused applications in the food sector remain underexplored.
Despite these advancements, research on predictive maintenance in food manufacturing remains scarce, highlighting the need for further exploration in this domain.

2. Data and Methodology

This section provides a detailed overview of the data collection process, the steps involved in data preprocessing, and the methodology used for model development. The data collection phase includes gathering information from multiple sources, ensuring data quality, and integrating various datasets for comprehensive analysis. The preprocessing stage involves cleaning, transforming, and structuring the raw data to enhance its usability for machine learning applications. Finally, the model development phase focuses on selecting appropriate machine learning techniques, training the models, and evaluating their performance to derive meaningful insights and predictions.

2.1. Data and Preprocessing

In this research, data were collected from two different sources. The first source was the SCADA system established by our project partner, which gathered data from an IoT-based sensor network. This dataset included real-time measurements of the electric motor’s surface temperature and vibration data along the x-axis and z-axis. The SCADA system recorded data at five-second intervals, ensuring a continuous stream of information for analysis.
The second data source was the ERP (Enterprise Resource Planning) system, which provides information about the production process, including details on batches and the total quantity being processed. Additionally, the ERP system linked this information to the corresponding SCADA tags installed on the equipment, enabling a comprehensive analysis of machine performance with production activities.
The dataset used in this study was collected over 11 months, from March 2023 to January 2024, resulting in a total of 39,470 records sampled at 10 min intervals. Vibration data were captured during the blending stage, which operates in conjunction with the cutting process. Accordingly, vibration sensors were installed on the mincer (cutting) and blending equipment, while temperature sensors were specifically deployed on the blending stage. This setup reflects the critical points of mechanical stress and thermal variation in the production line, ensuring that the data captured are directly representative of equipment health and operational conditions.
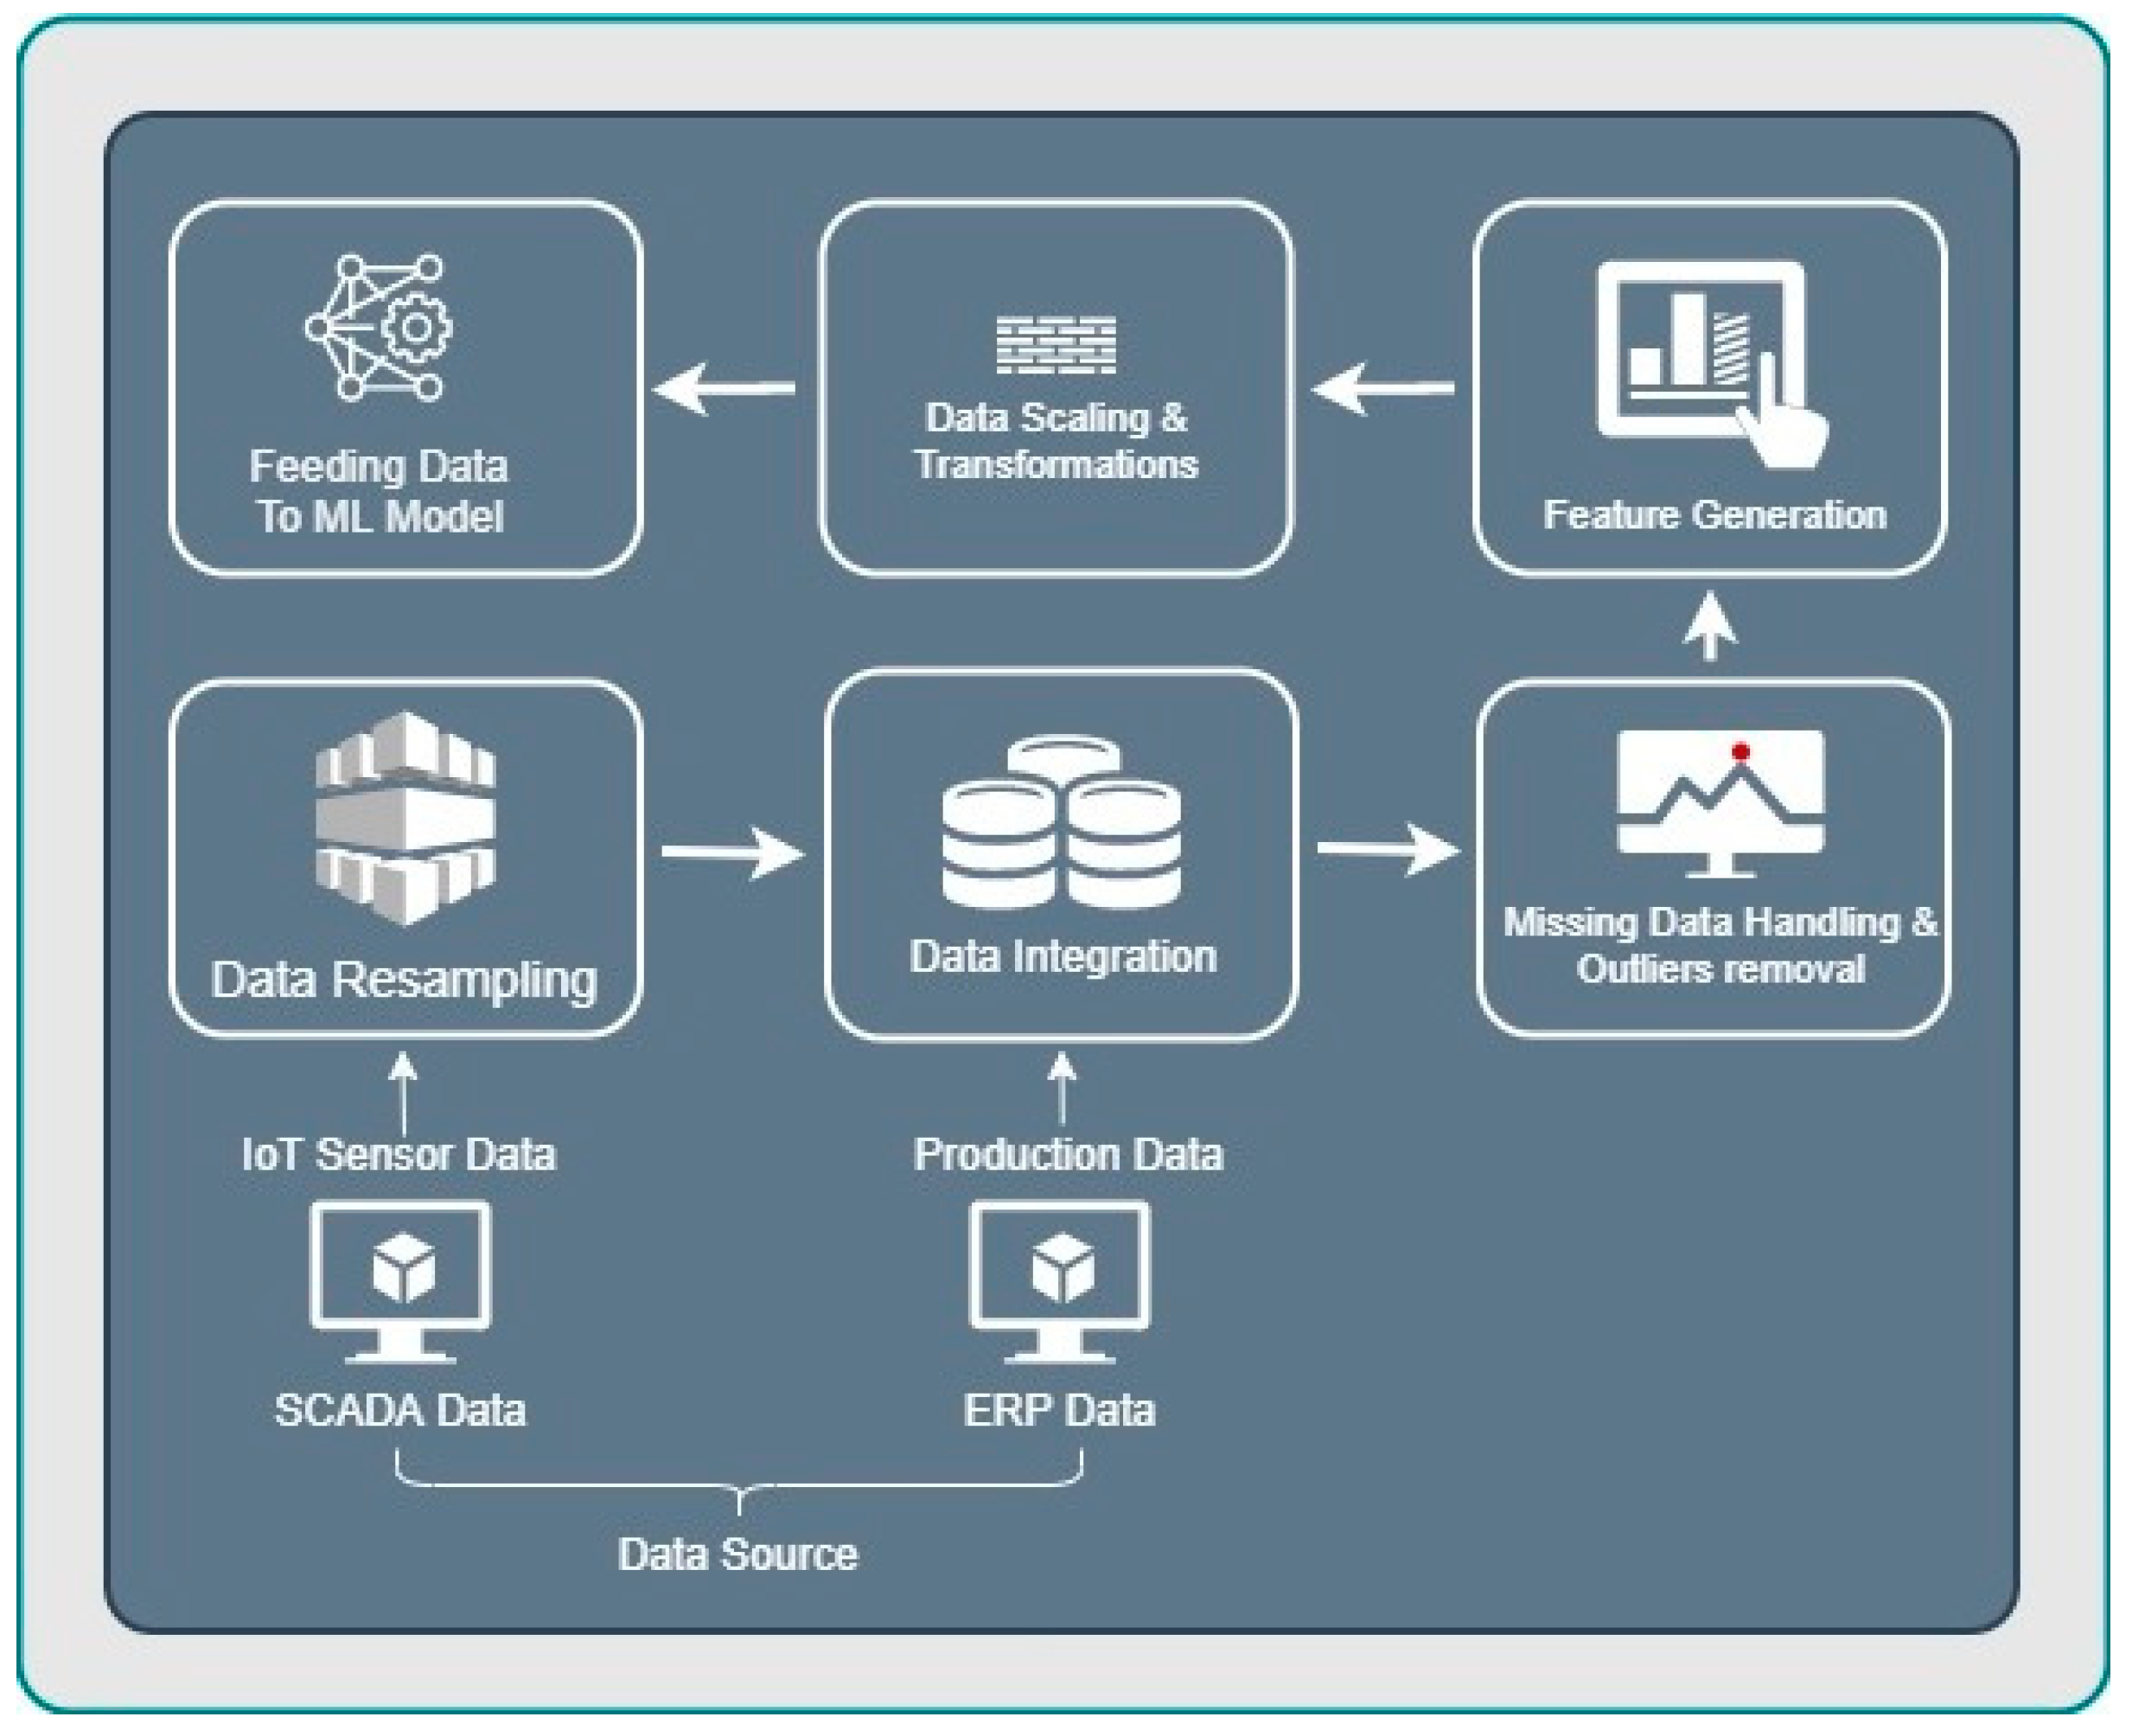
The data processing pipeline, which outlines the sequence of steps involved in collecting, integrating, and transforming data, is illustrated in Figure 2.

2.1.1. SCADA Data Retrieval and Handling Missing Data

All SCADA data was retrieved from the IoT-based sensor network. This data may contain missing values due to various reasons, such as sensor maintenance, routing service failures, unexpected faults, or timestamp mismatch between ERP and SCADA. Handling missing data is crucial to ensure a reliable and impactful model.
For short gaps in missing data, we used the feed-forward filling method by propagating the last valid recorded value forward, as the data is sampled every 5 s, and short gaps have minimal impact. However, for larger gaps, we used the rolling mean method to fill in missing values, ensuring data consistency while maintaining the underlying trends.

2.1.2. Outlier Detection and Error Handling

After handling missing data, we applied different techniques to identify and remove outliers. We used graphical representations, such as box plots, along with the K-Nearest Neighbors (KNN) method for anomaly detection. Outliers were removed based on predefined threshold values to prevent skewed model performance.
For ERP data, missing values were not present. However, errors might occur due to the manual entry of production information. Such inconsistencies were carefully handled to improve data quality and ensure the robustness of the model.

2.1.3. Data Transformation and Feature Engineering

To ensure uniformity across all features and reduce bias in the machine learning model, we performed data transformation. Features were normalized using techniques such as Min-Max scaling (Equation (1)) to ensure all variables were on a common scale where necessary:
x scaled = x x min x max x min
Finally, feature engineering was conducted to construct new meaningful features that enhance the model’s predictive performance. The primary input features include motor temperature, x-axis vibration, and z-axis vibration, as these variables are closely tied to motor health and performance. Abnormal patterns in motor temperature and vibration often serve as early indicators of potential mechanical failures. Additionally, temporal features such as the hour of the day, weekday, and a weekend indicator (isWeekend) are incorporated to account for cyclical and operational patterns, as motor behavior can vary based on the time of day or day of the week.
To further improve the model’s predictive power, additional features are constructed from the raw data, including statistical measures like moving averages and rolling window statistics (e.g., mean). These features capture both short-term fluctuations and long-term trends that may not be evident from the raw data alone. Moreover, the quantity of the product being processed is included as a critical feature, as variations in product quantity can affect the motor’s load and performance. The inclusion of this feature, along with the other sensor-based and temporal variables, enables the model to better understand the complex relationships between operational conditions and motor health. Table 1 lists the input variables used for each model.
As shown in Table 1, the model incorporates multiple input variables, and their relevance to each prediction output (temperature, x-axis vibration, and z-axis vibration) is explicitly reviewed using Y/N relationships. This structure highlights how different features contribute to specific outputs, ensuring transparency in the model design and clarifying the input–output dependencies for predictive maintenance in food manufacturing.

2.2. Methodology

Model Selection and End-to-End Pipeline

The ensemble learning algorithm XGBoost [18] was selected as the primary model for this study due to its strong performance in handling structured time series data, particularly when historical records are limited, a common challenge in industrial environments. While neural network models such as LSTM and GRU are effective at learning temporal dependencies, they typically require large datasets to prevent overfitting, which was not feasible in this case due to data constraints.
In the model selection phase, a range of candidate machine learning algorithms was considered to ensure robustness of the framework. Classical probabilistic models such as Naïve Bayes were evaluated but found to be less suitable, as they assume feature independence, which does not hold in complex sensor-based industrial datasets where variables are often correlated. Similarly, Support Vector Machines (SVMs) and logistic regression were tested; while they provide good interpretability, they struggled to capture nonlinear interactions across multiple features without extensive feature engineering. Random Forest was also assessed (Supplementary Materials, Table S1), offering good robustness and interpretability; however, its performance was slightly lower compared to XGBoost.
On the deep learning side, Artificial Neural Networks (ANNs) were explored as a baseline, but they exhibited slower convergence and required more tuning to avoid overfitting. Advanced recurrent models, such as LSTM and GRU, were also considered for their ability to capture temporal dependencies; however, the limited dataset size restricted their generalization capability, leading to unstable predictions.
In contrast, XGBoost, with its ensemble of gradient-boosted decision trees and built-in regularization techniques, offers strong generalization capabilities and performs well even with smaller datasets, making it especially suitable for predictive maintenance applications. Beyond its predictive power, XGBoost also provides practical advantages that align well with the operational demands of industrial settings. Collectively, these strengths made XGBoost the most practical and effective choice for the predictive maintenance framework developed in this study.
Building on this choice of model, the novelty of our work lies not in the algorithms themselves but in how they are applied and adapted to the food manufacturing domain. Although this study builds on widely used methods like XGBoost and standard feature engineering, its novelty comes from applying them in a real industrial food manufacturing setting, where predictive maintenance has rarely been explored. We integrate sensor data with ERP production records and use a sliding-window validation strategy to reflect actual operating conditions, which together provide a more realistic and practical framework. In doing so, the work goes beyond method reuse and shows how these tools can be adapted to the unique challenges of food production, making it one of the first concrete demonstrations of predictive maintenance in this domain.
With this foundation established, we then focused on refining the feature design to maximize predictive performance. Specifically, we utilized both past and future covariates during model development. For past covariates, complete historical data were available for all features, as they represent recent but recorded values. Consequently, all past covariates were incorporated for temperature prediction. However, for x-axis and z-axis vibration predictions, we deliberately excluded rolling and moving average features. This decision stemmed from the observation that vibration patterns tend to change abruptly with variations in machine load, rather than gradually over time. Since the dataset was collected at a 10 min frequency, smoothing techniques like rolling averages were not impactful and thus were not included for these targets.
To further improve model performance, we incorporated future covariates, which are variables whose values are known ahead of time and are therefore safe to use at prediction time without causing data leakage. These include time-based features such as the hour of the day, day of the week, and weekend indicators, which follow a deterministic pattern and can be reliably generated for future timestamps. The complete list of input variables for each model, including the applicable future covariates, is summarized in Table 1.
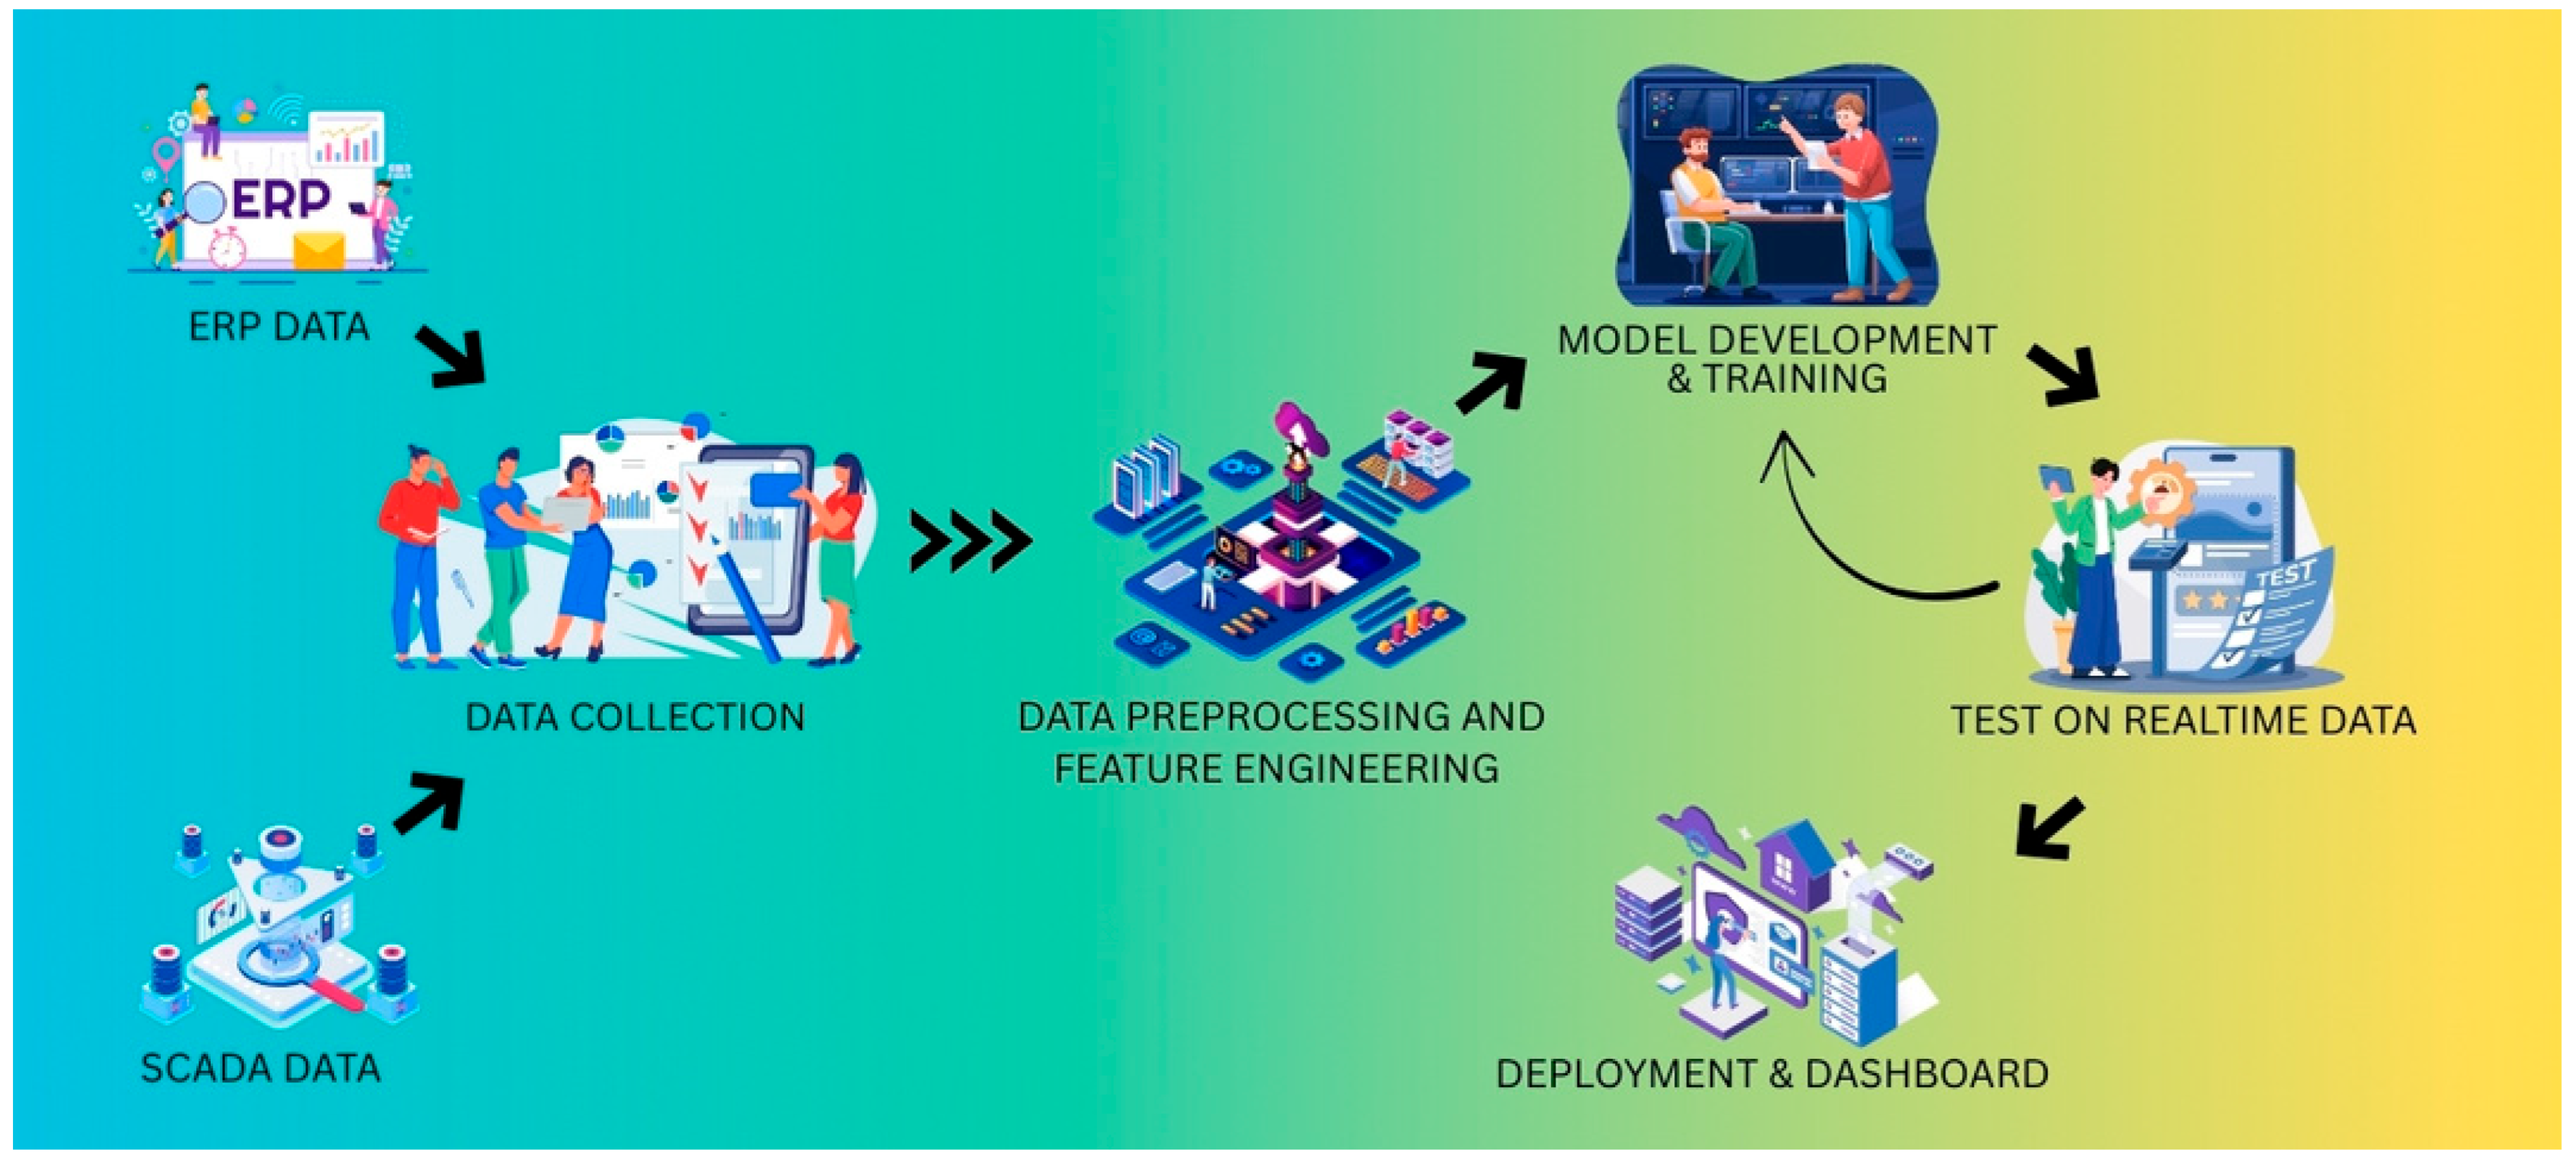
To provide a clearer understanding of the overall process, Figure 3 presents the complete model development workflow. It begins with the collection of ERP and SCADA data, followed by data preprocessing and feature engineering. The refined data is then used to train the model, which is subsequently validated using real-time data. Finally, the deployed model is integrated into a dashboard, enabling continuous monitoring and actionable insights.
To enable practical use, the developed model was deployed on an on-premises infrastructure, ensuring data security and compliance with the operational requirements of the food manufacturing facility. The trained model was exposed through a lightweight REST API, which acted as the central interface for integration with existing systems. This API was then connected to a user-friendly monitoring dashboard to support daily operations. The overall setup provided a robust and low-latency deployment workflow that operated reliably within factory network constraints, while also providing flexibility for future extensions to hybrid or cloud-based solutions.
Table 2 describes the list of hyperparameters used for model training, along with the range of values considered during model development. We utilized the random search technique for hyperparameter tuning to identify the optimal values for each parameter.

2.3. Performance Evaluation

Standard statistical metrics were utilized to evaluate the performance of the predictive maintenance models developed for the food manufacturing environment. The focus is on forecasting critical indicators such as electric motor temperature and vibration levels. For this purpose, Root Mean Squared Error (RMSE), Mean Absolute Error (MAE), Mean Absolute Percentage Error (MAPE), and the correlation were employed.
Let ŷ denote the predicted value and yᵢ the actual observed value of the monitored parameter (e.g., temperature or vibration) for the i ʰ instance, where i = 1, 2, …, n , and n is the number of samples in the test dataset.
The evaluation metrics are defined as follows:
R M S E   ( y , y ^ ) = i = 1 n ( y i y l ^ ) 2 n
M A E y , y l ^ = 1 n i = 0 n 1 y i y l ^
M A P E ( y , y ^ ) = 1 n i = 1 n | y i y l ^ | m a x ( ϵ , | y i | )
where ε is a small constant introduced to avoid division by zero in cases where yᵢ equals zero.
These metrics provide a comprehensive assessment of prediction accuracy by quantifying both the magnitude and percentage of errors, as well as the degree of correlation between the predicted and actual values.

3. Results and Discussion

The proposed prediction models for electric motor temperature and vibration (x-axis and z-axis) were developed using the same underlying algorithmic framework but with distinct input feature sets tailored to each target variable. The input features incorporated into the models include: motor temperature, x-axis vibration, z-axis vibration, hour of the day, weekday, and a weekend indicator (isWeekend). These features were selected based on their relevance to operational conditions and their influence on machine behavior during production.
The time-series data was resampled and structured at a frequency of 10 min (10T). This interval was selected to allow the model to perform predictions at regular intervals throughout the day, enabling near-real-time anomaly detection. The selection of a ten-minute prediction horizon was driven primarily by operational requirements rather than purely technical considerations. In industrial practice, exceeding temperature or vibration thresholds does not typically result in an immediate motor failure; instead, it signals an early-stage anomaly that may progress over the course of several hours. The manufacturing unit required a short-term predictive window that would provide timely alerts while still allowing operators adequate time to intervene, such as by adjusting operating conditions, scheduling inspections, or preparing for controlled downtime. Through consultation with plant engineers, a ten-minute horizon was identified as the optimal balance between responsiveness and practicality. It is short enough to detect emerging deviations before they escalate, yet long enough to support informed decision-making and avoid unnecessary false alarms. This horizon, therefore, aligns closely with real-world operational needs and enhances the applicability of the predictive maintenance framework in practice.
At each 10 min step, the models predict the values of temperature and vibration. These predicted values are then compared against predefined threshold limits. If any predicted value exceeds its threshold, an alert is triggered and displayed on the monitoring dashboard where the models are deployed. This alerting mechanism forms a critical part of our predictive maintenance system, helping operators intervene before potential machine failures.
Inclusion of the weekend feature proved to be particularly significant. It was observed that production intensity tends to be lower on weekends compared to weekdays. Similarly, during night shifts, operational load often decreases in comparison to daytime production. These temporal variations affect machine stress levels, which in turn influence temperature and vibration patterns. By accounting for such fluctuations, the model’s predictive accuracy is notably enhanced.
For the temperature prediction model, we use the past values of vibration (both x and z axes) as important input features, specifically incorporating 12-time lags (i.e., the last 2 h of data at 10 min intervals). This lag structure is based on the understanding that vibrations typically react instantly to changes in production load or mechanical strain, whereas temperature changes occur more gradually. For example, when the production volume increases suddenly, vibrations spike immediately due to increased mechanical movement, while the motor temperature rises more slowly due to thermal inertia. This observed behavior highlights the correlation and interplay between vibration and temperature signals, which the model learns to leverage.
During model training, temperature serves as the target variable, while all other features, both current and lagged, act as independent variables. Similarly, for the vibration prediction models (x-axis or z-axis), the respective vibration signal is treated as the target variable, and the remaining features are used as inputs. In all models, historical lagged data is incorporated not only for the target variable but also for other relevant features, ensuring that temporal dependencies and patterns are effectively captured.
The use of lagged time-series features, contextual variables like time and weekend indicators, and multivariate input structures has contributed to robust model performance. The models demonstrate an ability to predict critical machine parameters accurately and provide actionable insights for predictive maintenance.
Figure 4 illustrates the impact of progressively enriching the feature set on model performance. The baseline model (B0), which relies only on current values, achieved moderate correlations across temperature and vibration predictions. Incorporating lagged features (B1) improved all metrics, reflecting the importance of temporal dependencies in equipment behavior. Adding contextual variables such as time-of-day and weekend indicators (B2) further enhanced prediction accuracy, particularly for temperature forecasting. Finally, the multivariate input structure combining temperature, vibration, and load (B3) delivered the highest correlations, reaching 0.97 for temperature and notable gains for vibration predictions.
These consistent improvements confirm that lagged time-series properties, contextual information, and multivariate inputs substantially strengthen predictive performance and provide more reliable insights for maintenance decision-making.
During the maintenance phase of the IoT-based sensor network, several sensors were not functioning, which resulted in a substantial data gap over a few months. This continuous missing data had to be excluded from the analysis and model development, as it disrupted the continuity required for training and testing the predictive models. Due to this discontinuity, using the full dataset in a single pass was not feasible for model training and evaluation. To overcome this challenge, a sliding window approach was implemented. In each sliding window, ninety percent of three months of continuous data was used for training the model, while the remaining ten percent was allocated for testing. Despite the incomplete dataset, this method allowed the model to be trained and validated on temporally coherent data. After the entire sliding window cycle, the performance results from each window were aggregated to assess the overall accuracy of the predictive models. The motor temperature prediction model demonstrated strong performance.
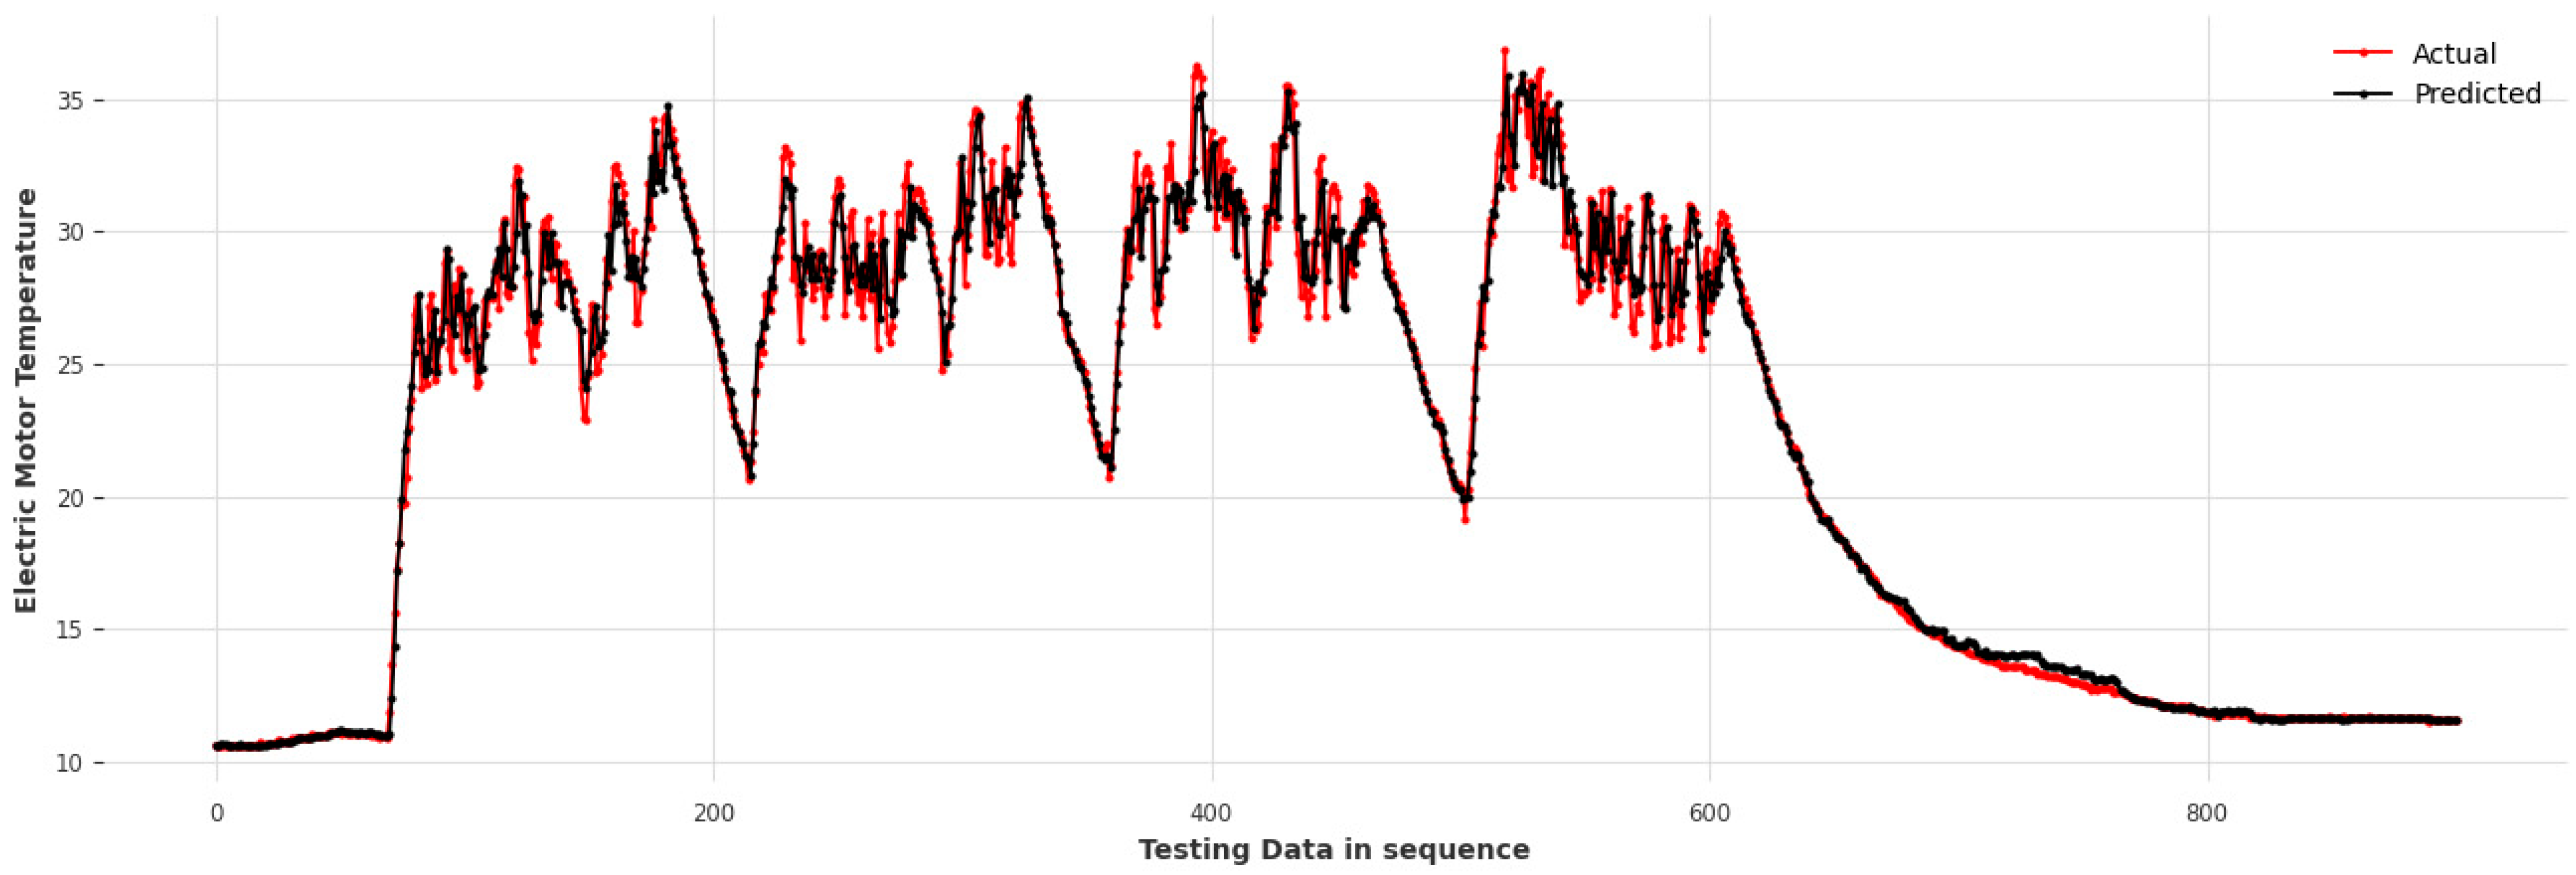
The aggregated results showed an RMSE of 2.04, a correlation coefficient of 0.973, an MAPE of 0.09, and an MAE of 0.669. These results indicate a high level of prediction accuracy and consistency, suggesting that the model is well-suited for deployment in a real-time monitoring system. Figure 5 presents a graph comparing the actual and predicted temperature values, providing a clear visual representation of how closely the model replicates real-world sensor data.
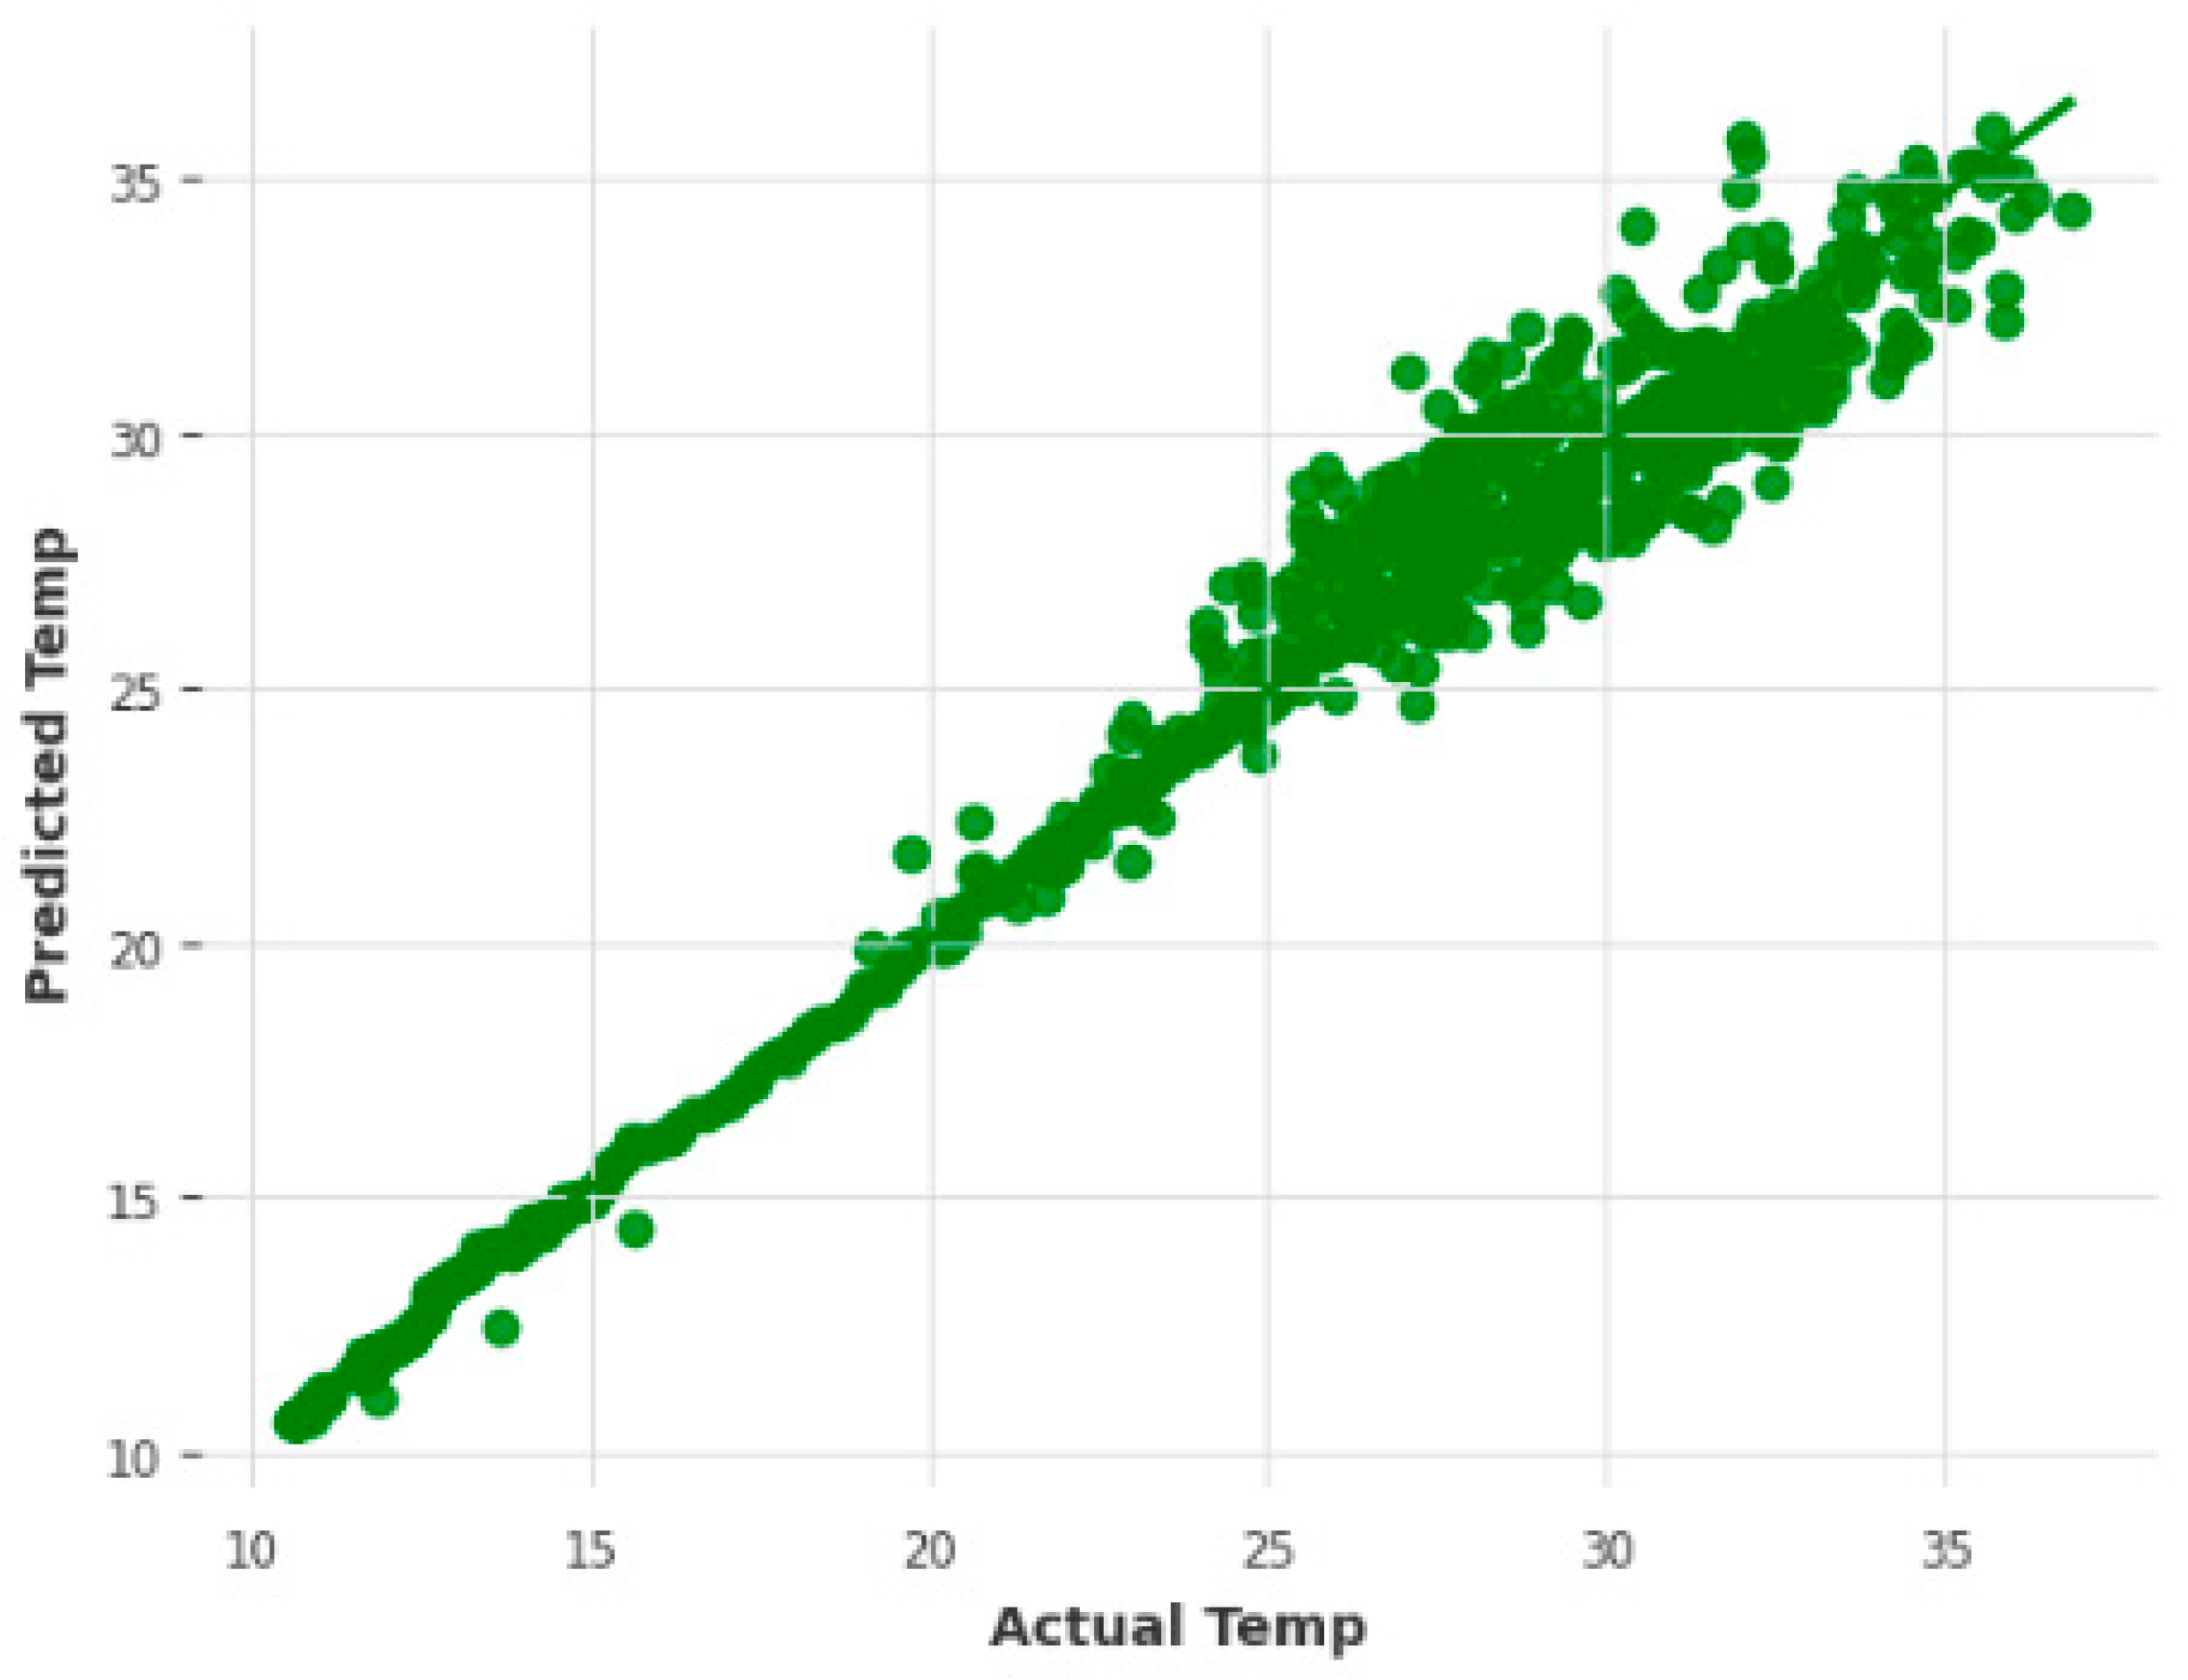
In addition, Figure 6 provides a scatter plot of actual versus predicted values, which helps to illustrate the distribution of prediction errors and the alignment of predictions along the regression line. The motor temperature model achieved high accuracy largely because motor temperature typically changes gradually and predictably. Furthermore, the model benefited significantly from the use of lagged temperature values as input features, since past temperature readings strongly influence future trends. The inclusion of vibration data also contributed to performance by providing additional insight into operational conditions.
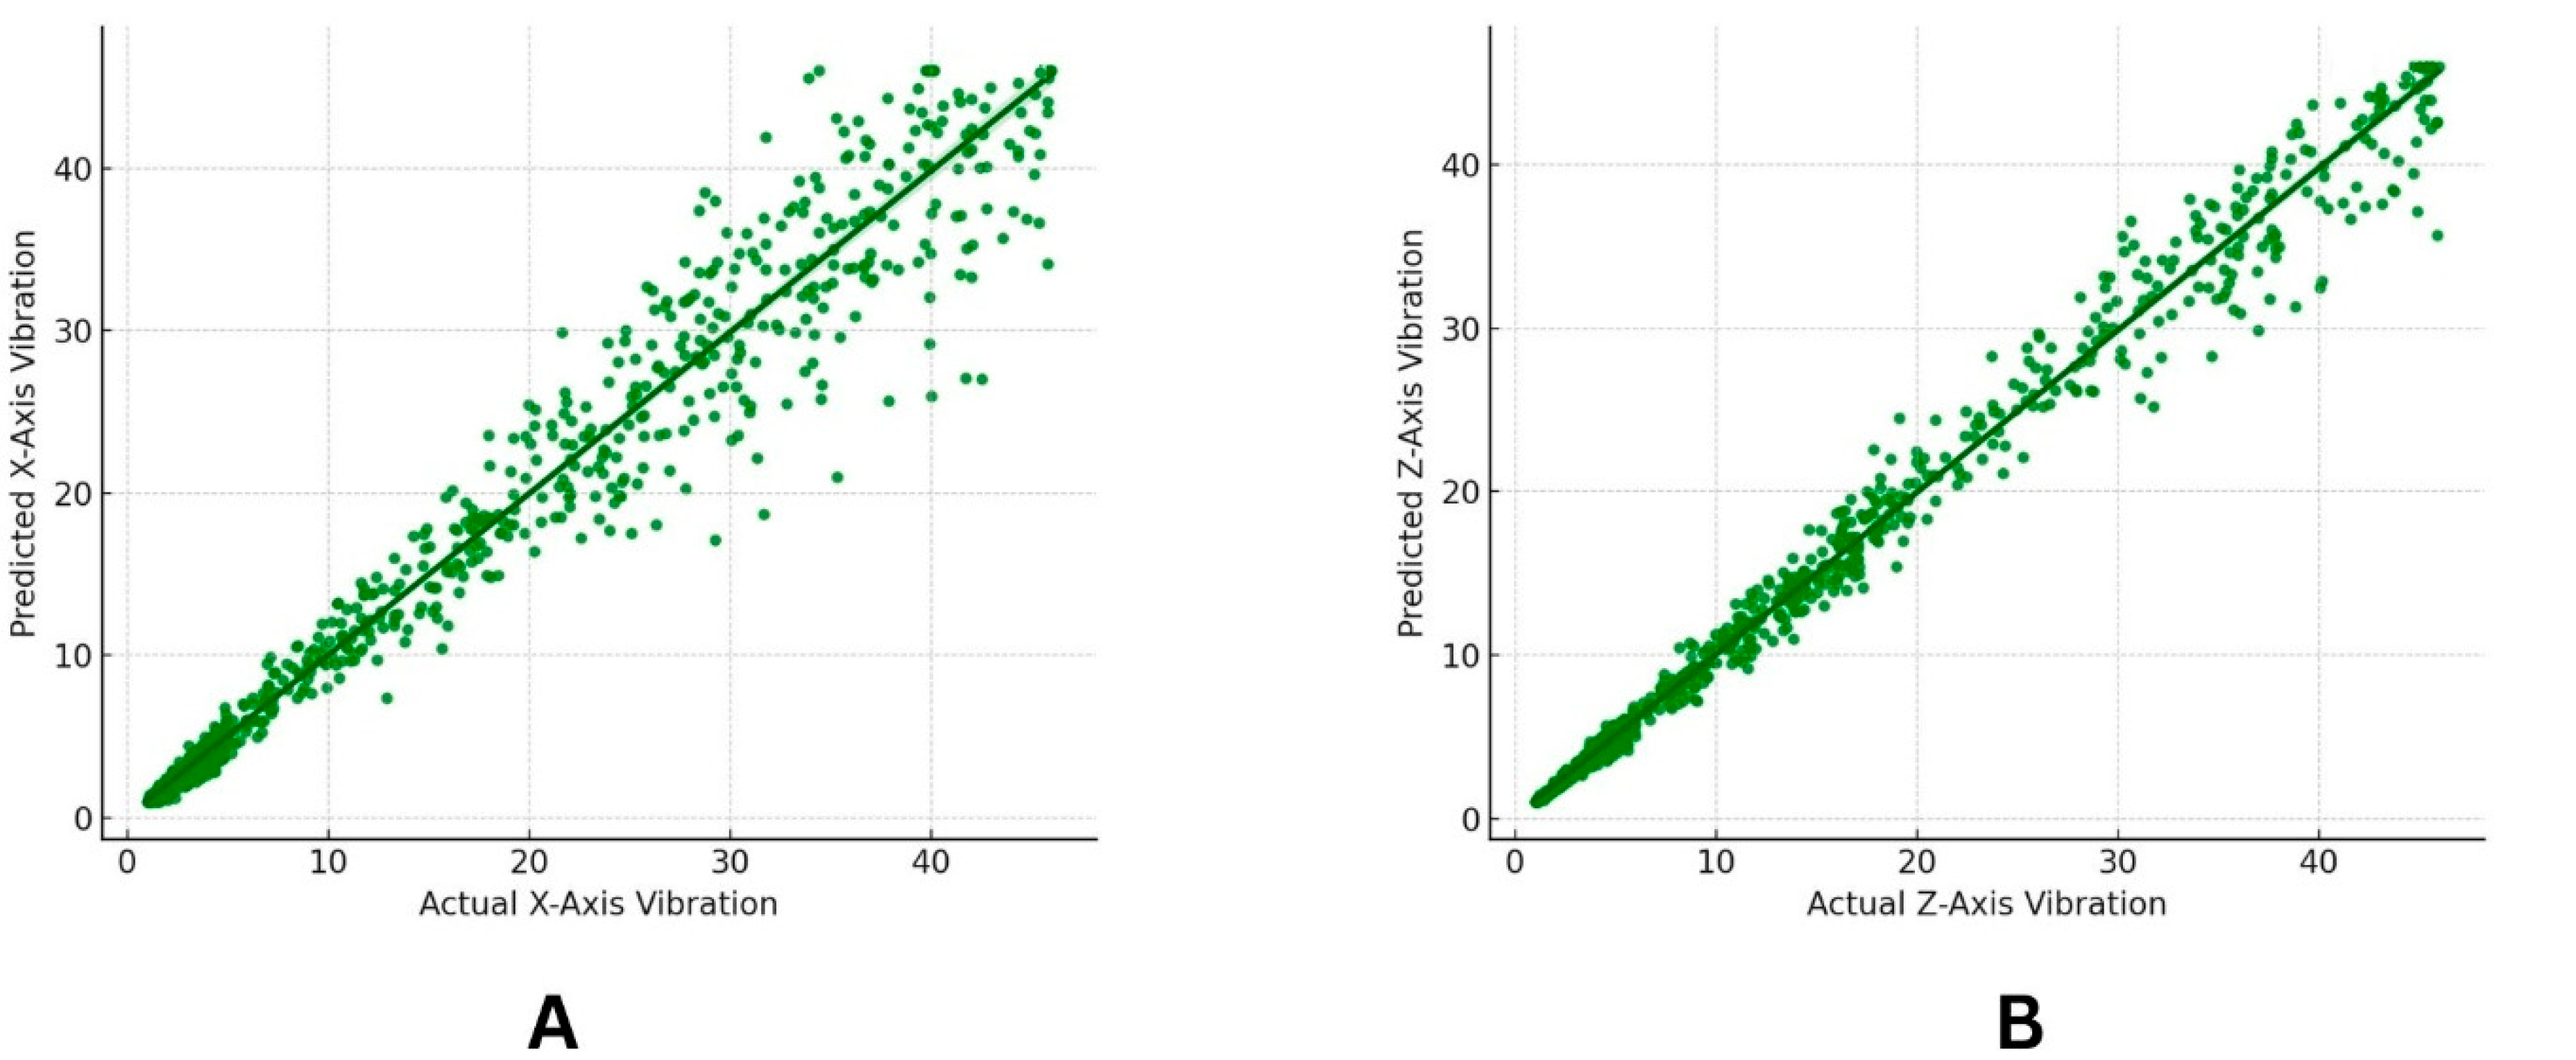
In contrast, the performance of the vibration models was comparatively lower. For the x-axis vibration predictions, the model achieved an RMSE of 6.06, a correlation coefficient of 0.78, a MAPE of 0.21, and a MAE of 4.01. For the z-axis vibration, the results were slightly lower, with an RMSE of 6.89, a correlation coefficient of 0.75, a MAPE of 0.28, and a MAE of 4.63. These values indicate moderate predictive capability, but the overall accuracy is lower compared to the motor temperature model. The primary reason for this reduced performance appears to be the absence of contextual data regarding which product is being processed on the production line at any given time.
Figure 7 shows scatter plots of actual versus predicted values for (A) x-axis vibration and (B) z-axis vibration, while Figure 8 illustrates the time-series comparison between actual and predicted signals for (A) x-axis vibration and (B) z-axis vibration.
Vibration patterns are not only influenced by the machine’s operational conditions but also by the physical characteristics of the product being handled. Different products generate different mechanical responses based on their structural properties and processing behavior. For example, soft or lightweight products may pass through the machinery smoothly, whereas harder or bulkier products may exert more force, leading to increased or irregular vibrations. Additionally, the quantity of product being processed can impact the machine’s load, which in turn affects vibration levels. Unfortunately, in the current dataset, there was no recorded information specifying the type and composition of products being processed at specific times. This lack of metadata limited the model’s ability to capture the full variability in the vibration signals.
To improve vibration model accuracy, future work should incorporate production metadata such as product name, product type, and material properties aligned with sensor data using accurate timestamps. Incorporating this additional context would allow the model to better account for the underlying causes of vibration variations and significantly improve its predictive performance.

4. Conclusions

This study explores the application of predictive maintenance in the food manufacturing industry through the development of machine learning models and the deployment of a real-time IoT-based sensor network. The sensor network was designed to monitor critical parameters such as electric motor temperature and machine vibrations along the X and Z axes. Using the collected sensor data, we developed three predictive models employing ensemble machine learning techniques to forecast motor temperature and vibration levels.
The temperature prediction model achieved high accuracy, demonstrating strong potential for real-world deployment in live manufacturing settings. This model can serve as a proof of concept for anticipating electric motor failures, offering a proactive approach to maintenance. It aims to deliver timely, data-driven insights that enable machine operators to take immediate corrective actions, thereby reducing the risk of unexpected equipment failures and minimizing production downtime.
While the vibration prediction models showed relatively lower accuracy, this was largely attributed to the absence of contextual production data, such as product types and quantities passing through the line, which likely influence vibration patterns. Incorporating such production-related variables in future studies could significantly enhance the accuracy of these models. This research lays the groundwork for scalable predictive maintenance strategies, not only in food manufacturing but also across other industries that rely on electric motors. By adjusting the input variables to suit different operational contexts, the framework developed here can be adapted and expanded to a wide range of industrial applications.

Supplementary Materials

The following supporting information can be downloaded at https://www.mdpi.com/article/10.3390/info16090737/s1. Table S1: Performance comparison with baseline model.

Author Contributions

Writing—original draft preparation and Methodology—R.R.; Conceptualization, Supervision, review & editing, Validation—A.L.S.-C.; Data curation, Visualization, and Investigation—M.S.; Supervision, Project administration, Funding acquisition—R.S.C. All authors have read and agreed to the published version of the manuscript.

Funding

The authors express their gratitude for the financial support provided by Enterprise Ireland’s Disruptive Technologies Innovation Fund (DTIF) (Grant No. DT2020214), which made this work possible.

Institutional Review Board Statement

Not applicable.

Informed Consent Statement

Not applicable.

Data Availability Statement

The data supporting the findings of this study are proprietary and confidential. Due to their sensitive nature, they are not available for public access or distribution.

Acknowledgments

They also extend their heartfelt thanks to their partners in the PeRCEPTION project for their invaluable contributions in initiating and shaping this research.

Conflicts of Interest

The authors declare that they have no known competing financial interests or personal relationships that could have appeared to influence the work reported in this paper.

References

  1. Shahin, M.; Chen, F.F.; Hosseinzadeh, A.; Zand, N. Using machine learning and deep learning algorithms for downtime minimization in manufacturing systems: An early failure detection diagnostic service. Int. J. Adv. Manuf. Technol. 2023, 128, 3857–3883. [Google Scholar] [CrossRef]
  2. Rai, R.; Tiwari, M.K.; Ivanov, D.; Dolgui, A. Machine learning in manufacturing and industry 4.0 applications. Int. J. Prod. Res. 2021, 59, 4773–4778. [Google Scholar] [CrossRef]
  3. Jan, Z.; Ahamed, F.; Mayer, W.; Patel, N.; Grossmann, G.; Stumptner, M.; Kuusk, A. Artificial intelligence for industry 4.0: Systematic review of applications, challenges, and opportunities. Expert Syst. Appl. 2023, 216, 119456. [Google Scholar] [CrossRef]
  4. Soori, M.; Arezoo, B.; Dastres, R. Internet of things for smart factories in industry 4.0, a review. Internet Things Cyber-Phys. Syst. 2023, 3, 192–204. [Google Scholar] [CrossRef]
  5. Rath, K.C.; Khang, A.; Mishra, S.K.; Patnaik, P.K.; Mohanty, G.K.; Dash, T. Integration of Artificial Intelligence and Internet of Things Technology Solutions in Smart Manufacturing. In Machine Vision and Industrial Robotics in Manufacturing; CRC Press: Boca Raton, FL, USA, 2024; pp. 155–177. [Google Scholar]
  6. Visconti, P.; Rausa, G.; Del-Valle-Soto, C.; Velázquez, R.; Cafagna, D.; De Fazio, R. Machine learning and IoT-based solutions in industrial applications for Smart Manufacturing: A critical review. Future Internet 2024, 16, 394. [Google Scholar] [CrossRef]
  7. Bzai, J.; Alam, F.; Dhafer, A.; Bojović; M; Altowaijri, S.M.; Niazi, I.K.; Mehmood, R. Machine learning-enabled Internet of Things (iot): Data, applications, and industry perspective. Electronics 2022, 11, 2676. [Google Scholar] [CrossRef]
  8. Presciuttini, A.; Cantini, A.; Costa, F.; Portioli-Staudacher, A. Machine learning applications on IoT data in manufacturing operations and their interpretability implications: A systematic literature review. J. Manuf. Syst. 2024, 74, 477–486. [Google Scholar] [CrossRef]
  9. Rahman, M.S.; Ghosh, T.; Aurna, N.F.; Kaiser, M.S.; Anannya, M.; Hosen, A.S. Machine learning and internet of things in industry 4. 0: A review. Meas. Sens. 2023, 28, 100822. [Google Scholar] [CrossRef]
  10. Zonta, T.; Da Costa, C.A.; da Rosa Righi, R.; de Lima, M.J.; da Trindade, E.S.; Li, G.P. Predictive maintenance in the Industry 4. 0: A systematic literature review. Comput. Ind. Eng. 2020, 150, 106889. [Google Scholar] [CrossRef]
  11. Ayvaz, S.; Alpay, K. Predictive maintenance system for production lines in manufacturing: A machine learning approach using IoT data in real-time. Expert Syst. Appl. 2021, 173, 114598. [Google Scholar] [CrossRef]
  12. Jaramillo-Alcazar, A.; Govea, J.; Villegas-Ch, W. Anomaly Detection in a Smart Industrial Machinery Plant Using IoT and Machine Learning. Sensors 2023, 23, 8286. [Google Scholar] [CrossRef] [PubMed]
  13. Hassoun, A.; Aït-Kaddour, A.; Abu-Mahfouz, A.M.; Rathod, N.B.; Bader, F.; Barba, F.J.; Biancolilloi, A.; Cropotovaj, J.; Galanakis, C.M.; Regenstein, J.; et al. The fourth industrial revolution in the food industry—Part I: Industry 4. 0 technologies. Crit. Rev. Food Sci. Nutr. 2023, 63, 6547–6563. [Google Scholar] [CrossRef] [PubMed]
  14. Kumar, I.; Rawat, J.; Mohd, N.; Husain, S. Opportunities of artificial intelligence and machine learning in the food industry. J. Food Qual. 2021, 2021, 4535567. [Google Scholar] [CrossRef]
  15. Zatsu, V.; Shine, A.E.; Tharakan, J.M.; Peter, D.; Ranganathan, T.V.; Alotaibi, S.S.; Mugabi, R.; Muhsinah, A.B.; Waseem, M.; Nayik, G.A. Revolutionizing the food industry: The transformative power of artificial intelligence—A review. Food Chem. X 2024, 24, 101867. [Google Scholar] [CrossRef]
  16. Konur, S.; Lan, Y.; Thakker, D.; Morkyani, G.; Polovina, N.; Sharp, J. Towards design and implementation of Industry 4.0 for food manufacturing. Neural Comput. Appl. 2023, 35, 23753–23765. [Google Scholar] [CrossRef]
  17. Khan, M.I.H.; Sablani, S.S.; Nayak, R.; Gu, Y. Machine learning-based modeling in food processing applications: State of the art. Compr. Rev. Food Sci. Food Saf. 2022, 21, 1409–1438. [Google Scholar] [CrossRef]
  18. Chen, T.; Guestrin, C. XGBoost: A scalable tree boosting system. In Proceedings of the 22nd ACM SIGKDD International Conference on Knowledge Discovery and Data Mining, San Francisco, CA, USA, 13–17 August 2016; pp. 785–794. [Google Scholar] [CrossRef]
Figure 1. Schematic representation of the sausage production line showing major equipment, sensor integration points (SCADA, ERP, temperature), and the predictive maintenance application.
Information 16 00737 g001
Figure 2. Data Preprocessing.
Information 16 00737 g002
Figure 3. Model Development end-to-end pipeline.
Information 16 00737 g003
Figure 4. Impact of progressively adding lagged features, contextual variables, and multivariate inputs on overall model performance.
Information 16 00737 g004
Figure 5. Actual vs. Predicted motor temperatures over time.
Information 16 00737 g005
Figure 6. Actual vs. Predicted motor temperature relationship.
Information 16 00737 g006
Figure 7. Actual vs. predicted vibration relationships: (A) x-axis vibration and (B) z-axis vibration.
Information 16 00737 g007
Figure 8. Actual vs. predicted vibration signals: (A) x-axis vibration and (B) z-axis vibration over time.
Information 16 00737 g008
Table 1. Model inputs and their relationships with prediction outputs.
Variable NameDescriptionTemperature Prediction (Output 1)x-Axis Vibration Prediction (Output 2)z-Axis Vibration Prediction (Output 3)Used as Future Covariate
motor_temperatureThe temperature of the motor, indicating potential overheating or malfunction.YYYN
x_axis_vibrationsVibration measurement along the x-axis, reflecting mechanical stability.YYYN
z_axis_vibrationsVibration measurement along the z-axis, used to detect motor imbalances.YYYN
temp_rolling_meanThe simple rolling mean of motor_temperature computed over a fixed window that shifts incrementally.YNNN
temp_emaThe Exponential Moving Average of motor temperature, giving more weight to recent data points.YNNN
hourThe hour of the day, used to capture time-dependent behavior of the system.YYYY
weekdayThe day of the week, indicating potential variations in motor behavior by day.YYYY
is_weekendA binary indicator showing whether the data point falls on a weekend (True/False).YYYY
total_product
_quantity
The quantity of products being processed, which affects motor load and performance.YYYN
Table 2. Hyperparameters used for model training.
ParameterDescriptionValue
boosterIndicates the algorithm used to build decision trees during training.‘gbtree’
alphaControls L1 regularization on weights, helping to reduce model overfitting.1–2
gammaThreshold for minimum loss reduction before a split is made, promoting tree simplicity.0.3–0.4
n_estimatorsTotal number of boosting iterations or trees generated during model training.800–1000
colsample_bytreeRatio of features randomly selected for each tree, enhancing model diversity.0.4–0.6
min_child_weightMinimum required sum of instance weight (hessian) in a node, regulating model complexity.4–6
max_depthUpper limit on tree depth, used to control overfitting and enhance generalization.4–6
learning_rateControls how quickly the model adapts by scaling the weight updates.0.09–0.15
ObjectiveDefines the learning task along with the associated loss function to optimize.‘poission’
eval_metricPerformance indicator used to monitor model training progress and quality.‘rmse’
num_leavesSets the maximum number of terminal nodes per tree to manage complexity vs. accuracy.21–25
Disclaimer/Publisher’s Note: The statements, opinions and data contained in all publications are solely those of the individual author(s) and contributor(s) and not of MDPI and/or the editor(s). MDPI and/or the editor(s) disclaim responsibility for any injury to people or property resulting from any ideas, methods, instructions or products referred to in the content.