Abstract
Floods are considered one of the most devastating natural hazards, frequently resulting in substantial loss of lives and widespread damage to infrastructure. In the period of 4–7 September 2023, the region of Thessaly experienced unprecedented rainfall rates due to Storm Daniel, which caused significant flooding and many damages and fatalities. The southeastern areas of Trikala were among the many areas of Thessaly that suffered the effects of these rainfalls. In this research, a flood susceptibility assessment (FSA) of the broader area surrounding the settlement of Megala Kalyvia is carried out through the analytical hierarchy process (AHP) as a multicriteria analysis method, using Geographic Information Systems (GIS). The purpose of this study is to evaluate the prolonged flood susceptibility indicated within the area due to the past floods of 2018, 2020, and 2023. To determine the flood-prone areas, seven factors were used to determine the influence of flood susceptibility, namely distance from rivers and channels, drainage density, distance from confluences of rivers or channels, distance from intersections between channels and roads, land use–land cover, slope, and elevation. The flood susceptibility was classified as very high and high across most parts of the study area. Finally, a comparison was made between the modeled flood susceptibility and the maximum extent of past flood events, focusing on that of 2023. The results confirmed the effectiveness of the flood susceptibility assessment map and highlighted the need to adapt to the changing climate patterns observed in September 2023.
1. Introduction
River environments have always been vital in human history. Floodplains are often preferred by people to develop their settlements because they combine fertile land and a fresh water supply, which makes them suitable for agricultural work. Many studies [1,2,3] show the interpretation of these plains as complex systems between humans and water. Modern urban societies face challenges with frequent occurrences of widespread and flash floods due to heavy rainfall. The interaction between natural processes and human changes in land uses is globally recognized as a major factor contributing to the increase in the magnitude and frequency of these floods [4]. Before the 19th century, human activities focused on modifying river channels and land use for marsh restoration, agricultural expansion and flood protection. Subsequently, the era of urban development changed the landscape, affecting the morphology of floodplains and river channels, and causing channel narrowing and diversion, loss of natural soils and transformations in coastal alluvial plains [5].
Thessaly Plain is a closed geomorphological environment surrounded by mountain ranges and drained by the Peneus River and its tributaries [6]. The western area of Thessaly is an alluvial plain of great extent which mainly occupies the borders of the regional units of Trikala and Karditsa [7]. In the period from 1976 to 2010, 146 floods were recorded in the drainage basin of Peneus [8]. However, one of the most catastrophic events in this basin occurred in 1907 in Trikala, [9] with the number of losses estimated as at least 300 human lives [10]. More recent serious flooding events in the area were in the periods of 21–26 February 2018 [9] and 17–20 September 2020 with the rainfall of the Mediterranean hurricane Janus flooding the area of Megala Kalyvia located southeast of Trikala [7]. In the period 4–7 September 2023 the region of Thessaly was affected by extreme weather phenomena due to Storm Daniel, resulting in floods that caused damage in an area of more than 700 km2 [11]. Furthermore, in the Peneus River delta of Thessaly, modifications of the river and human-driven land use changes have drastically changed the hydrological system, increasing the potential for flooding in the region [12].
Thus, the need for effective decision-making tools [13] in disaster management becomes evident. Accordingly, flood hazard assessment is mainly covered in the literature by methods that incorporate physically based hydrodynamic models [1,4], GIS-based spatial analysis [8], and multicriteria methods, such as AHP [14,15].
Well-known tools, like MIKE FLOOD [16] and HEC-RAS [17], are often utilized for hydrodynamic and hydrologic models and focus on floodplain modeling and river hydraulics. Moreover, 2DEF [4] and MIKE 21 [1,18] are 2D hydrodynamic models which require extensive input and technical setup for areas with a spatially explicit nature and physically based processes. For instance, on very irregular topographies, 2DEF uses a statistical sub grid approach for accurate and stable treatment of drying and wetting processes. The combination of this model with a geostatistical method can be applied to define the surface water connectivity across floodplain areas. In addition, MIKE 21 can be used to investigate the flow characteristics of transition zones or to reproduce the effects of floodplain topographies on hydrological regimes. Despite their accuracy, these models demand complex technical setup and large-scale data. This involves hydrometeorological data (e.g., wind, rainfall), hydrological data (e.g., water level, river discharge), boundary conditions, and a high-resolution DEM. Additionally, the setup of these methods often requires numerical configuration, like drying or wetting thresholds and statistical calibration. In general, the use of these models involves data-heavy cases which are technically more complex, and the area coverage is representative of large regions or nations. The application of these types of models to simpler cases, like the broader area of Megala Kalyvia, is not suitable, given the small scale, consisting primarily of floodplain, with no presence of wetland zones.
Flood susceptibility represents the inherent predisposition of a region to experience flooding, determined solely by its physical characteristics, regardless of the frequency of such events [19]. While the term flood hazard refers specifically to the threat associated with floods of particular frequency and magnitude to a designated location [20]. To address these challenges, an efficient approach is to perform a flood susceptibility assessment by selecting areas at risk based on static physical attributes, excluding the probability or frequency for particular flood occurrences.
Over the past two decades, GIS has been used in many spatial analyses [21,22] and has played a significant role in disaster analysis and management [23,24,25]. Natural disasters, such as flash flood and droughts, can be monitored in real time through GIS and remote sensing (RS) techniques [13,26], while early warning systems are enhanced by GIS and damage assessment can be conducted quickly. A GIS technology example is when floodplain officials use it to identify the areas of their communities that will flood [27]. This is achieved by recording geographic information in a database and then allowing it to be displayed and searched graphically using a GIS for analysis. Thus, flood-prone locations are identified or targeted for mitigation by intersecting or overlaying different geographic layers within the GIS environment [14]. The main benefit of applying GIS in flood research is that it provides a visual representation of the flood and enables further analysis in damage assessment [28]. Finally, small-scaled flooded areas with limited data benefit from GIS-based methods because they can integrate spatial datasets and effectively visualize susceptibility zones.
Multicriteria analysis (MCA) is a general term used for various tools and techniques that formally incorporate multiple decision criteria and objectives in problem analysis, rather than a single specific method [29] and is one of the most commonly used approaches for assessing areas prone to flooding [30,31]. One of the methods that falls under the spectrum of multicriteria analysis is the analytical hierarchy process (AHP) which was developed in the 1980 by Saaty [32]. It is a mathematical model that involves prioritizing the parameters included by groups or individuals and then evaluating different scenarios with quantitative and qualitative criteria. One of the advantages of the method is its robustness and scalability [33]. Decisionmakers can adjust the value of a criterion by adding or removing criteria they consider relevant or irrelevant. Thus, without repeating the entire established hierarchy, they are given the possibility to examine only the part of the assessment they had previously carried out [14]. However, the main weakness of the method is its inability to determine the inherent ambiguities of spatial decision-making processes. This mainly occurs during the process of the selection, comparison, and evaluation of various criteria [34]. Moreover, despite acknowledged limitations, such as rank reversal [32], the crisp AHP technique was chosen due to its simplicity, clarity, and suitability for small-scale floodplain research with minimal data needs. Despite the introduction of fuzzy variations to address issues, such as rank reversal, these alternatives may demonstrate diminished internal consistency under specific circumstances, as previously discussed by Saaty [32]. Consequently, the classical approach was more sufficient due to the restricted data, defined structure, and limited scope of the research.
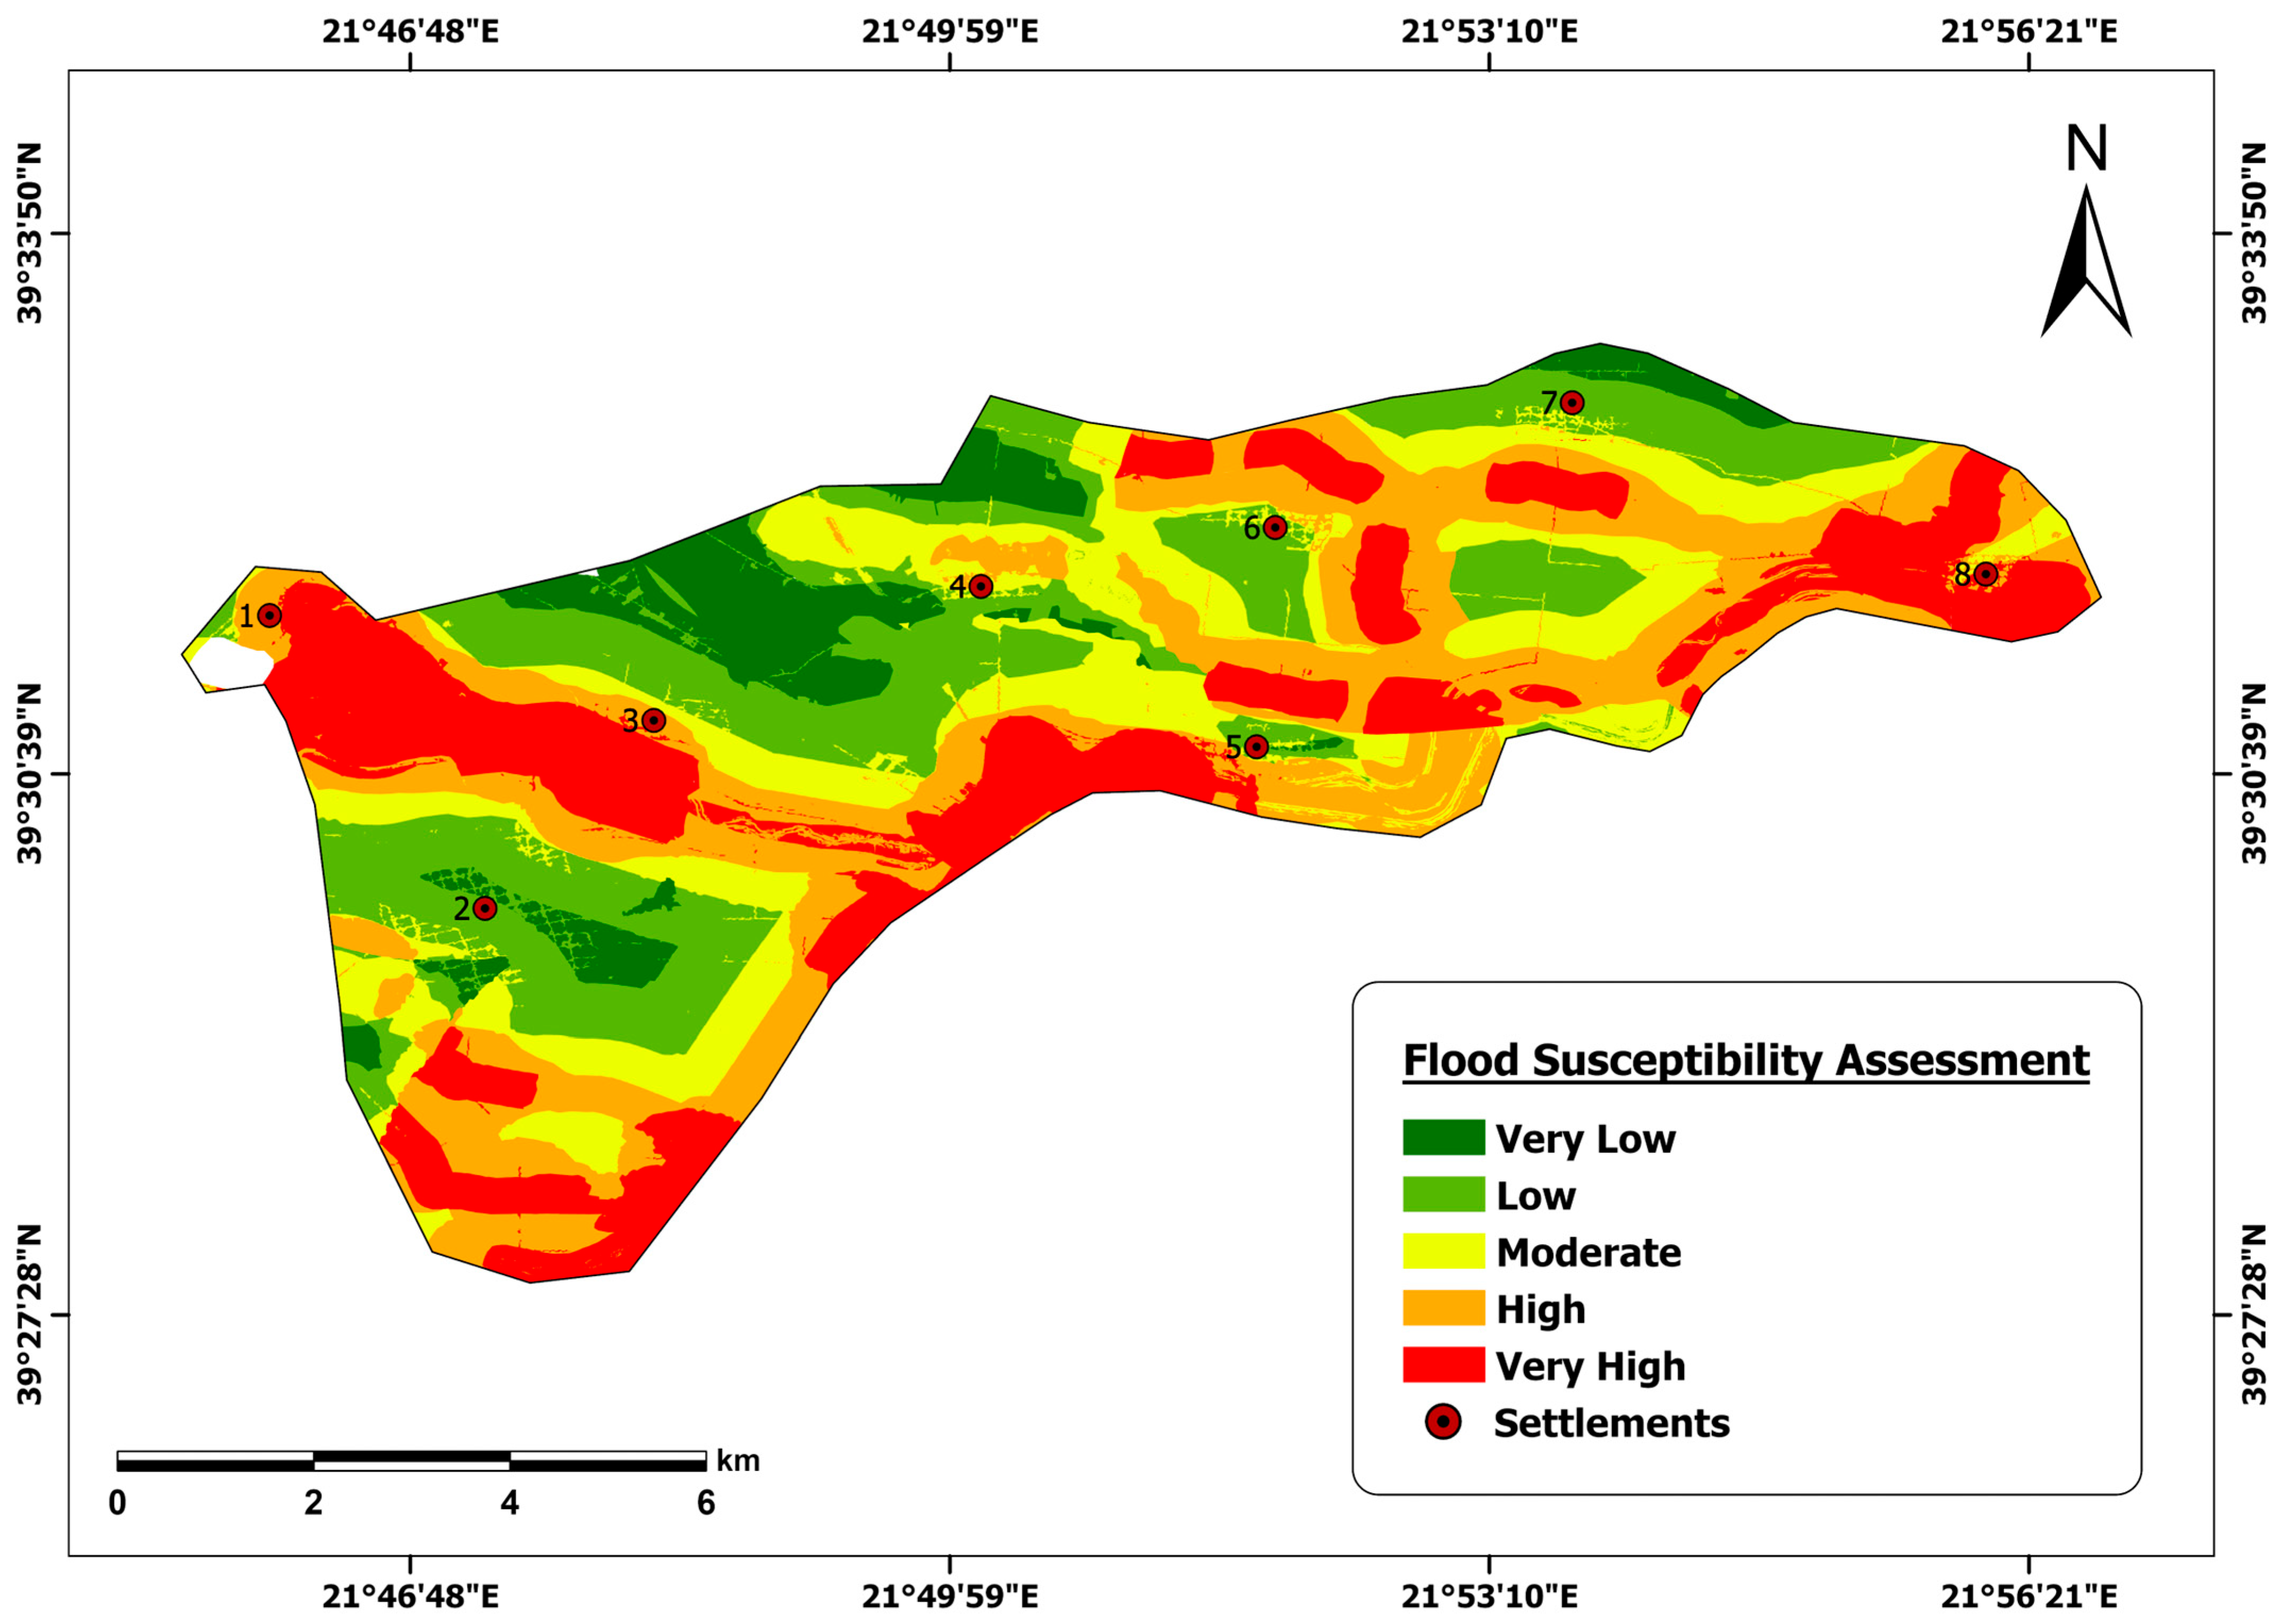
In this work, the FSA was implemented in the broader area of Megala Kalyvia through GIS analysis. The model includes seven condition factors, namely distance from rivers and channels, drainage density, distance from confluences of rivers or channels, distance from intersections between channels and roads, land use–land cover, slope, and elevation. With the use of the AHP method, these factors were weighed and integrated within the GIS environment to generate a flood susceptibility assessment map, providing a clear vision of areas most prone to flooding. Consequently, there is a comparison with historical flood data for this analysis, particularly focusing on the events of flooding during 2018, 2020, and 2023. The comparison focuses on the area afflicted by these floods, analyzing the extent of the influenced region and establishing the proportion of this area that coincides with the zones identified by the flood susceptibility assessment map. The flood susceptibility was classified as high and very high across 24.63% and 21.87% of the study area, respectively. The comparison of these zones with the previous flood events highlighted the reliability of the flood susceptibility map prediction. The analysis showed that, in 2018, the areas of high and very high risk covered 71.74% of the flood susceptibility map, while in 2023, the high and very high flood susceptibility zones corresponded to 24.16% and 21.75% of the flooded area, respectively.
This approach estimates the pre-flood conditions, preventing losses from future floods in the broader area of Megala Kalyvia. The study was conducted on this area in view of the two destructive flood events of September 2023 and the high flood susceptibility indicated in previous events which served as a trigger for targeted field studies. In contrast to other similar studies for the Peneus basin [8,35], the current research focused on a smaller, low-slope area (69.6 km2) surrounded by tributaries. This localized methodology can support site-specific planning and risk identification, particularly for other flood-prone areas in Thessaly. Furthermore, the implementation of GIS-AHP with the addition of exclusively natural factors in the assessment of flood susceptibility is less common in similar approaches [15,33,36,37,38], which are based on a mix of anthropogenic and natural criteria and focus on larger basins. In contrast to other studies that focus on mixed criteria and larger areas, this research demonstrates a distinct approach by employing the AHP-GIS methodology, primarily using natural factors in a small-scale area with real recorded flood events, and validates the flood susceptibility map by comparing prior flood observations and field data measurements (2023).
2. Study Area
2.1. Location and Characteristics
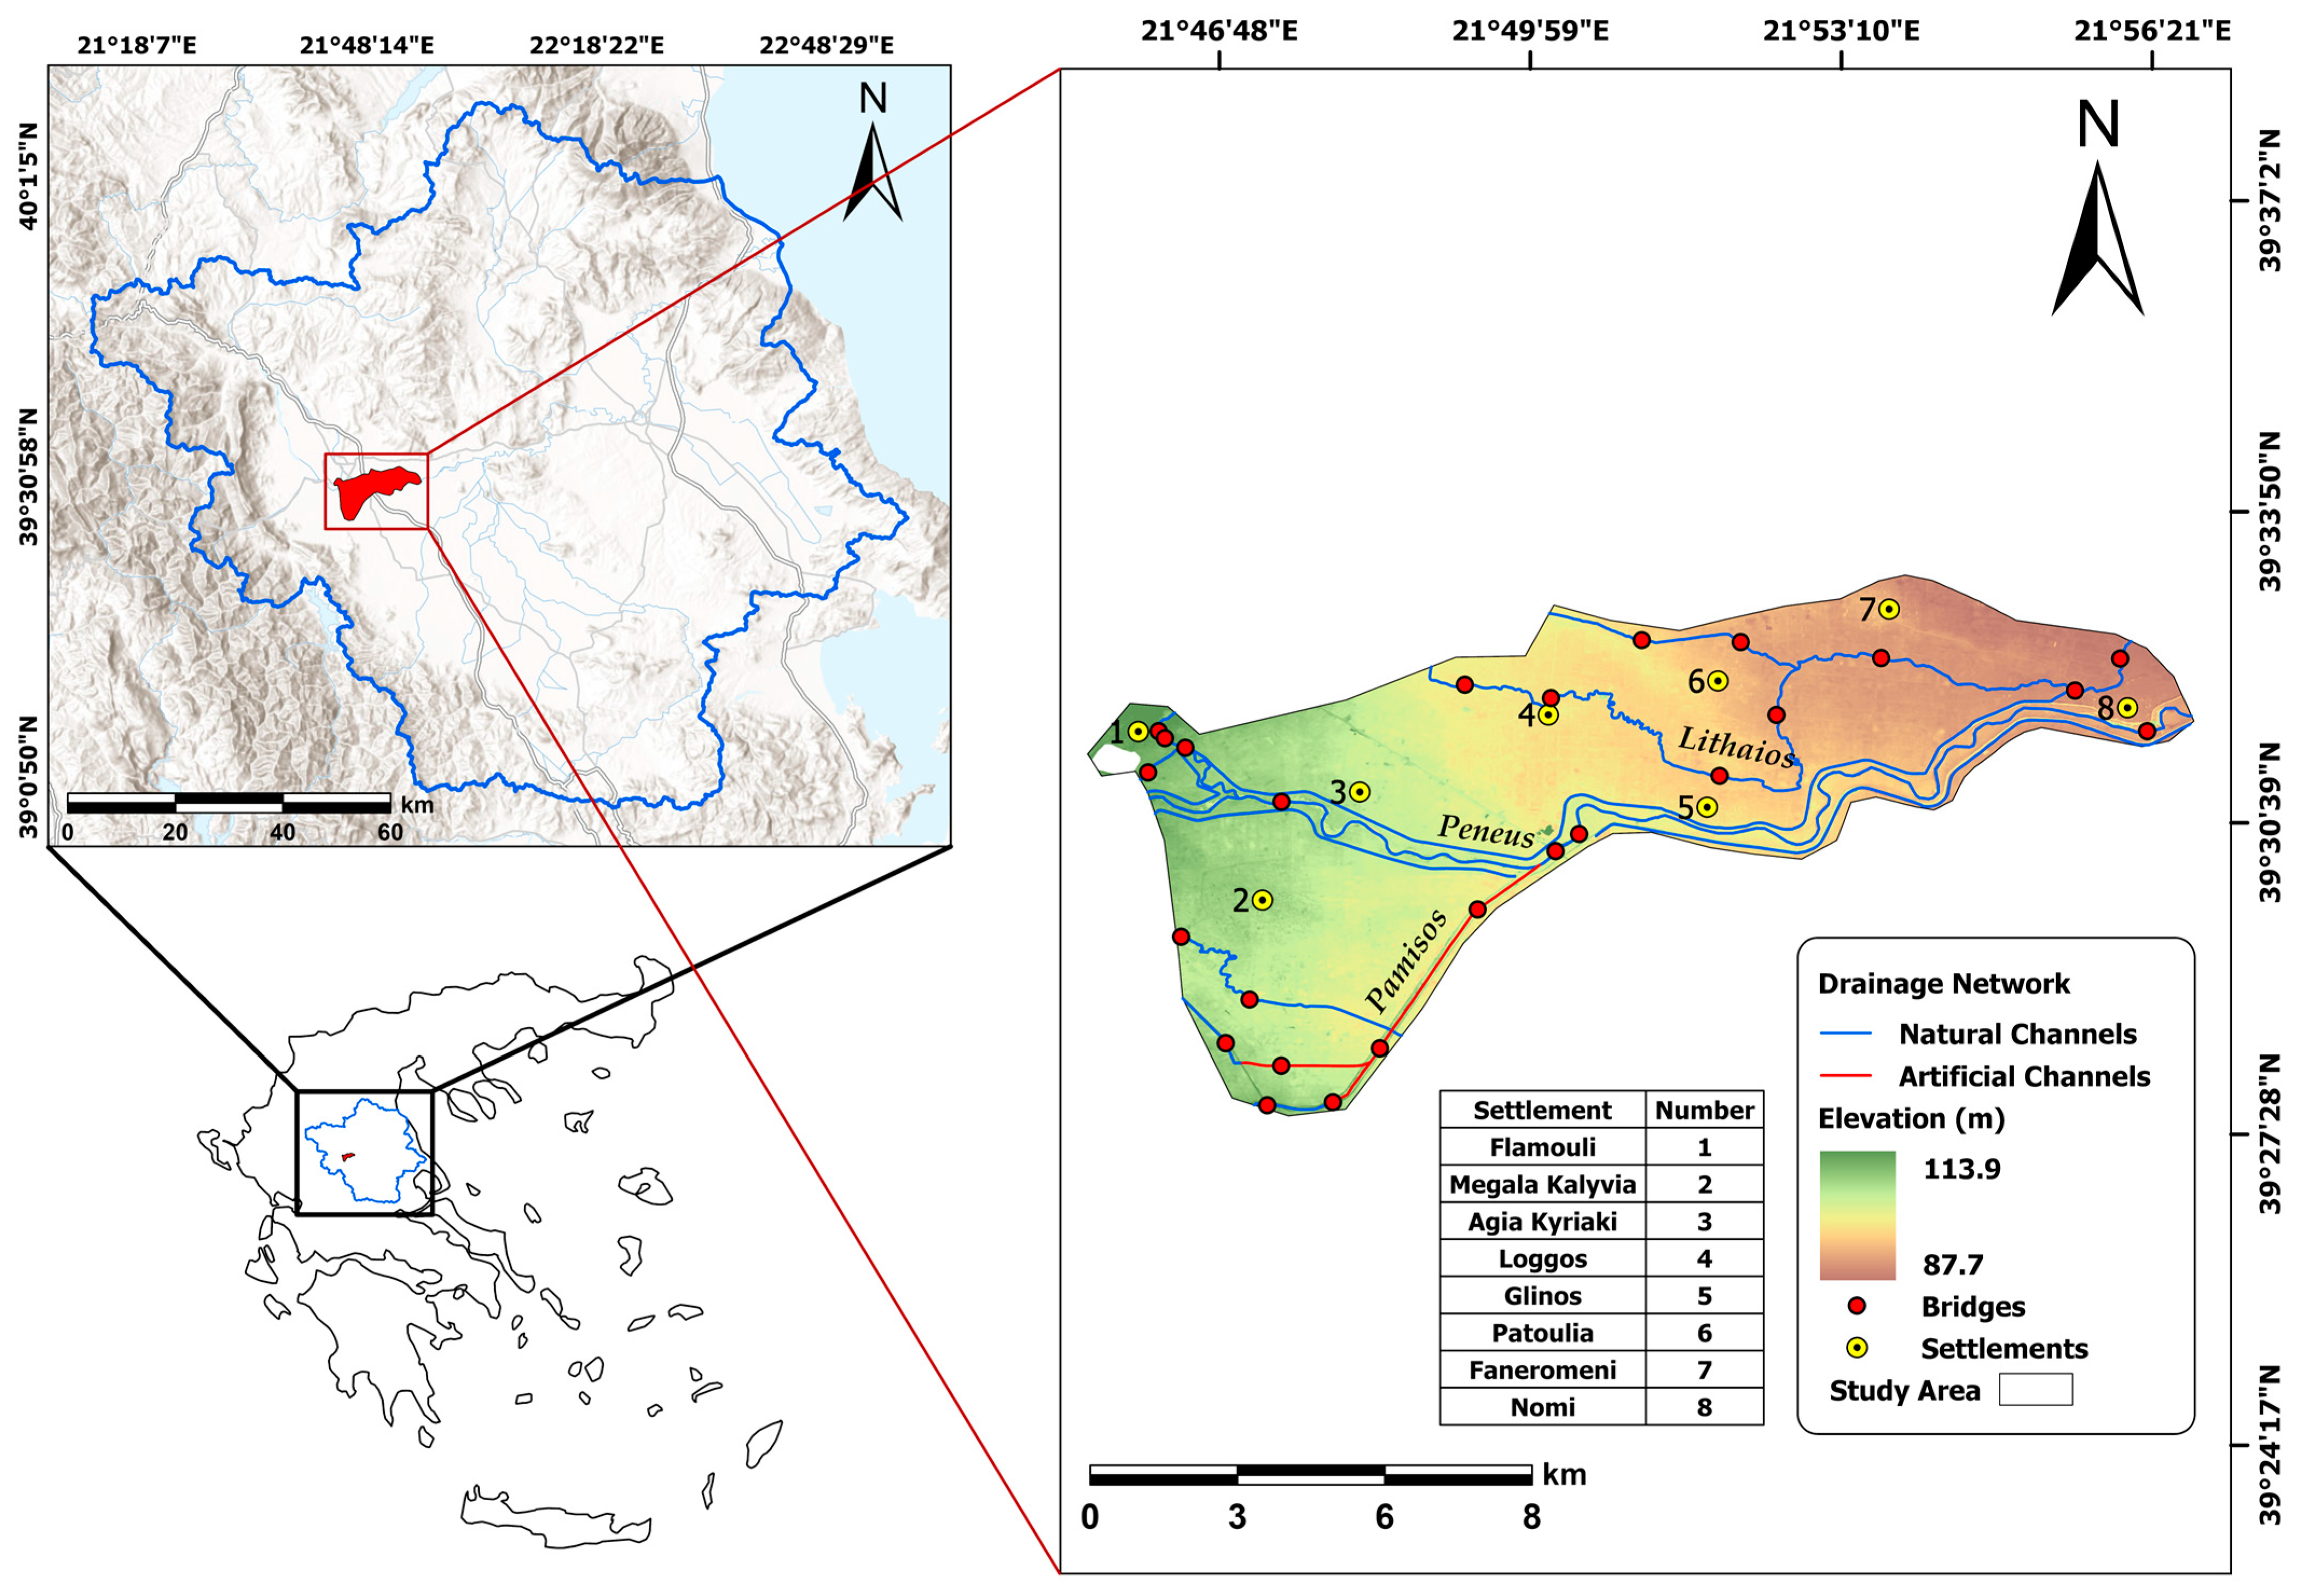
The study area is in the western part of the alluvial plain of Thessaly to the southeast of Trikala city (Figure 1), between latitudes 39°55′31.86″ and 39°46′09.52″ and longitudes 21°75′75″ and 21°94′64″. It belongs to the hydrological basin of the Peneus River and consists exclusively of unconsolidated alluvial sediments [39]. The main rivers flowing through it are the Peneus, Lithaios, and Pamisos, while its perimeter measures 45.3 km, covering an area of 69.6 km2. Its altitude ranges from 87.7 m to 113.9 m above sea level.
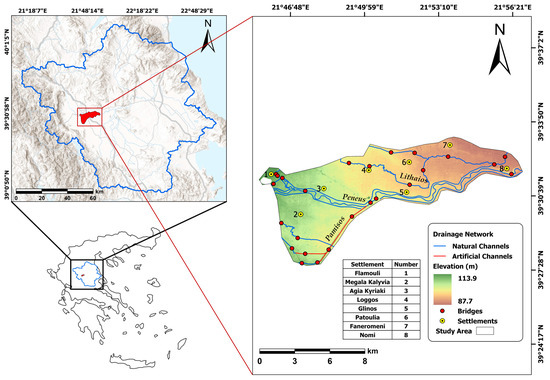
Figure 1.
Location of the study area and broader area of Megala Kalyvia, Greece.
One of the factors contributing to the flood susceptibility of the area is the features of the surrounding landscape. Upstream, the topographic gradients are high, and downstream, the area is surrounded by cultivated land. This affects the delivery of sediments to the rivers [36], resulting in the conversion of rainfall into runoff. Additionally, the dynamics of such sediments contribute greatly to flood events, as when there is movement of sediment with water from the main channel, it is deposited across the floodplain and there is a change in the channel capacity [40]. Thus, the risk of flooding increases and the water retention time in the area is extended.
Finally, another key element in sensitivity to flood events in the area is an anthropogenic alteration of the river channel southwest of Megala Kalyvia [7], where the Pamisos flows into the Peneus River. The timeline of this diversion is estimated within the period of 1940–1950. With its large hydrological change, this might have resulted in changes in the groundwater levels and the shape of riparian zones. Furthermore, an alteration to the water flow can create changes in sediment deposition downstream and, as a result, in erosion patterns [41].
2.2. Overview of Recent Flood Events
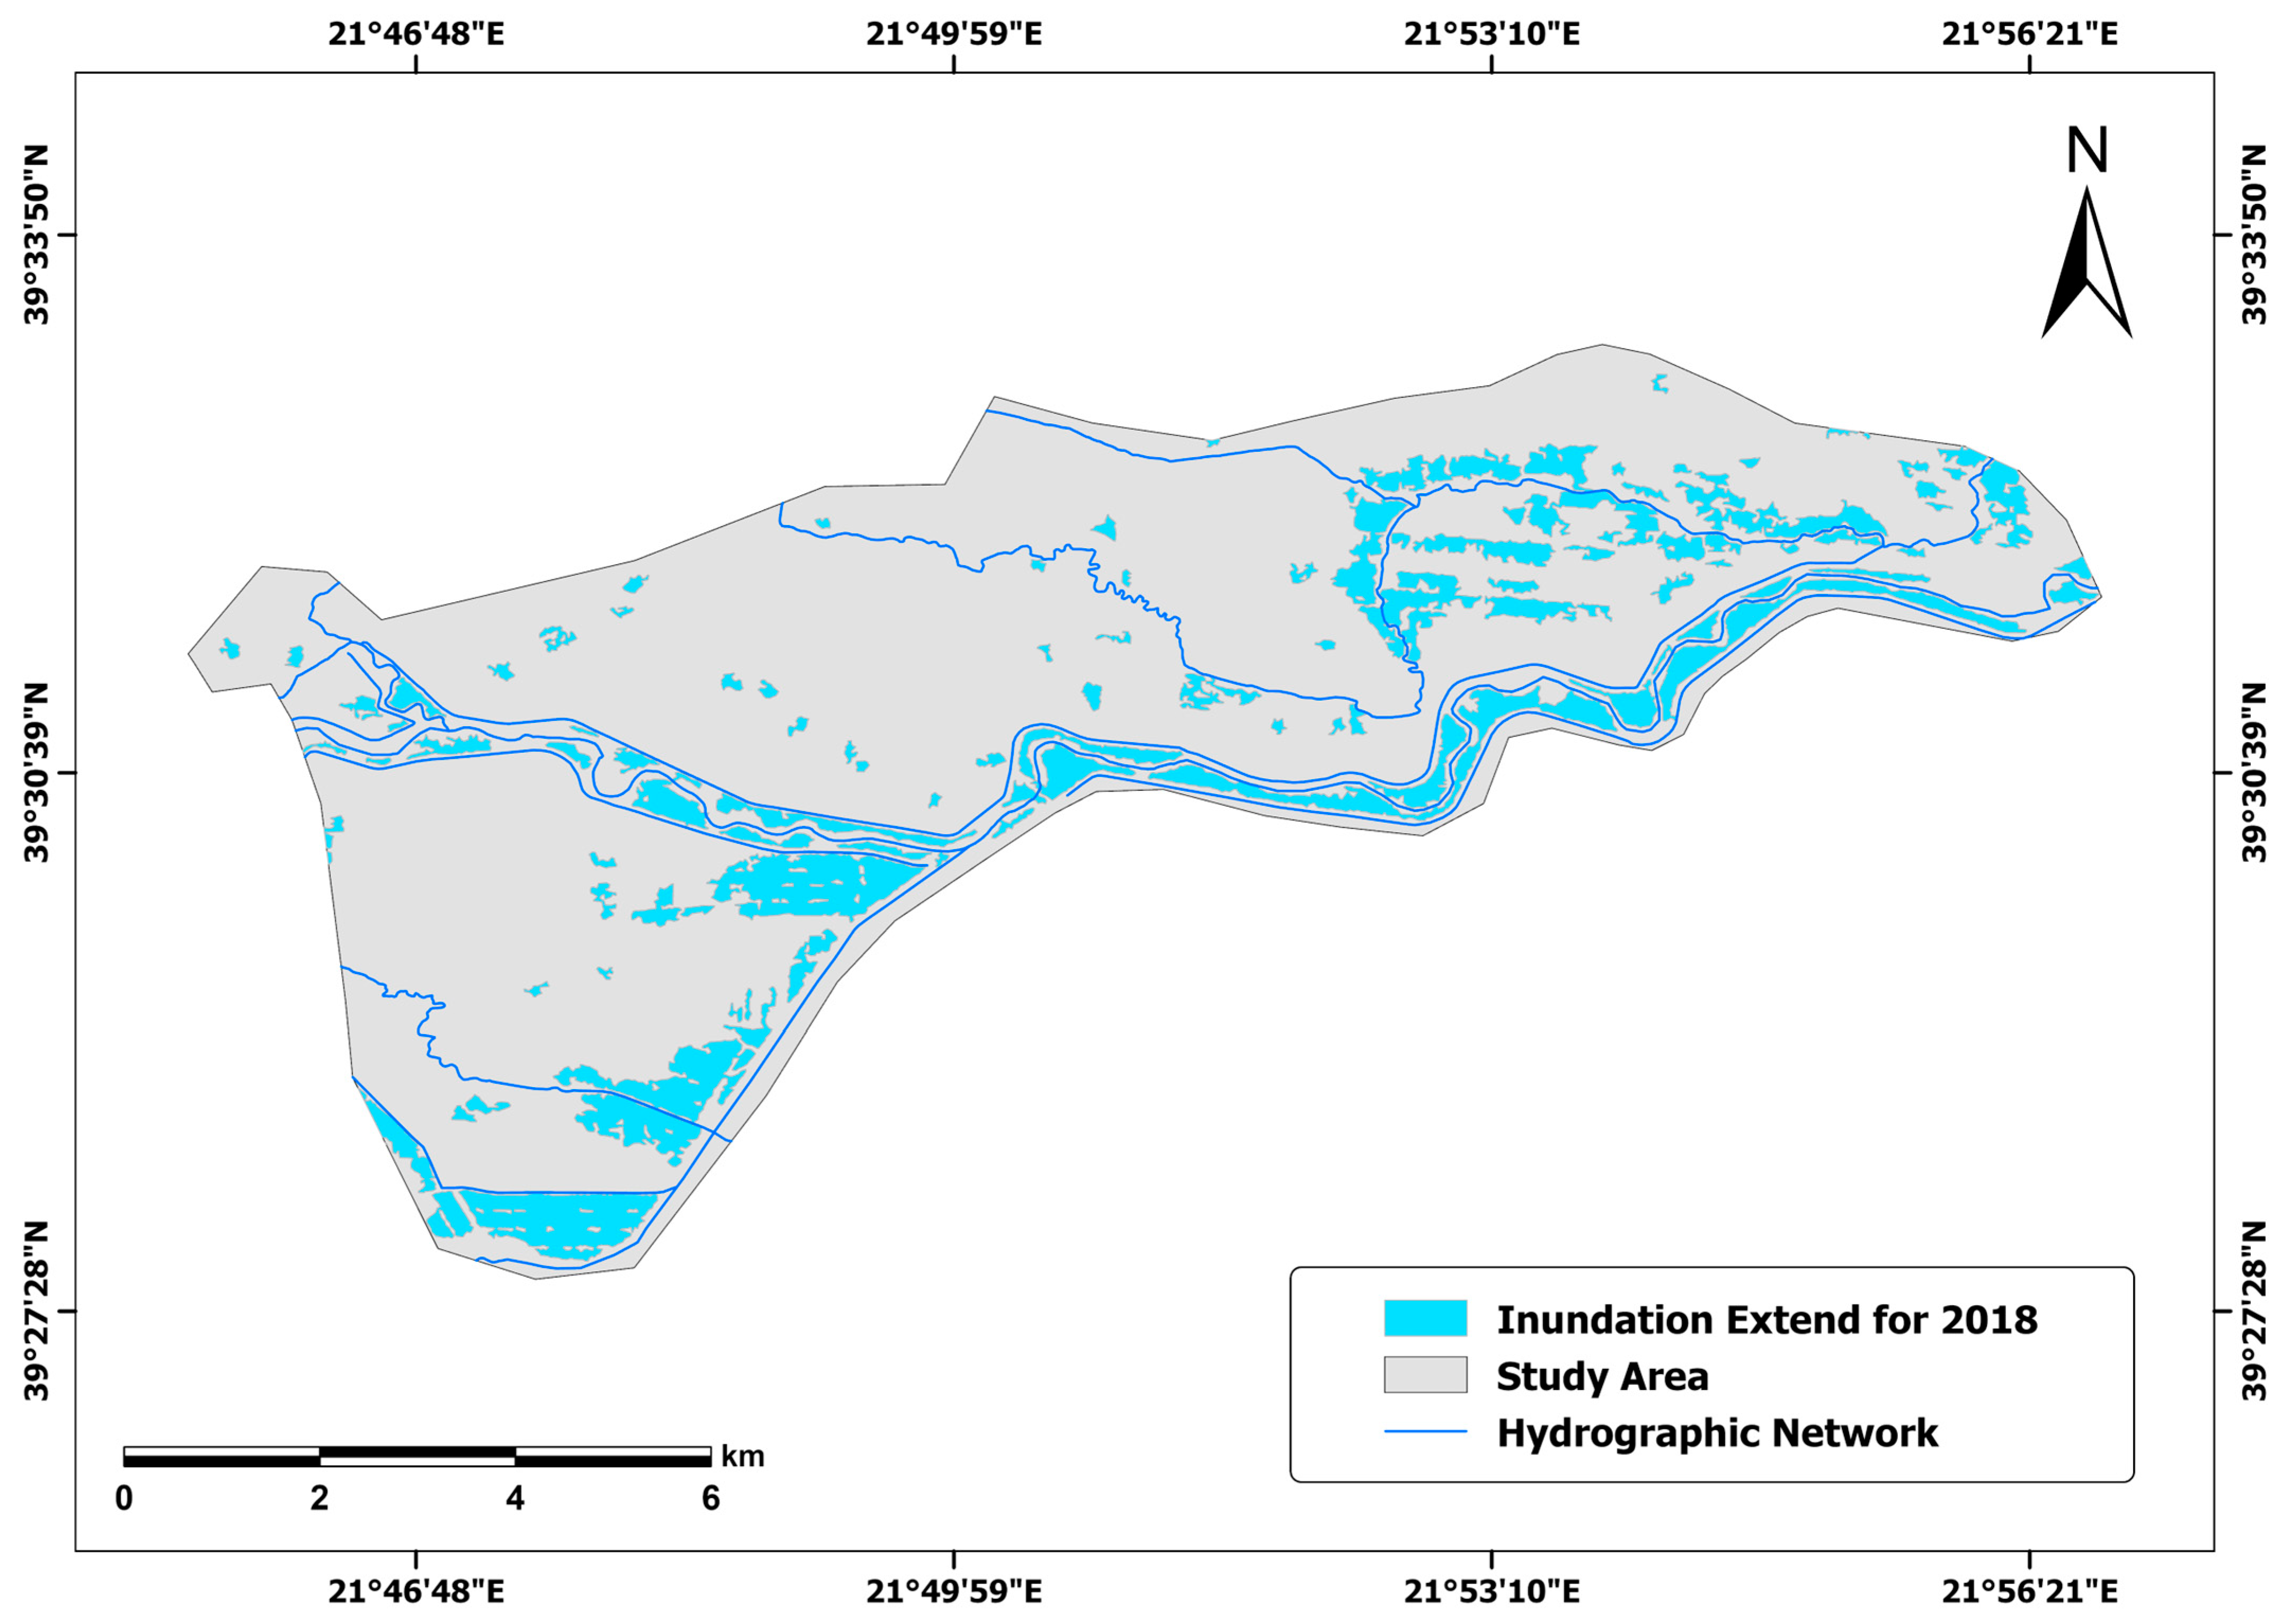
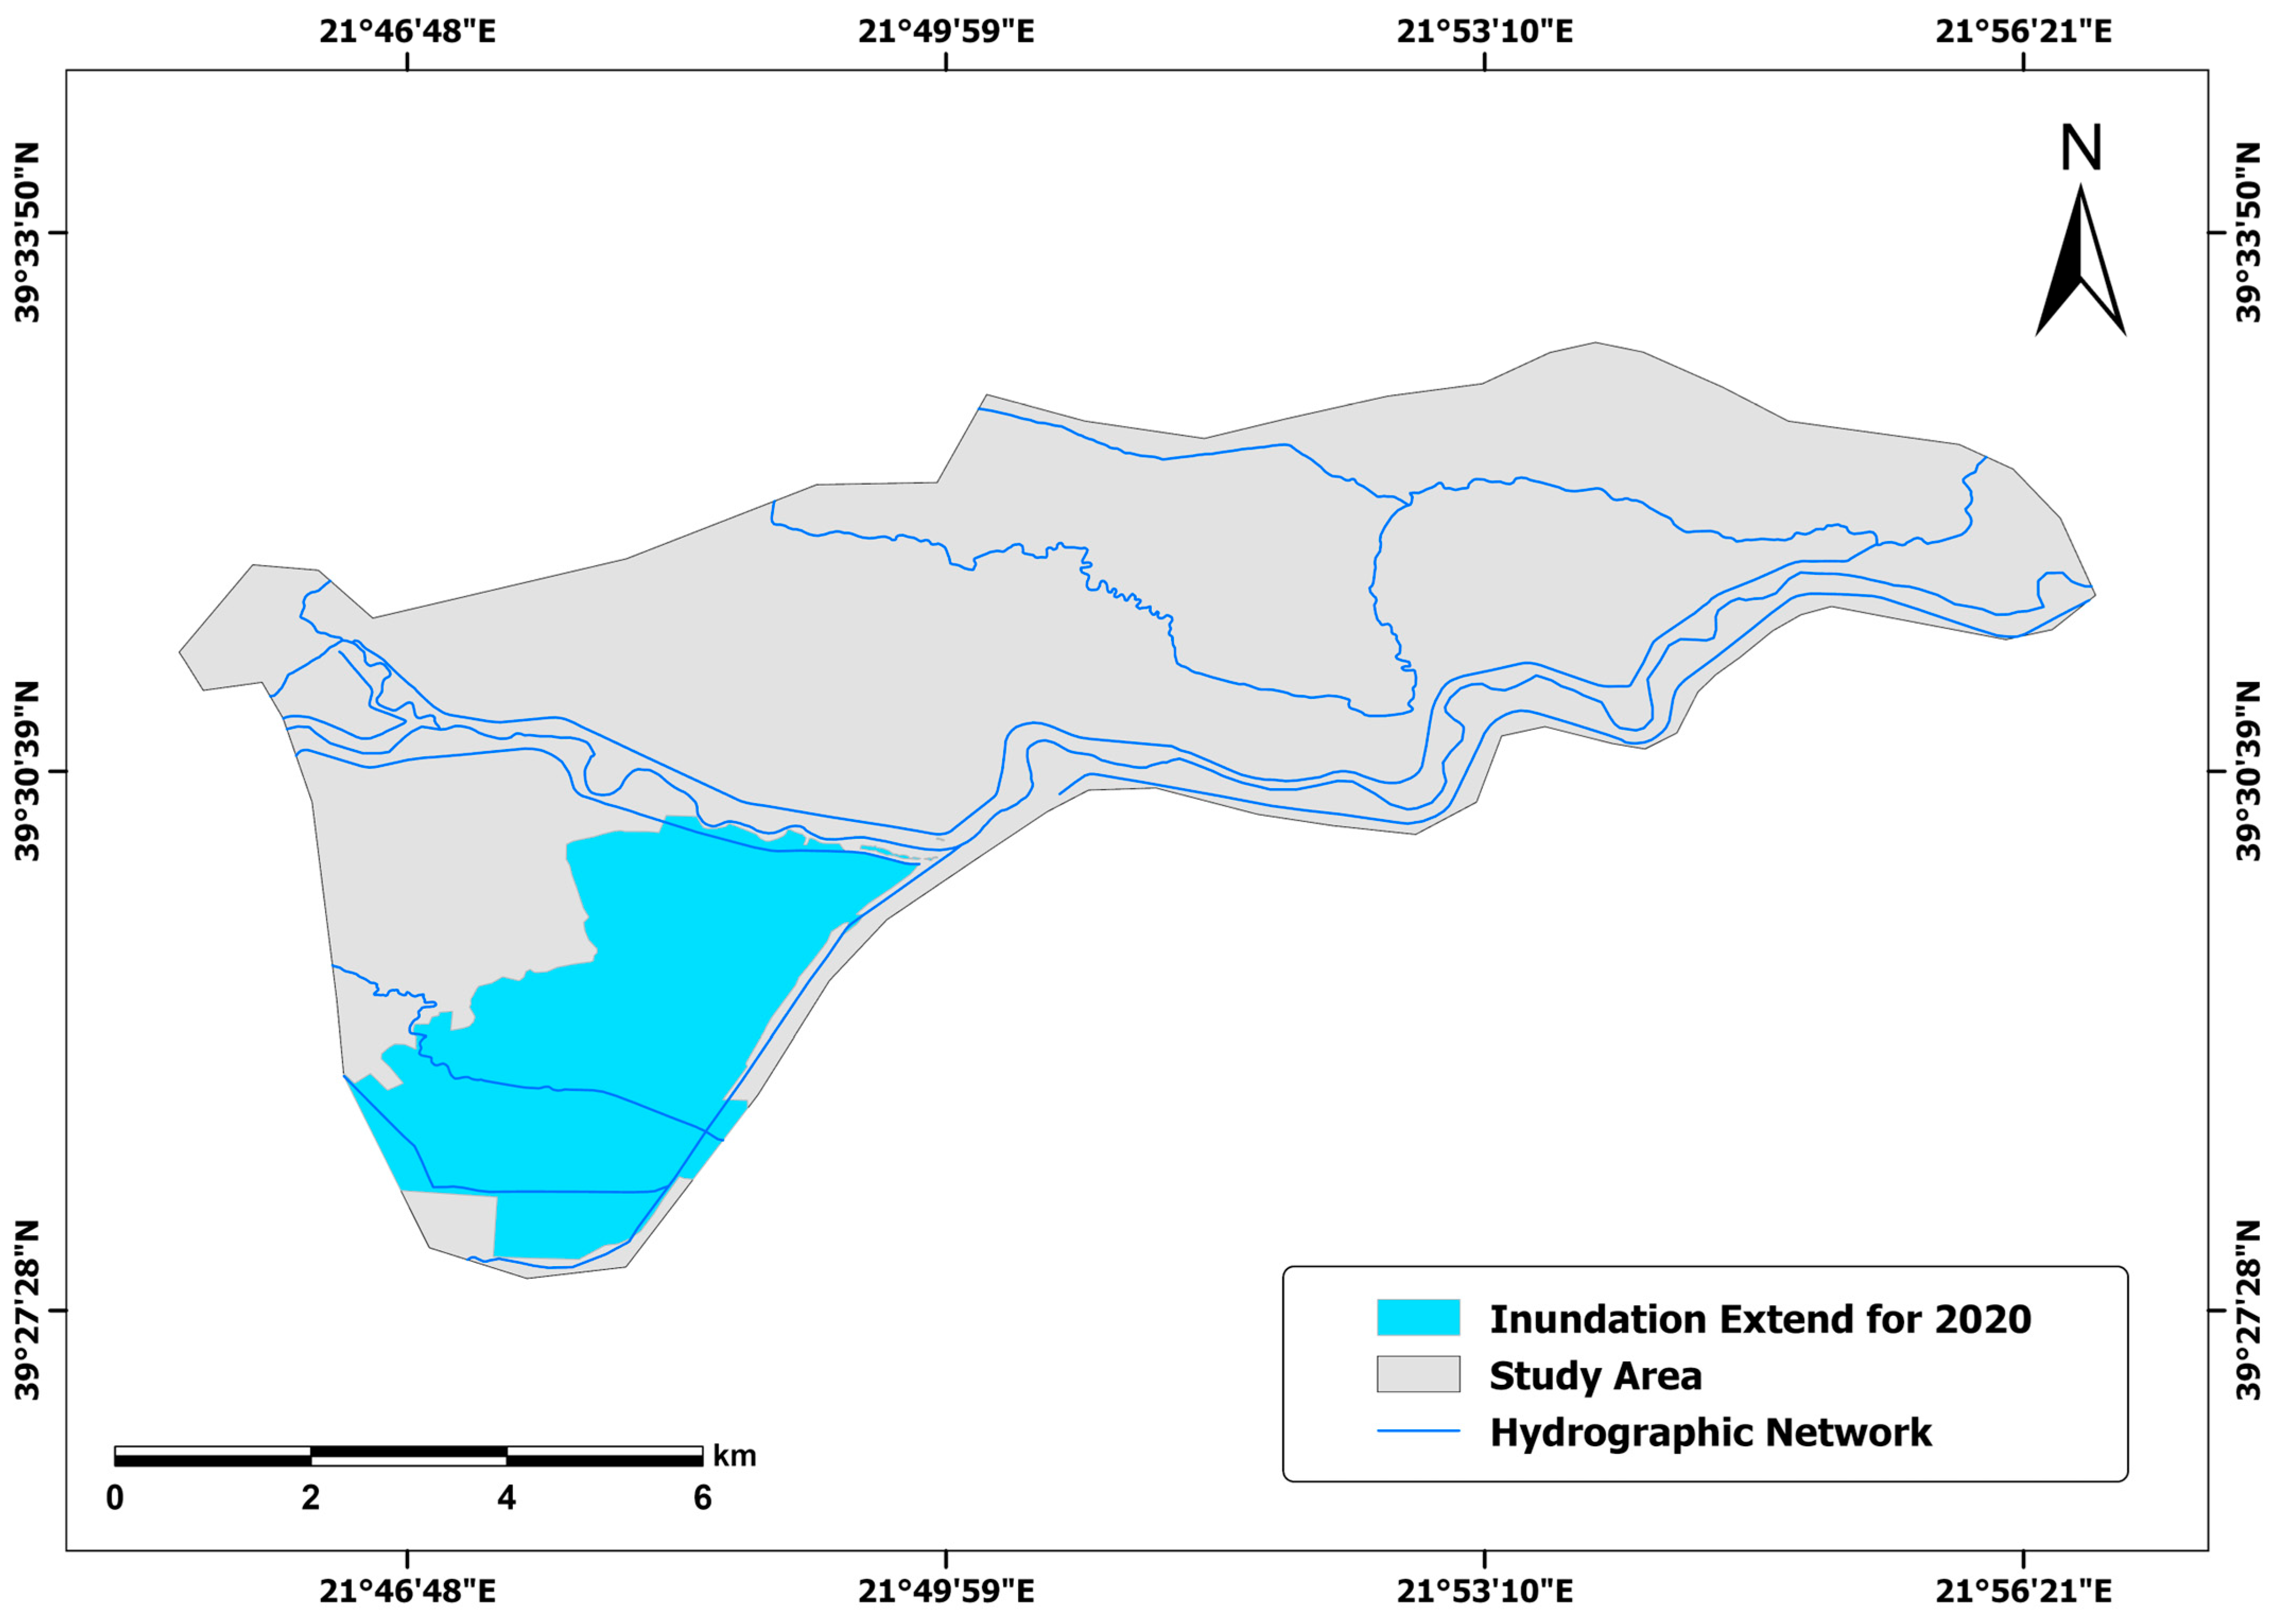
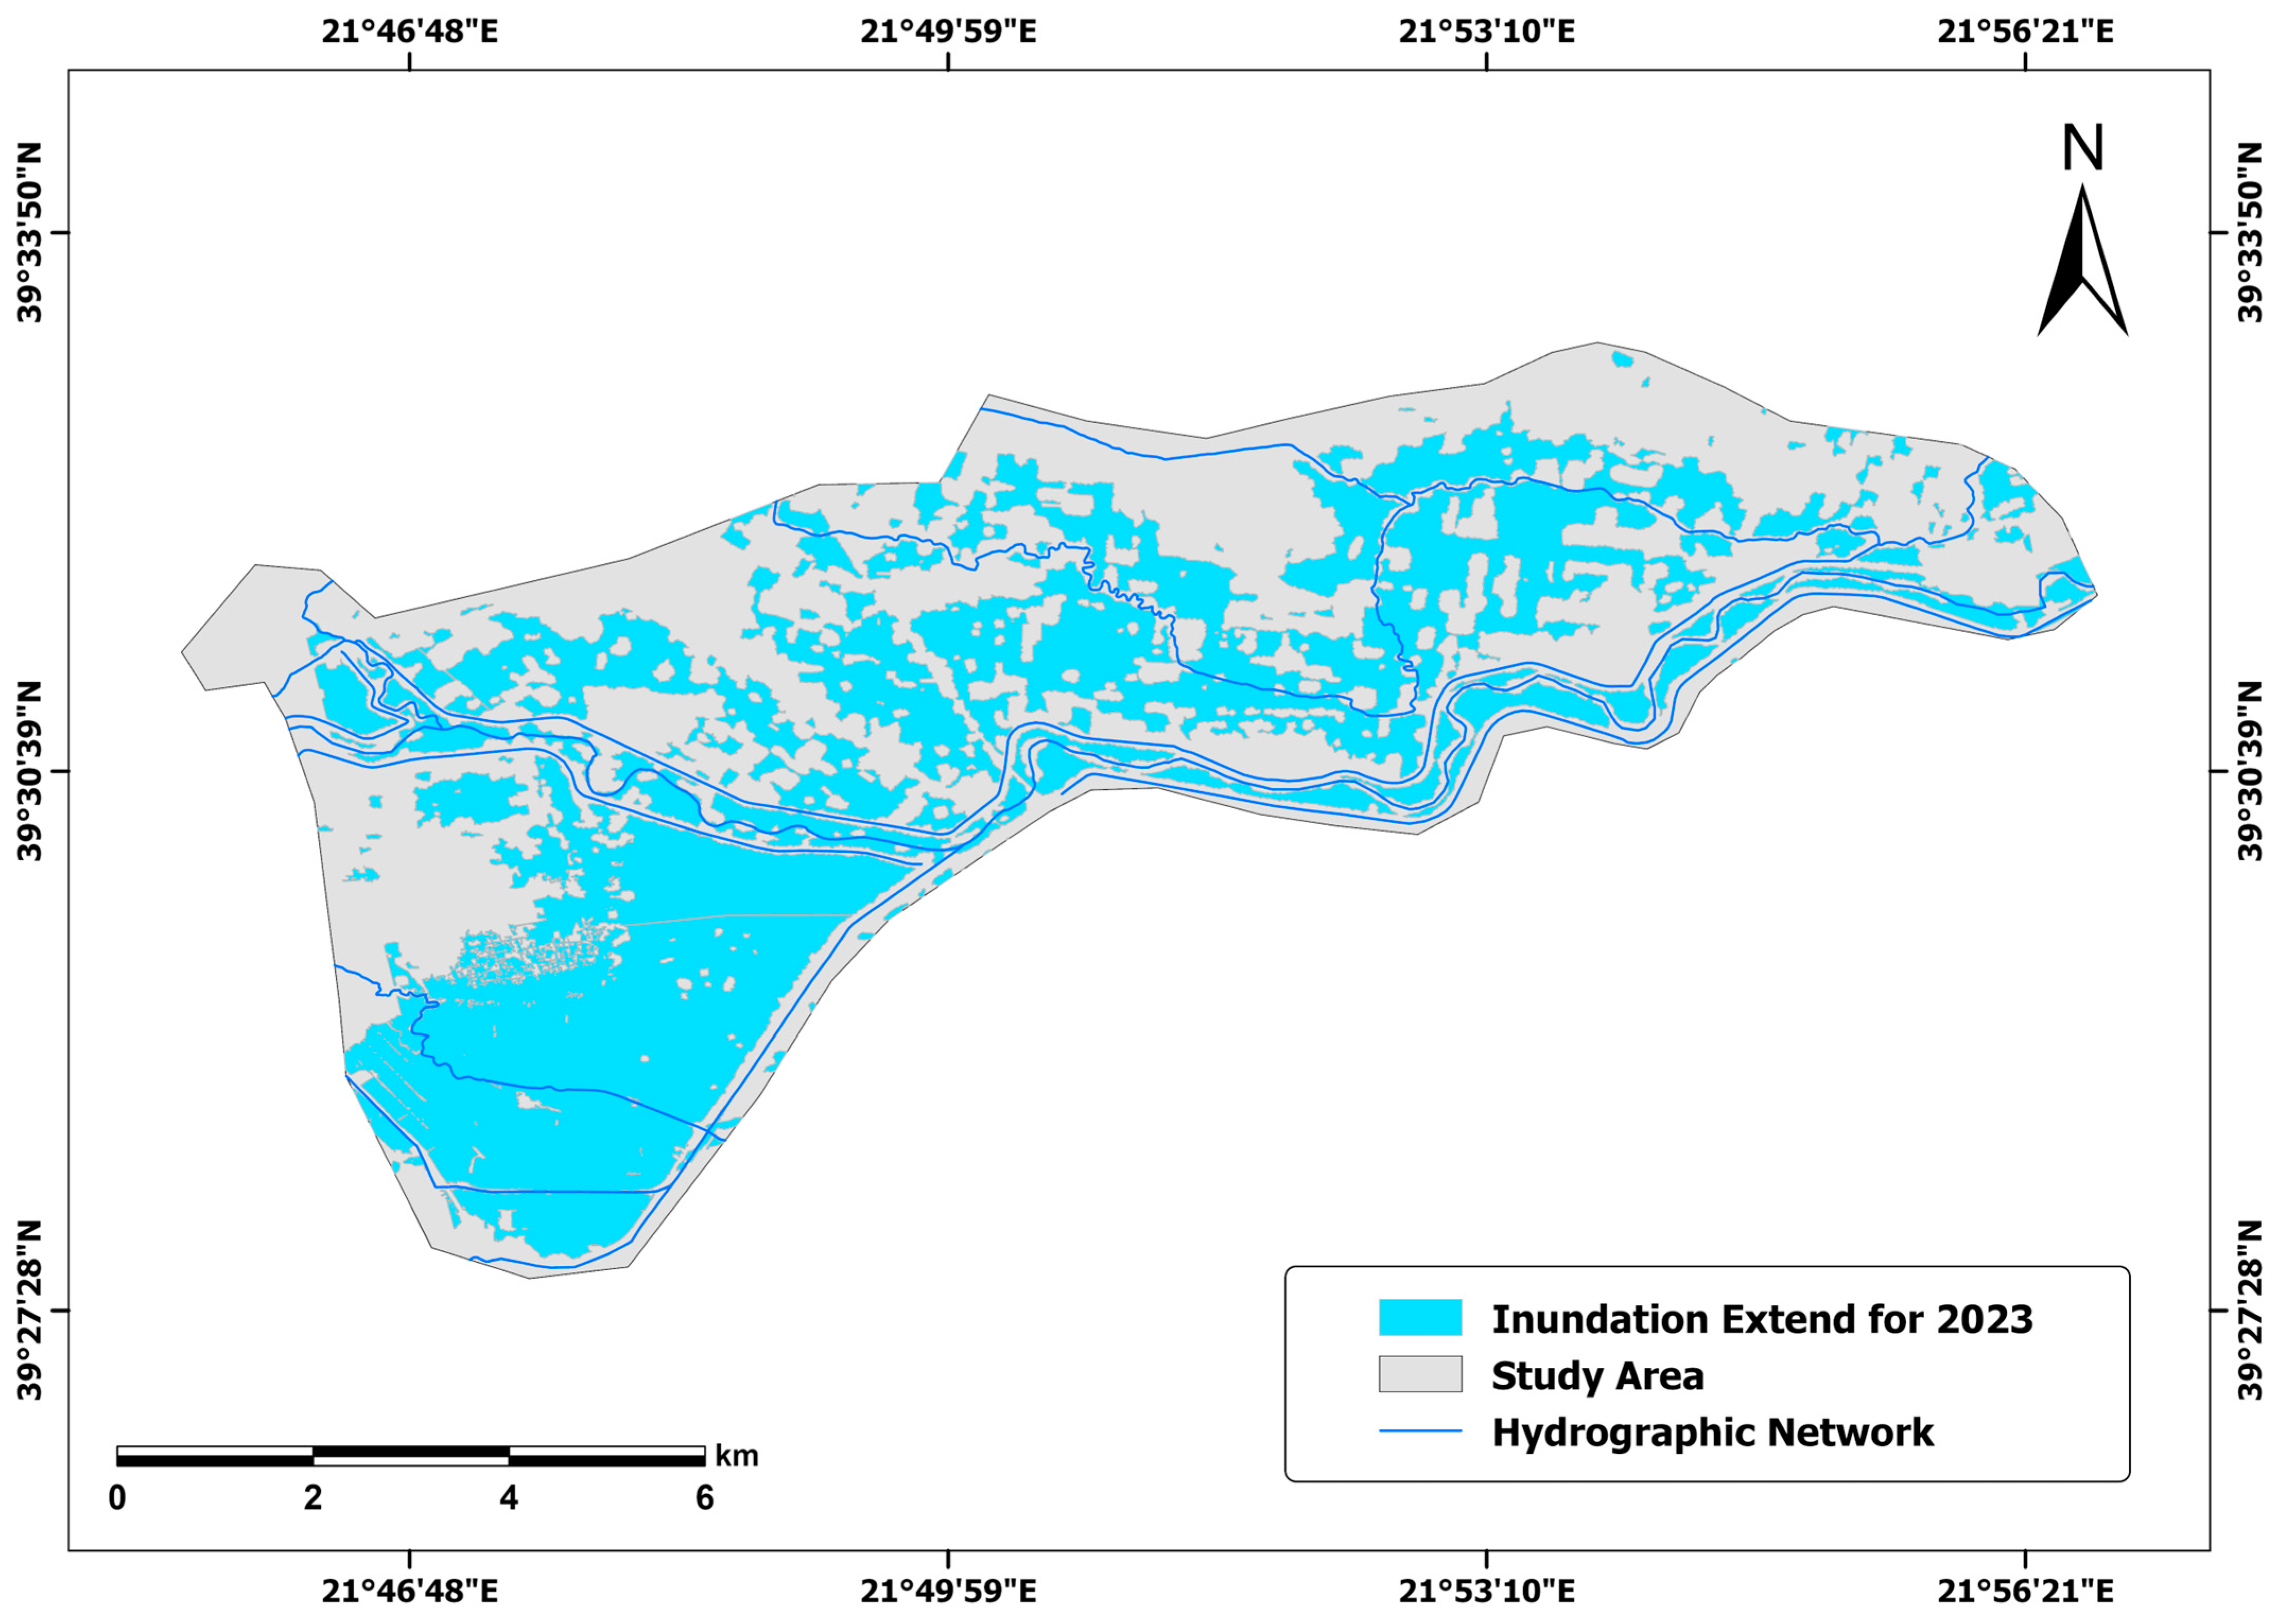
The study area has experienced several flooding events in recent years. Specifically, from 21–26 February 2018 [42], the flood affected approximately 14.3% (9.96 km2) of the area (Figure 2). This was followed by another flood during the Medicane Janus from 17–20 September 2020 [43], which affected 16.3% (11.4 km2) of the area (Figure 3). More recently during Storm Daniel, in the period from 4–7 September 2023 [44], 45% (31.5 km2) of the area was submerged (Figure 4). Additionally, during the period of 25–28 September 2023, Storm Elias [45] affected further the area, with a total precipitation of 143 mm [46].
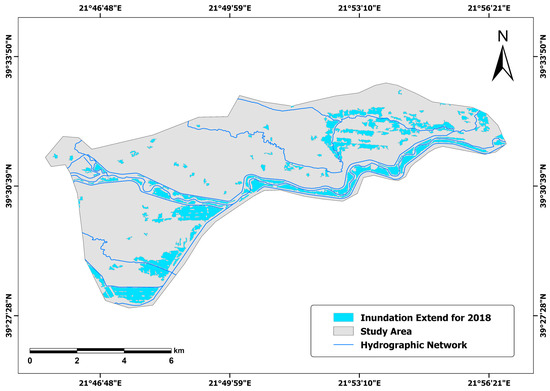
Figure 2.
Inundation extend in the study area during February 2018 [47].
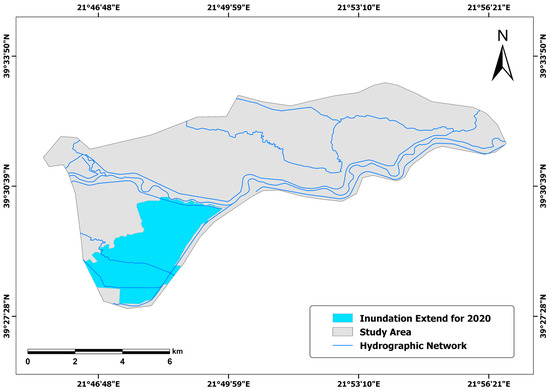
Figure 3.
Inundation extend in the study area during September 2020 [48].
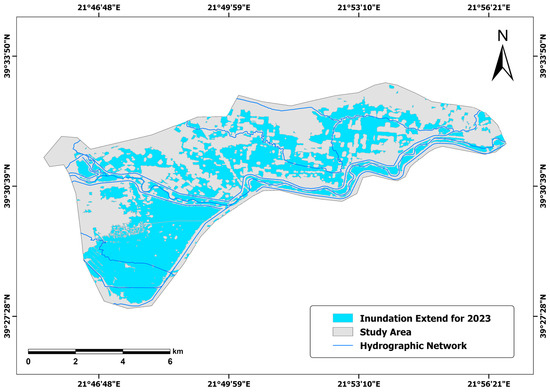
Figure 4.
Inundation extend in the study area during September 2023 [49].
3. Materials and Methods
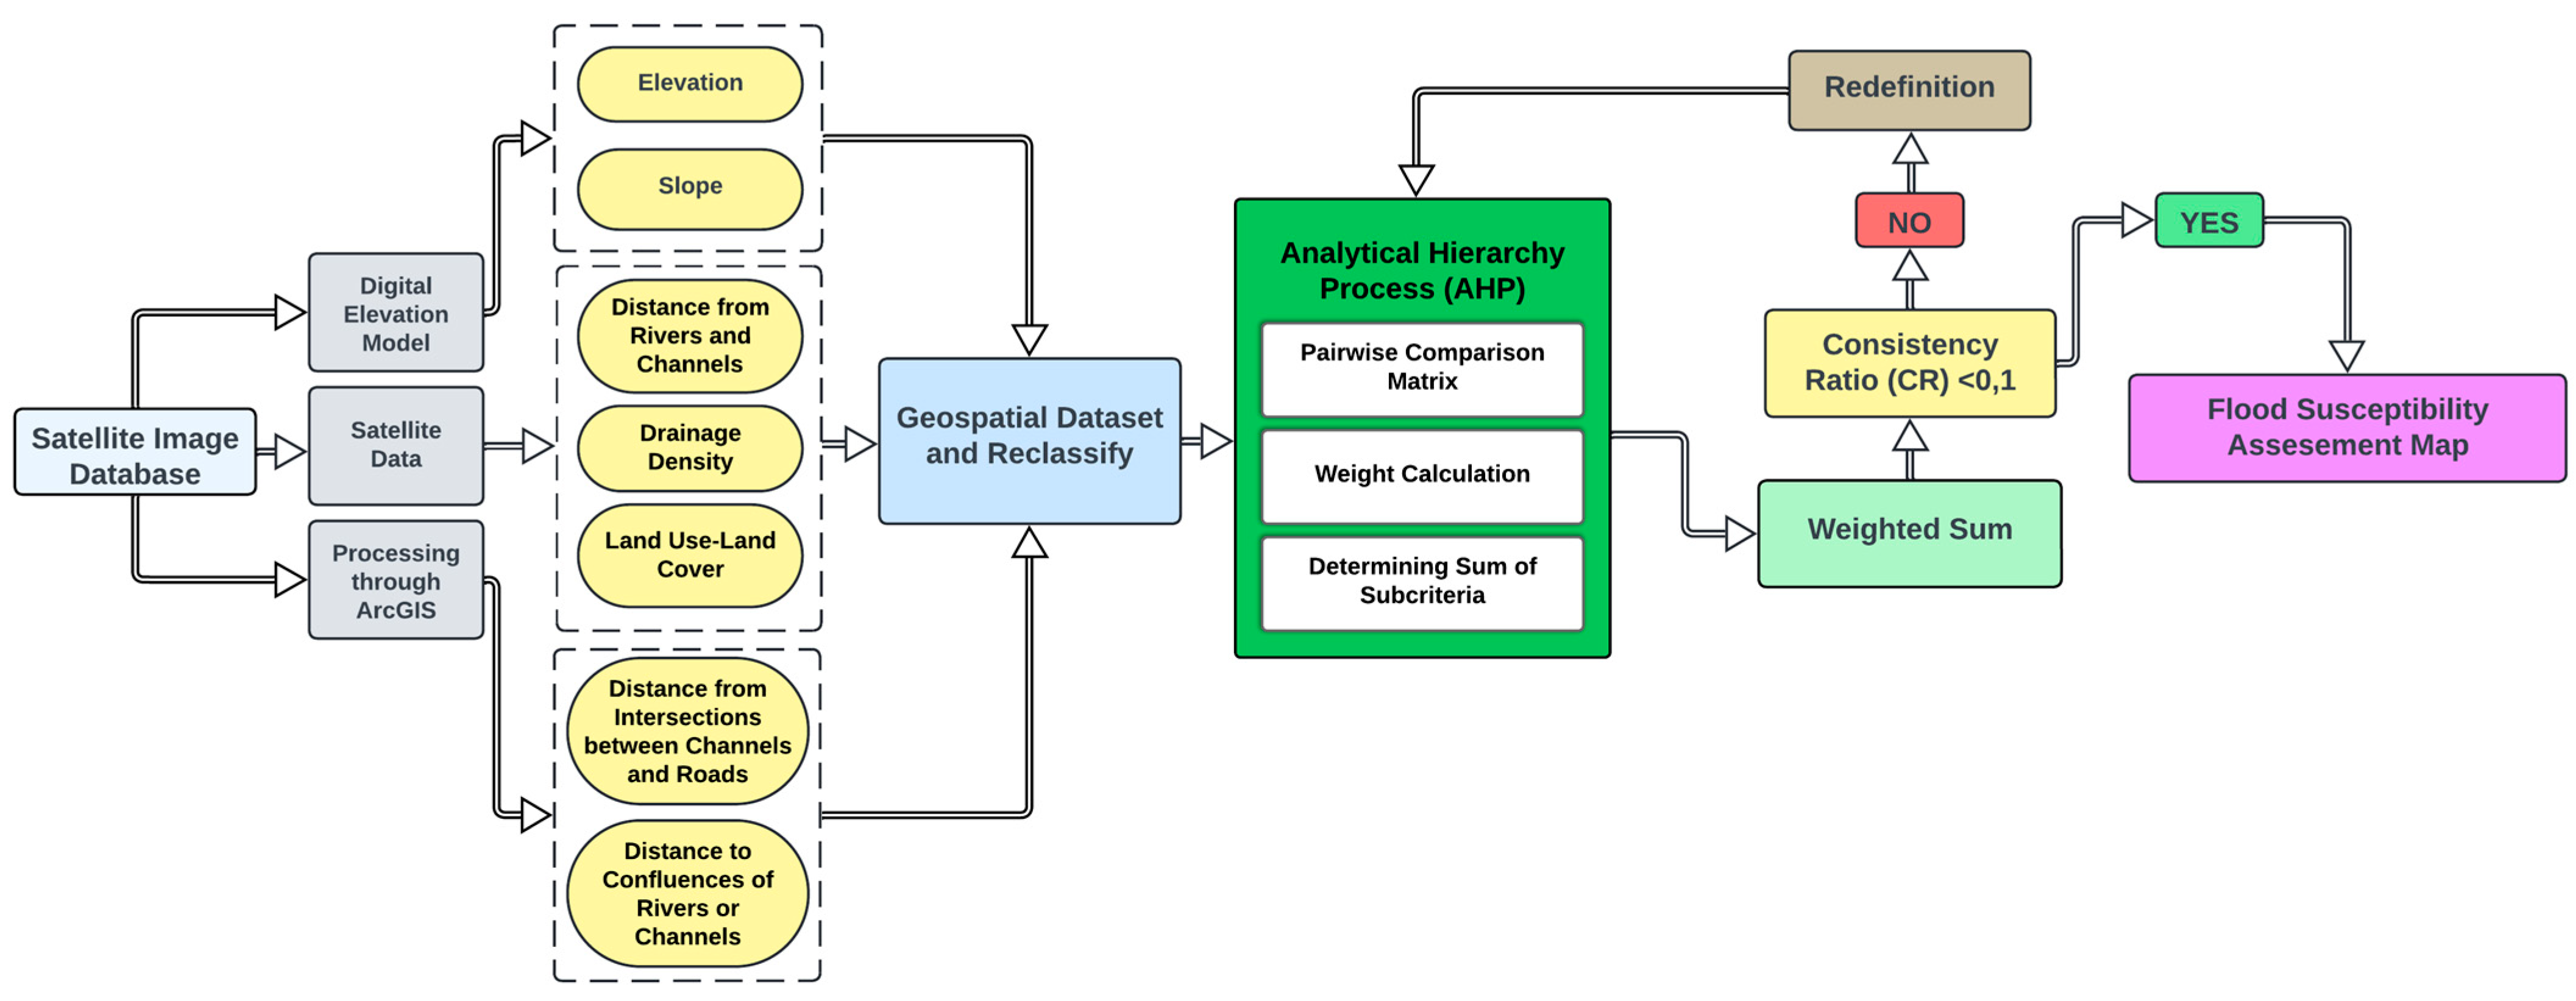
To produce the flood susceptibility assessment map, various data sources were intergraded, mainly utilizing satellite data and satellite imagery. Through these, a geospatial analysis was carried out, and the AHP method was used to estimate the importance of each critical factor (Figure 5).
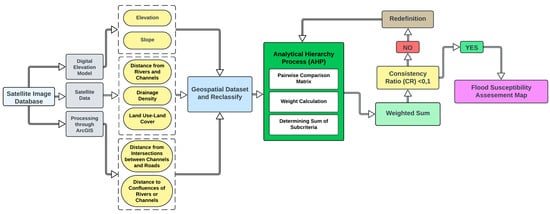
Figure 5.
Workflow of methodological approach.
3.1. Data Collection and Analysis
The initial phase of the study focuses on the foundational steps of data collection and procurement. The main processing sources of the applied factors are the Copernicus Management Service [47,48,49,50] and the satellite imagery of ArcGIS Pro v.3.5. (Esri (Environmental Systems Research Institute), Redlands, CA, USA, https://www.esri.com) (Table 1).

Table 1.
Data collection and processing through the GIS environment.
For the comparison between the flood events in 2018, 2020, and 2023 and the area flooded in each zone of the flood susceptibility assessment map (see Section 4.3), each flood event layer was reclassified in ArcGIS to distinguish between the percentages of zones that were flooded within the inundated area. Additionally, for the calculation of the corresponding flooded area in each flood susceptibility zone, the Tabulate Area tool was used. This tool calculates the area of different classes within specified zones and provides a summary of these cross-tabulated areas between two raster datasets [51].
Moreover, field visits were conducted in settlements across the study area from 2–5 November 2023 to assess the damage caused by the flood events of September 2023 (see Section 4.5). In addition, the Kriging tool of ArcGIS was used to spatially interpolate the inundation height of sites visited within the study area. It should also be mentioned that precipitation was initially considered as a potential factor. However, it was rejected because there was no significant variation across the broader areas of Megala Kalyvia, which has a small size with limited variations.
3.2. Methodology
The AHP was developed by Thomas L. Saaty [32]. It is defined through the establishment of a multicriteria decision that considers pairwise comparisons inputs. A corresponding weight is developed for each parameter and results in a ranking scale from 1 to 9 (Table 2). Thus, a pairwise comparison table is created, and in this context some factors are evaluated to determine the importance of each parameter contributing to the flood threat. The greatest weight of the overall assessment is given to the most important of these factors [52].

Table 2.
Ranking scale for pairwise comparisons suggested by Saaty [32].
Through the choice of weight in AHP it is decided how important and dominant each element is compared to the rest in a hierarchy [53].
To verify this choice, the consistency index (CI) is used, as defined by Saaty in the following equation:
where n is the number of criteria and λmax is the principal or largest eigenvalue.
The calculation of the consistency ratio (CR) allows the comparison between the consistency index (CI) and the average random inconsistency index (RI) determined by Saaty and presented in Table 3. The selection of values (RI) is made according to the number of criteria (n) [54].

Table 3.
Random consistency index (RI) for n = 1,2, …, 9 as suggested by Saaty [53].
A high value of CR indicates that the judgment inputs of the method exhibit adequate consistency and, thus, are not considered. Conversely, a CR value less than or equal to 0.10 is considered acceptable for the consistency of the assigned weights [37,55,56,57]. The consistency ratio (CR) is calculated by the following equation:
The last step in this method requires the calculation of the final value index for each cell (FS), by the linear summation of the selected factors with their previously calculated weights [54] through the following equation:
where FS is the flood susceptibility, wi is the criterion weight, and xi is the flood susceptibility category for each factor i.
3.3. Factors Affecting the Flood Susceptibility
Four factors—distance from rivers and channels, drainage density, slope, and elevation—were adjusted according to the method of natural intervals (Jenks) [58]. Moreover, distance from confluences of rivers or channels and distance from intersections between channels and roads were modified using buffer zones based on thresholds. Land use–land cover was classified as a categorical variable into artificial and natural classes. Finally, all factors were reclassified in the ArcGIS environment. The ranking of each value was categorized into the following classes: 5 = Very important, 4 = Significant, 3 = Moderate, 2 = Low, 1 = Very low (Table 4). The factors shown in Table 4 were included in the FSA model.

Table 4.
Factor value reclassification and ranking.
3.3.1. Distance from Rivers and Channels
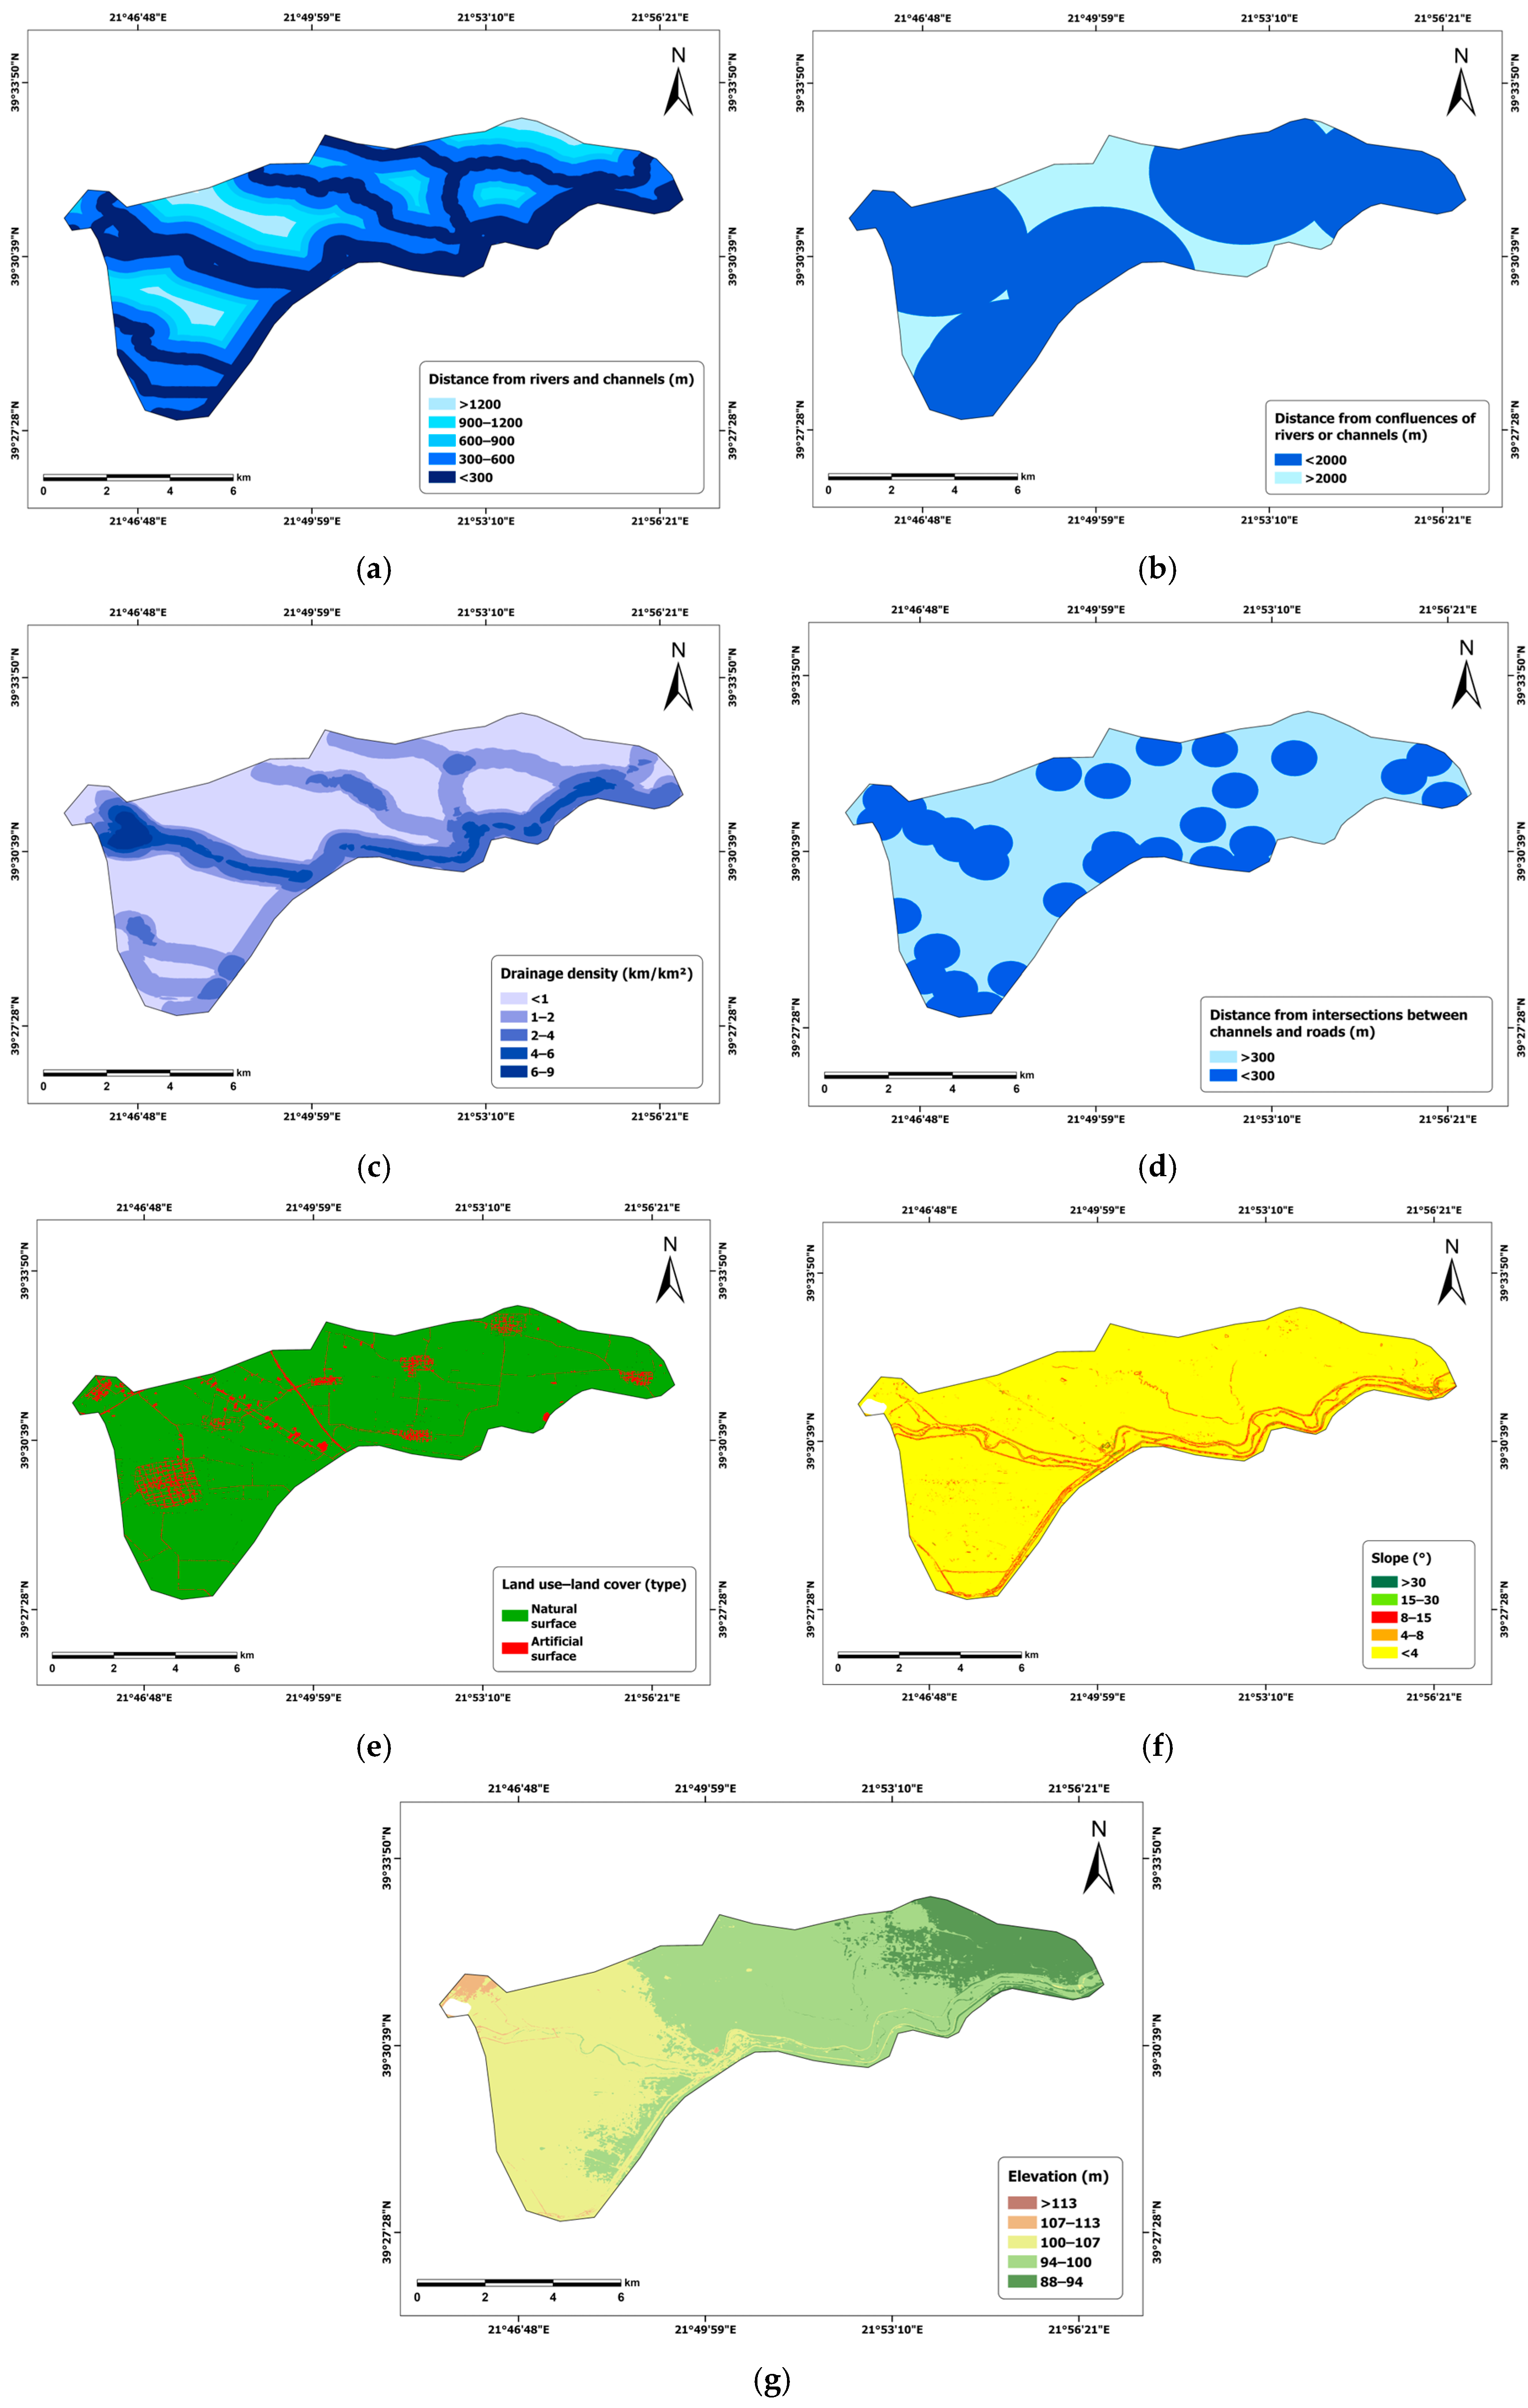
Distance from rivers and channels was considered as the most important factor, since proximity to riverbeds and their adjacent areas is the main cause of flooding as opposed to areas far from rivers, which directly increases the flood susceptibility in the flat terrain of the study area [59]. A step of 300 m was applied for this factor (Figure 6a) by using the ArcGIS buffer tool, and five zones were created. The class with the lowest susceptibility corresponds to a distance that is more than 1200 m, while the highest susceptibility weight was assigned to shorter distances to rivers that are less than 300 m [53].
3.3.2. Distance from Confluences of Rivers or Channels
Rivers where extreme events coincide with comparably significant overflow volumes which converge at a confluence (Figure 6b), resulting in an increase in the impact of a flood event which may lead to a catastrophic scenario in the area below the confluence. Joint probability analyses that applied link functions [60] show that when peak discharges occur simultaneously in the main river and its tributary, the increased threat is amplified. Thus, areas located at less than 2000 m were assigned with the highest weight and those with more than 2000 m with the lowest. The factor is considered important, but less so than the distance from rivers and channels and drainage density, since confluences influence flow concentration but are fewer in number. The distance estimation is based on areas inundated by past floods in 2018, 2020, and 2023, by measuring the average distance on flooded areas and confluences.
3.3.3. Drainage Density
A greater density of the hydrographic network indicates greater surface runoff, resulting in greater flood susceptibility [34]. In this study, drainage density (Figure 6c) has been considered the second most important factor since dense networks increase runoff potential in flat lowland areas. In this case, five categories were considered; the highest weight was granted to areas of 6–9 km/km2 of drainage area, while areas less than 1 km/km2 were issued the lowest weight. The ranges of this factor were derived from the drainage density raster (DEM) and have a lower value compared to other studies [53], which investigate larger areas than the current study (69.6 km2).
3.3.4. Distance from Intersections Between Channels or Channels and Roads
For this factor, the distance was set to 300 m (Figure 6d). Points within this range were given the lowest rank and considered to have very high flood susceptibility, while those with a range greater than 300 m were assigned lower risks. The selection was made based on points that intersect with the drainage network. These locations which are prone to higher flood susceptibility were considered as areas that obstruct the flow of water through natural (or artificial) channels, restricting the natural flow of the river and causing it to overflow [61]. Thus, moderate importance is given to this factor due to possible obstructions at bridges, but these areas are more localized than the main rivers.
3.3.5. Land Use and Land Cover
The land use–land cover factor (Figure 6e) has a significant impact on soil infiltration, extent, and velocity of runoff [34]. The importance given to this factor is moderate to low, since artificial surfaces cover only a small percentage of the area. The artificial surfaces covering 5.4% of the study area were given the highest weight, given that they prohibit the water from infiltrating and can favor surface runoff, while the remaining 94.6% of natural surface was considered to have the lowest influence on flood susceptibility.
3.3.6. Slope and Elevation
Usually, floods are caused in flat and low-lying areas. On steep slopes, there is an acceleration of surface runoff and a reduction in the time needed for the soil to absorb the water [34]. Moreover, across the entire study area, the slope (Figure 6f) is less than 4°, which results in a flat surface with a higher susceptibility; this was given the highest susceptibility weight. On the contrary, slopes of more than 30° received the lowest weight. However, elevation (Figure 6g) influences flooding in the opposite way. The frequency of flooding increases with a lowering altitude, which results in higher flood susceptibility [59]. The highest weight in this factor is in areas that have an elevation more than 113 m, and the lowest was given to areas with less than 88–94 m. These two factors are decisive for the flood susceptibility assessment, although they occupy the last positions in the weight ranking due to the small size and the geographical location of the study area, which is characterized as a lowland. Therefore, the variation was minimal and limited their influence in the study area.
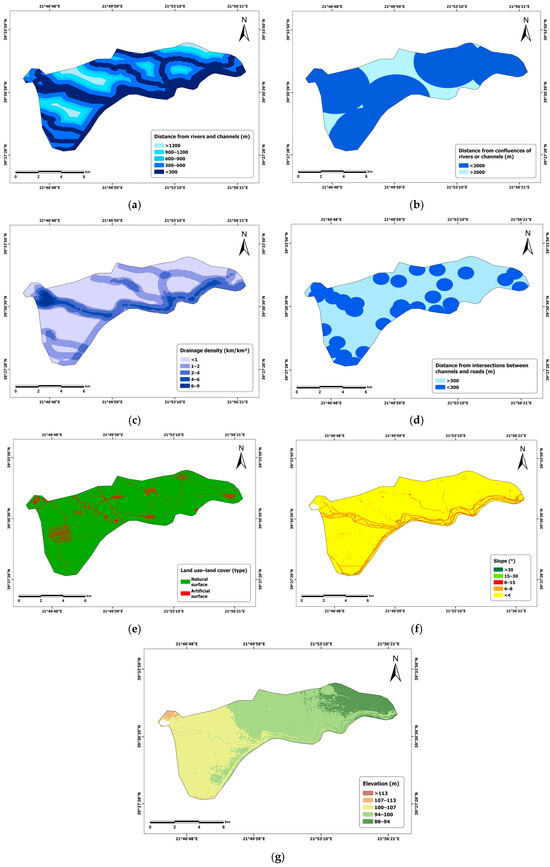
Figure 6.
Factors contributing to flood susceptibility: (a) Distance from rivers and channels; (b) distance from confluences of rivers or channels; (c) hydrographic density; (d) distance from intersections between channels and roads. (e) Land use−land cover; (f) slope. (g) Elevation factor contributing to flood susceptibility.
3.4. Pairwise Comparison Matrix
The pairwise comparison is shown in Table 5, where a 7 × 7 matrix was used, with diagonal elements equal to 1. For the rank calculation score, the values in each row are compared to the values in each column [33]. For example, the distance of rivers or channels (a) is moderately more important than drainage density (c), which is given a score of 2. The series emphasizes the importance of proximity to rivers or channels. As a result, the order bears the inverse of the comparison (1/2 for drainage density). These weights represent the dominant influence of the distance of rivers or channels, as quantified in Table 6.

Table 5.
Pairwise comparison matrix rank calculation.

Table 6.
Pairwise comparison matrix normalization.
4. Results
4.1. Pairwise Comparison Matrix Normalization and Criterion Weighting Factor Calculation
For the normalization of Table 5 and the subsequent calculation of the weight of each criterion (Table 6), the following procedure was followed:
- We divided the sum of each column by the value assigned to each cell of the comparison table to obtain the normalized value of each cell.
- The sum of each row (CA) of the normalized pairwise comparison matrix was calculated.
- The value of λ was found by summing the CA column through the following equation:
- The consistency index (CI) was calculated with Equation (1).
- The consistency ratio (CR) was calculated with Equation (2), while the value of R is 1.32 when the total number of criteria (n) is 7, based on Table 3 [53]. Since the value of CR is 0.047, making CR < 0.1, the weighting factor for each category of the criteria that was calculated in the pairwise comparison table is considered consistent [57].
- The weighting factor (wi) of each criterion was developed by calculating the average of the rows of each cell (Cw) with the following equation:
4.2. Calculation of the Final Value Index
The last step performed was the calculation of the final value index for each cell, which was carried out in the ArcGIS environment through raster calculator. This was determined using Equation (3), which assesses the flood susceptibility (FS) of each criterion based on the weighting factor (wi). The equation used is as follows:
where (a) is the distance from rivers and channels, (b) is the distance from the confluences of rivers or channels, (c) is the drainage density, (d) is the distance from intersections between channels and roads, (e) is land use–land cover, (f) is slope, and (g) is elevation.
FS = 0.253 × (a) + 0.222 × (b) + 0.231 × (c) + 0.142 × (d) + 0.078 × (e) + 0.044 × (f) + 0.03 × (g)
4.3. Flood Susceptibility Assessment Map in the Study Area
The final map in Figure 7 represents the flood susceptibility assessment map of the study area. The distance from rivers and channels, distance from confluences of rivers or channels, hydrographic density, distance to bridges, artificial and natural surfaces, slope, and elevation were needed to produce a flood susceptibility assessment map utilizing AHP and ArcGIS approaches. The flood susceptibility classes were classified based on the natural breaks (Jenks method), resulting in enhanced thresholds for mapping the flood susceptibility categories. The results (Table 7) show that 8.90% (6.19 km2) of the study area is classified as being at very low flood danger, 23.96% (16.68 km2) is classified as low, 20.64% (14.38 km2) is classified as moderate, 24.63% (17.14 km2) is classified as high, and 21.87% (15.21 km2) is classified as very high. High and very high susceptibility zones reflect areas where the most heavily weighted factors coincide, which illustrates the spatial distribution of the zones with the highest susceptibility.

Table 7.
Flood susceptibility assessment map zones and zones flooded during 2018, 2020, and 2023.
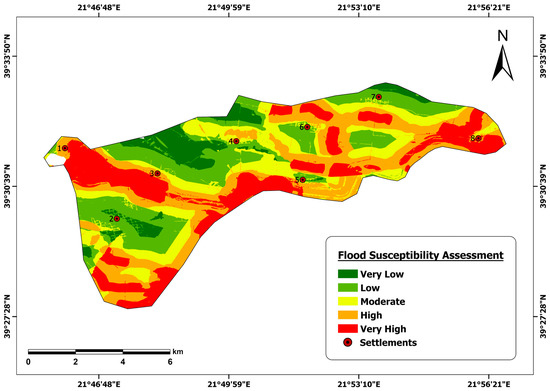
Figure 7.
Flood susceptibility assessment map in the broader area of Megala Kalyvia. Settlements: (1) Flamouli; (2) Megala Kalyvia; (3) Agia Kyriaki; (4) Loggos; (5) Glinos; (6) Patoulia; (7) Faneromeni; (8) Nomi.
Figure 7.
Flood susceptibility assessment map in the broader area of Megala Kalyvia. Settlements: (1) Flamouli; (2) Megala Kalyvia; (3) Agia Kyriaki; (4) Loggos; (5) Glinos; (6) Patoulia; (7) Faneromeni; (8) Nomi.
4.4. Comparison Between the Flood Susceptibility Assessment Map and the Flood Events in 2018, 2020, and 2023
During the flood events of February 2018, the total study area had an inundation coverage of 14.3% [47]. The comparison results shown in Table 7 indicate that the distribution of the flooded zones generally increases with the flood susceptibility level. Very low, low, and moderate zones had flooded areas of 1.19%, 8.52%, and 18.59%, respectively, while the largest amount of the flooded areas in 2018 was covered by the high and very high zones, which had percentages of 35.41% and 36.29%, respectively.
Additionally, the percentage of flooded areas in September 2020 was 16.3% of the study area [48]. Very high and high zones covered 21.99% and 29.75% of the total flooded area, while moderate and low zones consisted of 23.65% and 21.49% of the study area. Ultimately, the very low zone coverage was 4.07%.
Moreover, in September 2023, all of the susceptibility zones were affected, as the extent of the flood was on a much larger scale, covering 45.91% of the study area [49]. Very high and high zones experienced 21.75% and 24.16% coverage, respectively, while the moderate and low zones experienced 24.78% and 23.26% coverage, respectively. The very low zone had the minimum coverage of the total flooded area, with a percentage of 7.05%.
4.5. Inundation Height of Sites Visited Within the Study Area Through 2−5 November 2023
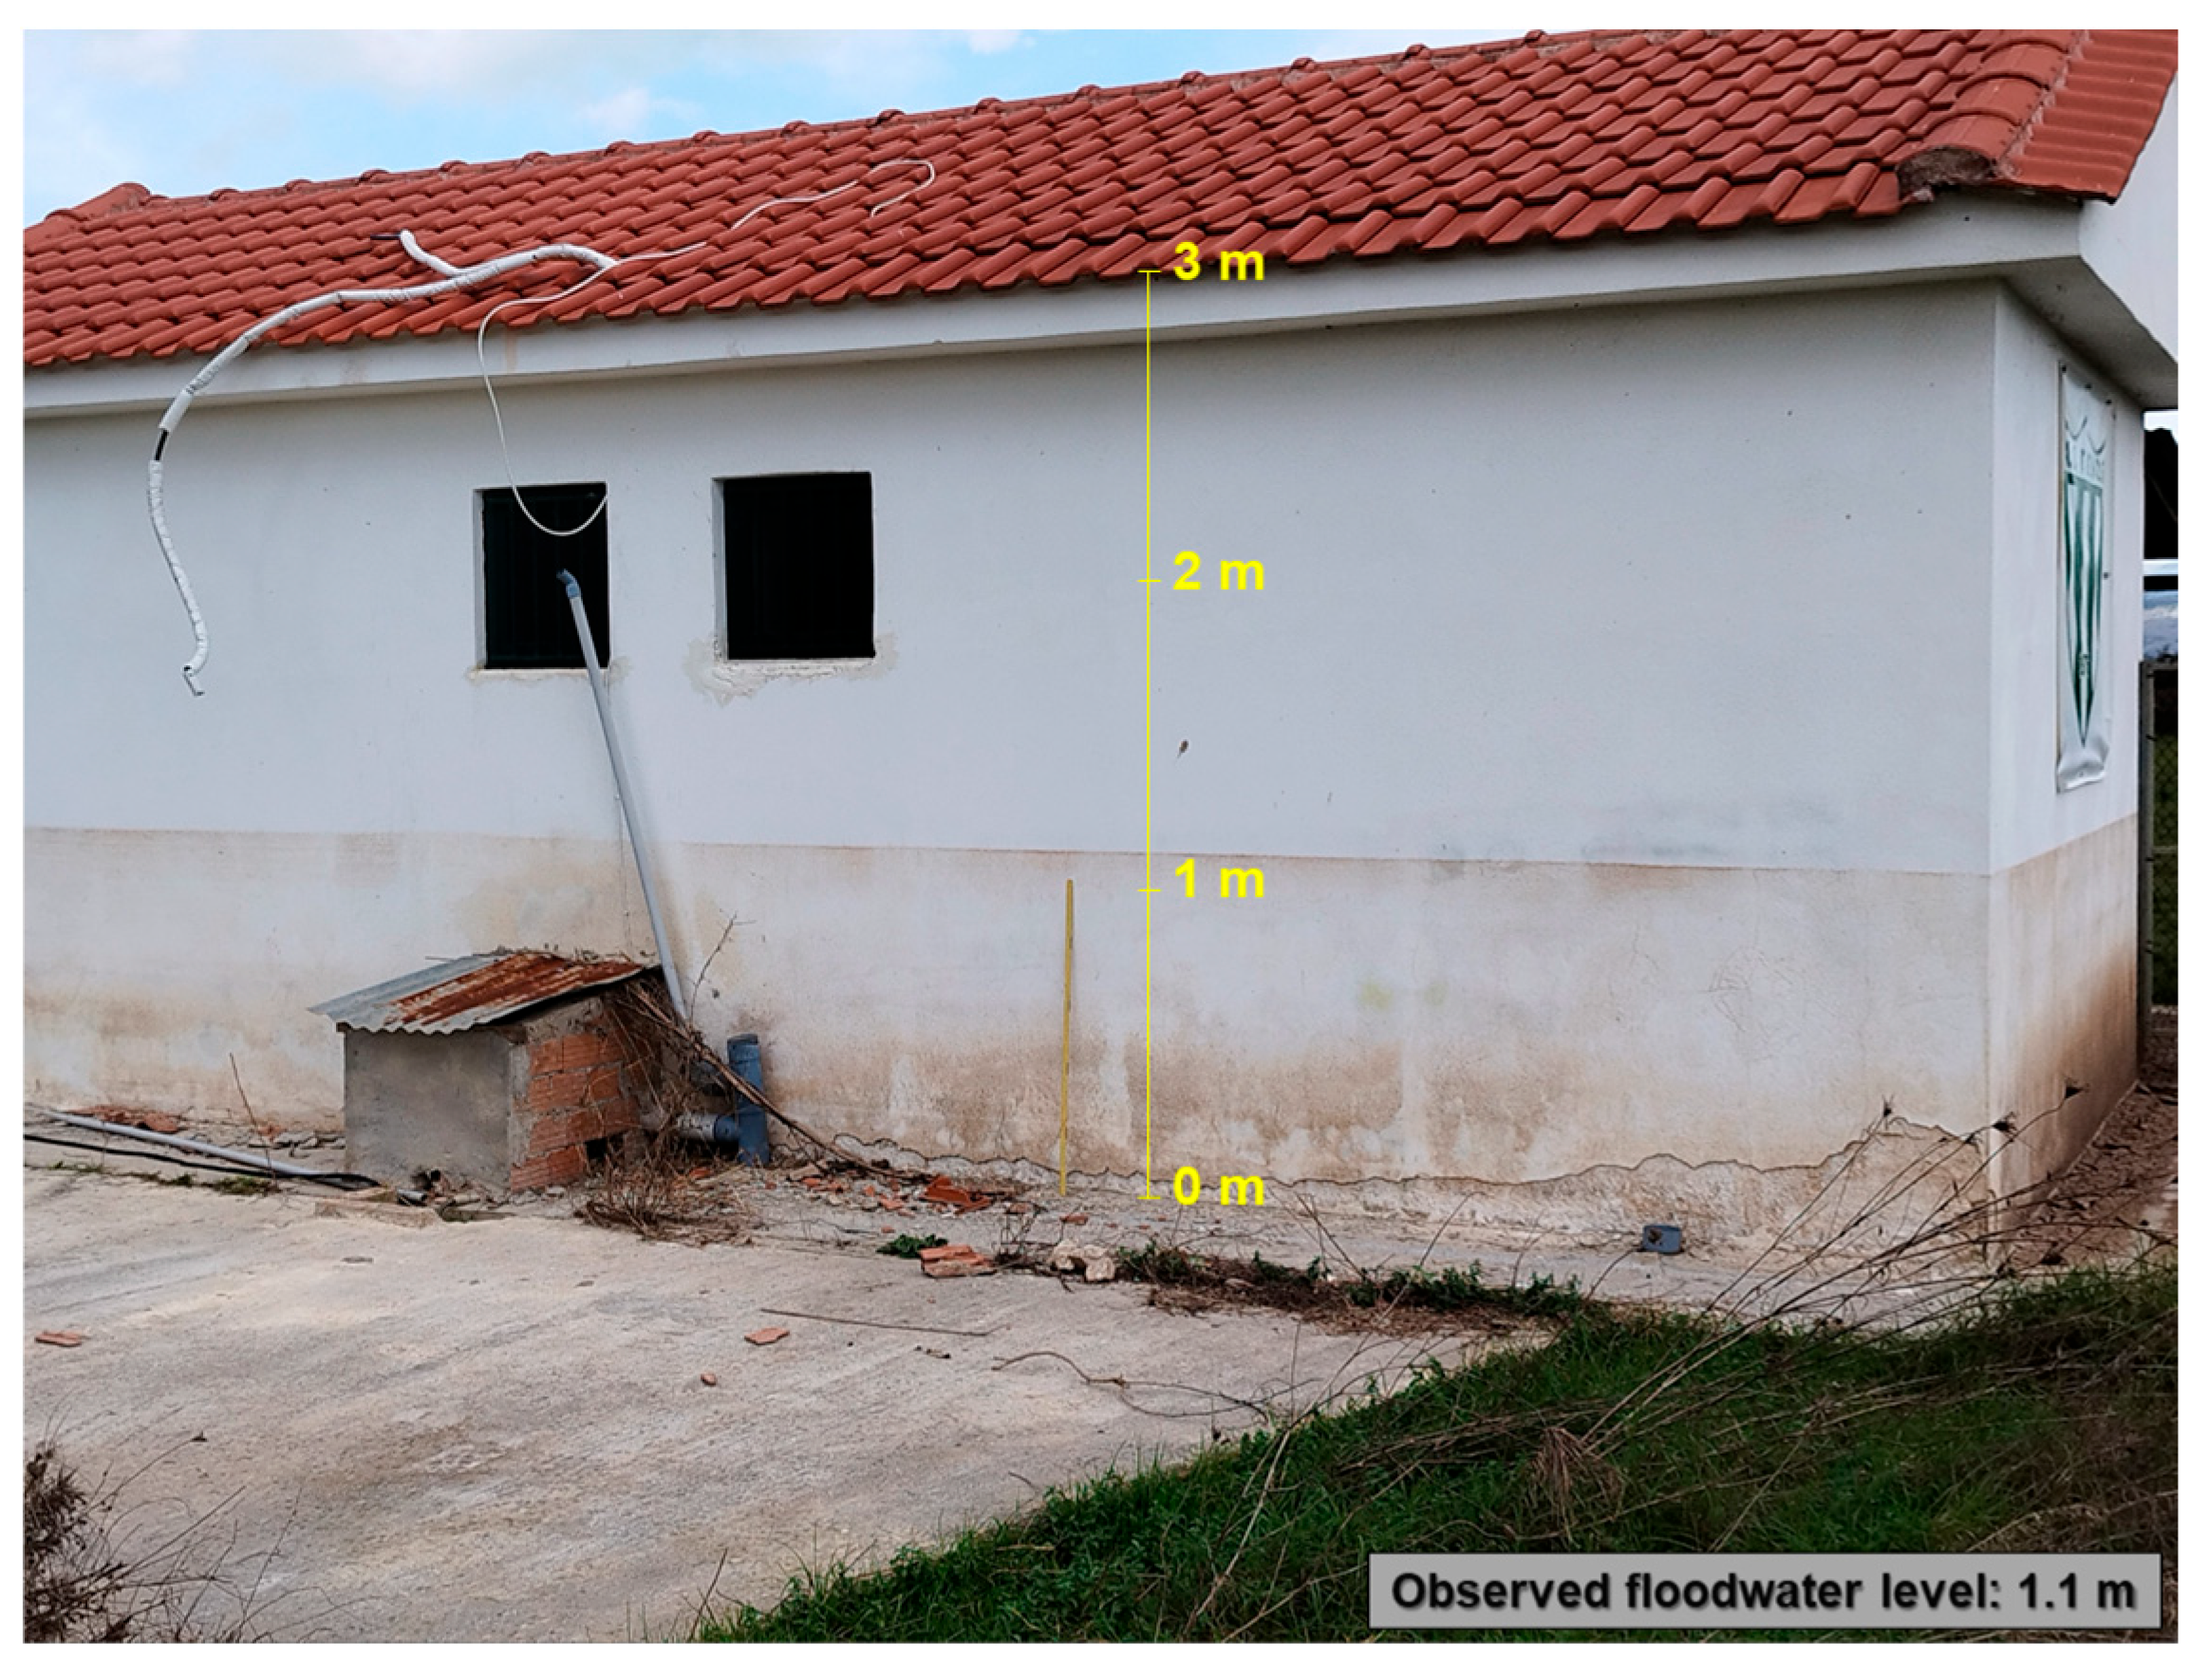
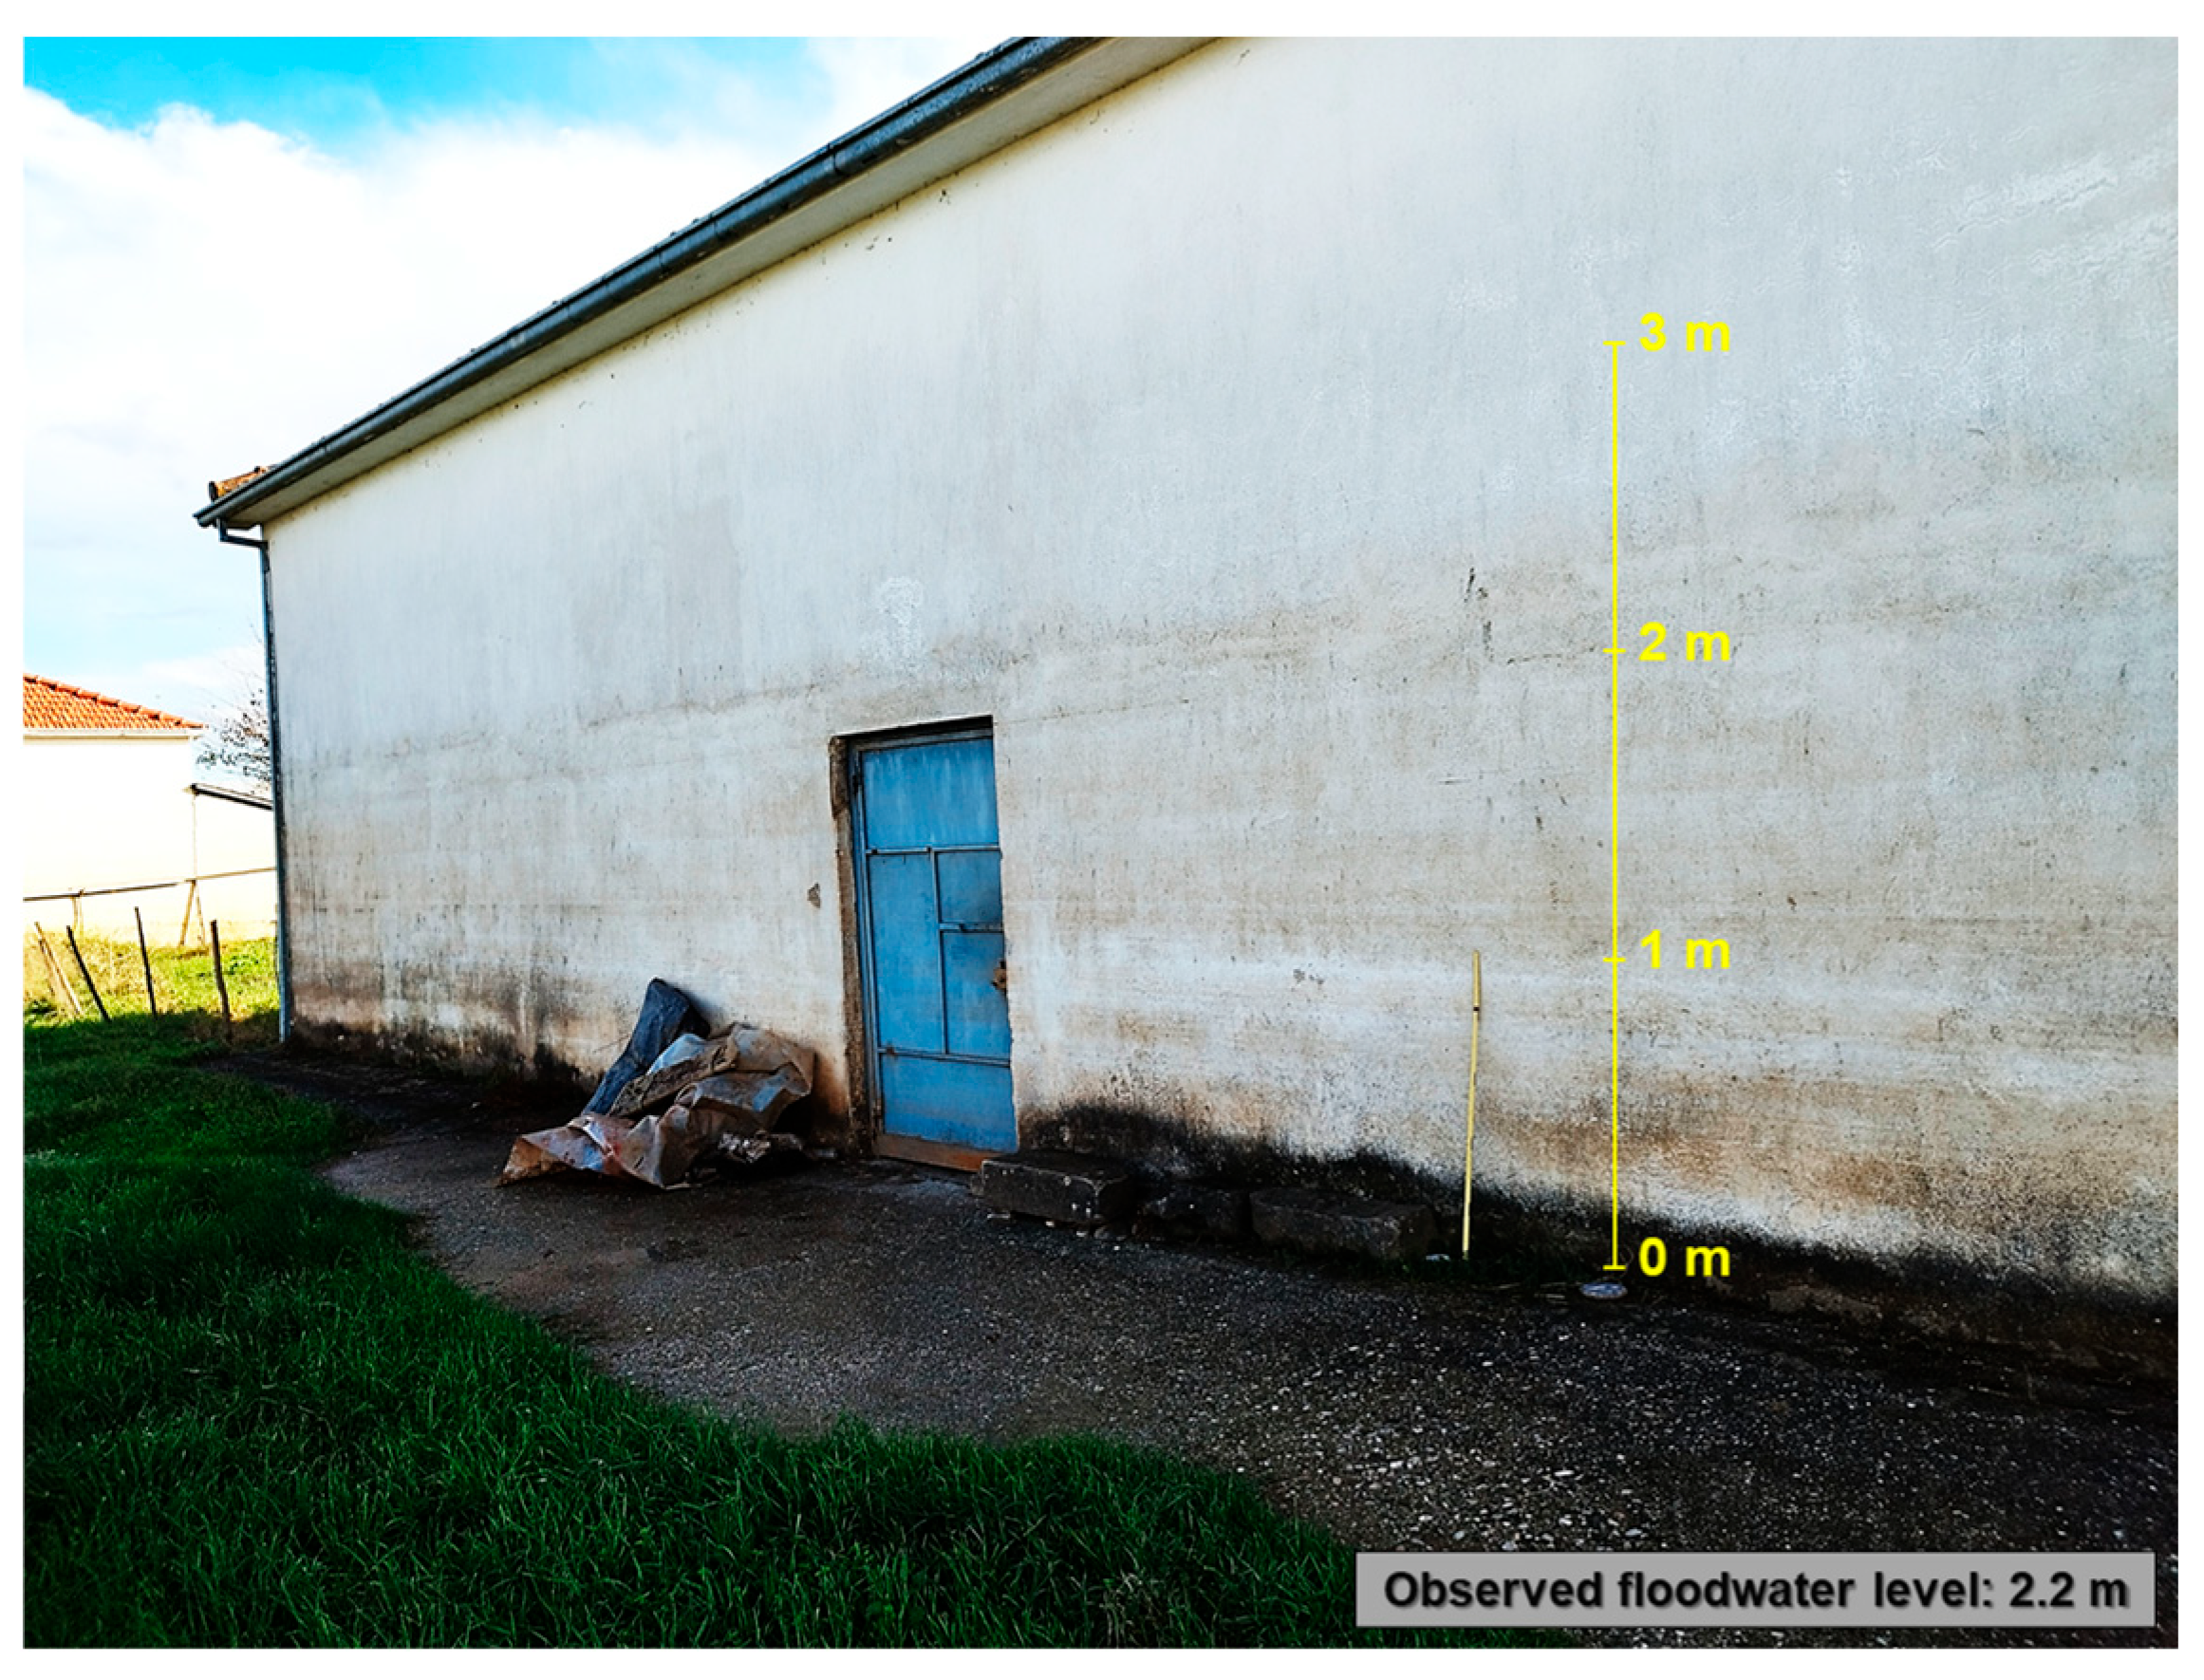
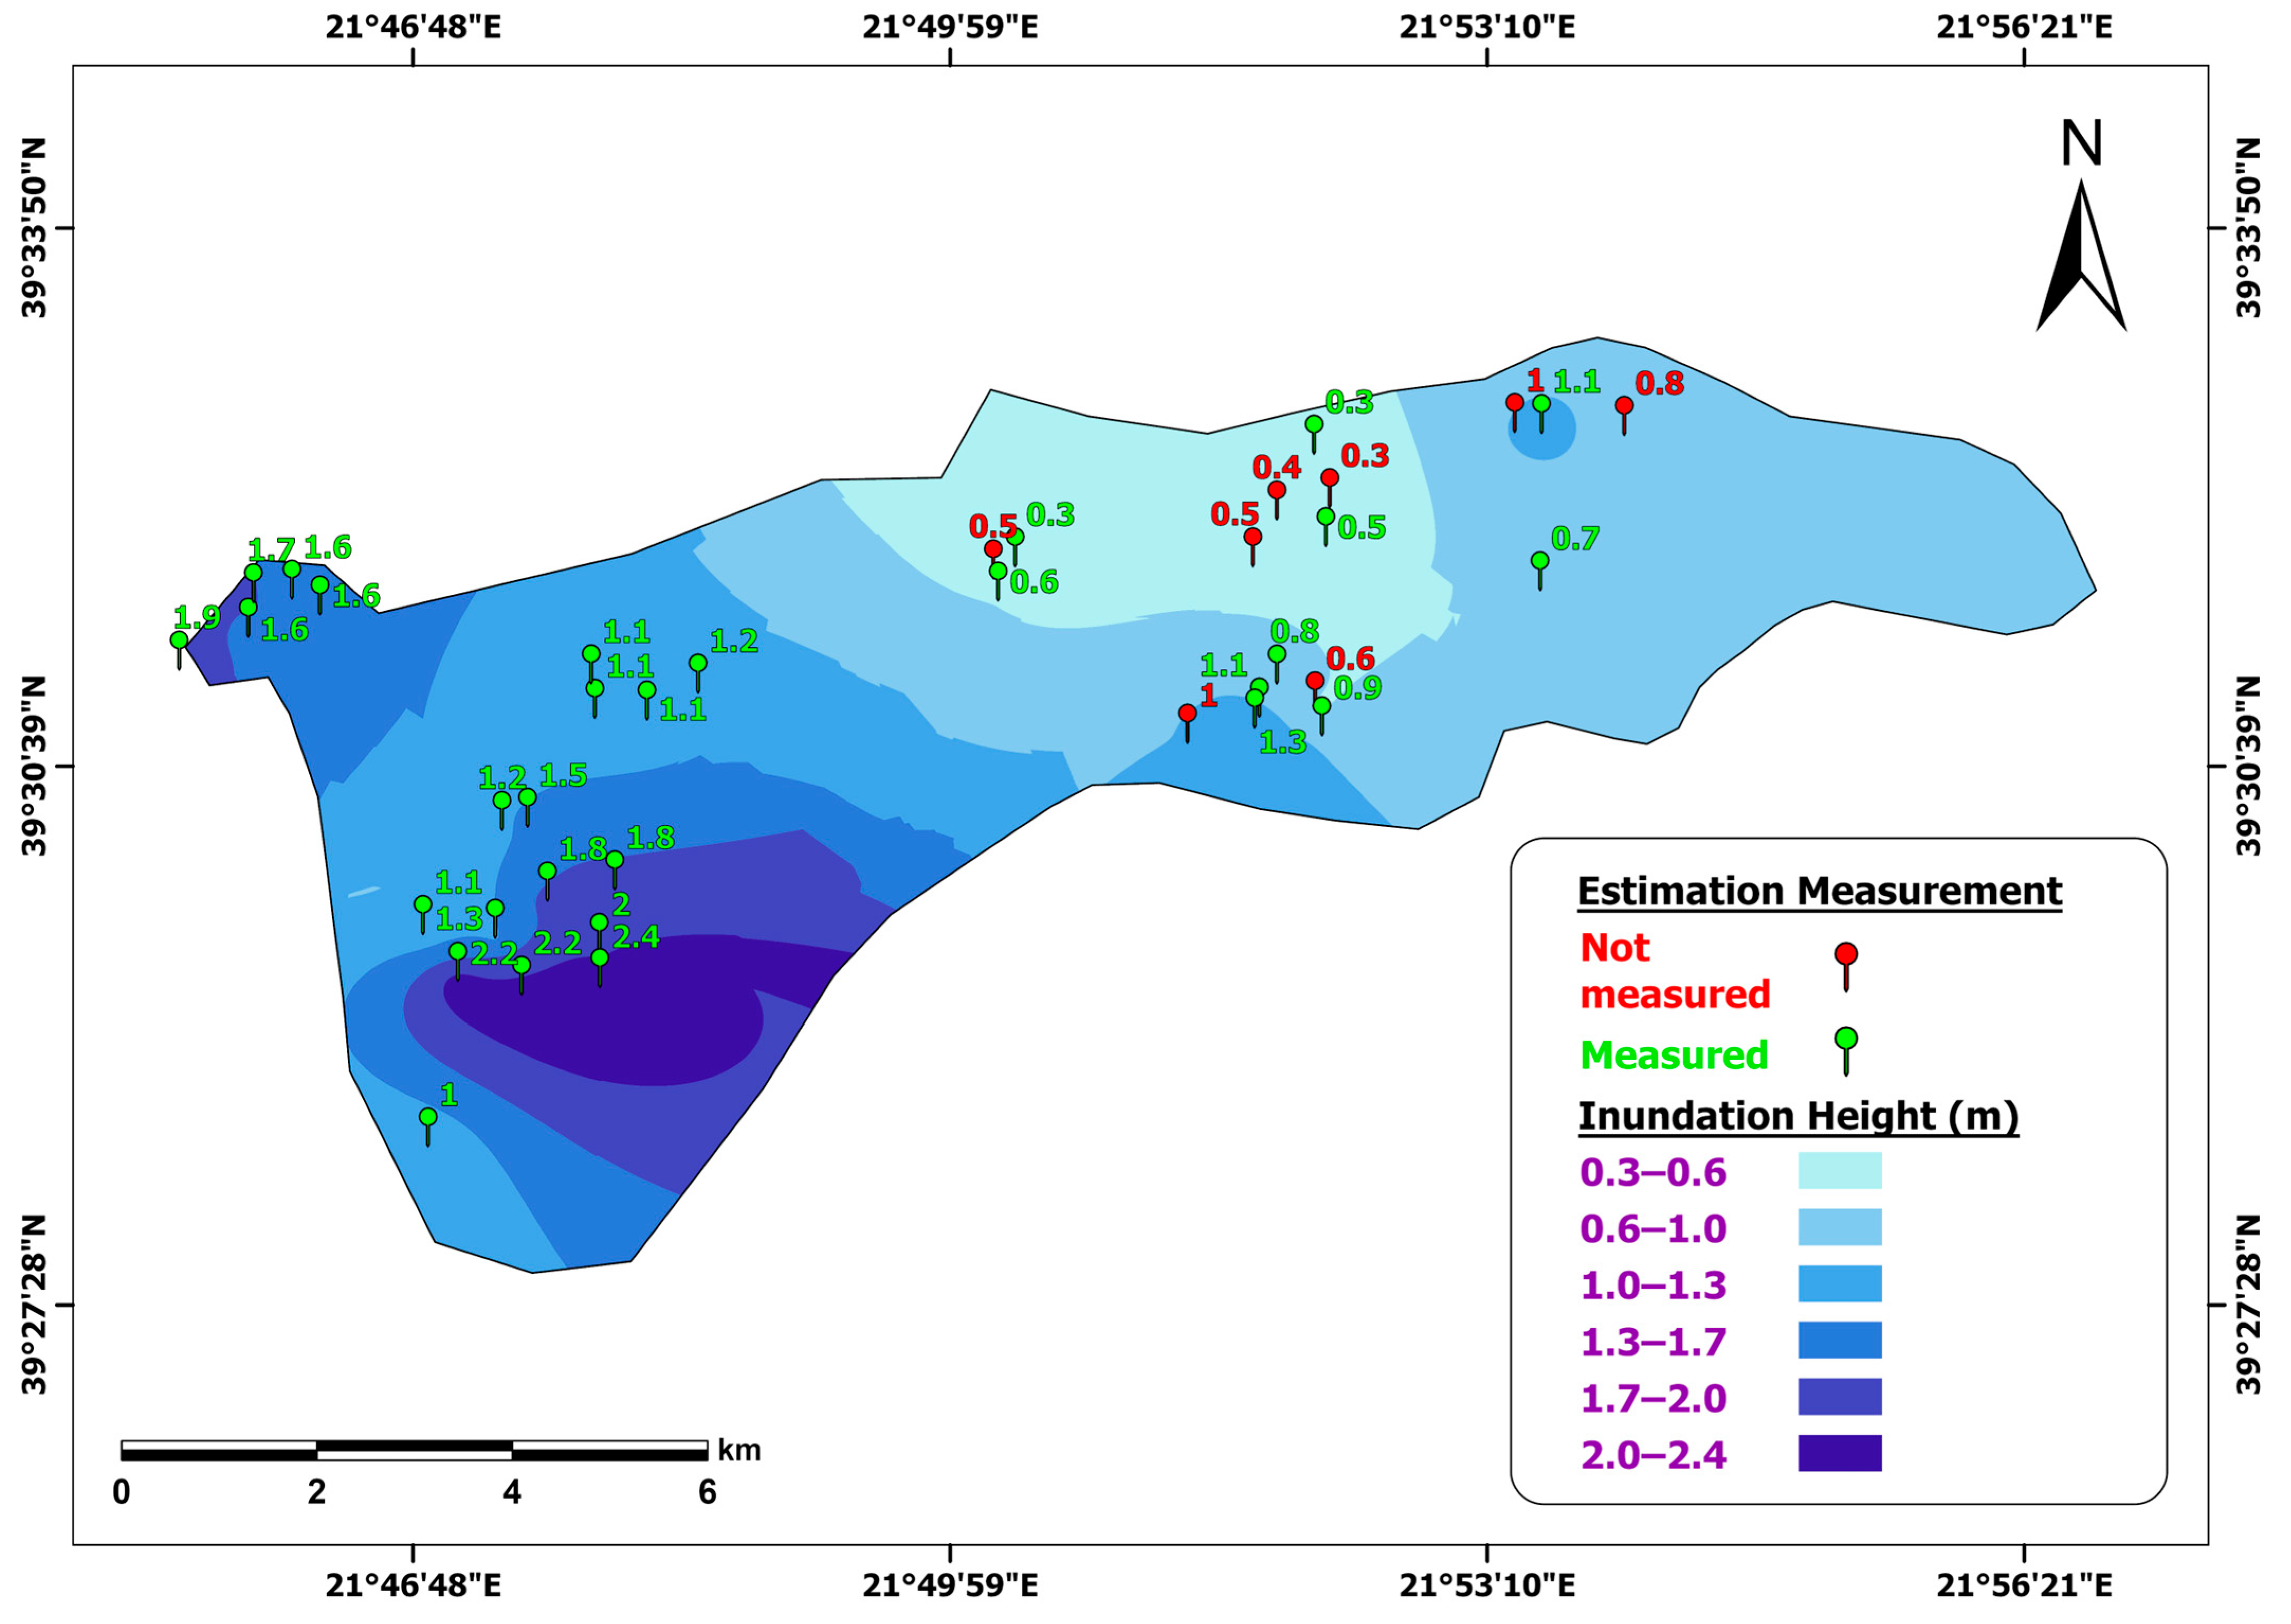
Figure 8 and Figure 9 highlight the observed flood water lever of the field visits from 2–5 November 2023. Additionally, Figure 10 summarizes the sites and areas with the observed flood water heights of the broader area of Megala Kalyvia during the flood season of September 2023. The western locations of the study area observed to have heights from 1.3 m to 2.4 m, while the eastern areas presented inundation heights from 0.3 m to 0.6 m. The settlements of Megala Kalyvia, Agia Kyriaki and Flamouli had the highest observed inundation height, while the classification shown in the flood susceptibility map also classified these areas as very high. This indicates that the measurements from the western zones indicate a spatial consistency.
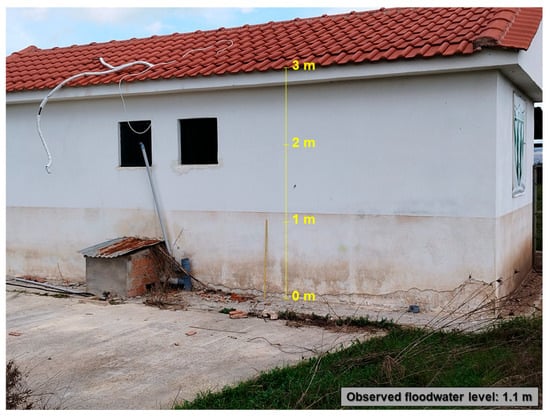
Figure 8.
Observed flood water level from flood events of September 2023 at Glinos, Trikala, Greece (image taken on 3 November 2024). Coordinates: 39°03′57.1″ N, 21°05′46.5″ E.
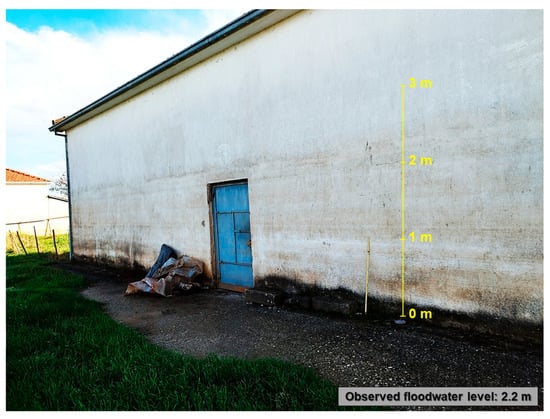
Figure 9.
Observed flood water level from flood events of September 2023 at Megala Kalyvia, Trikala, Greece (image taken on 4 November 2024). Coordinates: 39°02′17.5″ N 21°04′27.2″ E.
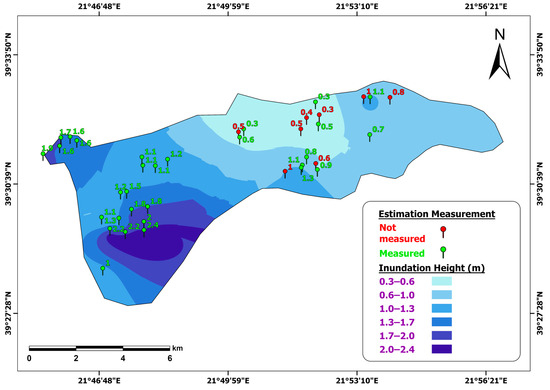
Figure 10.
Inundation height of sites visited within the study area through 2–5 of November 2023. Sites based on locals’ estimations are marked in red, while green sites were measured (meters).
5. Discussion
The findings of the current research indicated that almost half (46.50%) of the broader area of Megala Kalyvia is within high and very high flood susceptibility zones, while the lowest percentage of the zones was within the area with very low flood susceptibility. The comparison of these zones with the previous flood events of February 2018, September 2020, and September 2023 highlighted the effectiveness of the map prediction. It was found that in the comparison for 2018, 71.70% of the zones that flooded were under high and very high flood susceptibility, while in the comparison for 2023, the affected areas covered a larger portion of the study area (45.91%) where the high and very high zones correspond to 24.16% and 21.75% of the area flooded, respectively. Additionally, the comparison of 2020 reveals a similar distribution, where the high and very high zones were found to be at 29.75% and 20.99%, respectively, while the moderate, low, and very low zones had percentages of 23.65%, 21.49%, and 4.07%, respectively.
Moreover, through the field survey, the observations confirmed the weighted factors related to the proximity of the tributaries and the Peneus, which had a crucial role in the flood events of September 2023, while the water overflowed, far exceeding the normal limits. The absence of natural barriers and the extended retention time of the water in the area allowed the water to infiltrate settlements, causing serious damage to crops, houses, and the road network. The extent of the flood in some areas included observed water levels of up to 2.4 m, dramatically affecting even areas that were far from water bodies.
5.1. Comparison with Similar Studies and Methodologies
There are several studies [12,62,63] that focus on the Peneus basin but which refer to bigger areas. The current approach engaged in research on a smaller scale (69.6 km2), focusing on an area which had flooded in specific parts during previous floods and where the need for a flood susceptibility map was evident. However, there are studies [31,54,64] which use similar approaches with a different final purpose. For instance, Al-Taani et al. [31] assessed the flash flood (FF) vulnerability for Aqaba city in Jordan while using a combination of AHP and GIS. The model used six factors on a broader spatial scale of 6203 km2, while the FF map consisted of five zones, respectively. Contrary to the FSA of the broader area of Megala Kalyvia, slope and elevation factors have the highest weights due to the nature of topography in Aqaba city, as higher slopes correlated significantly and positively with surface flow velocity in an area where slopes less than 10° covered the 49.88% of the study area. Furthermore, lower altitudes in the area were accompanied with higher discharge and are flooded faster by the aggradation of water falling on high altitudes. However, the current study weighted the slope and elevation factors with less importance because the area is a plain with low altitudes and low differences in elevation, as it is a much smaller.
Additionally, the model of Aqaba city used the stream order factor instead of flow accumulation. An example showing that the replacement of this factor and the additional weight given to factors related to the proximity and the hydrology of the river (distance from rivers and channels, distance from confluences of rivers or channels, drainage density) is efficient in research. Thus, there is a need for adjustment to the topography conditions of the investigated area. Furthermore, Aichi et al. [54] assessed the flood risk of Dades Wadi watershed in Morocco with seven factors, where 40.36% of the total area was concentrated within very high flood-risk zones located near rivers. The same trend applies for the susceptibility areas of the current study (46.50% within high and very high flood susceptibility zones), especially near Megala Kalyvia, Agia Kyriaki and Flamouli. Despite the similar methodological approach and the number of factors used in both studies, the weight and the type of factors vary. Flow accumulation and drainage density were the most important factors; the proximity to rivers was third in terms of significance, while the permeability and rainfall factor was included instead of distance from intersections between channels and roads and LULC, which are used in the current model. The study area was a watershed of 1319.89 km2, which can be considered the main reason for the difference between the criteria assessed in both studies due to the variation in the spatial distribution compared to smaller catchments.
The factors which are incorporated into the AHP model align with the field survey, where the topographic and spatial conditions control the flood susceptibility. Proximity to confluences and rivers had the highest weights, which correlates with the inundation heights measured across the study area near the downstream zones and main tributaries, like the Peneus and Lithaios rivers. The importance of slope and elevation factors can be interpreted in some of the individual areas with higher elevations and existing embankments near Glinos, which remained uninfluenced regardless of the flooded districts nearby. Additionally, the model’s spatial accuracy coincides with the inundation heights in some cases reported by locals, which matches predicted flood susceptibility zones. Overall, the field research results in the model’s validation, which can incorporate real-world flood behaviours and underscores the significance of field study observations.
5.2. Limitations of the Present Study
One of the limitations of this study was the accuracy of the data collected during the field survey. Most of the field observations were conducted through measurements during the period of 2–5 November 2023, while the flood events that affected the study area occurred at the beginning and the end of September 2023. During this period, weather conditions and flood debris removal measures can affect the consistency of the measurements, since the scenery can be more varied in the post-crisis phase. However, the measurements could not be conducted immediately following the events, due to the increased danger of contamination and the difficulty accessing these sites, as the flood waters in many areas did not recede quickly. Furthermore, the boundary covered by the satellite on the inundation extent of the 2020 flood restricts the comparison between it and the flood susceptibility map [48]. The data coverage is limited, with the distribution of flooded areas being restricted to the southern locations.
In a different context, something that should be highlighted is the absence of the flow accumulation factor, which is widely used in flood-related assessment studies [15,34,59,65]. Flow accumulation is advantageous for locating flood-prone areas, and it can be used to define the cumulative flow downslope [65]. The integration of this factor does not align with the small size and the morphology of the study area (69.6 km2). For this reason, factors which are related to the proximity and the hydrology of the river (distance from rivers and channels, distance from confluences of rivers or channels, and drainage density) were assigned greater weights.
6. Conclusions
To assess flood susceptibility and highlight the need for preventive measures in these areas, a combination of GIS and the analytical hierarchy process (AHP) was implemented in this study, through which seven factors were considered, namely distance from rivers and channels, drainage density, distance from confluences of rivers or channels, distance from intersections between channels and roads, land use–land cover, slope, and elevation. In total, 46.50% of the broader area of the Megala Kalyvia zone was within very high and high flood susceptibility zones. The comparison with reports from past flood events and field observations following Storm Daniel flood in 2023 confirms the predictive capability of the susceptibility model, demonstrating alignment between highly susceptible zones and actual flood-affected areas across multiple past events.
Future research efforts could explore and apply methodologies that incorporate a variety of techniques and multicriteria analysis processes in combination, as well as expert judgment to enhance the robustness and reliability of flood susceptibility assessment. The results of this research on the broader area of Megala Kalyvia may be used as basic data to assist in the flood susceptibility assessment of similar areas through the Peneus basin, highlighting the need to adapt to the changing climate patterns.
Author Contributions
Conceptualization, N.E.; methodology, N.E., N.A. and E.S.; software, N.A.; validation, N.E., N.A. and E.S.; investigation, N.A.; data curation, N.A.; writing—original draft preparation, N.A.; writing—review and editing, N.E. and E.S.; visualization, N.A.; supervision, N.E. All authors have read and agreed to the published version of the manuscript.
Funding
This research received no external funding.
Data Availability Statement
Data are available upon contact with the corresponding author.
Conflicts of Interest
The authors declare no conflicts of interest.
References
- Li, Y.; Zhang, Q.; Cai, Y.; Tan, Z.; Wu, H.; Liu, X.; Yao, J. Hydrodynamic Investigation of Surface Hydrological Connectivity and Its Effects on the Water Quality of Seasonal Lakes: Insights from a Complex Floodplain Setting (Poyang Lake, China). Sci. Total Environ. 2019, 660, 245–259. [Google Scholar] [CrossRef]
- Hamilton, S.K. Flood Plains of Large Rivers. In Encyclopedia of Inland Waters, 2nd ed.; Mehner, T., Tockner, K., Eds.; Elsevier: Oxford, UK, 2022; pp. 290–300. ISBN 978-0-12-822041-2. [Google Scholar]
- Singha, P.; Pal, S. Wetland Transformation and Its Impact on the Livelihood of the Fishing Community in a Flood Plain River Basin of India. Sci. Total Environ. 2023, 858, 159547. [Google Scholar] [CrossRef] [PubMed]
- Viero, D.P.; Roder, G.; Matticchio, B.; Defina, A.; Tarolli, P. Floods, Landscape Modifications and Population Dynamics in Anthropogenic Coastal Lowlands: The Polesine (Northern Italy) Case Study. Sci. Total Environ. 2019, 651, 1435–1450. [Google Scholar] [CrossRef] [PubMed]
- Roccati, A.; Luino, F.; Turconi, L.; Piana, P.; Watkins, C.; Faccini, F. Historical Geomorphological Research of a Ligurian Coastal Floodplain (Italy) and Its Value for Management of Flood Risk and Environmental Sustainability. Sustainability 2018, 10, 3727. [Google Scholar] [CrossRef]
- Orengo, H.A.; Krahtopoulou, A.; Garcia-Molsosa, A.; Palaiochoritis, K.; Stamati, A. Photogrammetric Re-Discovery of the Hidden Long-Term Landscapes of Western Thessaly, Central Greece. J. Archaeol. Sci. 2015, 64, 100–109. [Google Scholar] [CrossRef]
- Zekkos, D.; Zalachoris, G.; Alvertos, A.E.; Amatya, P.M.; Blunts, P.; Marin, C.; Dafis, S.; Farmakis, I.; Athanassios, G.; Madeline, H.; et al. The September 18–20 2020 Medicane Ianos Impact on Greece Phase I Reconnaissance Report. 2020. Available online: https://ntrs.nasa.gov/api/citations/20205011398/downloads/Medicane%20Ianos%20GEER%20Report.pdf (accessed on 12 February 2024).
- Bathrellos, G.D.; Skilodimou, H.D.; Soukis, K.; Koskeridou, E. Temporal and Spatial Analysis of Flood Occurrences in the Drainage Basin of Pinios River (Thessaly, Central Greece). Land 2018, 7, 106. [Google Scholar] [CrossRef]
- DeVries, B.; Huang, C.; Armston, J.; Huang, W.; Jones, J.W.; Lang, M.W. Rapid and Robust Monitoring of Flood Events Using Sentinel-1 and Landsat Data on the Google Earth Engine. Remote Sens. Environ. 2020, 240, 111664. [Google Scholar] [CrossRef]
- Diakakis, M.; Mavroulis, S.; Deligiannakis, G. Floods in Greece, a Statistical and Spatial Approach. Nat. Hazards 2012, 62, 485–500. [Google Scholar] [CrossRef]
- Copernicus Sentinel-2 Imagery Agricultural Areas Around Thessaly, Greece, Remain Flooded 2023. Available online: https://www.copernicus.eu/en/media/image-day-gallery/agricultural-areas-around-thessaly-greece-remain-flooded (accessed on 3 March 2024).
- Gaki-Papanastassiou, K.; Karymbalis, E.; Maroukian, H. Recent geomorphic changes and anthropogenic activities in the deltaic plain of Pinios river in Central Greece. Bull. Geol. Soc. Greece 2017, 43, 409. [Google Scholar] [CrossRef]
- Farhadi, H.; Esmaeily, A.; Najafzadeh, M. Flood Monitoring by Integration of Remote Sensing Technique and Multi-Criteria Decision Making Method. Comput. Geosci. 2022, 160, 105045. [Google Scholar] [CrossRef]
- Burayu, D.G.; Karuppannan, S.; Shuniye, G. Identifying Flood Vulnerable and Risk Areas Using the Integration of Analytical Hierarchy Process (AHP), GIS, and Remote Sensing: A Case Study of Southern Oromia Region. Urban Clim. 2023, 51, 101640. [Google Scholar] [CrossRef]
- Elsadek, W.M.; Wahba, M.; Al-Arifi, N.; Kanae, S.; El-Rawy, M. Scrutinizing the Performance of GIS-Based Analytical Hierarchical Process Approach and Frequency Ratio Model in Flood Prediction—Case Study of Kakegawa, Japan. Ain Shams Eng. J. 2024, 15, 102453. [Google Scholar] [CrossRef]
- Bruno, L.S.; Mattos, T.S.; Oliveira, P.T.S.; Almagro, A.; Rodrigues, D.B.B. Hydrological and Hydraulic Modeling Applied to Flash Flood Events in a Small Urban Stream. Hydrology 2022, 9, 223. [Google Scholar] [CrossRef]
- El-Bagoury, H.; Gad, A. Integrated Hydrological Modeling for Watershed Analysis, Flood Prediction, and Mitigation Using Meteorological and Morphometric Data, SCS-CN, HEC-HMS/RAS, and QGIS. Water 2024, 16, 356. [Google Scholar] [CrossRef]
- Yu, J.; Liu, D.; Wang, X.; Zhu, J.; Liao, Z.; Cai, J. A Transition Zone Boundary Determining Method Based on MIKE21: A Case Study of Baiyangdian Lake, North China. J. Hydrol. 2024, 638, 131447. [Google Scholar] [CrossRef]
- Varra, G.; Della Morte, R.; Tartaglia, M.; Fiduccia, A.; Zammuto, A.; Agostino, I.; Booth, C.A.; Quinn, N.; Lamond, J.E.; Cozzolino, L. Flood Susceptibility Assessment for Improving the Resilience Capacity of Railway Infrastructure Networks. Water 2024, 16, 2592. [Google Scholar] [CrossRef]
- Maranzoni, A.; D’Oria, M.; Rizzo, C. Quantitative Flood Hazard Assessment Methods: A Review. J. Flood Risk Manag. 2023, 16, e12855. [Google Scholar] [CrossRef]
- Guerri, G.; Crisci, A.; Morabito, M. Urban Microclimate Simulations Based on GIS Data to Mitigate Thermal Hot-Spots: Tree Design Scenarios in an Industrial Area of Florence. Build. Environ. 2023, 245, 110854. [Google Scholar] [CrossRef]
- Topuz, M.; Deniz, M. Application of GIS and AHP for Land Use Suitability Analysis: Case of Demirci District (Turkey). Humanit. Soc. Sci. Commun. 2023, 10, 115. [Google Scholar] [CrossRef]
- Awan, H.H.; Kabdrakhmanova, M.; Varol, H.A.; Karaca, F. A GIS-Based Emergency Response and Management Support Framework for Earthquake Crisis: A Case Study of Antakya and Kahramanmaras Earthquake in Turkey. Int. J. Disaster Risk Reduct. 2024, 111, 104706. [Google Scholar] [CrossRef]
- Niu, H.; Shao, S.; Gao, J.; Jing, H. Research on GIS-Based Information Value Model for Landslide Geological Hazards Prediction in Soil-Rock Contact Zone in Southern Shaanxi. Phys. Chem. Earth Parts A/B/C 2024, 133, 103515. [Google Scholar] [CrossRef]
- Park, H.S.; Kwon, S.A.; Azam, M. A Study on GIS-Based Spatial Analysis of Emergency Response for Disaster Management: Focusing on Seoul. Heliyon 2024, 10, e28669. [Google Scholar] [CrossRef]
- Taiwo, B.E.; Kafy, A.-A.; Samuel, A.A.; Rahaman, Z.A.; Ayowole, O.E.; Shahrier, M.; Duti, B.M.; Rahman, M.T.; Peter, O.T.; Abosede, O.O. Monitoring and Predicting the Influences of Land Use/Land Cover Change on Cropland Characteristics and Drought Severity Using Remote Sensing Techniques. Environ. Sustain. Indic. 2023, 18, 100248. [Google Scholar] [CrossRef]
- Suwanno, P.; Yaibok, C.; Pornbunyanon, T.; Kanjanakul, C.; Buathongkhue, C.; Tsumita, N.; Fukuda, A. GIS-Based Identification and Analysis of Suitable Evacuation Areas and Routes in Flood-Prone Zones of Nakhon Si Thammarat Municipality. IATSS Res. 2023, 47, 416–431. [Google Scholar] [CrossRef]
- Geological Survey Ireland Historic Groundwater Flood Map. Geological Survey Ireland. Available online: https://data.gov.ie/ga/dataset/historic-groundwater-flood-map-120000-ireland-roi-itm (accessed on 19 October 2024).
- Dean, M. Chapter Six—Multi-Criteria Analysis. In Standard Transport Appraisal Methods; Mouter, N., Ed.; Advances in Transport Policy and Planning; Academic Press: Cambridge, MA, USA, 2020; Volume 6, pp. 165–224. [Google Scholar]
- Toosi, A.S.; Calbimonte, G.H.; Nouri, H.; Alaghmand, S. River Basin-Scale Flood Hazard Assessment Using a Modified Multi-Criteria Decision Analysis Approach: A Case Study. J. Hydrol. 2019, 574, 660–671. [Google Scholar] [CrossRef]
- Al-Taani, A.; Al-husban, Y.; Ayan, A. Assessment of Potential Flash Flood Hazards. Concerning Land Use/Land Cover in Aqaba Governorate, Jordan, Using a Multi-Criteria Technique. Egypt. J. Remote Sens. Space Sci. 2023, 26, 17–24. [Google Scholar] [CrossRef]
- Saaty, T.L. The Analytic Hierarchy Process (AHP). J. Oper. Res. Soc. 1980, 41, 1073–1076. [Google Scholar]
- Mokhtari, E.; Farouk, M.; Abdelkebir, B.; Engel, B. Flood Risk Assessment Using Analytical Hierarchy Process: A Case Study from the Cheliff-Ghrib Watershed, Algeria. J. Water Clim. Change 2023, 14, 694–711. [Google Scholar] [CrossRef]
- Wubalem, A.; Tesfaw, G.; Dawit, Z.; Getahun, B.; Mekuria, T.; Jothimani, M. Comparison of Statistical and Analytical Hierarchy Process Methods on Flood Susceptibility Mapping: In a Case Study of the Lake Tana Sub-Basin in Northwestern Ethiopia. Open Geosci. 2021, 13, 1668–1688. [Google Scholar] [CrossRef]
- Gemitzi, A.; Kopsidas, O.; Stefani, F.; Polymeros, A.; Bellos, V. A Constantly Updated Flood Hazard Assessment Tool Using Satellite-Based High-Resolution Land Cover Dataset Within Google Earth Engine. Land 2024, 13, 1929. [Google Scholar] [CrossRef]
- Poeppl, R.E.; Fryirs, K.A.; Tunnicliffe, J.; Brierley, G.J. Managing Sediment (Dis)Connectivity in Fluvial Systems. Sci. Total Environ. 2020, 736, 139627. [Google Scholar] [CrossRef]
- Waseem, M.; Ahmad, S.; Ahmad, I.; Wahab, H.; Leta, M.K. Urban Flood Risk Assessment Using AHP and Geospatial Techniques in Swat Pakistan. SN Appl. Sci. 2023, 5, 215. [Google Scholar] [CrossRef]
- Radhakrishnan, S.; Duraisamy Rajasekaran, S.K.; Sujatha, E.R.; Neelakantan, T.R. A Comparative Study on 2015 and 2023 Chennai Flooding: A Multifactorial Perspective. Water 2024, 16, 2477. [Google Scholar] [CrossRef]
- Sofia, G.; Nikolopoulos, E.I. Floods and Rivers: A Circular Causality Perspective. Sci. Rep. 2020, 10, 5175. [Google Scholar] [CrossRef]
- Kido, R.; Inoue, T.; Hatono, M.; Yamanoi, K. Assessing the Impact of Climate Change on Sediment Discharge Using a Large Ensemble Rainfall Dataset in Pekerebetsu River Basin, Hokkaido. Prog. Earth Planet. Sci. 2023, 10, 54. [Google Scholar] [CrossRef]
- Nkwasa, A.; Chawanda, C.J.; Schlemm, A.; Ekolu, J.; Frieler, K.; van Griensven, A. Historical Climate Impact Attribution of Changes in River Flow and Sediment Loads at Selected Gauging Stations in the Nile Basin. Clim. Change 2024, 177, 42. [Google Scholar] [CrossRef]
- Karamvasis, K.; Karathanassi, V. FLOMPY: An Open-Source Toolbox for Floodwater Mapping Using Sentinel-1 Intensity Time Series. Water 2021, 13, 2943. [Google Scholar] [CrossRef]
- Mavroulis, S.; Mavrouli, M.; Lekkas, E.; Tsakris, A. Impact of the September 2023 Storm Daniel and Subsequent Flooding in Thessaly (Greece) on the Natural and Built Environment and on Infectious Disease Emergence. Environments 2024, 11, 163. [Google Scholar] [CrossRef]
- Dimitriou, E.; Efstratiadis, A.; Zotou, I.; Papadopoulos, A.; Iliopoulou, T.; Sakki, G.-K.; Mazi, K.; Rozos, E.; Koukouvinos, A.; Koussis, A.D.; et al. Post-Analysis of Daniel Extreme Flood Event in Thessaly, Central Greece: Practical Lessons and the Value of State-of-the-Art Water-Monitoring Networks. Water 2024, 16, 980. [Google Scholar] [CrossRef]
- Moraiti, K.; Sigourou, S.; Dimitriadis, P.; Ioannidis, R.; Benekos, I.; Iliopoulou, T.; Kitsou, O.; Mamassis, N.; Koutsoyiannis, D.; Sargentis, G.F. Documenting the Changing Floodplain of Nileas Basin in North Euboea (Greece) before and after Storms Daniel and Elias. Rural Reg. Dev. 2024, 2, 10013. [Google Scholar] [CrossRef]
- Meteosearch Trikala Station (LG57). Available online: https://meteosearch.meteo.gr/data/list-station-files720.cfm (accessed on 10 January 2024).
- Copernicus Emergency Management Service EMSR271: Floods in Central Greece 2018. Available online: https://mapping.emergency.copernicus.eu/activations/EMSR271/ (accessed on 10 January 2024).
- Copernicus Emergency Management Service EMSR465: Floods in Thessaly Region, Greece 2020. Available online: https://emergency.copernicus.eu/mapping/list-of-components/EMSR465 (accessed on 10 January 2024).
- Copernicus Emergency Management Service Flood in Greece—EMSR692—Situational Reporting 2023. Available online: https://rapidmapping.emergency.copernicus.eu/EMSR692/reporting (accessed on 10 January 2024).
- Copernicus Land Monitoring Service CLC+Backbone 2018 (Raster 10 m), Europe, 3-Yearly 2018. Available online: https://land.copernicus.eu/en/products/clc-backbone/clc-backbone-2018 (accessed on 10 January 2024).
- Esri Tabulate Area (Spatial Analyst)—ArcGIS Pro Documentation 2024. Available online: https://pro.arcgis.com/en/pro-app/latest/tool-reference/spatial-analyst/tabulate-area.htm (accessed on 13 May 2024).
- Jemai, S.; Belkendil, A.; Kallel, A.; Ayadi, I. Assessment of Flood Risk Using Hierarchical Analysis Process Method and Remote Sensing Systems through Arid Catchment in Southeastern Tunisia. J. Arid Environ. 2024, 222, 105150. [Google Scholar] [CrossRef]
- Shadmaan, M.S.; Hassan, K.M. Assessment of Flood Susceptibility in Sylhet Using Analytical Hierarchy Process and Geospatial Technique. Geomatica 2024, 76, 100003. [Google Scholar] [CrossRef]
- Aichi, A.; Ikirri, M.; Haddou, M.A.; Quesada-Román, A.; Sahoo, S.; Singha, C.; Sajinkumar, K.S.; Abioui, M. Integrated GIS and Analytic Hierarchy Process for Flood Risk Assessment in the Dades Wadi Watershed (Central High Atlas, Morocco). Results Earth Sci. 2024, 2, 100019. [Google Scholar] [CrossRef]
- Zhang, B.; Zhang, L.; Chen, B.; Deng, L.; Fu, B.; Yan, M.; Ji, C. Assessment of Mangrove Health Based on Pressure–State–Response Framework in Guangxi Beibu Gulf, China. Ecol. Indic. 2024, 167, 112685. [Google Scholar] [CrossRef]
- Koroma, A.O.; Saber, M.; Abdelbaki, C. Urban Flood Vulnerability Assessment in Freetown, Sierra Leone: AHP Approach. Hydrology 2024, 11, 158. [Google Scholar] [CrossRef]
- Cao, X.; Zhang, J.; Meng, H.; Lai, Y.; Xu, M. Remote Sensing Inversion of Water Quality Parameters in the Yellow River Delta. Ecol. Indic. 2023, 155, 110914. [Google Scholar] [CrossRef]
- Moreira, L.L.; de Brito, M.M.; Kobiyama, M. Effects of Different Normalization, Aggregation, and Classification Methods on the Construction of Flood Vulnerability Indexes. Water 2021, 13, 98. [Google Scholar] [CrossRef]
- Vojtek, M.; Vojteková, J. Flood Susceptibility Mapping on a National Scale in Slovakia Using the Analytical Hierarchy Process. Water 2019, 11, 364. [Google Scholar] [CrossRef]
- Bačová Mitková, V.; Halmová, D.; Pekárová, P.; Miklánek, P. The Copula Application for Analysis of the Flood Threat at the River Confluences in the Danube River Basin in Slovakia. Water 2023, 15, 984. [Google Scholar] [CrossRef]
- Pregnolato, M.; Winter, A.O.; Mascarenas, D.; Sen, A.D.; Bates, P.; Motley, M.R. Assessing Flooding Impact to Riverine Bridges: An Integrated Analysis. Nat. Hazards Earth Syst. Sci. 2022, 22, 1559–1576. [Google Scholar] [CrossRef]
- Elhag, M.; Yilmaz, N. Insights of Remote Sensing Data to Surmount Rainfall/Runoff Data Limitations of the Downstream Catchment of Pineios River, Greece. Environ. Earth Sci. 2021, 80, 35. [Google Scholar] [CrossRef]
- Bathrellos, G.D.; Gaki-Papanastassiou, K.; Skilodimou, H.D.; Papanastassiou, D.; Chousianitis, K.G. Potential Suitability for Urban Planning and Industry Development Using Natural Hazard Maps and Geological–Geomorphological Parameters. Environ. Earth Sci. 2012, 66, 537–548. [Google Scholar] [CrossRef]
- Kittipongvises, S.; Phetrak, A.; Rattanapun, P.; Brundiers, K.; Buizer, J.L.; Melnick, R. AHP-GIS Analysis for Flood Hazard Assessment of the Communities Nearby the World Heritage Site on Ayutthaya Island, Thailand. Int. J. Disaster Risk Reduct. 2020, 48, 101612. [Google Scholar] [CrossRef]
- Dash, P.; Sar, J. Identification and Validation of Potential Flood Hazard Area Using GIS -based Multi-criteria Analysis and Satellite Data-derived Water Index. J. Flood Risk Manag. 2020, 13, e12620. [Google Scholar] [CrossRef]
Disclaimer/Publisher’s Note: The statements, opinions and data contained in all publications are solely those of the individual author(s) and contributor(s) and not of MDPI and/or the editor(s). MDPI and/or the editor(s) disclaim responsibility for any injury to people or property resulting from any ideas, methods, instructions or products referred to in the content. |
© 2025 by the authors. Licensee MDPI, Basel, Switzerland. This article is an open access article distributed under the terms and conditions of the Creative Commons Attribution (CC BY) license (https://creativecommons.org/licenses/by/4.0/).

