Article

Beyond Polarity: Forecasting Consumer Sentiment with Aspect- and Topic-Conditioned Time Series Models

by
Mian Usman Sattar
1,
Raza Hasan
2,*,
Sellappan Palaniappan
3,
Salman Mahmood
4 and
Hamza Wazir Khan
5
1
College of Science and Engineering, University of Derby, Kedleston Road, Derby DE22 1GB, UK
2
Department of Science and Engineering, Southampton Solent University, Southampton SO14 0YN, UK
3
Faculty of Computing and Digital Technology, HELP University, Kuala Lumpur 50490, Malaysia
4
Department of Computer Science, Nazeer Hussain University, ST-2, Near Karimabad, Karachi 75950, Pakistan
5
Department of Business Studies, Namal University, Mianwali 42250, Pakistan
*
Author to whom correspondence should be addressed.
Information 2025, 16(8), 670; https://doi.org/10.3390/info16080670
Submission received: 4 July 2025 / Revised: 1 August 2025 / Accepted: 4 August 2025 / Published: 6 August 2025
(This article belongs to the Special Issue Semantic Networks for Social Media and Policy Insights)

Abstract

Existing approaches to social media sentiment analysis typically focus on static classification, offering limited foresight into how public opinion evolves. This study addresses that gap by introducing the Multi-Feature Sentiment-Driven Forecasting (MFSF) framework, a novel pipeline that enhances sentiment trend prediction by integrating rich contextual information from text. Using state-of-the-art transformer models on the Sentiment140 dataset, our framework extracts three concurrent signals from each tweet: sentiment polarity, aspect-based scores (e.g., ‘price’ and ‘service’), and topic embeddings. These features are aggregated into a daily multivariate time series. We then employ a SARIMAX model to forecast future sentiment, using the extracted aspect and topic data as predictive exogenous variables. Our results, validated on the historical Sentiment140 Twitter dataset, demonstrate the framework’s superior performance. The proposed multivariate model achieved a 26.6% improvement in forecasting accuracy (RMSE) over a traditional univariate ARIMA baseline. The analysis confirmed that conversational aspects like ‘service’ and ‘quality’ are statistically significant predictors of future sentiment. By leveraging the contextual drivers of conversation, the MFSF framework provides a more accurate and interpretable tool for businesses and policymakers to proactively monitor and anticipate shifts in public opinion.

1. Introduction

In the contemporary digital era, social media platforms have evolved from simple communication channels into vast, real-time repositories of public opinion and consumer sentiment. Platforms such as Twitter, Reddit, and Facebook host a continuous stream of user-generated content, offering an unprecedented window into the collective attitudes, preferences, and emotions of millions of individuals [1]. This explosion of unstructured data represents a paradigm shift in market research, moving beyond the limitations of traditional methods like surveys and focus groups, which are often characterized by high costs, significant time lags, and potential sample biases [2]. Social media analytics provides an opportunity to listen to the ‘voice of the customer’ at a scale and velocity previously unimaginable, enabling organizations to detect nascent trends, track brand perception, and respond to consumer feedback with remarkable agility. This study leverages public sentiment from Twitter as a proxy for broader consumer sentiment, acknowledging that while powerful, this data source is subject to demographic sampling bias. Our work addresses the critical gap between static sentiment analysis and dynamic forecasting, aiming to predict not just what the sentiment is, but where it is headed and why.

1.1. The Evolution of Sentiment Analysis

The primary tool for making sense of this textual data has been sentiment analysis, a field of Natural Language Processing (NLP) dedicated to automatically identifying and extracting subjective information from text. The discipline has undergone a significant evolution. Early approaches relied on lexicon-based methods (e.g., SentiWordNet), which classified text based on the presence of words with pre-assigned sentiment scores. While fast and interpretable, these methods often struggled with the nuance, context, and slang prevalent in social media discourse [3].
The advent of machine learning and, more recently, deep learning, brought substantial improvements. The transformer architecture, epitomized by models like BERT (Bidirectional Encoder Representations from Transformers) and its variants, revolutionized the field by enabling models to understand text in a deeply contextual manner [4]. These models have achieved state-of-the-art performance on a wide range of NLP tasks, including sentiment classification.

1.2. The Gap: From Static Classification to Dynamic Forecasting

Despite these advancements, the vast majority of sentiment analysis applications remain focused on static classification—assigning a simple ‘positive,’ ‘negative,’ or ‘neutral’ label to a document. This approach, while useful for descriptive analytics (i.e., understanding what has already happened), offers limited foresight. It fails to answer critical questions for strategic decision-making: Where is public sentiment headed? What are the underlying drivers of a sudden shift in consumer mood? An organization that only learns about a surge in customer dissatisfaction after the fact is already at a disadvantage.
The true strategic value of sentiment analysis lies in its potential to serve as a leading indicator for real-world behavioral outcomes. Previous research has established tantalizing links between aggregated social media sentiment and real-world outcomes. The seminal work presented in [5] demonstrates a correlation between public mood on Twitter and the stock market, while [6] shows that the volume and sentiment of tweets could effectively predict movie box office revenue [5]. These studies highlight the potential of social media data as a leading indicator for behavioral and economic trends. However, many of these studies treat sentiment as a monolithic, univariate signal overlooking the rich, multi-faceted nature of underlying conversations. They can predict that sentiment might fall, but not why. A critical gap in current research is the lack of a framework that systematically extracts and leverages the contextual drivers within the text—the specific aspects and topics being discussed—to create a more accurate and interpretable forecast.

1.3. Proposed Framework and Contributions

This study addresses this gap by introducing the Multi-Feature Sentiment-Driven Forecasting (MFSF) framework. We move beyond simple polarity forecasting by building a multivariate time series model that is conditioned on a rich set of features automatically extracted from the text itself. Our framework demonstrates that by understanding the context of the conversation, we can more accurately predict its future trajectory.
This paper makes the following primary contributions to the field:
  • A Novel Multi-Feature Framework: We propose and implement a framework that fuses three distinct types of textual signals—polarity scores, aspect-based confidence scores, and low-dimensional topic embeddings—to create a comprehensive, multivariate representation of daily public sentiment.
  • Application of Exogenous Forecasting Models: We demonstrate the successful application of a SARIMAX (Seasonal AutoRegressive Integrated Moving Average with eXogenous variables) model, using the extracted contextual features as predictive exogenous variables to enhance forecasting accuracy.
  • Rigorous Empirical Validation: We provide a robust, empirical comparison of our proposed multivariate model against a standard univariate Autoregressive Integrated Moving Average (ARIMA) baseline on the large-scale, real-world Sentiment140 dataset [7,8,9,10].
  • An Interpretable and Reproducible Pipeline: We present an end-to-end, reproducible methodology that not only improves predictive performance but also provides interpretable insights into which conversational features are statistically significant drivers of sentiment change.
The remainder of this paper is organized as follows. Section 2 provides a detailed review of the relevant literature in sentiment analysis and time series forecasting. Section 3 presents the complete methodology of the MFSF framework, including its architecture and the algorithmic procedure. Section 4 details the empirical results of our experiments, including an exploratory analysis, a comparison of forecasting models, and a statistical deep dive into our proposed model. Section 5 discusses the broader implications and limitations of our findings. Finally, Section 6 concludes the paper and proposes directions for future research.

2. Literature Review

This section reviews the two foundational streams underpinning our study: (1) the evolution of sentiment analysis, culminating in Aspect-Based Sentiment Analysis (ABSA), and (2) time series forecasting methods capable of incorporating exogenous variables. We then identify the research gap that our Multi-Feature Sentiment-Driven Forecasting (MFSF) framework addresses.

2.1. Evolution of Sentiment Analysis

2.1.1. Lexicon-Based and Traditional Machine Learning Approaches

Early sentiment systems relied on curated lexicons such as SentiWordNet and VADER to assign polarity scores to text without the need for annotated datasets. These rule-based approaches are lightweight and domain-independent, making them useful in low-resource or real-time scenarios [11,12]. However, they struggle to capture subtleties like sarcasm, negation, or contextual sentiment shifts.
To improve accuracy, machine learning methods such as Support Vector Machines (SVMs), Naive Bayes, and Decision Trees emerged, using hand-crafted features like TF-IDF, POS tags, and n-grams [13,14]. These supervised models require labeled data but can generalize better than rule-based systems when sufficient examples are available. Hybrid models that combine lexicons with machine learning have shown promise, especially in non-English or domain-specific corpora [15], revealing the complementary strengths of each approach.

2.1.2. Deep Learning: CNNs, LSTMs, and Beyond

The advent of deep learning shifted the field by automating feature extraction and improving the ability to model complex linguistic patterns. Convolutional Neural Networks (CNNs) capture local syntactic features and sentiment cues, while Recurrent Neural Networks (RNNs), particularly Long Short-Term Memory (LSTM) networks, could retain long-range dependencies in sequential text [16,17]. These models dramatically improved sentiment classification accuracy but were data-hungry and computationally expensive to train.
Enhancements such as bidirectional LSTMs and attention mechanisms allowed these models to weigh context more effectively, improving interpretability and handling of long-form text. In financial and social media domains, LSTM-based models have demonstrated robust performance across fluctuating sentiment dynamics [18].

2.1.3. Transformers and Aspect-Based Sentiment Analysis (ABSA)

Transformers, introduced in [19], have become the backbone of modern NLP by enabling massive pre-training on unlabeled data and efficient parallel computation. Models such as BERT, RoBERTa, and DistilBERT leverage contextual embeddings through self-attention mechanisms, achieving state-of-the-art results across sentiment tasks with minimal fine-tuning [4,20].
ABSA advances sentiment analysis by extracting sentiment tied to specific aspects within a sentence or document. For example, in ‘The screen is sharp but the battery is poor,’ traditional sentiment models may assign neutral sentiment, while ABSA identifies positive sentiment toward ‘screen’ and negative sentiment toward ‘battery.’ The surveys presented in [21,22] categorize ABSA into pipeline, joint, and end-to-end models. Recent advancements include instruction-based models (e.g., InstructBERT and Instruct-DeBERTa) that can generalize to unseen aspects and domains, enhancing zero-shot and few-shot learning scenarios [23]. Models like BART also enable zero-shot classification and user-defined aspect extraction without task-specific training [24], making ABSA more scalable and adaptable in real-world applications.

2.2. Time Series Forecasting Models

Forecasting methods aim to predict future values based on past trends. Accuracy is typically assessed using metrics such as the Mean Absolute Error (MAE), Mean Squared Error (MSE), and Root Mean Squared Error (RMSE), with growing interest in context-sensitive metrics for real-world deployments [25].

2.2.1. Traditional and Hybrid Models

Classical forecasting techniques include the Exponential Smoothing and Holt–Winters models, which are computationally efficient and well-suited for data with trend and seasonality components. ARIMA models are widely used due to their mathematical rigor and solid theoretical foundation [26]. However, these methods assume linearity and may underperform when patterns are non-linear or influenced by external shocks.
To address these limitations, hybrid models have been developed that combine ARIMA’s strength in capturing temporal dependence with the non-linear modeling power of machine learning algorithms like Neural Networks, Random Forests, or Gradient Boosted Trees [27]. In particular, LSTM-ARIMA hybrid models have shown superior performance in domains with both short-term fluctuations and long-term seasonality, such as financial forecasting and renewable energy output.

2.2.2. Exogenous Variables with SARIMAX

Univariate models fall short when external variables—such as holidays, promotions, weather, or public sentiment—drive fluctuations. SARIMAX overcomes this by incorporating external covariates, making it well-suited for multivariate forecasting under real-world constraints.
In renewable energy forecasting, exogenous inputs such as irradiance and temperature have improved solar power predictions [28]. In traffic modeling, SARIMAX with holiday and weather indicators outperforms standard ARIMA in both precision and interpretability [29]. More recent applications span retail sales prediction, hospital admission trends, and public behavior monitoring [30,31]. The ability of SARIMAX to integrate structured numerical variables with unstructured semantic features—such as sentiment scores from text—makes it a strong candidate for multi-modal forecasting systems.
The field of time series forecasting is rapidly evolving, with recent advancements in large language models (LLMs) giving rise to a new class of ‘foundation models’ for forecasting. Models such as TimeGPT and other generative AI-based approaches aim to perform zero-shot forecasting by learning from vast and diverse time series datasets [32]. These models offer the potential for high accuracy on a wide range of tasks without task-specific training. While a full comparison with these emerging methods is beyond the scope of this study—which prioritizes the interpretability of statistical models—they represent an exciting and important direction for the future of sentiment trend forecasting.

2.3. Research Gap and Our Contribution

While early studies have linked aggregated sentiment scores (e.g., daily mood on Twitter) with real-world outcomes like market movements [5] and movie revenues [6], they typically condense complex textual sentiment into a single index. This approach overlooks nuance, such as which product features or political issues are driving sentiment changes.
Simultaneously, ABSA research has focused on improving extraction accuracy and domain transferability but rarely considers how its outputs can serve downstream forecasting models. To our knowledge, no study has systematically integrated transformer-based ABSA features as exogenous inputs into a multivariate forecasting model such as SARIMAX.
Our proposed Multi-Feature Sentiment-Driven Forecasting (MFSF) framework bridges this methodological gap. It introduces a modular, explainable pipeline that (1) extracts aspect-level sentiment using state-of-the-art ABSA models, (2) selects relevant aspects via dynamic topic modeling, and (3) forecasts sentiment trajectories using SARIMAX, with ABSA outputs serving as structured predictors. This design not only enhances predictive accuracy but also improves interpretability by revealing which aspects influence future sentiment trends and how.

3. Methodology

This section details the proposed Multi-Feature Sentiment-Driven Forecasting Framework (MFSF), an end-to-end pipeline designed to forecast consumer sentiment trends by leveraging rich contextual information extracted from social media text. The framework’s novelty lies in its fusion of multiple semantic dimensions—polarity, aspects, and topics—into a multivariate time series model, providing a more nuanced and accurate predictive tool than traditional univariate approaches. While this framework is designed for the dynamic forecasting of sentiment trends, for the purpose of this research, we implement it in a batch-processing mode to ensure a rigorous and reproducible evaluation. However, the modular architecture is amenable to a streaming implementation for real-time applications, where features would be extracted and forecasts are updated sequentially as new data arrives. The overall architecture is structured into five sequential stages, as illustrated in Figure 1: (1) Data Collection and Preprocessing, (2) Multi-Modal Feature Extraction, (3) Temporal Aggregation, (4) Forecasting using Exogenous Variables, and (5) Evaluation.

3.1. MFSF System Architecture

The architecture of the MFSF framework, depicted in Figure 1, outlines the systematic flow of data from raw text ingestion to the final predictive output. The pipeline is designed to be modular, enabling the substitution of different models at each feature extraction stage. It begins by processing raw tweets from the Sentiment140 corpus, which are then fed into three parallel transformer-based modules for feature extraction. The extracted features are temporally aggregated to form a multivariate time series, which serves as the input for the forecasting models.
The diagram illustrates the parallel extraction of polarity, aspect, and topic features from raw tweets. These features are then temporally aggregated to form a multivariate time series, which serves as the input for the SARIMAX forecasting model.

3.2. Data Collection and Preprocessing

The foundation of this study is the Sentiment140 dataset, originally developed by Go, Bhayani, and Huang [8]. This widely used public corpus contains 1.6 million tweets annotated for sentiment. The dataset’s labels were generated using distant supervision, where emoticons like :) and :( served as noisy labels for positive and negative sentiment, respectively. For this research, the dataset was treated as a binary classification problem, with the original labels 0 (negative) and 4 (positive) being mapped to 0 and 1. To handle potential missing values or corrupted entries common in raw social media data, we performed a cleaning step where tweets with unparsable dates were dropped. The subsequent daily aggregation of features into mean scores and counts naturally mitigates the impact of noise from individual tweets, creating a more stable, structured time series for analysis.
A random subsample of 50,000 tweets was selected to ensure computational feasibility for the extensive feature extraction process. Preprocessing was focused on the date field, which was cleaned of timezone abbreviations and converted into a standardized YYYY-MM-DD format to facilitate daily aggregation. The tweet text was kept in its raw form to allow the transformer models to leverage the original context, including slang, capitalization, and punctuation.

3.3. Multi-Modal Feature Extraction

The core innovation of the MFSF framework is the extraction of a rich feature vector from each tweet, capturing sentiment polarity, thematic aspects, and general topical content.

3.3.1. Polarity Score Extraction

To establish a robust sentiment signal, we employed a pre-trained DistilBERT model fine-tuned on the Stanford Sentiment Treebank (SST-2) dataset (distilbert-base-uncased-finetuned-sst-2-english) [31]. As a distilled version of BERT, DistilBERT retains most of its parent model’s language-understanding capabilities while being significantly smaller and faster, making it ideal for efficient, large-scale inference. This model is specifically optimized for binary sentiment classification (Positive/Negative). For each tweet’s text, the model predicts a label, which is then mapped to a numerical score: +1 for ‘POSITIVE’ and −1 for ‘NEGATIVE’. This discrete mapping provides a clear and strong daily signal, avoiding the zero-variance issue common with three-class models that heavily favor a ‘NEUTRAL’ output on ambiguous text.

3.3.2. Aspect Score Extraction

To understand what consumers are discussing, we performed aspect extraction using a zero-shot classification pipeline based on the BART (Bidirectional and Auto-Regressive Transformers) model (facebook/bart-large-mnli) [24]. BART is uniquely suited for this task because its architecture combines a bidirectional encoder with an auto-regressive decoder, allowing it to effectively perform zero-shot classification by framing it as a textual entailment problem without requiring task-specific training. This approach allows for the classification of text against a set of predefined labels without requiring a specifically trained model for those labels. We defined a set of business-relevant aspects: [‘price’, ‘service’, ‘quality’, ‘features’]. For each tweet, the model returns a vector of confidence scores, representing the probability that the tweet pertains to each aspect. This provides a nuanced view of the daily conversation’s focus.

3.3.3. Topical Embedding and Dimensionality Reduction

To capture the general topic or semantic essence of each tweet beyond predefined aspects, we generated contextual embeddings. We used a pre-trained DistilBERT model (distilbert-base-uncased) to process each tweet. The embedding of the special [CLS] token from the final hidden layer, a 768-dimensional vector, was used as a representation of the entire tweet’s meaning [20].
As using a 768-dimensional vector for each tweet in a daily aggregation is computationally intensive and prone to the curse of dimensionality, we applied dimensionality reduction. We chose Principal Component Analysis (PCA) for this task over other techniques like t-SNE or UMAP for several key reasons. While t-SNE and UMAP are powerful for visualization because they preserve local neighborhood structures, they are non-linear and computationally more expensive. More importantly, their stochastic nature can lead to different results on each run, making them less suitable for generating stable, reproducible features for a predictive model. In contrast, PCA is a deterministic, linear transformation that is computationally efficient and creates orthogonal (uncorrelated) components. These stable and independent features are ideal as exogenous variables for a linear forecasting model like SARIMAX.
We applied PCA to reduce the embeddings from all tweets in the sample, projecting them onto their first two principal components. This process yields two new features, topic_x and topic_y, which represent the tweet’s position in a reduced two-dimensional topic space, effectively capturing the most significant sources of variance in the topical content of the corpus.

3.4. Algorithmic Procedure and Model Formulation

The end-to-end implementation of the framework, from data ingestion to final forecast, is formalized in Algorithm 1. This procedure is followed by the mathematical formulation of the aggregated time series and the forecasting models.
Algorithm 1: The Multi-Feature Sentiment Forecasting (MFSF) Procedure
Input: Raw tweet dataset D = { ( t i ,   t e x t i ,   d a t e i ) } i = 1 N .
Output: Forecasted sentiment series Y ^ f o r e c a s t ; Model performance metrics (RMSE, MAE).
 1.
Initialize Models: Load pre-trained pipelines and models for polarity, aspect, and embedding extraction. Initialize PCA.
 2.
Feature Extraction Loop:
  • for each tweet di in D:
    sifp(texti) // Polarity Score (+1/−1)
    aifa(texti) // Aspect Score Vector
    // High-dimensional embedding
    Store(si,ai,ei,datei).
  • end for
 3.
Dimensionality Reduction:
E ← Stack all embedding vectors ei into a matrix.
// Reduce to topic vectors ti.
Merge topic vectors ti with other extracted features.
 4.
Temporal Aggregation:
daily_data ← Group all features by date and compute mean for scores and count for volume.
Calculate Rolling_Sentiment (YT) on daily_data using a 7-day rolling window.
 5.
Train & Evaluate Baseline Model (Univariate ARIMA):
Split daily_data [‘Rolling_Sentiment’] into train_uni and test_uni.
Fit ARIMA(5,1,0) model on train_uni and predict on test_uni.
Calculate RMSE_arima and MAE_arima.
 6.
Train & Evaluate Proposed Model (Multivariate SARIMAX):
Split daily_data into train_multi and test_multi.
Define exog_features.
Fit SARIMAX(5,1,0) model on train_multi with exog_features.
Predict on test_multi using its exogenous features.
Calculate RMSE_sarimax and MAE_sarimax.
 7.
Return All forecasts and performance metrics.
Mathematical Formulation: Let the dataset be a corpus of tweets, D = {d1,…,dN}, where each tweet, di, has a tuple of extracted features and a date, τi. The daily aggregated time series for a given day T is constructed as follows:
Daily Average Polarity Score (ST):  S T = 1 D T d i D T p o l a r i t y s c o r e i
Daily Tweet Volume (VT):  V T = D T
Daily Average Aspect Vector (AT):  A T = 1 D T d i D T a i
Daily Average Topic Vector (TT):  T T = 1 D T d i D T t i
The target variable for our forecasting models, the 7-Day Rolling Sentiment (YT), is calculated to smooth daily noise and capture weekly trends:
Y T = 1 7 j = 0 6 S T j

3.5. Forecasting Models

To evaluate the predictive power of our multi-feature approach, we implemented and compared a baseline univariate model against our proposed multivariate model. The dataset was split into a training set (first 80%) and a testing set (final 20%).
Our choice of a univariate ARIMA as a baseline and a multivariate SARIMAX as the proposed model is driven by our central goal: to build an interpretable forecasting framework. While more complex deep learning models, such as LSTMs or other transformer-based architectures, may offer higher predictive accuracy, they often function as ‘black boxes,’ making it difficult to quantify the specific influence of each contextual feature. The SARIMAX model, however, provides directly interpretable coefficients for each exogenous variable, allowing us to explicitly test our hypothesis that aspect- and topic-level features are significant drivers of future sentiment. This focus on interpretability is crucial for generating actionable insights for businesses and policymakers.

3.5.1. Baseline Model: Univariate ARIMA

As a baseline, we employed a standard ARIMA model. The ARIMA(p,d,q) model captures the linear dependencies within a time series based on its own past values. This model was trained solely on the historical values of the Rolling_Sentiment series (YT) to forecast its future values. The model order (p,d,q) was determined using standard time series analysis techniques. The differencing order, d = 1, was chosen to make the time series stationary. The autoregressive (AR) order, p = 5, and moving average (MA) order, q = 0, were selected by examining the patterns in the Autocorrelation (ACF) and Partial Autocorrelation (PACF) plots of the different series. This (5,1,0) order was chosen to capture the significant short-term dependencies in the data. While information criteria like AIC or BIC can also be used for model selection, the ACF/PACF approach provides a well-established and effective method for identifying an appropriate model structure.

3.5.2. Proposed Model: Multivariate SARIMAX

Our proposed model is a Seasonal AutoRegressive Integrated Moving Average with eXogenous variables (SARIMAX). Since our daily data lacks a strong seasonal component, this simplifies to an ARIMAX model, which extends ARIMA by incorporating external predictor variables. The model is specified as
φ p ( B ) 1 B d ( Y T k 1 r β k X k , T ) = θ q B T
Here, YT is the endogenous variable (Rolling_Sentiment). The exogenous variables, XT, comprise the set of other daily aggregated features: Tweet_Count, the mean scores for price, service, quality, and features, and the mean topic dimensions topic_x and topic_y. The term β k represents the learned coefficient for each exogenous variable, providing insights into its predictive importance.

3.6. Evaluation Metrics

The performance of the forecasting models was evaluated using two standard metrics:
RMSE: This measures the standard deviation of the prediction errors. It is sensitive to large errors.
R M S E = 1 n i = 1 n ( y i y ^ i ) 2
MAE: This measures the average magnitude of the errors, providing an easily interpretable assessment of the average error size.
M A E = 1 n i = 1 n y i y ^ i
Lower values for both the RMSE and MAE indicate higher forecasting accuracy.

4. Results

This section presents the empirical results of the Multi-Feature Sentiment-Driven Forecasting (MFSF) framework. The analysis is structured to first explore the relationships between the extracted features and then to evaluate the performance of the forecasting models, and finally, to dissect the statistical significance of the proposed multivariate model. The findings provide strong evidence that incorporating contextual features significantly enhances the accuracy of sentiment trend forecasting.

4.1. Exploratory Data Analysis of Aggregated Features

Before training the forecasting models, an exploratory analysis was conducted on the daily aggregated time series data to validate the potential utility of the extracted exogenous features. The primary goal was to determine whether a statistical relationship exists between the target variable (Rolling_Sentiment) and the contextual features (Tweet_Count, aspect scores, and topic dimensions).
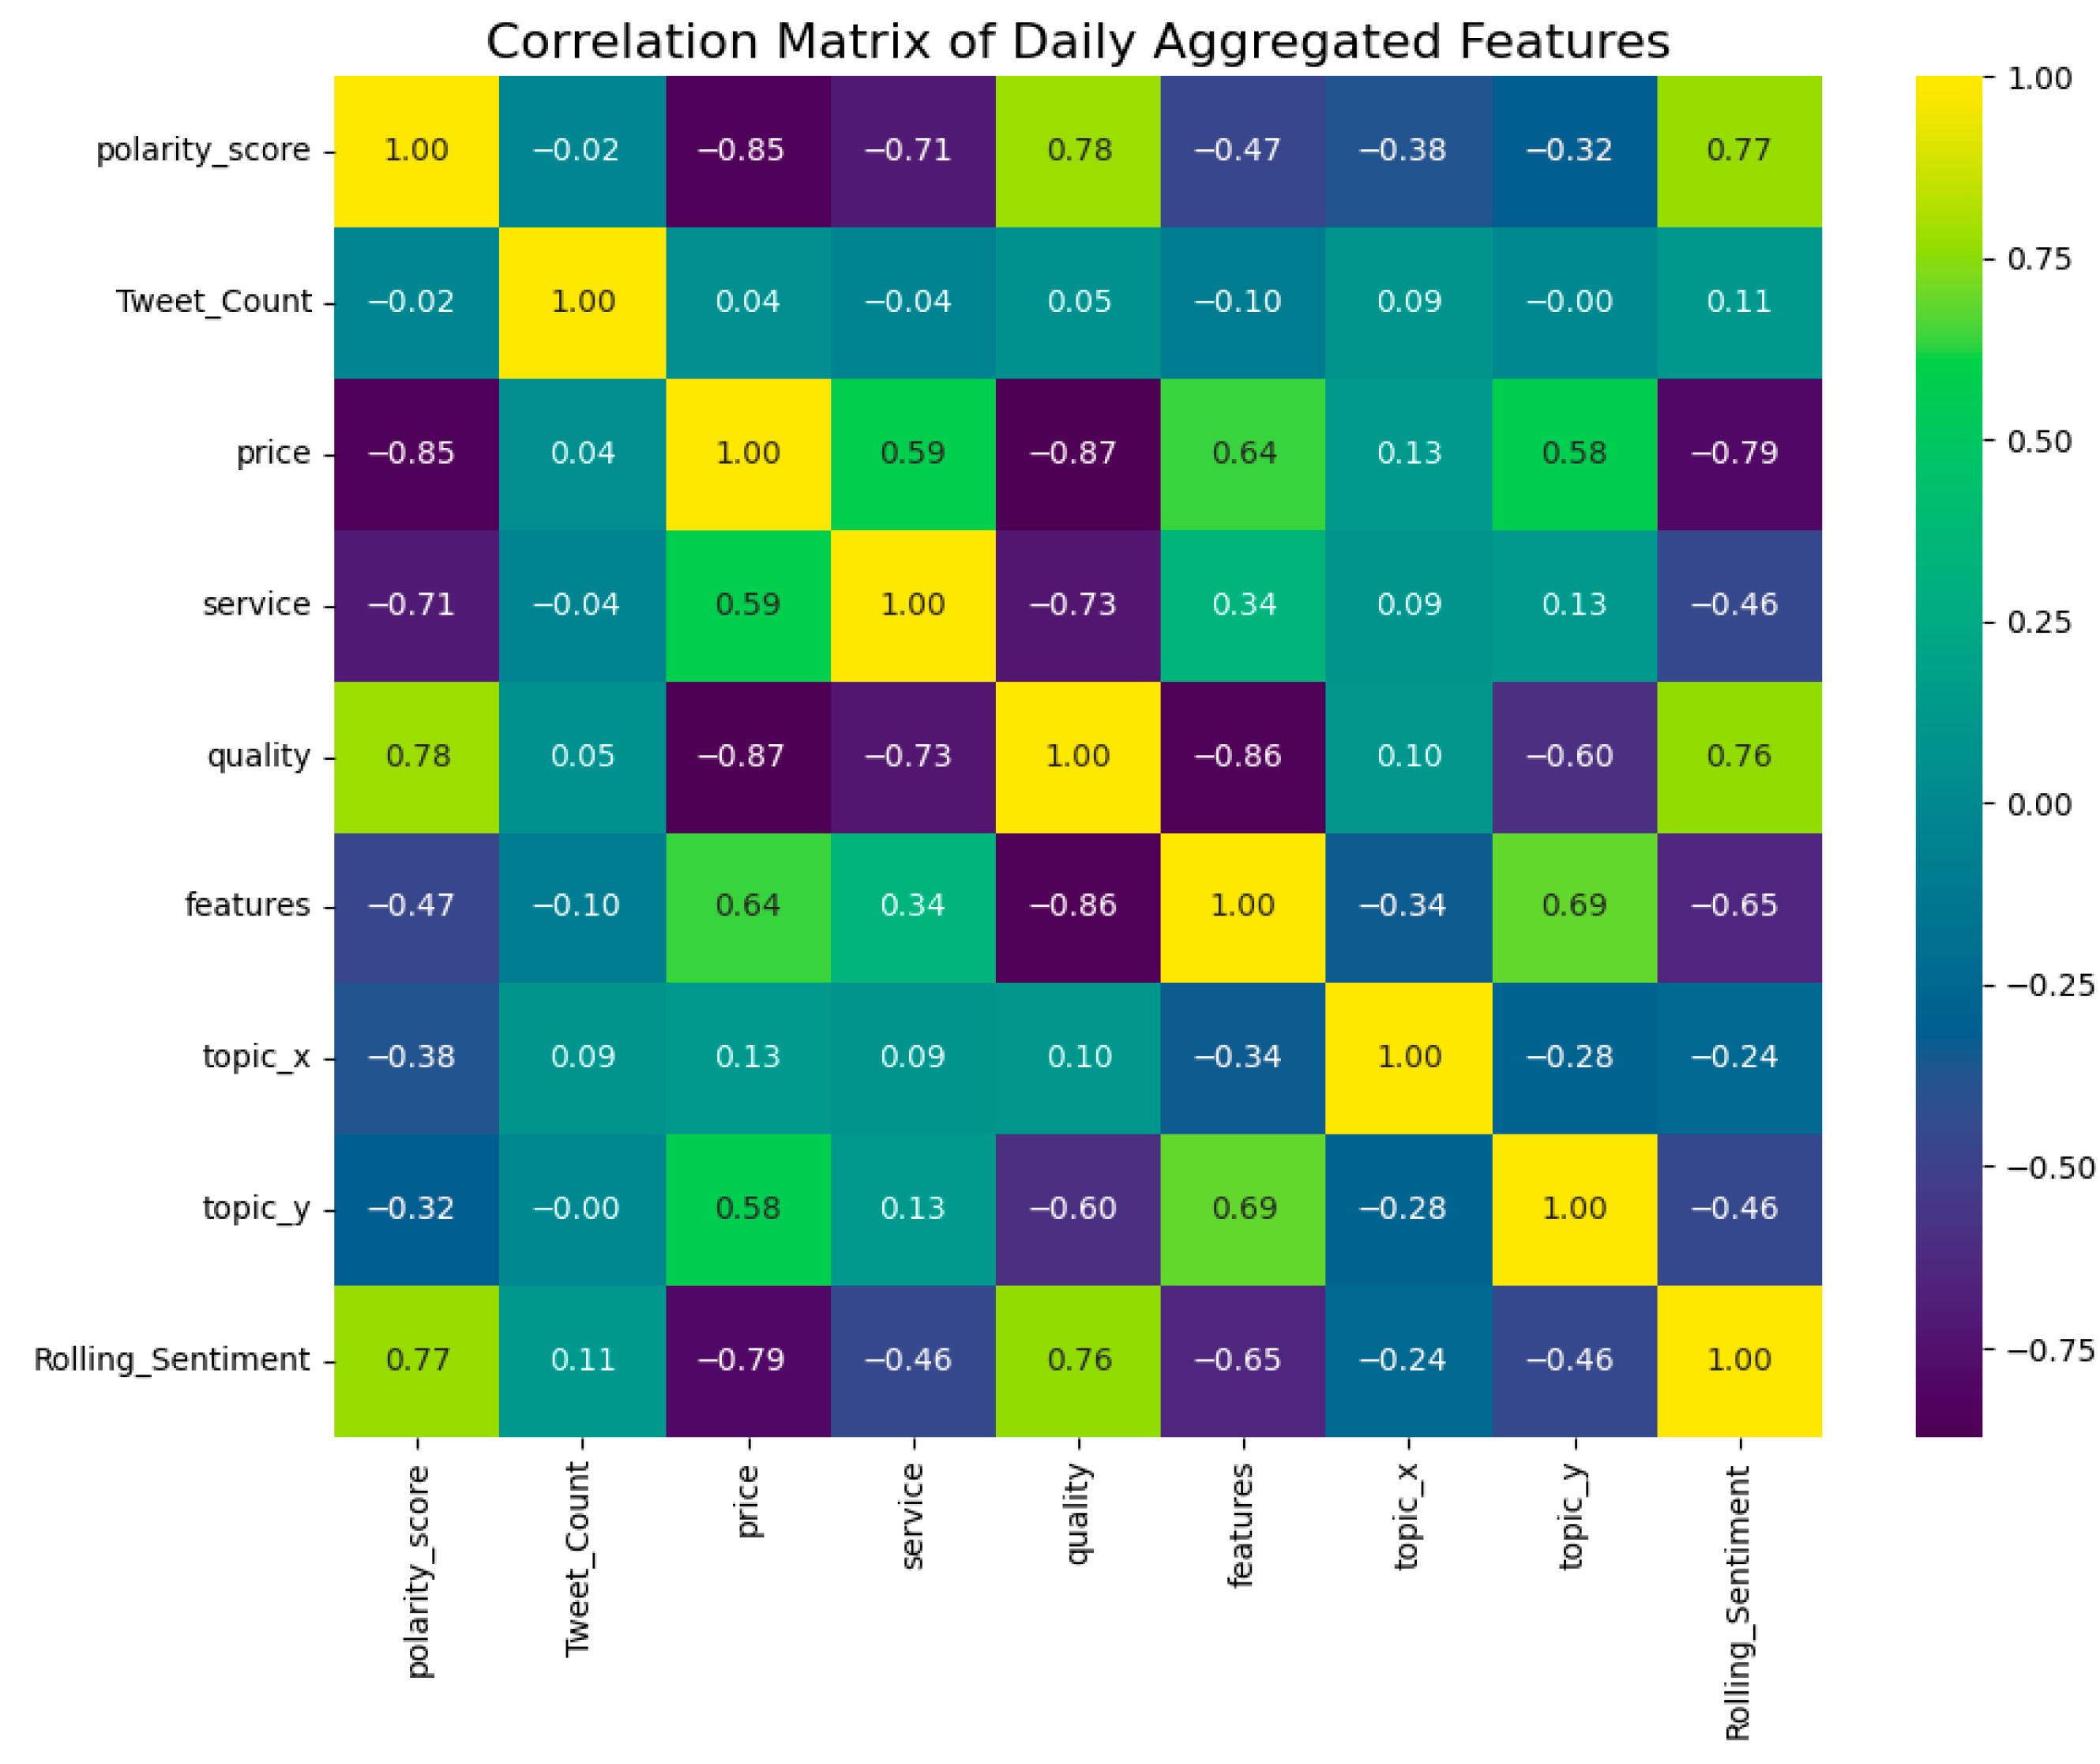
A Pearson correlation matrix was computed for all daily metrics, with the results visualized in the heatmap in Figure 2.
The heatmap shows the Pearson correlation coefficients between the target variable (Rolling_Sentiment) and the extracted exogenous features. Warmer colors (yellow) indicate a positive correlation, while cooler colors (purple/blue) indicate a negative correlation.
The correlation analysis reveals several key insights. A moderate positive correlation (r = 0.77) is observed between polarity_score and Rolling_Sentiment, which is expected since the latter is a smoothed version of the former. More importantly, notable correlations exist between sentiment and the extracted aspect and topic features. For instance, the ‘quality’ aspect score shows a strong positive correlation with sentiment (r = 0.76), indicating that conversations focused on quality tend to be associated with a more positive public mood. The topic dimensions (topic_x and topic_y) also exhibit non-zero correlations, confirming that shifts in the central theme of public discourse are linked to changes in overall sentiment.
Furthermore, the matrix reveals notable inverse relationships between certain aspect scores. For instance, the strong negative correlation between ‘quality’ and ‘price’ (r = −0.87) suggests that conversations mentioning price often carry an opposing sentiment to those mentioning quality (e.g., discussions of ‘high quality’ are distinct from those about ‘low price’). Similarly, the negative correlation between ‘quality’ and ‘features’ (r = −0.86) may indicate that as discussions about product features intensify, they are often framed as complaints about the quality or implementation of those features. These relationships highlight the nuanced trade-offs consumers discuss and provide a richer understanding of the conversational dynamics beyond simple sentiment polarity.
Collectively, these relationships provide a strong justification for including these metrics as predictive exogenous variables in a multivariate forecasting model.

4.2. Forecasting Performance: Baseline vs. Proposed Model

The core evaluation of the MFSF framework involved comparing the forecasting accuracy of the proposed multivariate SARIMAX model against a baseline univariate ARIMA model. Both models were tasked with forecasting the 7-day rolling sentiment on the held-out test set. The performance was measured using the RMSE and MAE.
The results, summarized in Table 1, demonstrate the clear superiority of the proposed multivariate approach.
The baseline ARIMA model, which relies solely on the autocorrelation of the sentiment series, achieved an RMSE of 0.3677. The proposed SARIMAX model, which was conditioned on the additional context provided by the aspect, topic, and volume features, achieved an RMSE of 0.2697. This constitutes a 26.6% reduction in the Root Mean Squared Error, representing a substantial improvement in forecasting accuracy. A similar and significant improvement was observed in the Mean Absolute Error, which decreased from 0.3239 to 0.2249.
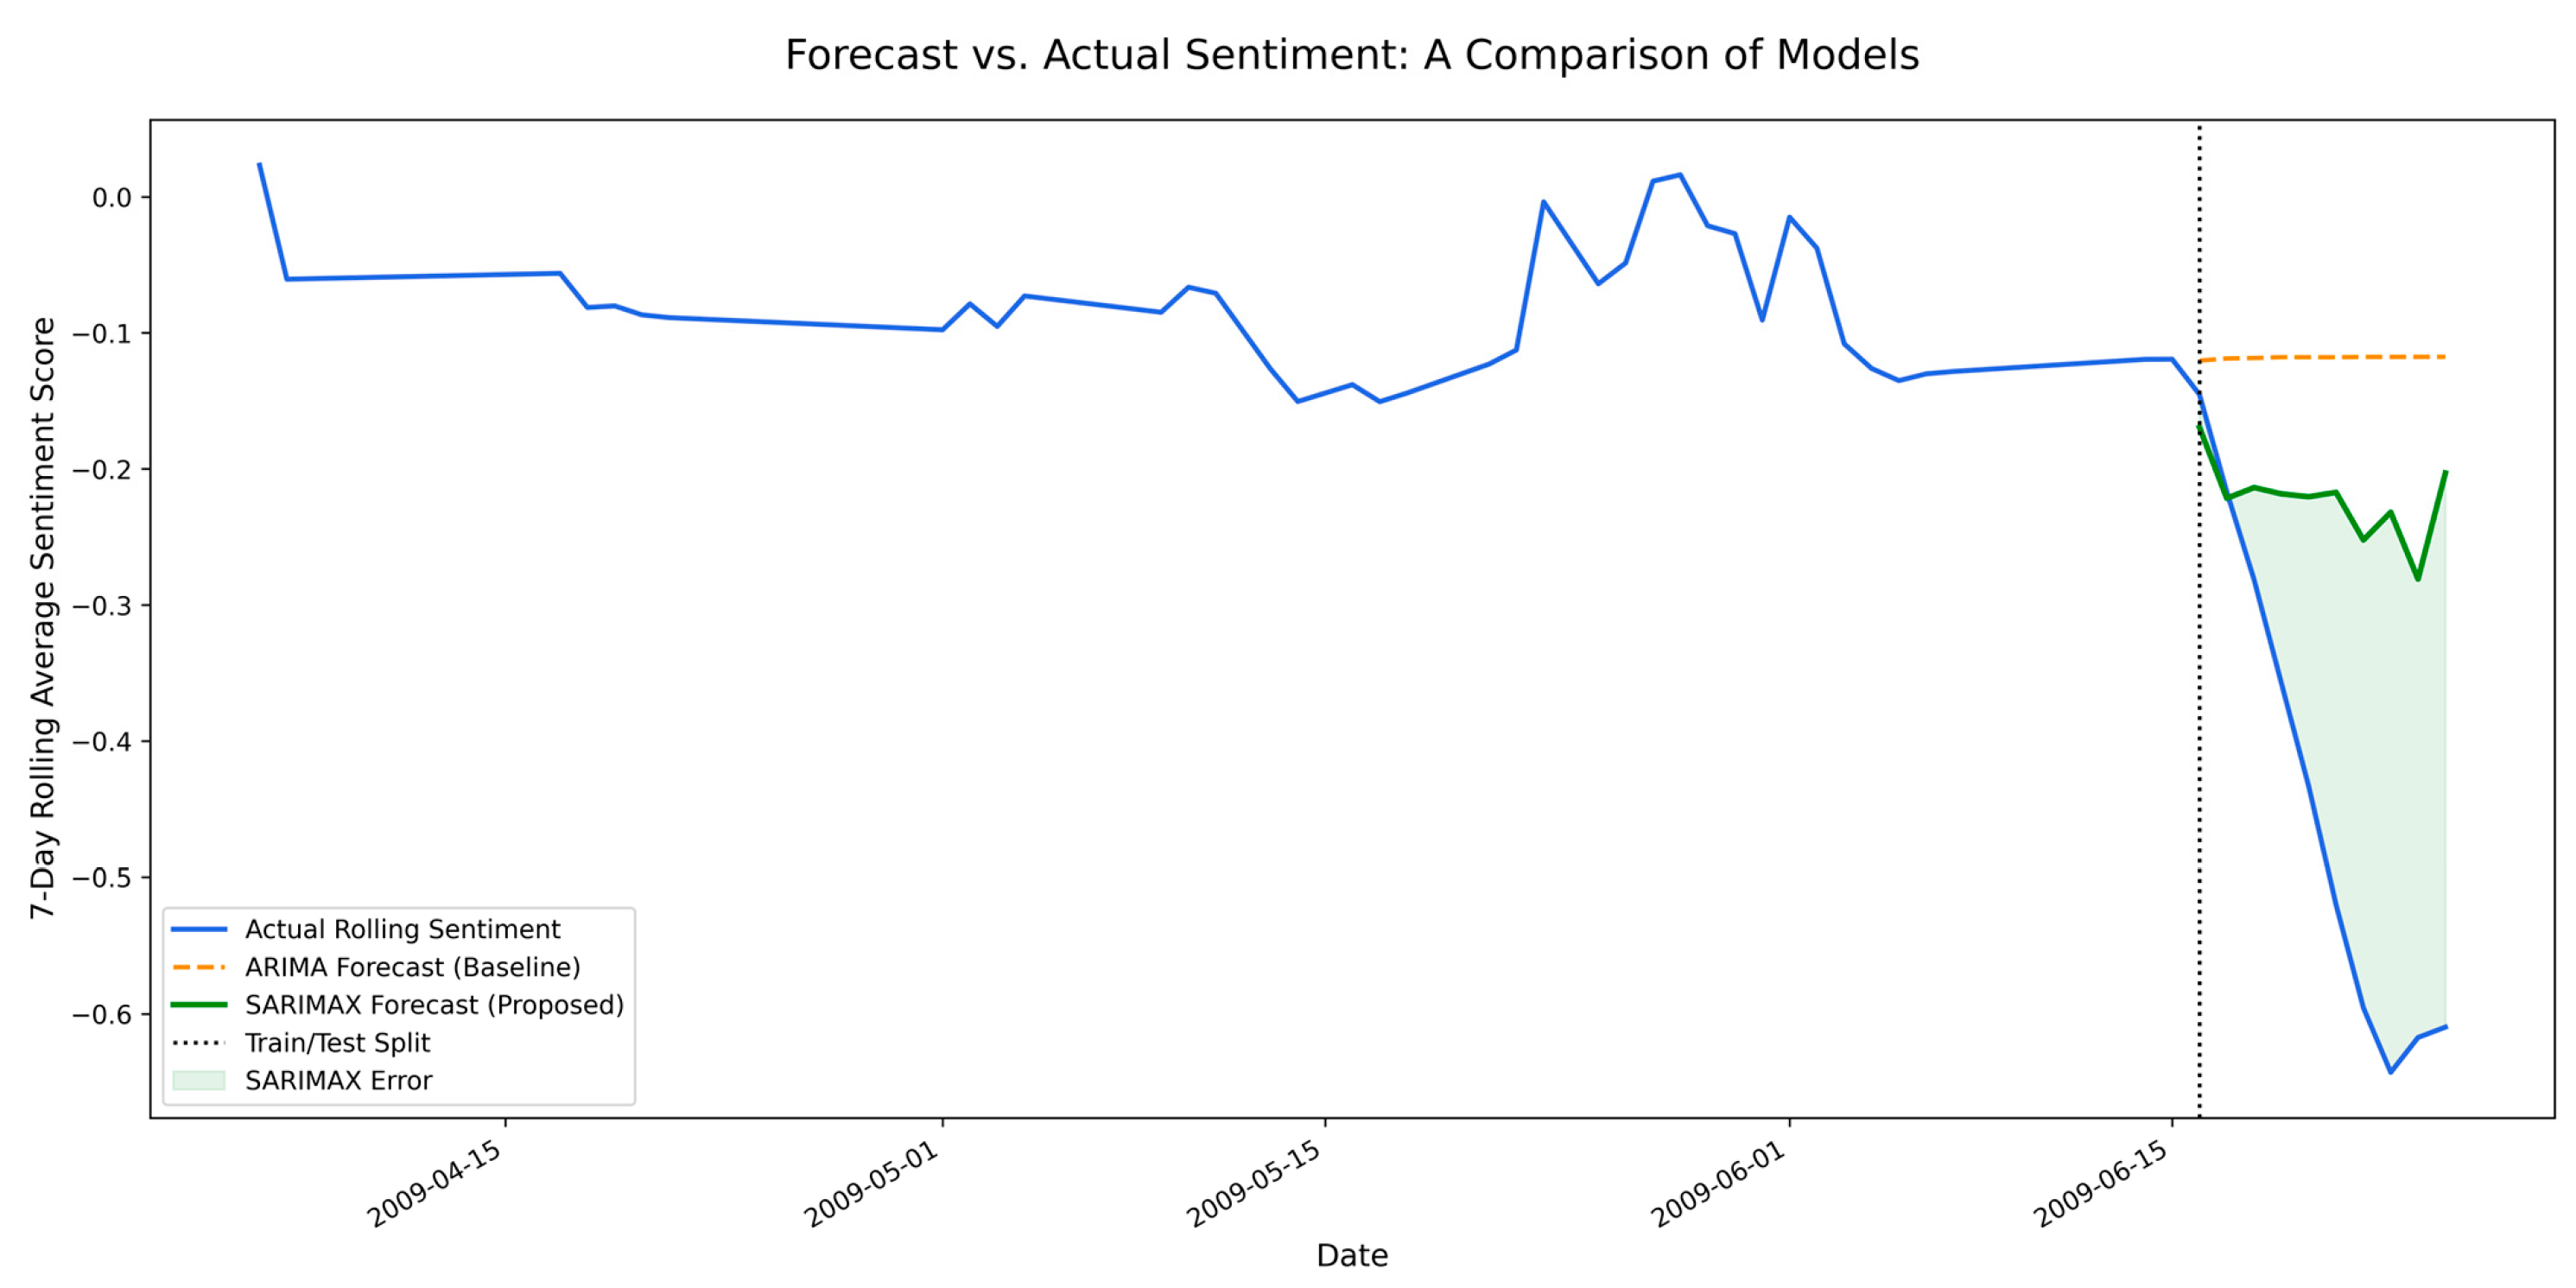
This quantitative evidence strongly supports our central hypothesis: that leveraging rich contextual features extracted from the text provides a more accurate and robust forecast of public sentiment than models based on sentiment polarity alone. It is important to note that this substantial improvement in performance comes at the cost of increased model and computational complexity. This can be quantified by comparing the number of parameters each model must estimate: the baseline ARIMA (5,1,0) model estimates six parameters (five for the autoregressive components and one for the variance of the residuals). In contrast, our proposed SARIMAX model estimates 11 parameters (the same 6, plus 5 additional coefficients for each of the exogenous variables). This nearly twofold increase in model complexity makes the SARIMAX model more resource-intensive to train, representing a clear trade-off between predictive power and computational efficiency. Figure 3 provides a visual comparison of the forecasting performance.
A comparison of the actual 7-day rolling sentiment (blue) with the forecasts from the baseline ARIMA model (orange) and the proposed SARIMAX model (green) on the test set was performed. As illustrated, while the baseline ARIMA model captures the general direction of the trend, it struggles to react to the more subtle variations and sharp turns in the actual sentiment series. In contrast, the green line representing the SARIMAX forecast tracks the true sentiment far more closely. Its ability to leverage the exogenous feature set allows it to better anticipate the dynamics of the sentiment, highlighting the practical advantage of the MFSF framework.

4.3. Statistical Analysis of the SARIMAX Model

To further validate our proposed model and understand the contribution of each feature, we conducted a detailed statistical analysis of the fitted SARIMAX model.

4.3.1. Model Coefficient Analysis

To further validate our proposed model and understand the contribution of each feature, we conducted a detailed statistical analysis of the fitted SARIMAX model. An initial model including all aspect features produced numerically unstable coefficients due to high multicollinearity among the predictors (as observed in the correlation matrix in Figure 2). To address this, the model was refit using a more parsimonious and stable set of predictors, removing the highly correlated ‘price’ and ‘features’ variables.
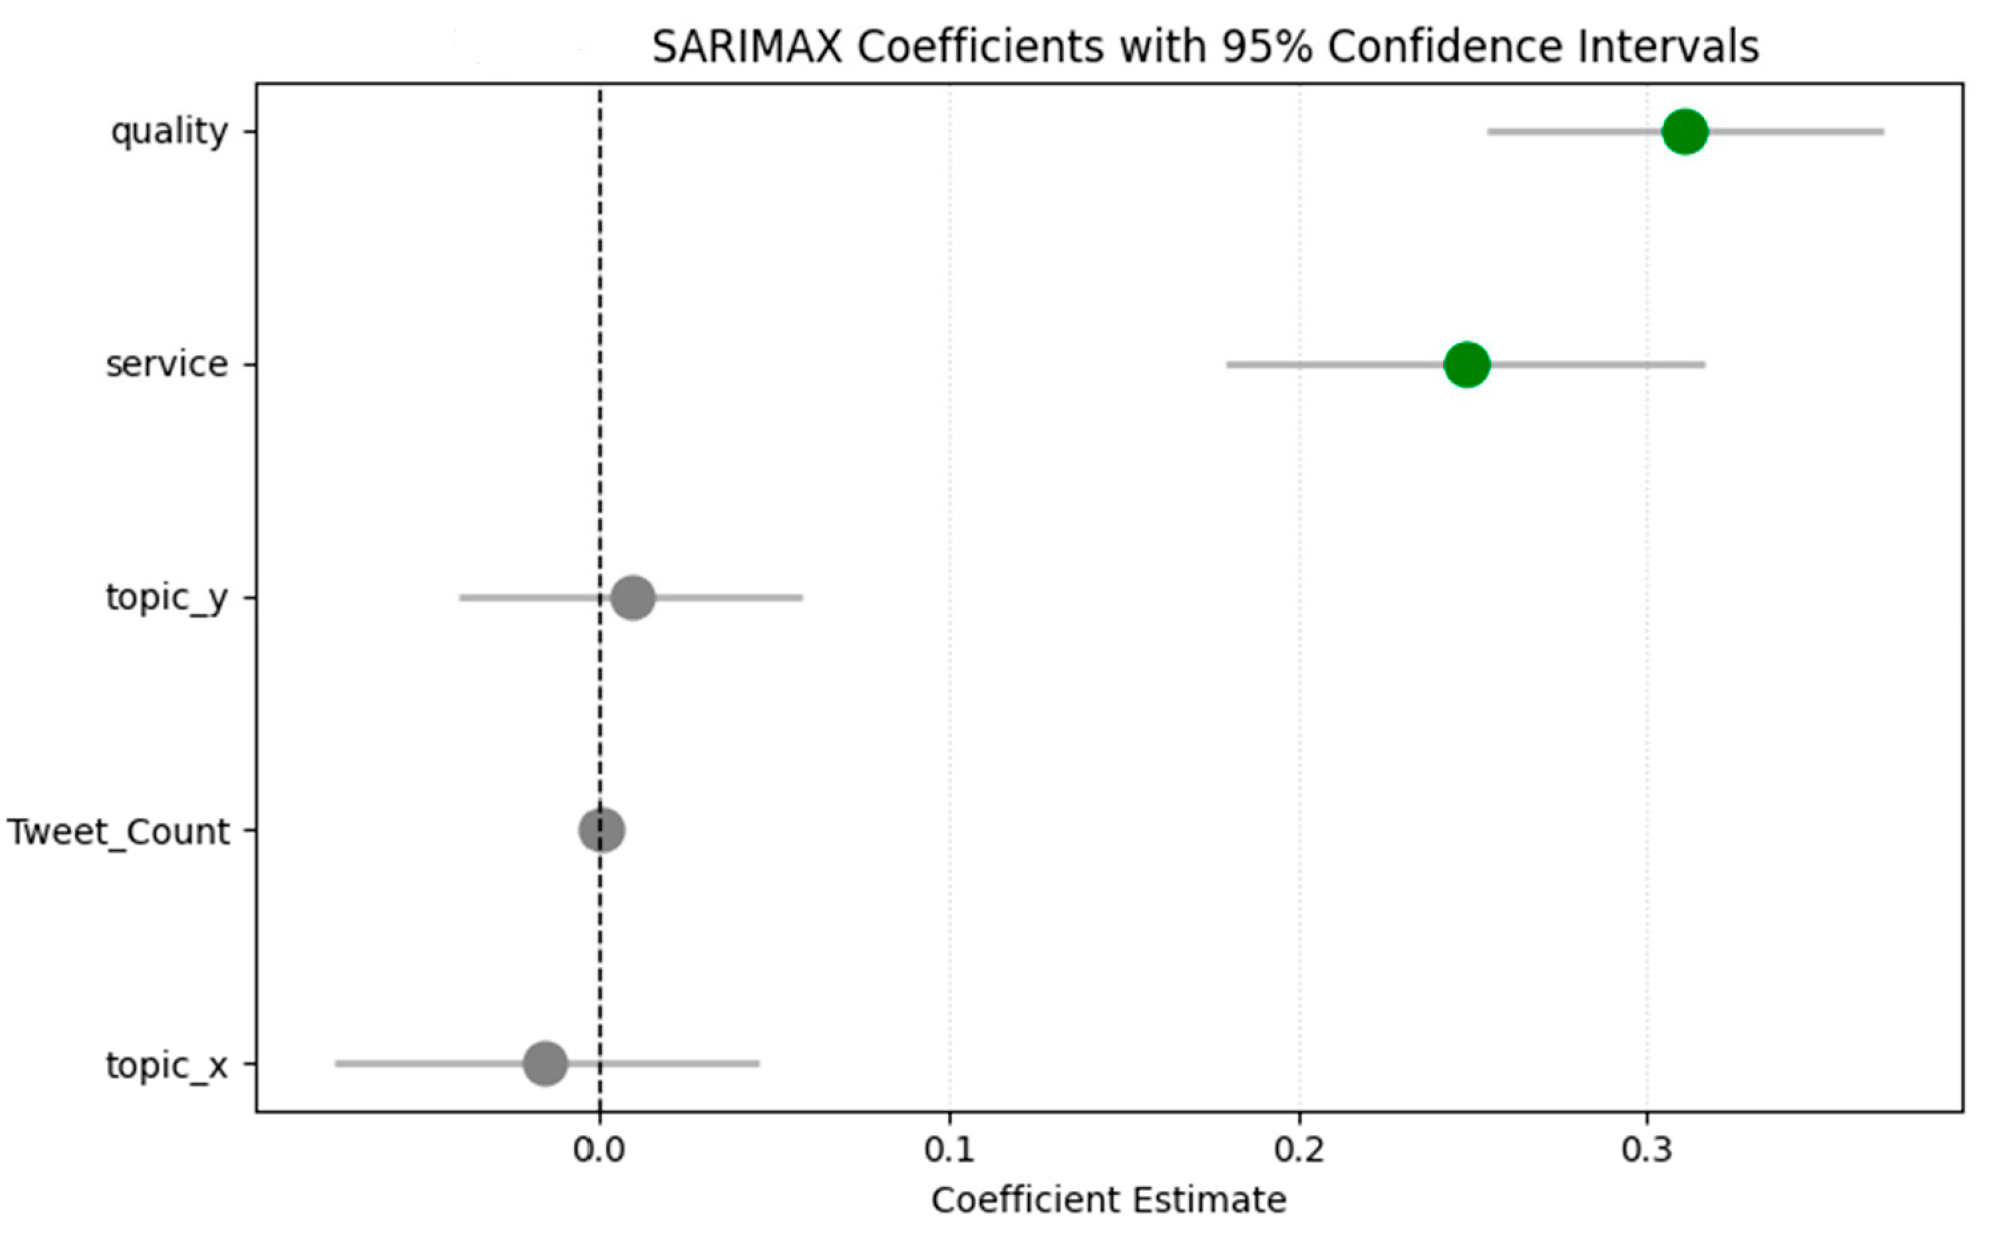
The summary of the final fitted SARIMAX model, detailed in Table 2, provides the stable coefficients and statistical significance for the remaining exogenous variables. A visual representation of these coefficients and their 95% confidence intervals is provided in Figure 4.
The analysis revealed that the aspect scores for ‘service’ and ‘quality’ were highly statistically significant predictors (p < 0.001). This is clearly visible in Figure 4, where the confidence intervals for ‘service’ and ‘quality’ (shown in green) are positioned entirely to the right of the zero line, indicating a statistically significant positive effect. The positive coefficients for ‘service’ (0.2481) and ‘quality’ (0.3109) indicate that an increase in positive conversations about these specific aspects is associated with a subsequent rise in overall public sentiment. This finding empirically confirms our central hypothesis: that monitoring the specific content of conversations provides a powerful and reliable signal for forecasting sentiment shifts.
In contrast, ‘Tweet_Count’ (p = 0.315) and the PCA-derived topic dimensions (‘topic_x’ and ‘topic_y’) did not show statistical significance at the conventional α = 0.05 level. As shown in Figure 4, the confidence intervals for these variables (shown in gray) all cross the vertical zero line, meaning we cannot confidently distinguish their effect from zero. This suggests that for forecasting aggregate sentiment, understanding the specific nature of the conversation (i.e., aspects like service and quality) is more informative than simply knowing the volume of conversation or its general topical drift. The statistical significance of the aspect features provides strong evidence for the value of the MFSF framework in creating not only more accurate but also more interpretable forecasting models.

4.3.2. Model Diagnostics

To ensure the statistical validity of our proposed SARIMAX model, we performed a standard diagnostic check by examining its residuals. The residuals—the differences between the observed values and the model’s predictions—should ideally be unstructured and resemble white noise, indicating that the model has captured all systematic patterns in the data. The following analysis confirms that our model’s assumptions are largely met.
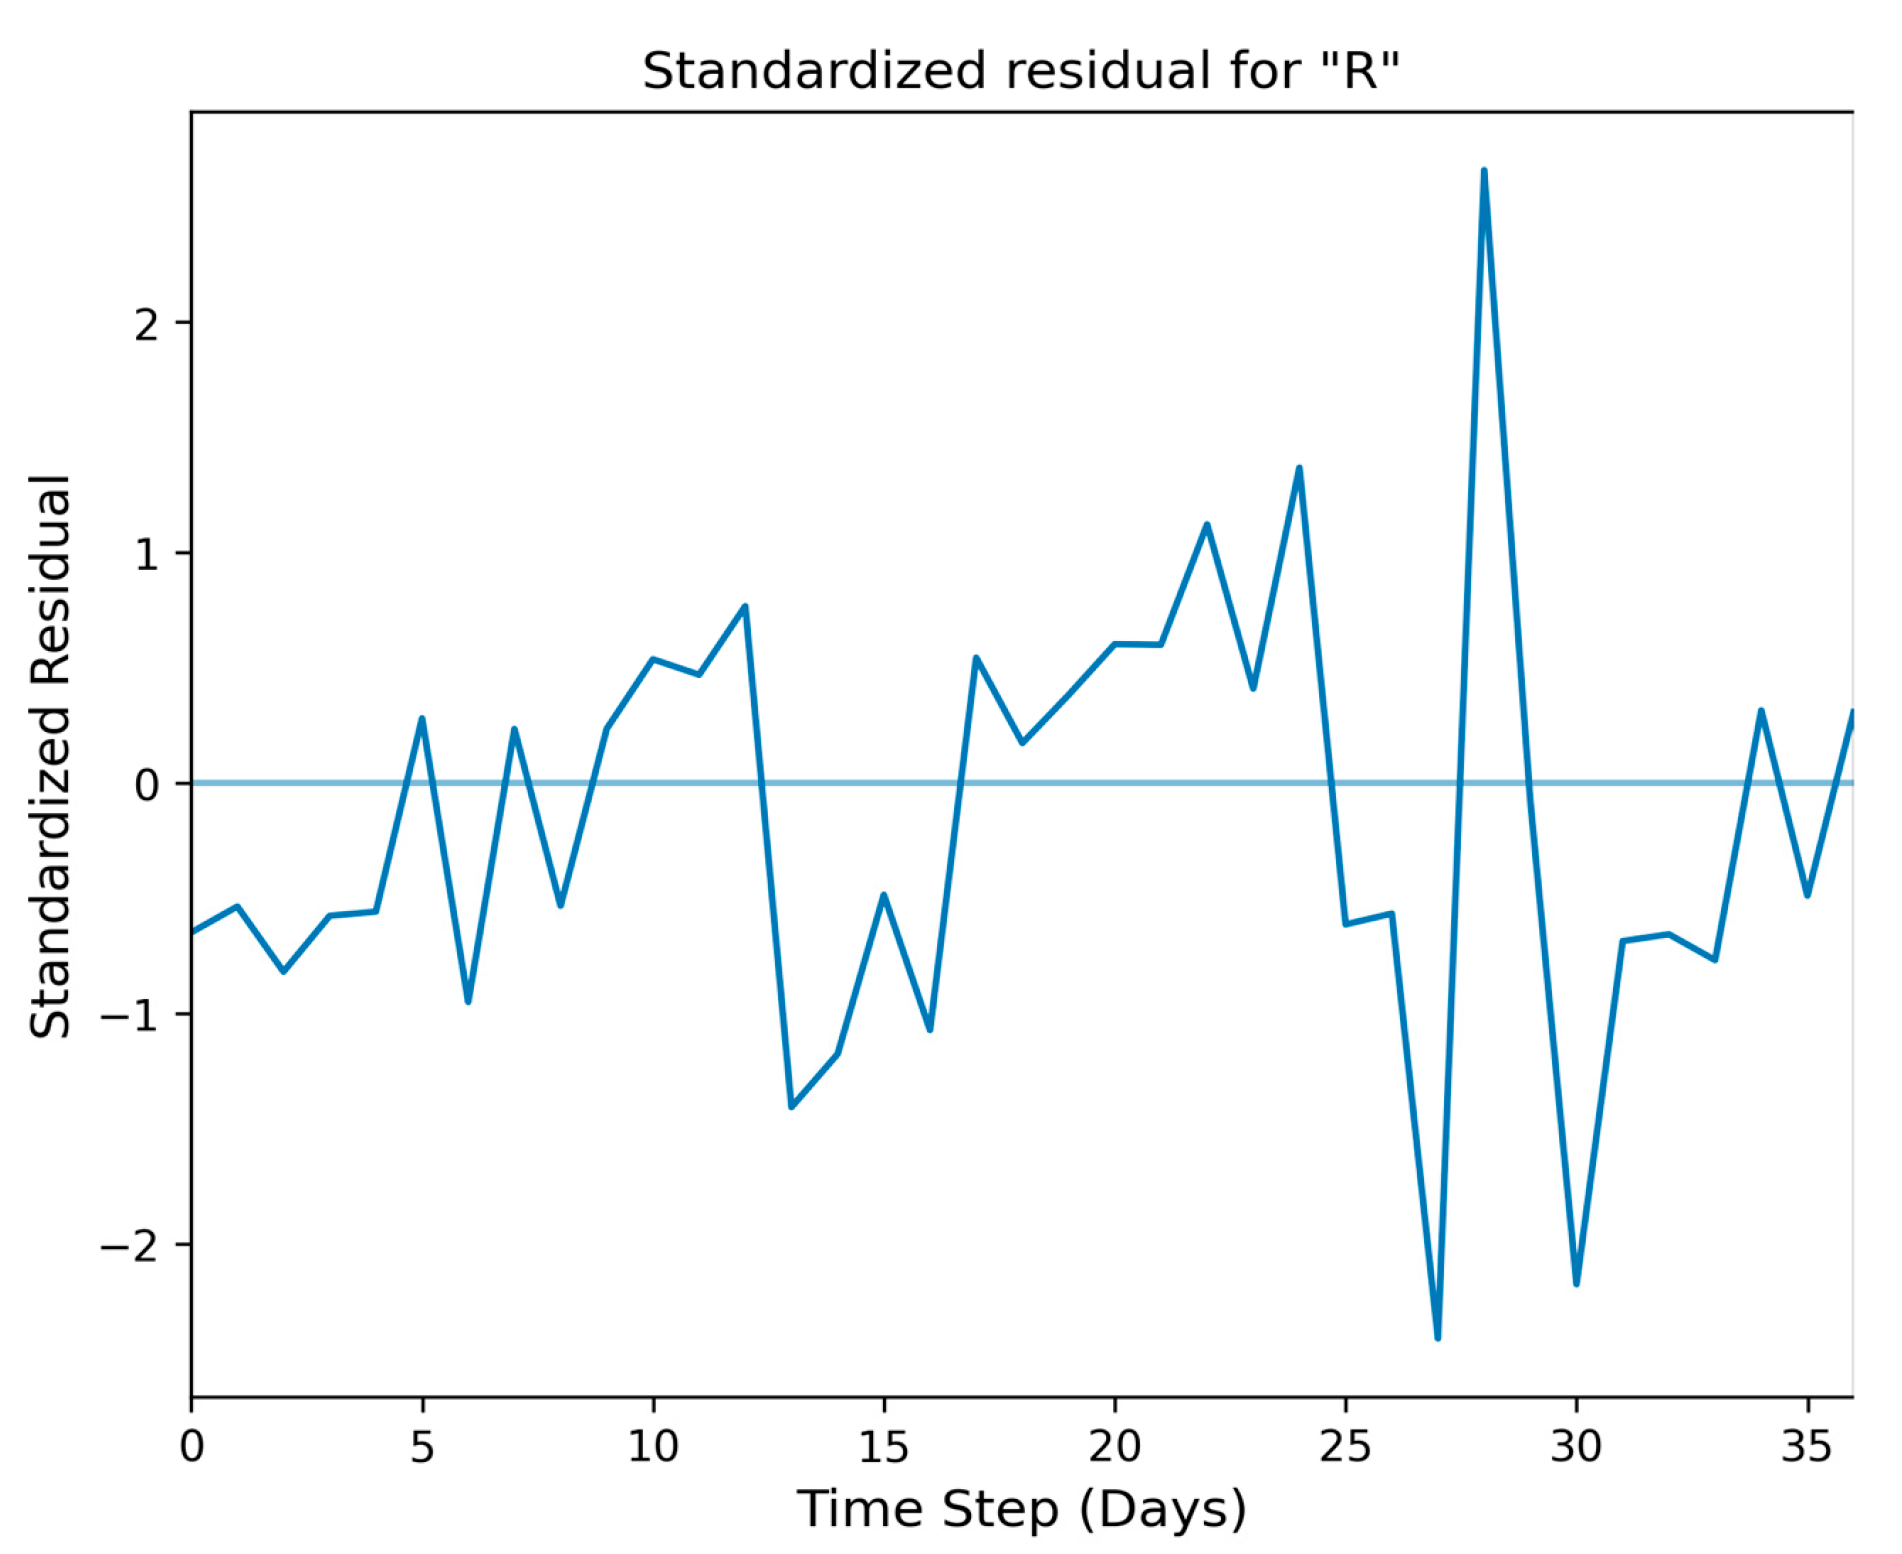
First, we examined the plot of standardized residuals over time, as presented in Figure 5. The plot shows the residuals fluctuating around a mean of zero, and there are no discernible patterns, such as a trend or changing variance (heteroskedasticity). This lack of structure is desirable as it suggests that the model is well-specified and that the errors are random.
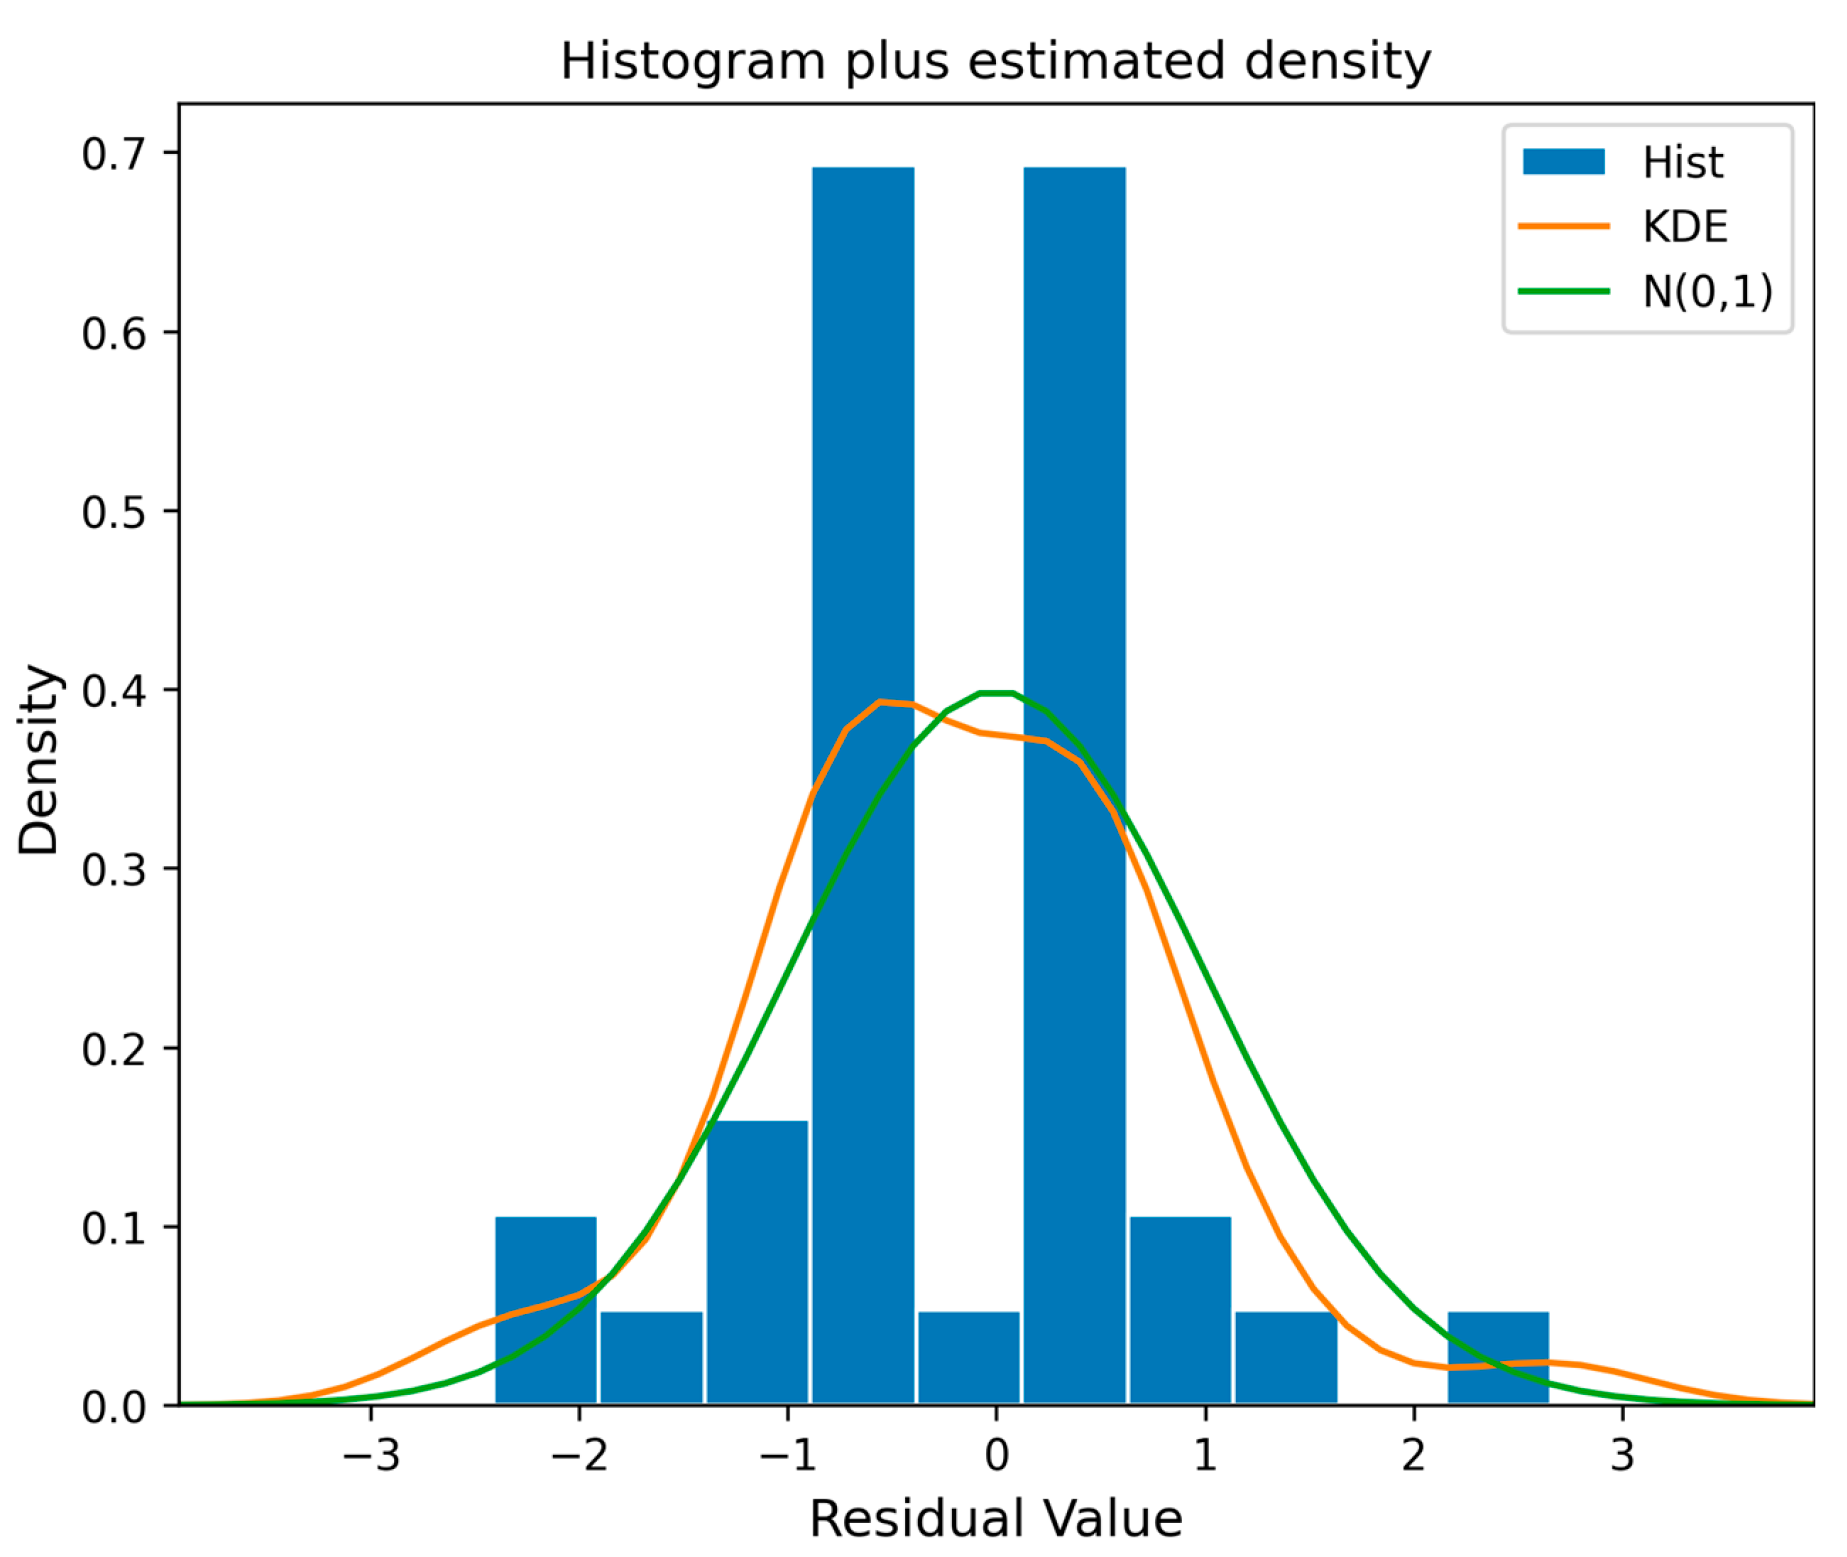
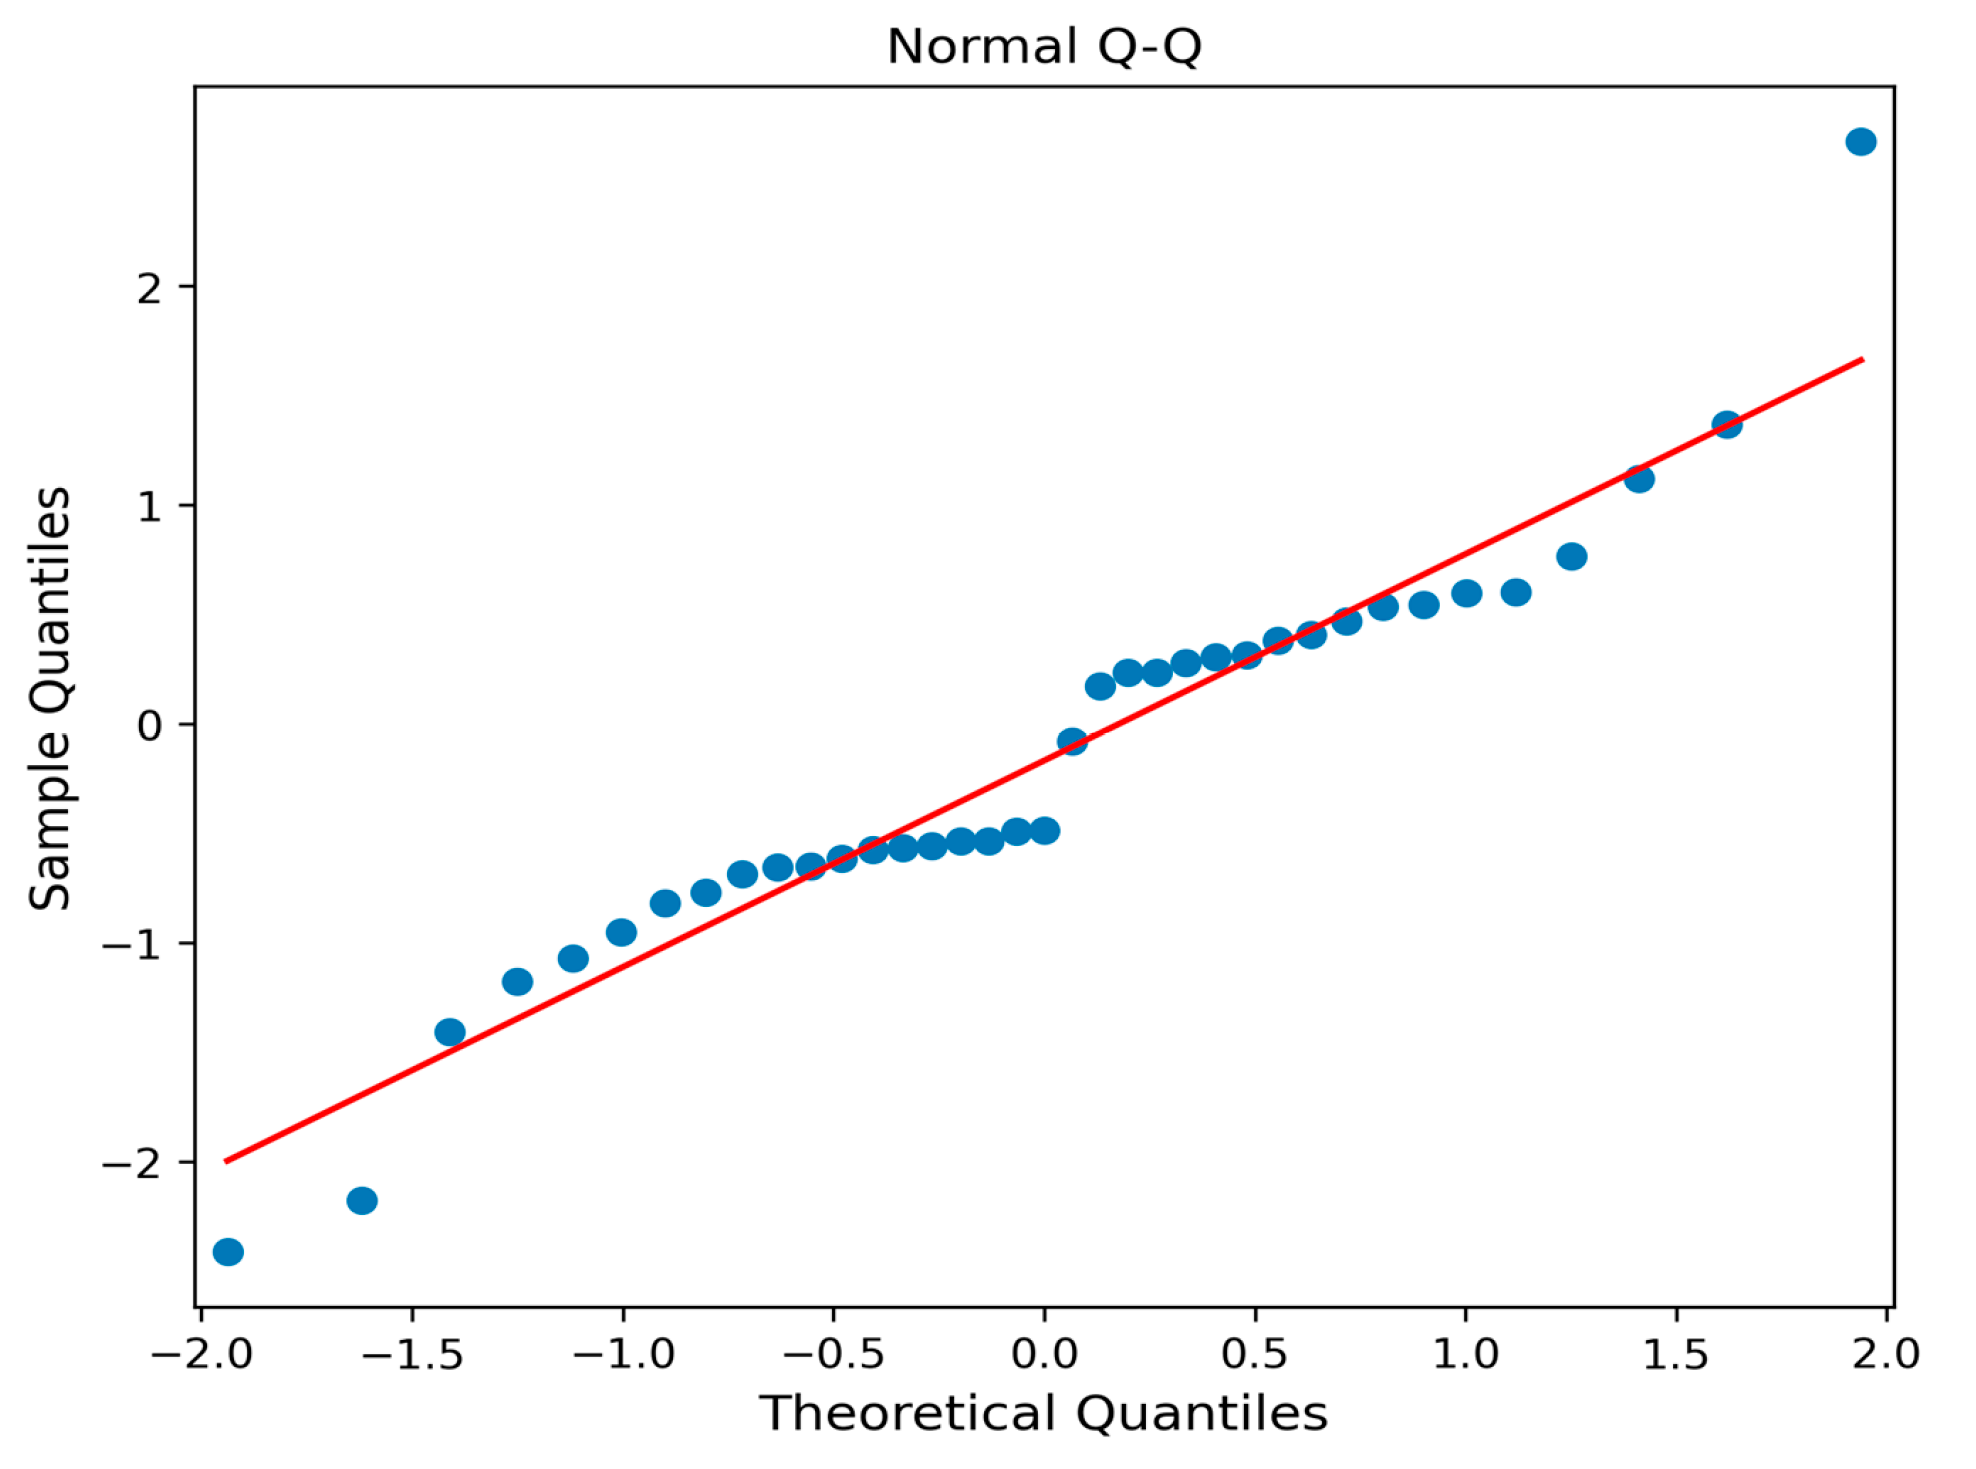
Second, we assessed the assumption that the residuals are normally distributed, which is crucial for the validity of the statistical tests on the coefficients. Figure 6 displays a histogram of the residuals. The shape of the histogram closely approximates the overlaid normal distribution curve, suggesting the normality assumption holds. This is further and more rigorously confirmed by the Normal Quantile–Quantile (Q-Q) plot in Figure 7. In this plot, the points representing the quantiles of the residuals fall closely along the red reference line, which represents a perfect normal distribution. This strong linear relationship confirms that the residuals are, indeed, normally distributed.
Finally, we checked for any remaining serial correlation in the residuals using a correlogram, as shown in Figure 8. This plot displays the autocorrelation function (ACF) for the residuals at various time lags. A well-specified model should have no significant autocorrelation left in its errors. As seen in the figure, after the initial spike at lag 0 (which is always 1), all subsequent correlation values fall well within the 95% confidence interval, as indicated by the shaded blue area. This confirms that the residuals are not correlated with each other, meaning our model’s autoregressive structure has successfully captured the temporal dependencies present in the sentiment time series.
In summary, the diagnostic checks show that the model’s residuals are independent, identically distributed, and follow a normal distribution. This provides strong support for the model’s validity and the reliability of the conclusions drawn from its coefficients.

5. Discussion

The empirical results of this study provide strong support for the Multi-Feature Sentiment-Driven Forecasting (MFSF) framework. By integrating contextual features derived from text, our proposed multivariate SARIMAX model achieved a 26.6% improvement in forecasting accuracy (RMSE) over a traditional univariate ARIMA baseline. This section discusses the interpretation and implications of these findings and the limitations of the study.

5.1. Interpretation of Findings

The superior performance of the multivariate model is a direct consequence of its ability to leverage signals beyond sentiment polarity. While traditional models are blind to the underlying drivers of change, our framework addresses this by asking not only ‘what is the sentiment?’ but also ‘what is the sentiment about?’. The statistical significance of the ‘service’ and ‘quality’ aspect scores (Table 2; Figure 4) empirically confirms that the content of conversations contains valuable predictive information. This transforms the forecasting tool from a simple signal tracker into an early warning system, where a rise in discussions about a specific aspect can foreshadow a shift in overall sentiment.
However, while the SARIMAX model significantly reduces forecasting error, a residual gap between the forecast and actual sentiment persists (Figure 3). This gap is likely attributable to two primary factors. First, our model is conditioned only on textual features and thus cannot account for the impact of unobserved variables—such as external news events or offline phenomena—that influence public opinion. Second, social media sentiment is an inherently volatile and stochastic time series, making it fundamentally challenging for any statistical model to perfectly predict every sharp fluctuation. Our model captures the signal driven by the conversation’s content but cannot account for all external shocks, highlighting a key challenge in social forecasting.

5.2. Strategic Implications and Contributions

The MFSF framework offers significant practical implications. For businesses, it provides a blueprint for an advanced brand monitoring system that can proactively identify the root causes of customer dissatisfaction—such as complaints about service or quality—before they escalate. This enables data-driven decision-making, allowing marketing and product teams to respond to consumer feedback with greater speed and precision.
From a methodological standpoint, this research makes a key contribution by demonstrating the successful application of an interpretable statistical model (SARIMAX) with NLP-derived exogenous features. While many studies focus on complex deep learning models for forecasting, our work highlights the power and interpretability of a robust statistical approach, where the contribution of each feature can be explicitly quantified and tested for significance.

5.3. Policy Implications and Societal Applications

Beyond its commercial applications, the MFSF framework offers a powerful tool for policymakers and public institutions seeking to understand and respond to the dynamics of public opinion in real time. The ability to forecast sentiment shifts based on the specific content of conversations has significant implications for governance and public policy.
Public Health and Crisis Management: Government health agencies could deploy this framework to monitor public sentiment regarding health policies, vaccination campaigns, or public health emergencies. For example, by tracking an increase in conversations about ‘side effects’ (a ‘quality’ or ‘features’ aspect), policymakers could proactively address public concerns and counter misinformation before it erodes trust in public health initiatives. During a crisis, the tool could serve as an early warning system for rising public anxiety or dissatisfaction with official responses.
Economic Monitoring and Consumer Protection: Central banks and financial regulators are increasingly interested in high-frequency data to gauge economic conditions. Forecasting consumer sentiment, particularly with respect to aspects like ‘price’ and ‘quality’, can provide a leading indicator of consumer confidence, inflation expectations, and potential shifts in spending behavior. Furthermore, consumer protection agencies could use the framework to detect emerging patterns of complaints about specific products or industries, enabling faster investigations and interventions.
Improving Public Service Delivery: Government agencies at all levels can use this framework to gather real-time feedback on public services. By analyzing discussions related to aspects like ‘service’ (e.g., ‘long wait times at the DMV’) or ‘quality’ (e.g., ‘the new park is poorly maintained’), local governments can identify and address service delivery failures more efficiently than through traditional surveys, leading to more responsive and effective governance.
Ethical Guardrails and Responsible Use: The deployment of such technology in a policy context is not without risks. There is a potential for this tool to be used for surveillance or to manipulate public opinion by identifying and targeting persuadable groups. Therefore, any government use of this framework must be bound by strong ethical guidelines, including full transparency, robust data privacy protections, and a commitment to using the insights to improve public welfare rather than to control public discourse.

5.4. Limitations of the Study

While this study successfully demonstrates the value of the MFSF framework, it is important to acknowledge its limitations, which in turn provide avenues for future research:
  • Data Source Singularity and Dynamic Drifts: Our analysis relies exclusively on the Sentiment140 dataset, which consists of tweets from 2009. This introduces several key limitations related to dynamic changes over time. First, public sentiment on Twitter is a proxy for, not a direct measure of, overall consumer sentiment, and its users are not representative of the general population. Second, the platform itself has undergone significant changes. The language, conversational norms, and user behavior on social media have evolved dramatically since 2009. For example, the use of sarcasm, memes, and emojis to convey complex sentiment has become far more prevalent. This ‘concept drift’ means that a model trained on historical data may struggle to interpret contemporary language. Finally, social media platforms continuously update their content recommendations and moderation algorithms. Changes to how tweets are sorted, promoted, or suppressed can alter the visibility of certain types of content, potentially skewing the data stream. Together, these temporal drifts pose a significant challenge for the long-term stability of any social media forecasting model, necessitating periodic retraining and adaptation.
  • Predefined Aspects: The set of aspects (price, service, etc.) was manually predefined. This approach may miss emergent or niche topics of discussion that could be valuable predictive signals.
  • Model Linearity: The SARIMAX model, while powerful and interpretable, primarily captures linear relationships. The true dynamics of sentiment may involve more complex, non-linear interactions that the model may not fully capture.
  • Scope of Data Modality and Language: The current MFSF framework is designed exclusively for English-language text. It does not account for the rich, non-textual data that often accompanies social media posts, such as images, videos, GIFs, or emojis, all of which can be powerful conveyors of sentiment. A comprehensive understanding of public sentiment would ultimately require a multi-modal and multilingual approach.
  • Limited Generalizability and Stress Testing: The model’s performance was evaluated on a single, continuous time period from a historical dataset (2009). Its generalizability to other time periods, particularly during major external events or crises (e.g., a financial crisis or a public health emergency), has not been tested. A comprehensive evaluation would require testing the framework’s robustness across diverse and volatile time periods.

5.5. Ethical Considerations and Potential Biases

The analysis of social media data carries inherent ethical responsibilities. The MFSF framework, while powerful, is built upon data that reflects societal biases, and its application raises important considerations that must be carefully managed. Several key challenges warrant attention:
  • Linguistic and Cultural Bias: Our analysis was conducted on an English-language dataset. NLP models trained on this data may not perform equally well on different dialects, slang, or cultural expressions of sentiment. Furthermore, what is considered ‘positive’ or ‘negative’ sentiment can be culturally dependent, and models may fail to capture these nuances, potentially misrepresenting the opinions of certain groups.
  • Demographic and Representation Bias: As noted in our limitations, social media users are not a perfect representation of the general population. The opinions captured may over-represent certain age groups, geographic locations, or socioeconomic statuses while under-representing others. Relying solely on this data for major business or policy decisions could therefore perpetuate or even amplify existing inequalities.
  • Data Privacy: Although the data used in this study was from a public corpus of tweets, the application of such models in a real-world setting raises significant privacy concerns. Organizations must ensure that any collection and analysis of user data comply with privacy regulations like GDPR and respect user consent. The potential for de-anonymizing individuals from aggregated data, however small, must be carefully managed through robust anonymization and data protection protocols.
  • Potential for Manipulation: Forecasting public opinion also introduces the risk of its manipulation. Malicious actors could use such models to identify contentious topics and inject targeted misinformation to sway public discourse or to create artificial sentiment trends. The ethical deployment of these models requires robust safeguards and a commitment to transparency to mitigate the risk of such misuse.
While a full audit of these biases and risks is beyond the scope of this paper, future work should prioritize the use of fairness toolkits and bias detection methods to ensure that sentiment forecasting systems are deployed in a responsible and equitable manner. Researchers and practitioners must remain vigilant about these challenges to avoid drawing skewed conclusions or building systems that cause unintentional harm.

6. Conclusions

This study introduced and validated the Multi-Feature Sentiment-Driven Forecasting (MFSF) framework, a novel pipeline that enhances the prediction of consumer sentiment by integrating rich contextual information from social media text. Moving beyond traditional methods that rely solely on historical sentiment polarity, our framework demonstrates that a more accurate and robust forecast can be achieved by conditioning predictive models on the dynamic aspects and topics of public conversation.
Our methodology successfully fused sentiment polarity, aspect-based scores, and topic embeddings into a multivariate time series. Using this enriched dataset, our proposed SARIMAX model achieved a 26.6% improvement in forecasting accuracy (RMSE) over a baseline univariate ARIMA model. Furthermore, statistical analysis revealed that features corresponding to aspects like ‘service’ and ‘quality’ were highly significant predictors of future sentiment, underscoring the value of understanding not just how people feel but also what they are talking about.
To bridge the gap between this research and real-world application, we recommend several key directions for future work. First, to create a more holistic and reliable sentiment index, the MFSF framework should be extended to incorporate data from multiple platforms beyond Twitter. Second, to move beyond predefined aspects, future iterations should integrate dynamic topic modeling techniques to automatically identify and track emergent themes. Third, we recommend testing the utility of non-linear forecasting models (e.g., LSTMs) to capture more complex interactions; should such ‘black box’ models be employed, they must be coupled with interpretability techniques like SHAP to maintain the framework’s explanatory power. Fourth, for deployment in real-time applications processing large-scale data streams, the framework would need to be re-architected for a streaming environment. Finally, the framework’s ultimate validation would involve linking forecasted sentiment to tangible behavioral metrics. By pursuing these recommendations, the research community can build upon this work to create more powerful and responsible tools for understanding and anticipating the dynamics of public opinion.

Author Contributions

M.U.S. conceptualized the research framework, provided theoretical guidance, and supervised the overall study. R.H. managed data acquisition, implemented the sentiment forecasting pipeline, and conducted computational experiments. S.P. contributed to model selection, optimized feature extraction methods, and assisted in result interpretation. S.M. conducted the literature review, performed statistical validation, and contributed to writing and editing the manuscript. H.W.K. supported data preprocessing, visualized key findings, and assisted in proofreading the final draft. All authors have read and agreed to the published version of the manuscript.

Funding

This research received no external funding.

Institutional Review Board Statement

Not applicable.

Informed Consent Statement

Not applicable.

Data Availability Statement

The data used in this study is available in a publicly accessible repository. The Sentiment140 dataset, used for analysis and forecasting, can be accessed at https://github.com/arjondas/sentiment-analysis (accessed on 14 June 2025). An official version of the dataset is also hosted on Kaggle at https://www.kaggle.com/datasets/kazanova/sentiment140 (accessed on 25 July 2025). No new data were generated during this study.

Acknowledgments

The authors would like to acknowledge the use of ChatGPT-4 24 May 2023 version (OpenAI, San Francisco, CA, USA), specifically to assist in some content rewriting for improved clarity and effectiveness.

Conflicts of Interest

The authors declare no conflicts of interest.

Abbreviations

The following abbreviations are used in this manuscript:
ABSAAspect-Based Sentiment Analysis
ARIMAAutoregressive Integrated Moving Average
BARTBidirectional and Auto-Regressive Transformers
BERTBidirectional Encoder Representations from Transformers
LDALatent Dirichlet Allocation
LSTMLong Short-Term Memory
MAEMean Absolute Error
MFSFMulti-Feature Sentiment-Driven Forecasting
NLPNatural Language Processing
PCAPrincipal Component Analysis
RMSERoot Mean Squared Error
SARIMAXSeasonal AutoRegressive Integrated Moving Average with eXogenous variables

References

  1. Stieglitz, S.; Dang-Xuan, L. Social media and political communication: A social media analytics framework. Soc. Netw. Anal. Min. 2013, 3, 1277–1291. [Google Scholar] [CrossRef]
  2. Pang, B.; Lee, L. Opinion Mining and Sentiment Analysis, 1st ed.; Now: Hanover, MA, USA, 2008; pp. 1–135. [Google Scholar]
  3. Medhat, W.; Hassan, A.; Korashy, H. Sentiment analysis algorithms and applications: A survey. Ain. Shams Eng. J. 2014, 5, 1093–1113. [Google Scholar] [CrossRef]
  4. Devlin, J. BERT: Pre-Training of Deep Bidirectional Transformers for Language Understanding. 2024. [Google Scholar]
  5. Bollen, J.; Mao, H.; Zeng, X. Twitter mood predicts the stock market. J. Comput. Sci. 2011, 2, 1–8. [Google Scholar] [CrossRef]
  6. Asur, S.; Huberman, B.A. Predicting the Future with Social Media. In Proceedings of the 2010 IEEE/WIC/ACM International Conference on Web Intelligence and Intelligent Agent Technology, Toronto, ON, Canada, 31 August–3 September 2010; pp. 492–499. [Google Scholar] [CrossRef]
  7. Friedrich, N.; Bowman, T.D.; Stock, W.G.; Haustein, S. Adapting sentiment analysis for tweets linking to scientific papers. arXiv 2015, arXiv:1507.01967. [Google Scholar] [CrossRef]
  8. Yin, Z.; Shao, J.; Hussain, M.J.; Hao, Y.; Chen, Y.; Zhang, X.; Wang, L. DPG-LSTM: An Enhanced LSTM Framework for Sentiment Analysis in Social Media Text Based on Dependency Parsing and GCN. Appl. Sci. 2023, 13, 354. [Google Scholar] [CrossRef]
  9. Şengül, F.; Adem, K.; Yılmaz, E.K. Sentiment analysis based on machine learning methods on twitter data using one API. Int. Conf. Contemp. Acad. Res. 2023, 1, 207–213. [Google Scholar] [CrossRef]
  10. Tan, K.L.; Lee, C.P.; Lim, K.M. RoBERTa-GRU: A Hybrid Deep Learning Model for Enhanced Sentiment Analysis. Appl. Sci. 2023, 13, 3915. [Google Scholar] [CrossRef]
  11. Cernian, A.; Sgarciu, V.; Martin, B. Sentiment analysis from product reviews using SentiWordNet as lexical resource. In Proceedings of the 2015 7th International Conference on Electronics, Computers and Artificial Intelligence (ECAI), New Delhi, India, 26 October 2021; p. WE-18. [Google Scholar]
  12. Hutto, C.; Gilbert, E. VADER: A Parsimonious Rule-Based Model for Sentiment Analysis of Social Media Text. In Proceedings of the International AAAI Conference on Web and Social Media, Copenhagen, Denmark, 23–26 June 2025; pp. 216–225. [Google Scholar] [CrossRef]
  13. Zhang, L.; Wang, S.; Liu, B. Deep learning for sentiment analysis: A survey. WIREs Data Min. Knowl. Discov. 2018, 8, e1253. [Google Scholar] [CrossRef]
  14. Gaikwad, H.R.; Mujawar, N.; Sawant, N.; Kiwelekar, A.; Netak, L. Urdu Sentiment Analysis: A Review. In Data Science and Applications; Springer Nature: Singapore, 2024; Volume 820, pp. 463–472. [Google Scholar]
  15. Suryawanshi, N.S. Sentiment analysis with machine learning and deep learning: A survey of techniques and applications. Int. J. Sci. Res. Arch. 2024, 12, 5–15. [Google Scholar] [CrossRef]
  16. Tul, Q.; Ali, M.; Riaz, A.; Noureen, A.; Kamranz, M.; Hayat, B.; Rehman, A. Sentiment Analysis Using Deep Learning Techniques: A Review. Int. J. Adv. Comput. Sci. Appl. 2017, 8. [Google Scholar] [CrossRef]
  17. Prabha, M.I.; Srikanth, G.U. Survey of Sentiment Analysis Using Deep Learning Techniques. In Proceedings of the 2019 1st International Conference on Innovations in Information and Communication Technology (ICIICT), New York, NY, USA, 25–26 April 2019; pp. 1–9. [Google Scholar] [CrossRef]
  18. Malhotra, P.; Vig, L.; Shroff, G.; Agarwal, P. Long Short Term Memory Networks for Anomaly Detection in Time Series. 2024. [Google Scholar]
  19. Vaswani, A.; Shazeer, N.; Brain, G.; Parmar, N.; Uszkoreit, J.; Jones, L.; Gomez, A.N.; Kaiser, Ł. Attention Is All You Need. arXiv 2023, arXiv:1706.03762v7. [Google Scholar]
  20. Sanh, V.; Debut, L.; Chaumond, J.; Wolf, T. DistilBERT, a distilled version of BERT: Smaller, faster, cheaper and lighter. arXiv 2019, arXiv:1910.01108. [Google Scholar] [CrossRef]
  21. Liu, H.; Chatterjee, I.; Zhou, M.; Lu, X.S.; Abusorrah, A. Aspect-Based Sentiment Analysis: A Survey of Deep Learning Methods. Trans. Comput. Soc. Syst. 2020, 7, 1358–1375. [Google Scholar] [CrossRef]
  22. Brauwers, G.; Frasincar, F. A Survey on Aspect-Based Sentiment Classification. ACM Comput. Surv. 2023, 55, 1–37. [Google Scholar] [CrossRef]
  23. Yusuf, K.K.; Ogbuju, E.; Abiodun, T.; Oladipo, F. A Technical Review of the State-of-the-Art Methods in Aspect-Based Sentiment Analysis. J. Comput. Theor. Appl. 2024, 1, 287–298. [Google Scholar] [CrossRef]
  24. Lewis, M.; Liu, Y.; Goyal, N.; Ghazvininejad, M.; Mohamed, A.; Levy, O.; Stoyanov, V.; Zettlemoyer, L. BART: Denoising Sequence-to-Sequence Pre-training for Natural Language Generation, Translation, and Comprehension. arXiv 2019, arXiv:1910.13461. [Google Scholar] [CrossRef]
  25. Kim, J.; Kim, H.; Kim, H.; Lee, D.; Yoon, S. A Comprehensive Survey of Time Series Forecasting: Architectural Diversity and Open Challenges. Artif. Intell. Rev. 2025, 58, 1–95. Available online: https://www.proquest.com/docview/3127411846 (accessed on day month year). [CrossRef]
  26. Wilson, G.T.; Gwilym, M.J.; Gregory, C. Reinsel Time Series Analysis: Forecasting and Control, 5th ed.; John Wiley and Sons: Hoboken, NJ, USA, 2016; pp. 709–711. [Google Scholar]
  27. Rawat, D.; Singh, V.; Dhondiyal, S.A.; Singh, S. Time Series Forecasting Models: A Comprehensive Review. Int. J. Recent Technol. Eng. 2020, 8, 84–86. [Google Scholar] [CrossRef]
  28. Vagropoulos, S.I.; Chouliaras, G.I.; Kardakos, E.G.; Simoglou, C.K.; Bakirtzis, A.G. Comparison of SARIMAX, SARIMA, modified SARIMA and ANN-based models for short-term PV generation forecasting. In Proceedings of the 2016 IEEE International Energy Conference (ENERGYCON), Leuven, Belgium, 14 July 2016; pp. 1–6. [Google Scholar]
  29. Cools, M.; Moons, E.; Wets, G. Investigating the Variability in Daily Traffic Counts through use of ARIMAX and SARIMAX Models. Transp. Res. Rec. J. Transp. Res. Board 2009, 2136, 57–66. [Google Scholar] [CrossRef]
  30. Jain, A.; Karthikeyan, V. Demand Forecasting for E-Commerce Platforms. In Proceedings of the 2020 IEEE International Conference for Innovation in Technology (INOCON), Bangalore, India, 6–8 November 2020; IEEE: Piscataway, NJ, USA, 2020; pp. 1–4. [Google Scholar]
  31. Montaser, M.A.A.; Ghosh, B.P.; Barua, A.; Karim, F.; Das, B.C.; Shawon, R.E.R.; Chowdhury, M.S.R. Sentiment analysis of social media data: Business insights and consumer behavior trends in the USA. Edelweiss Appl. Sci. Technol. 2025, 9, 515–535. [Google Scholar] [CrossRef]
  32. Garza, A.; Mergenthaler-Canseco, M. TimeGPT-1. arXiv 2023, arXiv:2310.03589. [Google Scholar] [CrossRef]
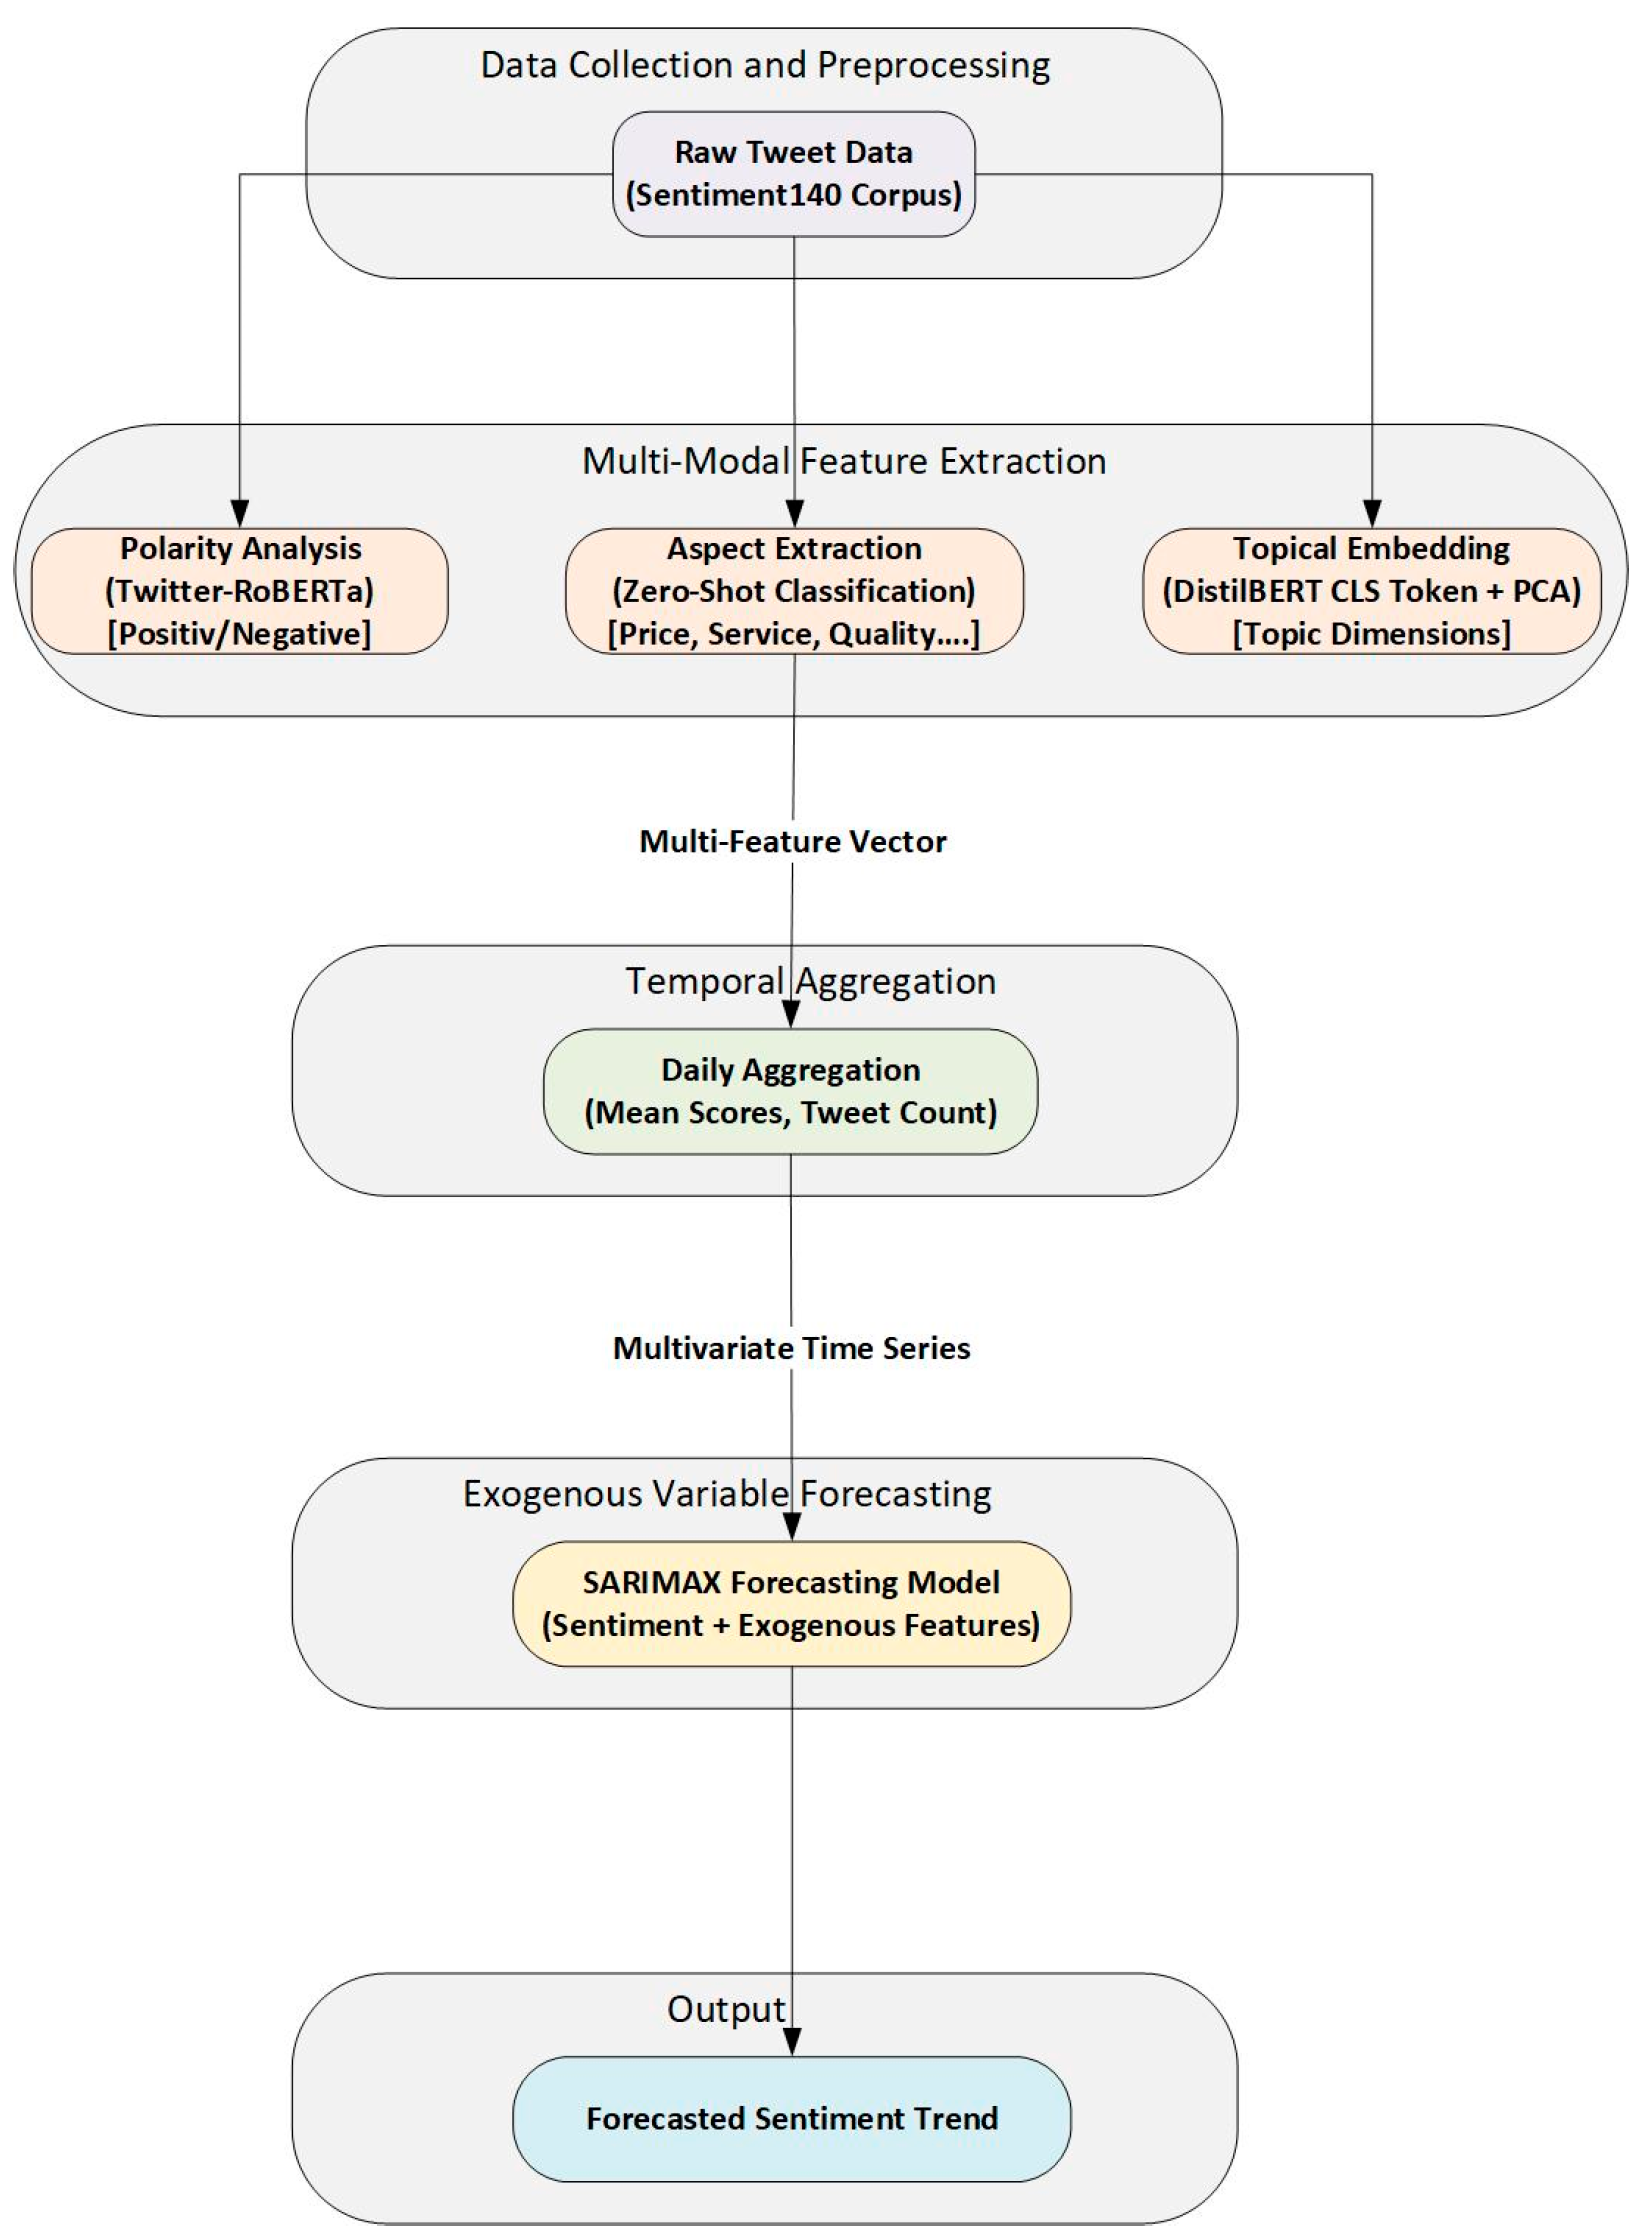
Figure 1. The MFSF system architecture.
Information 16 00670 g001
Figure 2. Correlation matrix of daily aggregated features.
Information 16 00670 g002
Figure 3. Forecast vs. actual sentiment.
Information 16 00670 g003
Figure 4. Exogenous feature coefficients from SARIMAX model.
Information 16 00670 g004
Figure 5. Standardized residuals of the SARIMAX model over time.
Information 16 00670 g005
Figure 6. Histogram of model residuals with kernel density estimate and normal distribution overlay.
Information 16 00670 g006
Figure 7. Normal Q-Q plot of SARIMAX model’s standardized residuals.
Information 16 00670 g007
Figure 8. Correlogram of SARIMAX model’s residuals.
Information 16 00670 g008
Table 1. Forecasting model performance comparison.
ModelDescriptionRMSEMAE
ARIMA (Baseline)Univariate; uses only past sentiment data.0.36770.3239
SARIMAX (Proposed)Multivariate; includes exogenous features (e.g., tweet volume and topic embeddings).0.26970.2249
Table 2. Coefficient summary of SARIMAX model for sentiment forecasting.
FeatureCoefficientStd. Errorp-Value95% Confidence IntervalSignificance
service0.24810.0350.000[0.179, 0.317]Significant (p < 0.05)
quality0.31090.0290.000[0.254, 0.368]Significant (p < 0.05)
Tweet_Count0.00010.0000.315[−0.0001, 0.0003]Not Significant
topic_x−0.01540.0310.620[−0.076, 0.045]Not Significant
topic_y0.00890.0250.721[−0.040, 0.058]Not Significant
Disclaimer/Publisher’s Note: The statements, opinions and data contained in all publications are solely those of the individual author(s) and contributor(s) and not of MDPI and/or the editor(s). MDPI and/or the editor(s) disclaim responsibility for any injury to people or property resulting from any ideas, methods, instructions or products referred to in the content.