Article

A Knowledge–Data Dual-Driven Groundwater Condition Prediction Method for Tunnel Construction

1
Facuity of Geosciences and Environmental Engineering, Southwest Jiaotong University, Chengdu 610031, China
2
State Key Laboratory of Intelligent Geotechnics and Tunnelling, Xi’an 710043, China
3
China Railway First Survey and Design Institute Group Co., Ltd., Xi’an 710043, China
*
Author to whom correspondence should be addressed.
Information 2025, 16(8), 659; https://doi.org/10.3390/info16080659 (registering DOI)
Submission received: 26 May 2025 / Revised: 1 July 2025 / Accepted: 25 July 2025 / Published: 1 August 2025

Abstract

This paper introduces a knowledge–data dual-driven method for predicting groundwater conditions during tunnel construction. Unlike existing methods, our approach effectively integrates trend characteristics of apparent resistivity from detection results with geological distribution characteristics and expert insights. This dual-driven strategy significantly enhances the accuracy of the prediction model. The intelligent prediction process for tunnel groundwater conditions proceeds in the following steps: First, the apparent resistivity data matrix is obtained from transient electromagnetic detection results and standardized. Second, to improve data quality, trend characteristics are extracted from the apparent resistivity data, and outliers are eliminated. Third, expert insights are systematically integrated to fully utilize prior information on groundwater conditions at the construction face, leading to the establishment of robust predictive models tailored to data from various construction surfaces. Finally, the relevant prediction segment is extracted to complete the groundwater condition forecast.

1. Introduction

When carrying out tunnel engineering construction under complex geological conditions, the engineering area is characterized by rugged terrain, complex geology, harsh environment, and fragile ecology [1]. These challenges represent a global phenomenon, with tunnel construction worldwide exhibiting significant risks including deep burial, long tunnel lines, and complex hydrogeological conditions [2]. Tunnel construction is an engineering activity that modifies the geological environment, and almost all tunnel constructions encounter various types of adverse geology and the geological disasters they induce. Water inrush disasters refer to a geological disaster phenomenon where large amounts of water or muddy water mixtures suddenly rush into the tunnel during the construction of tunnels and underground projects, along structural planes such as rock joints and faults, and geological structures such as karst channels and underground rivers [3]. These water bodies or muddy water mixtures are the sources of water inrush disasters. The source of the disaster is the primary factor for the occurrence of water inrush disasters [4]. Due to the complex geology, complex distribution of water bodies, and frequent geological disasters in tunnel construction, water inrush disasters are highly prone to occur under construction disturbances [5]. According to statistics, water inrush disasters are one of the main disasters faced by tunnel construction, and water inrush disasters represent a critical challenge in underground engineering globally, ranking at the forefront in terms of the number of occurrences and deaths in major tunnel accidents both domestically and internationally [6]. Literature statistics from 2005 to 2019 show the number of deaths and injuries caused by geological disasters in tunnel construction, with a total of 338 deaths and 147 injuries, among which water inrush disasters accounted for 29.1% of geological disasters [7]. Facing improperly or untimely handled water inrush disasters can also cause irreversible geological disasters, such as ground subsidence, river diversion, interruption of water sources, and groundwater pollution [8]. Water inrush disasters not only affect the safety of tunnel construction but also severely impact the environmental ecology and sustainable development of the tunnel site [9]. Therefore, predicting the surge of water and guiding disaster avoidance and prevention are important safety measures during the tunnel construction process.
Artificial intelligence methods are applied to risk forecasting, such as support vector machines [10], neural networks [11], and Gaussian process regression [12]. To collect valuable precursor information on water inrush risks, some researchers have focused on how to monitor these characteristic information, mainly concentrating their studies in the field of tunnel engineering [13]. For instance, the literature [14] analyzes changes in displacement and pore water pressure during the water inrush process. Other scholars have focused on laboratory experiments as an alternative method to study precursors to water inrush risks [15]. Among these experimental results, large-scale model experiments on the evolution of information during tunnel construction [16] and small-scale laboratory experiments on disaster mechanisms [17] have been systematically carried out. Advanced horizontal drilling is a method to obtain accurate rock water content [18], but it is expensive, laborious, and cumbersome [19], and can only provide vertical measurements at a point, unable to assess the geological conditions around the borehole laterally [20]. Compared to drilling techniques, geophysical methods are fast, economical, and can measure a large area in front of the tunnel face without disturbing it, providing underground imaging.
In tunnel construction, using transient electromagnetic detection technology for groundwater forecasting is an efficient geological prediction method. This process involves sending transient strong electromagnetic pulses and receiving the electromagnetic fields responding from underground media, analyzing their attenuation characteristics and propagation paths, thereby accurately detecting the distribution, flow direction, and water content of groundwater. This technique can penetrate tens to hundreds of meters into the ground, providing a rapid, non-destructive assessment of hydrogeological conditions in complex geological structures. Among them, due to the high correlation between the earth’s electrical resistivity and groundwater characteristics [21], resistivity tomography has become one of the most commonly used methods, exploring the underground through two-dimensional or three-dimensional imaging and flexibly providing necessary survey depths through cross-sectional diffusion. However, the resistivity obtained from resistivity tomography imaging cannot distinguish water from clay, a vagueness that can be resolved by combining induced polarization with resistivity tomography [22]. Ref. [23] empirically correlated resistivity measurements with nearby borehole geotechnical indices, using all resistivity measurements in the derived empirical equation to estimate geological information along the resistivity tomography profile. Ref. [24] used hydrochemical analysis for water inrush forecasting, establishing a relationship model between water chemistry mechanisms and aquifers. Additionally, some scholars have introduced image pattern recognition technology into advanced geological prediction for tunnels, recognizing geological radar images [25].
The paper proposes a knowledge–data dual-driven intelligent prediction method for tunnel groundwater conditions. This approach effectively integrates both data-driven insights, particularly from apparent resistivity trend features, and knowledge-driven components derived from geological information and expert understanding of the construction face. The main contributions of this work are as follows:
  • A data classification method based on differences in the construction face, integrating detection data from similar groundwater discharge conditions.
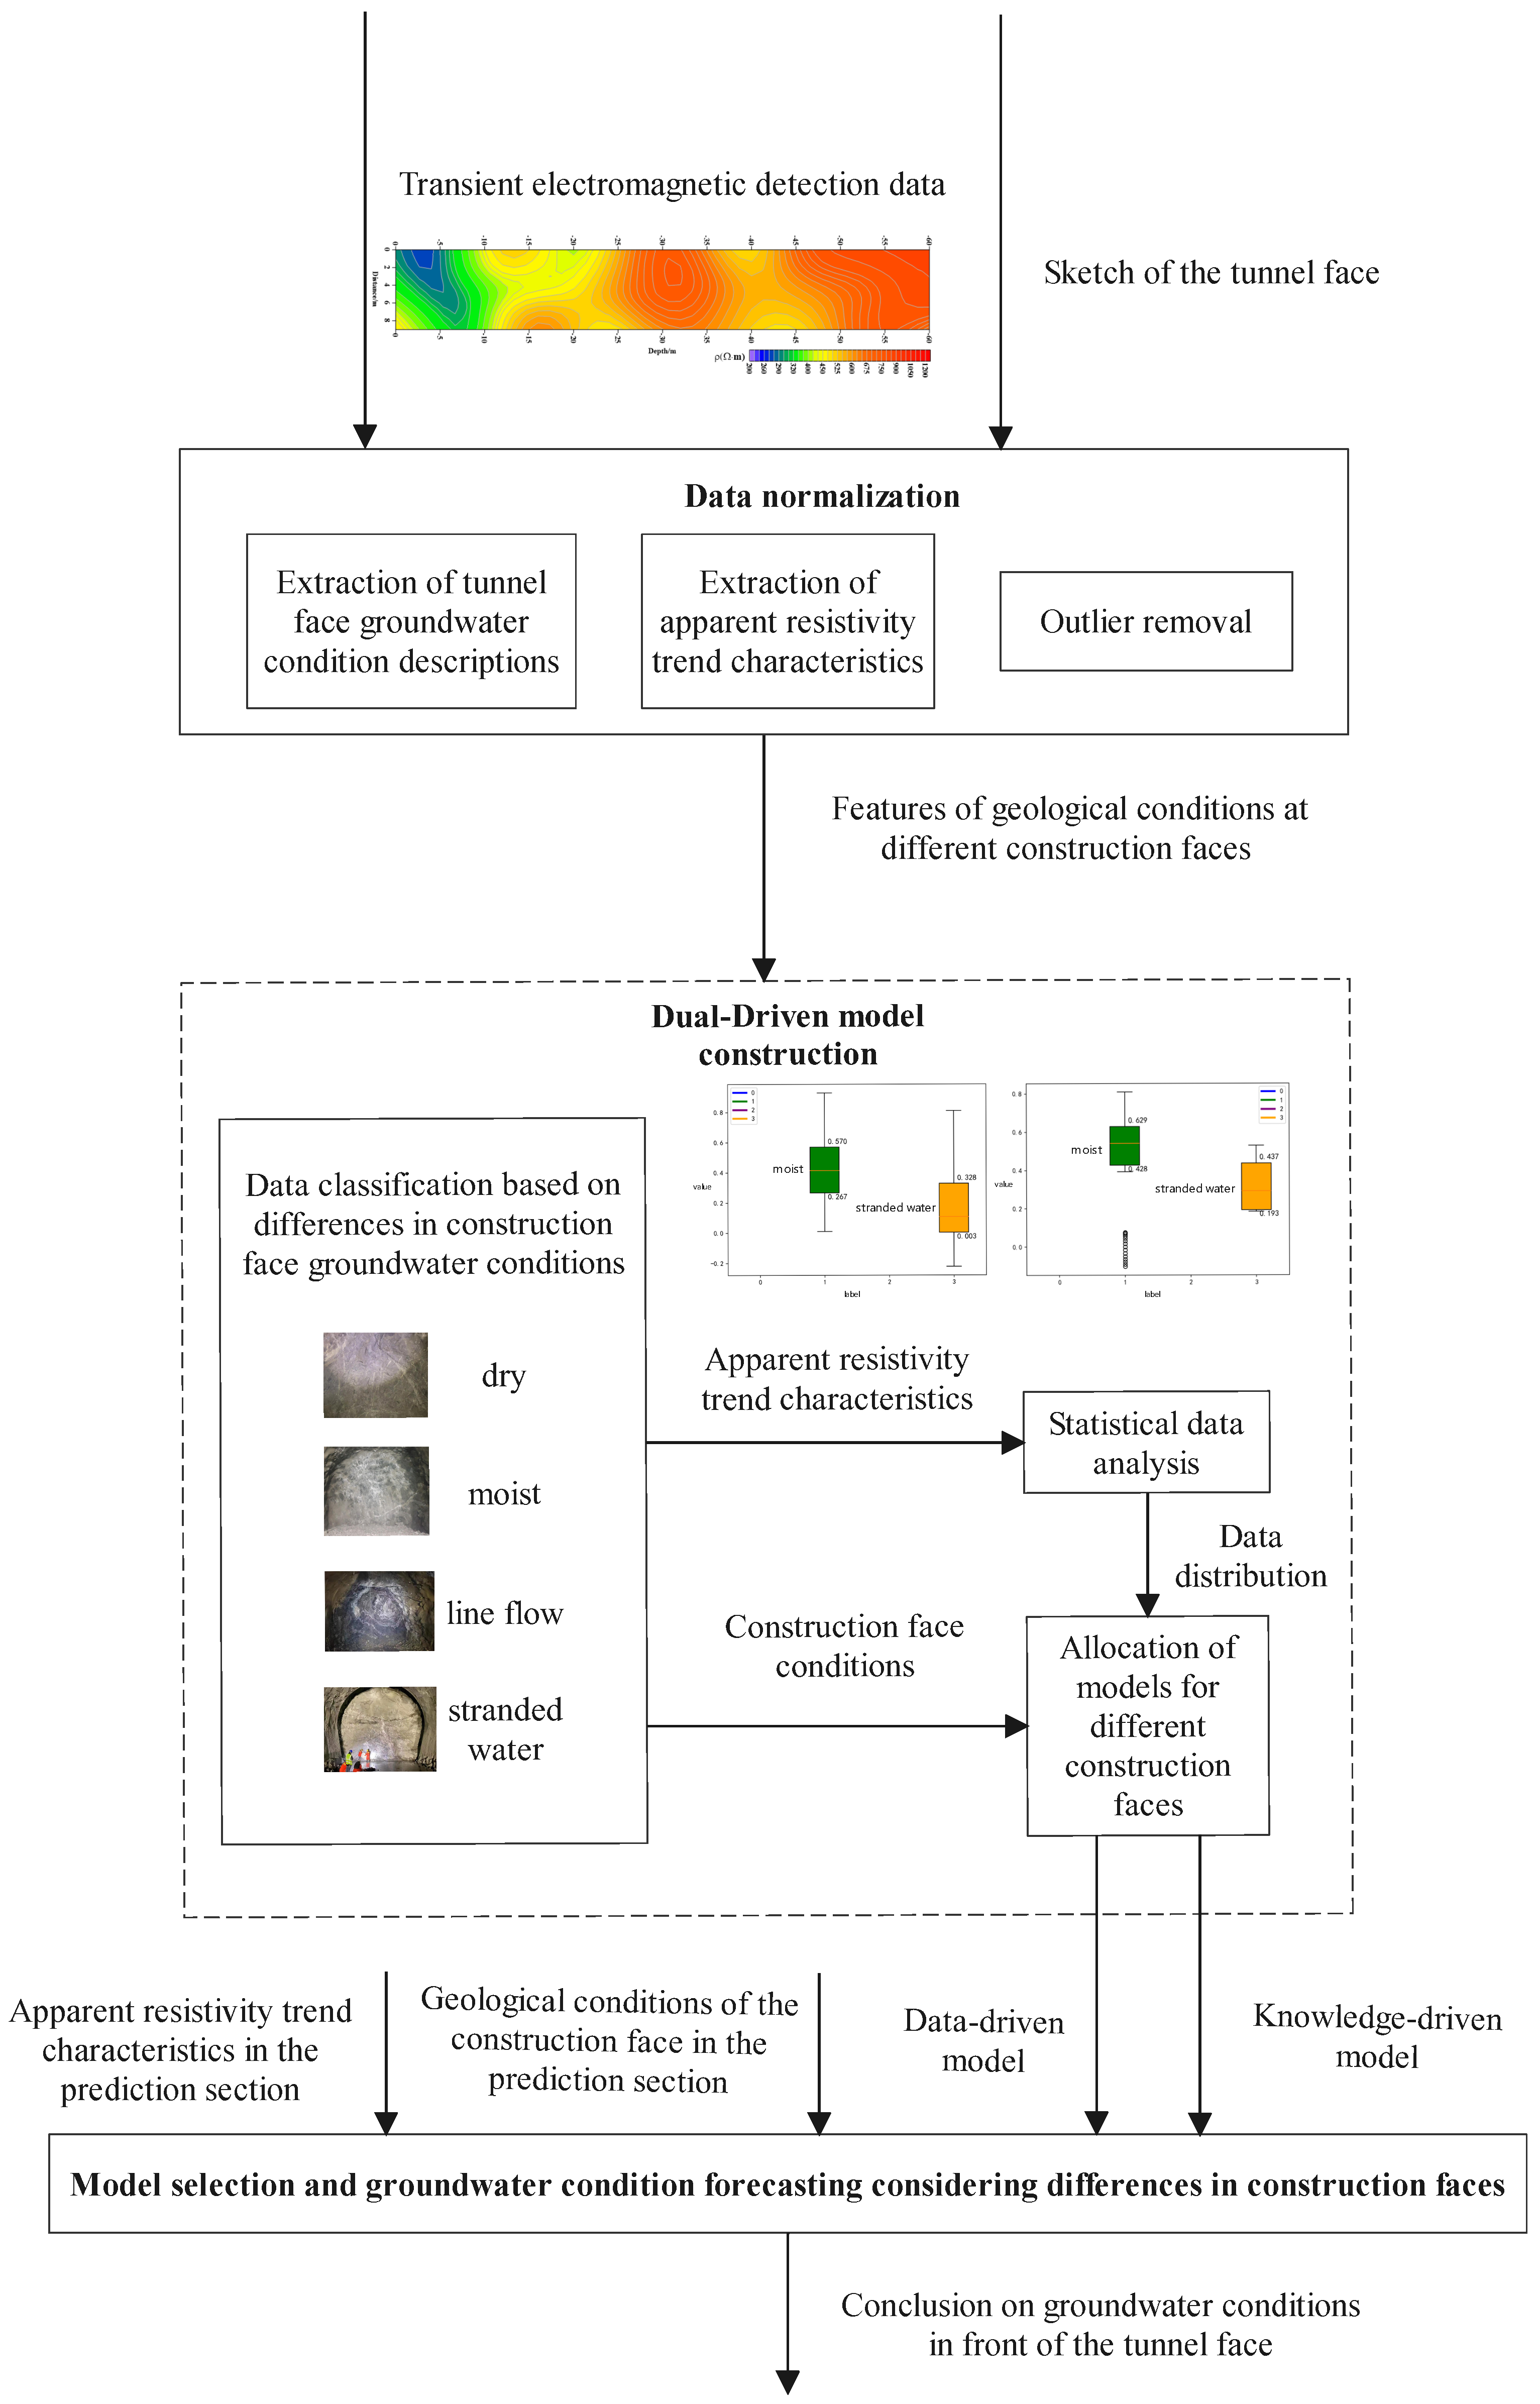
  • Designing a dual-driven prediction framework for groundwater conditions, which statistically analyzes detection data from various construction faces to derive suitable data-driven and knowledge-driven models, thereby significantly enhancing the accuracy of groundwater condition forecasting in the target area.

2. Analysis of the Groundwater Forecasting Process

The process of groundwater forecasting during tunnel construction mainly includes the acquisition and analysis of transient electromagnetic detection data. The process of acquiring transient electromagnetic detection data involves geological pre-exploration in front of the tunnel face before construction, capturing reflected and attenuated electromagnetic signals based on the different response characteristics of rocks and water bodies to electromagnetic waves. The process of analyzing transient electromagnetic detection data involves a detailed analysis of the captured electromagnetic signals to identify the presence and characteristics of groundwater, converting the received electromagnetic wave reflections and attenuation signals into apparent resistivity images. Rocks and dry soil, due to their higher resistivity, show stronger reflection signals, while aquifers, due to their lower resistivity, cause faster attenuation of electromagnetic waves, forming distinct low-resistivity areas in the apparent resistivity images. Based on the specific location, shape, and size of these low-resistivity areas, the distribution range, movement direction, and potential water content of the groundwater can be inferred.
To accurately forecast the tunnel groundwater conditions in the detection area, experts usually analyze the apparent resistivity images based on rule-based experiential knowledge to determine the specific water discharge range. However, in actual engineering applications, two identical apparent resistivity images may correspond to different groundwater conditions, or two different apparent resistivity images may correspond to the same groundwater conditions. When there is a contradiction between the detection data and the actual groundwater conditions revealed during construction, establishing an accurate prediction model is a challenging problem in forecasting tunnel groundwater conditions.

3. An Intelligent Tunnel Groundwater Condition Forecasting Method

As Figure 1 illustrates, the proposed knowledge–data dual-driven groundwater condition prediction method unfolds in three stages. Firstly, designing a data standardization strategy and extracting key features from the tunnel face sketches and transient electromagnetic detection data. Secondly, building data-driven and knowledge-driven models for different types of working face data. Finally, selecting the best model to forecast the groundwater conditions within the target range of the tunnel.

3.1. Groundwater Condition Description

The same terms, names of people, and places should be consistent throughout the document. Each tunnel face sketch is usually represented by a paragraph, and to extract descriptions related to groundwater conditions from this paragraph, keywords such as ‘dry’, ‘moist’, ‘line flow’, and ‘stranded flow’ are categorized, and keyword matching methods are used to extract the groundwater conditions from the descriptions as labels.

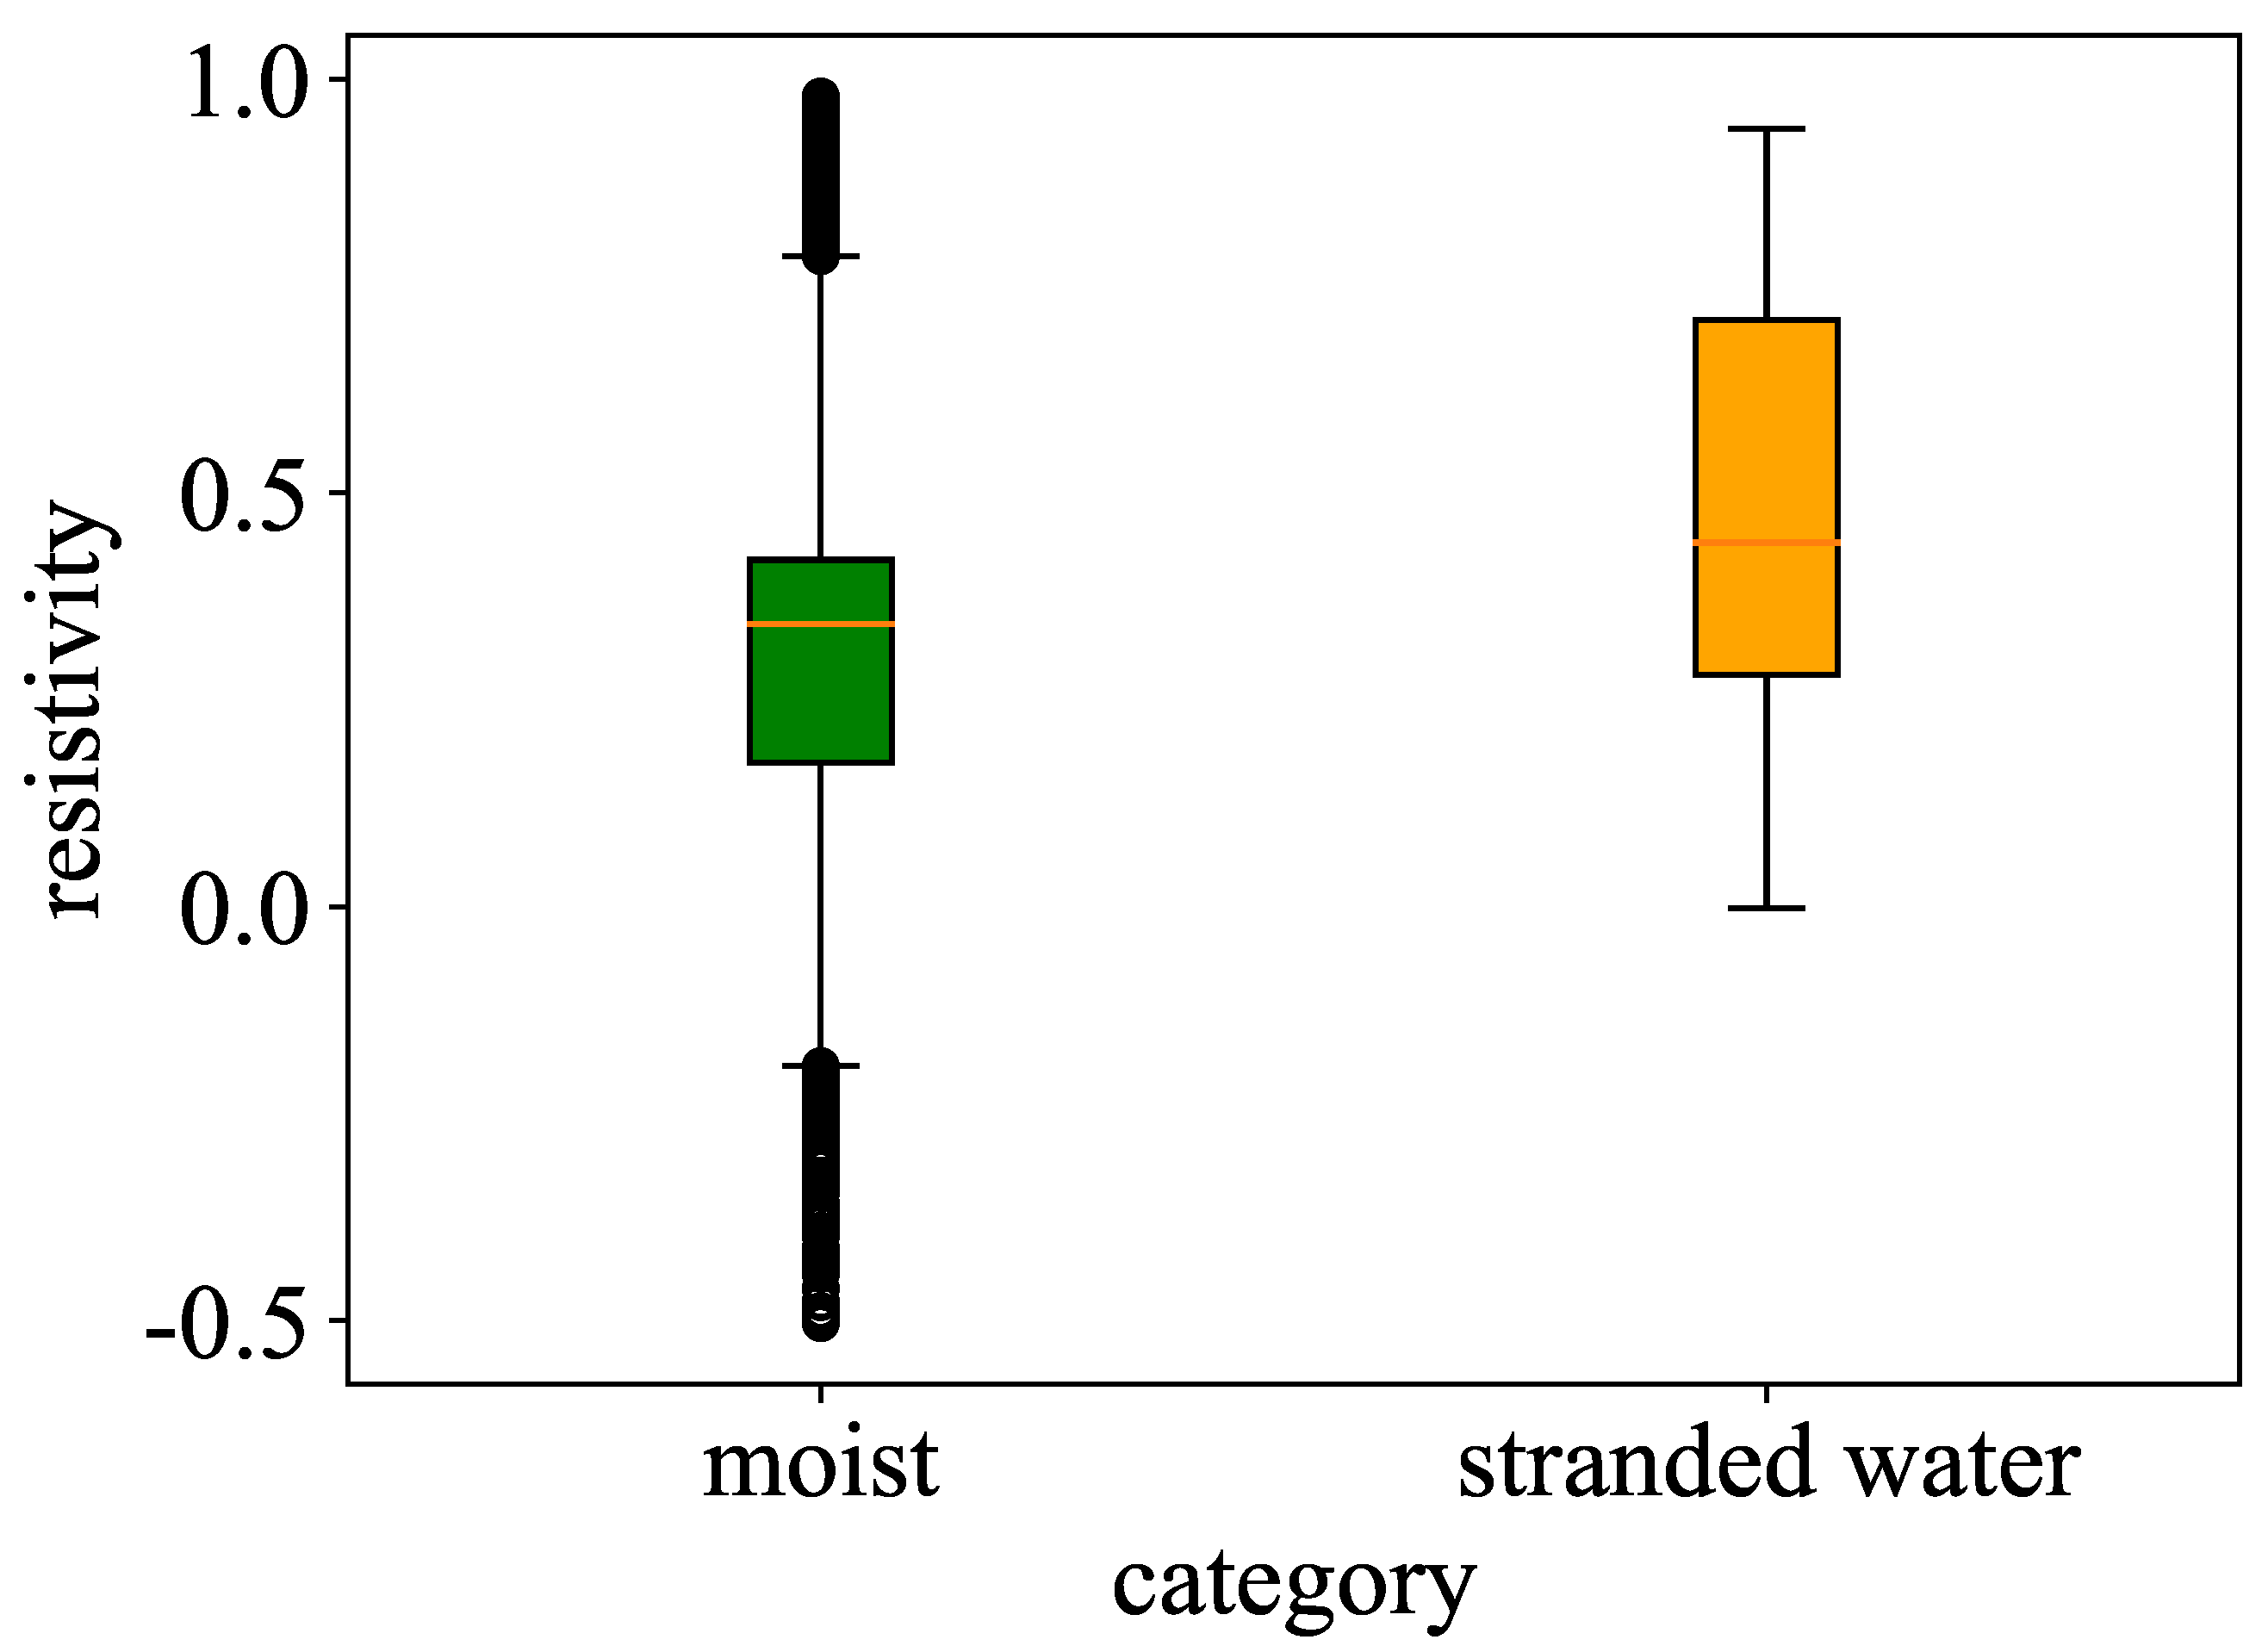
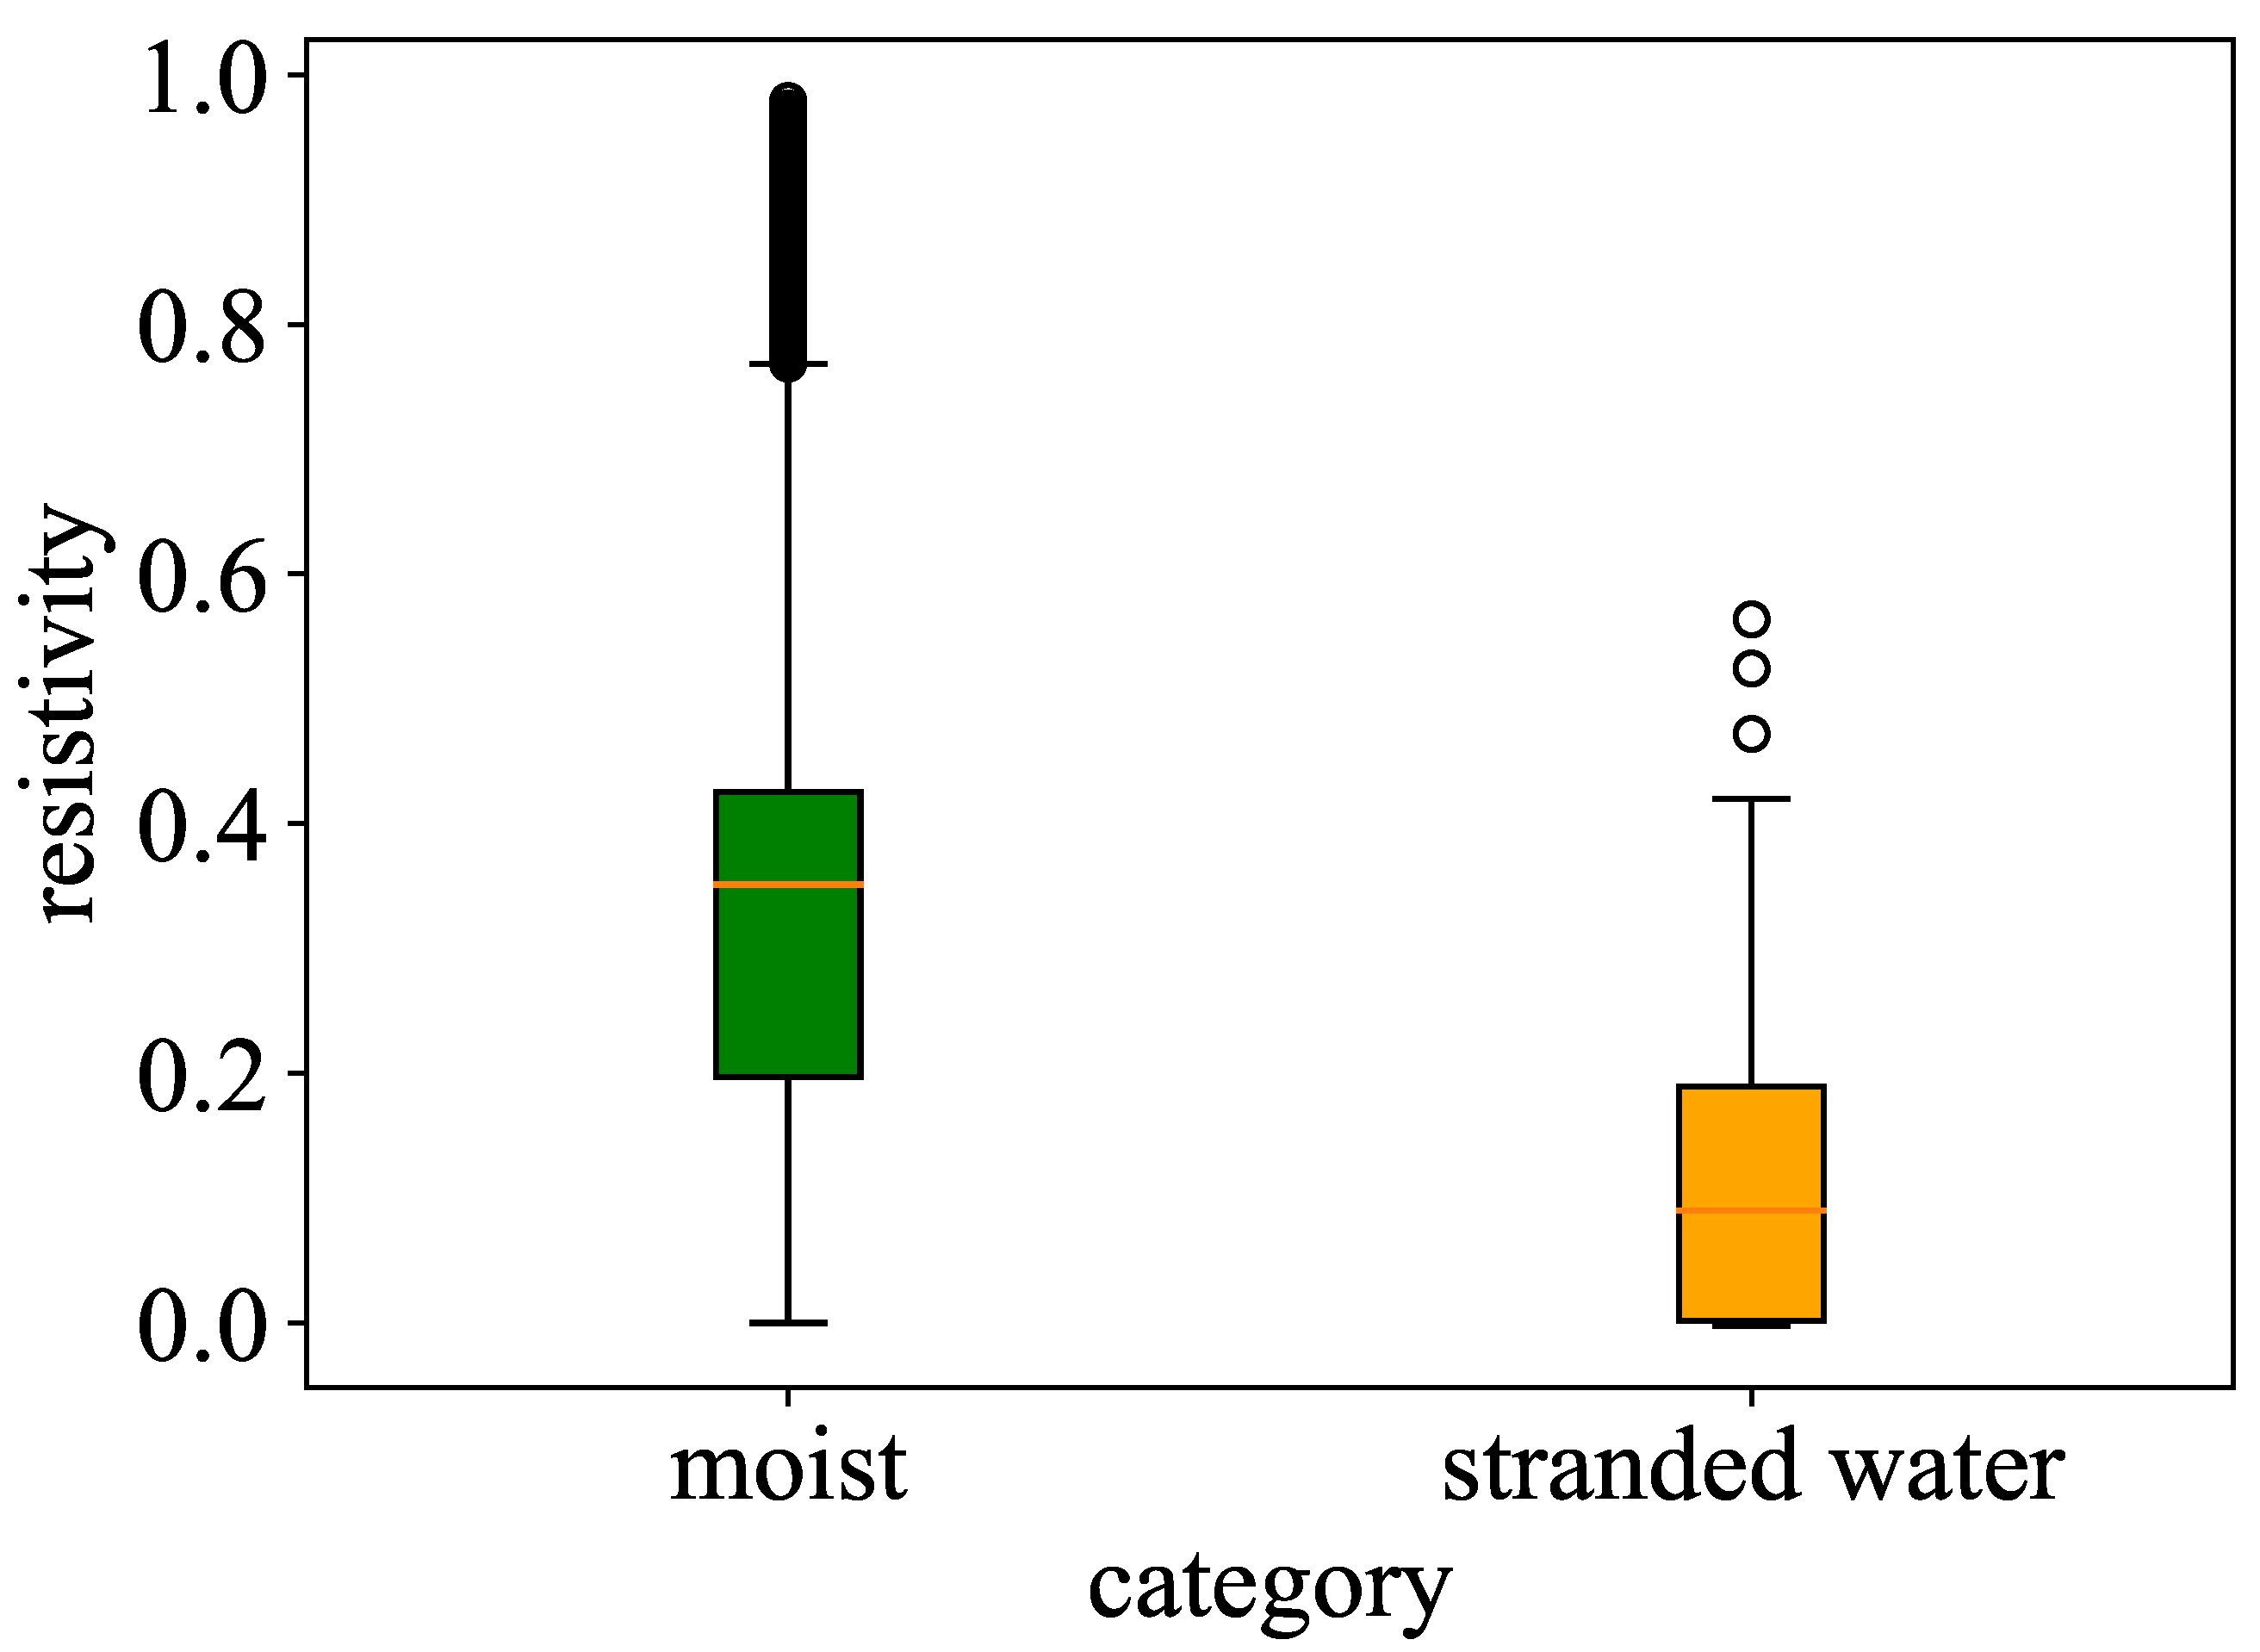
3.2. Extraction of Trend Characteristics of Apparent Resistivity

Define the matrix of the normalized detection data as R, where the row vectors and column vectors represent different spatial dimensions, respectively. The row vectors represent the apparent resistivity of the profiles perpendicular to the detection direction, and the column vectors represent the apparent resistivity of the profiles parallel to the detection direction.
R = r 11 r 12 r 1 n r 21 r 22 r 2 n r m 1 r m 2 r m n
where m and n are the number of rows and columns of the matrix R, representing the number of different detection points. r i j is the element in the i row and j column of matrix R, representing the apparent resistivity value at the intersection of the i vertical profile and j parallel profile.
Define the matrix of apparent resistivity trend characteristics T, and the calculation method for T each element t i j is such that equals the corresponding element in the original matrix R minus the element r 1 j in the first row of the same column of R, calculated as follows:
T = 0 0 0 r 21 r 11 r 22 r 12 r 2 n r 1 n r m 1 r 11 r m 2 r 12 r m n r 1 n
Thus, the matrix T can reflect the trend of apparent resistivity change relative to the same column point in the first row for each point outside the first row.

3.3. Elimination of Apparent Resistivity Outliers

In some detection intervals, the detection data do not match the actual conditions, and the groundwater conditions interpreted from the data significantly differ from those discovered through actual construction. This difference indicates that the observed apparent resistivity values are inconsistent with the expected relationship with groundwater.
Because the groundwater conditions of the construction face differ for detection data with similar results, so do the groundwater conditions in subsequent detection sections. Since the working face is available as prior information, this paper considers analyzing data for different construction faces separately.
Due to significant discrepancies between the data obtained from apparent resistivity measurements and the actual groundwater conditions, further analysis and processing of the detection data are necessary. To ensure accurate prediction of groundwater conditions, measures to eliminate outliers in apparent resistivity have been adopted, removing inaccurate data that may be caused by equipment faults, external interference, or geological anomalies, thereby improving the quality of the detection data.
Experience with transient electromagnetic (TEM) detection and our understanding of tunnel hydrogeology indicate a strong correspondence between the water state observed at the tunnel face and that in the forthcoming excavation zone. Leveraging this relationship, we use the face condition as prior knowledge to pre-classify the TEM data and determine section-specific thresholds for outlier removal.
When there is a discrepancy between the mechanism and data distribution, a data filtering mechanism is introduced. The values of the tunnel face in the corresponding column of the apparent resistivity matrix are calculated, and if half of the values are greater than the threshold, that column is eliminated, as stipulated by the following:
F ( T i · , θ ) 0.5
where F ( T i · , θ ) is used to evaluate the proportion of apparent resistivities in the i row of matrix T that exceed the threshold θ . If this proportion is greater than half of the elements in that row, the row will be eliminated.
Specifically, F can be represented as follows:
F ( T i · , θ ) = 1 m i = 1 m C { T i j > θ }
where C is an indicator function used to determine whether the condition T i j > θ is met. After these data are eliminated, the remaining data are used for statistical analysis according to the conditions of different construction faces.

3.4. Transient Electromagnetic Knowledge-Driven Model

To explore the patterns within transient electromagnetic detection data, and to establish knowledge-driven and data-driven models that conform to objective laws, this paper first conducts extensive traditional statistical analysis experiments. The aim is to fully explore the effects of different variables from transient electromagnetic detection results on actual groundwater conditions, while also investigating whether there is any interdependence between variables during their changes through meticulous optimization of the experimental process.
After obtaining the trend characteristic matrix with outliers removed, statistical analysis methods can also be used to acquire knowledge about detection data and groundwater conditions, and this knowledge can directly inform the output of detection results for future data with similar characteristics. Additionally, for data that is difficult to classify directly after statistical analysis, the support vector machines (SVMs) method is employed to establish groundwater condition prediction models for different construction faces.
The above process allows for the analysis of data from different construction faces, more clearly identifying the distribution differences among data categories. This paper conducts a correlational analysis of the apparent resistivity data in front of the tunnel face for construction faces categorized as dry, moist, line flow, and sheet flow, analyzing the patterns of different categories of construction faces and the actual groundwater conditions in corresponding detection sections to preliminarily judge the applicability of data from different categories. There are cases in the detection conclusions where the groundwater conditions within the detection section are the same as those at the construction face. For this, detection data that meet this criterion and data that do not are extracted, and the pattern of data distribution is analyzed, with results shown in Figure 2.
When the face is moist, the diagram shows that multiple groundwater conditions appear in the detection section only when the maximum apparent resistivity of each forecast window exceeds 2000. In that case a data-driven model is required. Conversely, if the maximum is below 2000, we assume the ahead-of-face conditions mirror those at the face. When the face is classified as dry or as line flow, the subsequent detection sections likewise adopt the same condition. If the face is characterized by sheet flow, only a mixture of groundwater states is expected ahead. Let I denote the groundwater condition at the face, with D for dry, L for line flow, W for moist, and G for stranded flow; thus I { D , L , W , G } depending on the construction face groundwater conditions and the range of apparent resistivity in the detection section, the groundwater conditions within the detection section can be defined as follows:
S = I , if ( I { D , L } ) or ( I = W & R max < 2000 ) , { W , G } , if ( I = G ) or ( I = W & R max > 2000 ) .
where R max represents the maximum value in matrix R, and S represents the possible groundwater conditions within the detection section.

3.5. Transient Electromagnetic Data-Driven Model

When the knowledge-driven rules cannot reliably separate groundwater categories, a data-driven model is introduced. For data that are difficult to classify directly after statistical analysis, the essence is to find a threshold for distinguishing different groundwater conditions. The support vector machine (SVM) model is a classifier that can achieve strong generalization capabilities without needing a large number of training set samples. Its main advantages include high sparsity, high classification accuracy, and fast running speed, making it especially suitable for situations with small training datasets. When dealing with data that is difficult to classify directly, SVM constructs the classification model by finding the optimal threshold, generating a series of parallel classification decision boundaries. Choosing the most appropriate threshold maximizes the margin during classification, thereby reducing classification errors caused by feature value errors in sample collection. This method allows SVM to effectively distinguish between different groundwater conditions even when the boundaries between data features are not clear, thus making it suitable to model data from different construction faces using the support vector machine method.
Assume there is a training sample set { ( x 1 , y 1 ) , ( x 2 , y 2 ) , , ( x n , y n ) } , where each x i is a row vector of a detection matrix, and y i { 1 , 1 } is the corresponding label, with −1 representing ‘moist’ and 1 representing ‘stranded flow’.
To separate different categories of data, it is only necessary to find w and b such that
y i ( w · x i + b ) 1 , i = 1 , , n .
Based on this, it is necessary to minimize the norm of w and introduce slack variables ξ i 0 , allowing for some misclassification. Therefore, the optimization problem becomes
min w , b , ξ 1 2 w 2 + C i = 1 n ξ i
where C is a predetermined positive penalty parameter used to control the strength of the penalty for errors.
To improve the accuracy of categorizing groundwater conditions, the apparent resistivity vector is used as the basis for judgment. Specifically, the apparent resistivity data of the prediction area are organized into a vector, and the values within this vector are compared with a predefined threshold. If at least half of the values in the vector are below this threshold, the groundwater conditions in that area are determined to be of a more severe category. This method assesses groundwater conditions by statistically evaluating the proportion of values in the apparent resistivity vector that are below the threshold, providing a more detailed reflection of the actual groundwater conditions.

4. Experiment and Results Analysis

The effectiveness of the proposed method is validated in terms of the elimination of apparent resistivity outliers and the predictive performance of tunnel groundwater conditions, using transient electromagnetic detection results from actual tunnel projects as experimental data. The dataset is divided into a training set and a test set in an 8:2 ratio.

4.1. Apparent Resistivity Outlier Elimination Experiment

The distribution of apparent resistivity for construction faces with moist or sheet flow groundwater conditions is statistically analyzed, as shown in Figure 3. According to the mechanism, the apparent resistivity values for construction faces with sheet flow groundwater conditions should be lower than those for moist conditions. Data that do not conform to this mechanism are eliminated, with results shown in Figure 4.

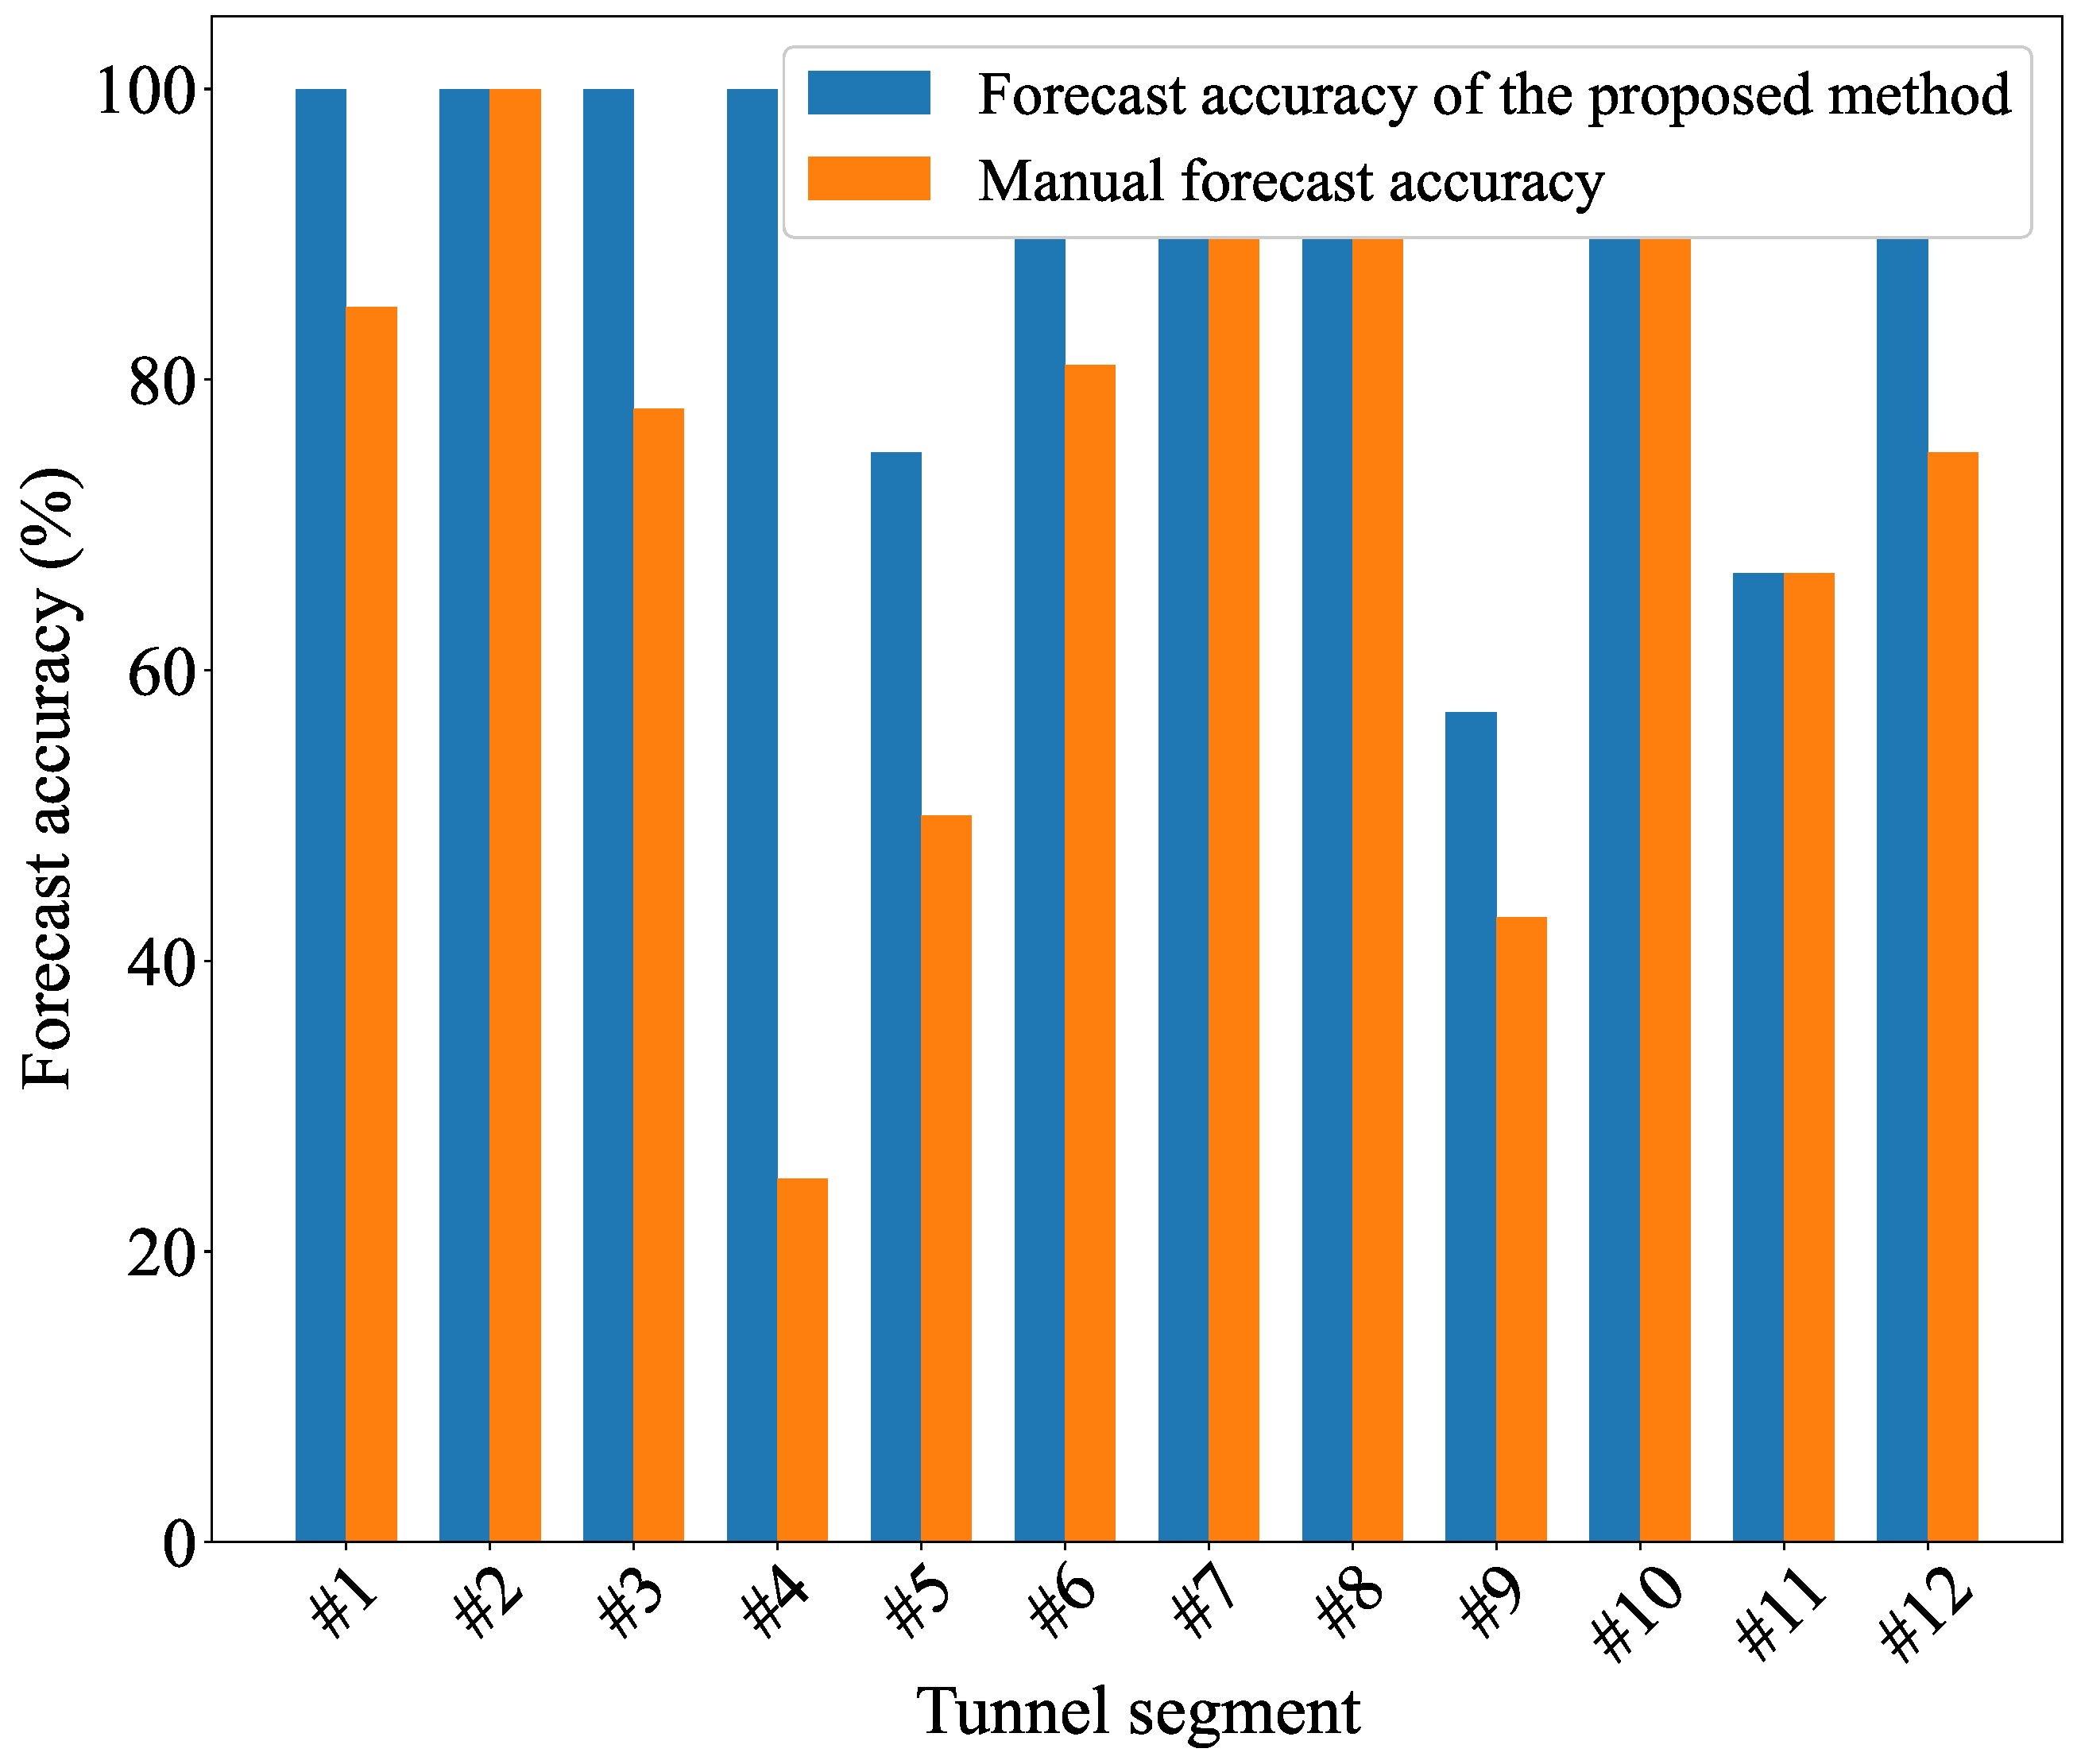
4.2. Groundwater Condition Forecast Result Comparison Experiment

This paper proposes an intelligent method for forecasting groundwater conditions that solves the problem of difficulty in distinguishing groundwater conditions and effectively improves the accuracy of tunnel groundwater condition forecasts. The prediction model for groundwater conditions is evaluated using accuracy, precision, recall, and F-score. The formulas for these four evaluation metrics are as follows:
Accuracy = T P + T N T P + T N + F P + F N
Precision = T P T P + F P
Recall = T P T P + F N
F 1 = 2 × Precision × Recall Precision + Recall
where TP (true positive) denotes correctly predicted positive cases, TN (true negative) denotes correctly predicted negative cases, FP (false positive) denotes negative cases incorrectly predicted as positive, and FN (false negative) denotes positive cases incorrectly predicted as negative.
Figure 5 compares the accuracy results of the proposed method and expert predictions in forecasting groundwater conditions. The twelve segments represent deep-buried tunnel sections surveyed by the transient electromagnetic (TEM) method, each with a fixed detection window of 60 m along the tunnel axis. As summarized in Table 1, Segments 1–3 are located in gneiss, Segment 4 in quartzite, and Segments 5–12 in diorite, offering a spread of lithological conditions.It can be seen that the proposed method surpasses the accuracy of manual predictions across multiple tunnel groundwater conditions.
Table 2 compares the evaluation metrics of the proposed method with other methods in forecasting groundwater conditions.

4.3. Discussion

To place our results in context, we compared the dual-driven framework with four widely used data-driven classifiers—support-vector machine (SVM), multilayer perceptron (MLP), XGBoost, and k-nearest neighbor (KNN)—using the same training and test splits (Table 2). Across all four evaluation metrics, the proposed method achieved the best scores: its overall accuracy reached 0.94, surpassing SVM (0.91), MLP (0.90), XGBoost (0.91), and KNN (0.89). The gains are even more pronounced in class-sensitive measures: precision and recall increased by roughly 9–18 percentage points over the strongest baseline, and the F1 score improved from 0.77 (SVM) to 0.89. These consistent improvements indicate that fusing trend-feature analysis with expert rules not only boosts average performance but also enables the model to generalize across the diverse lithologies summarized in Table 1. In other words, the dual-driven approach closes the long-recognized gap between rule-based interpretation and machine learning, offering sharper class separation and greater robustness to data-distribution shifts—key requirements for reliable groundwater condition forecasting in tunnel engineering.

5. Conclusions

Accurate forecasting of tunnel groundwater conditions offers vital foresight into the geological environment, empowering construction teams to enact timely preventative measures, which is paramount for ensuring tunnel construction safety. This paper presents a novel knowledge–data dual-driven prediction method that represents a significant advancement in this field. Instead of relying solely on data or manual assessment, our approach builds a comprehensive understanding of groundwater conditions by synergistically leveraging data-driven analysis of apparent resistivity trend features and knowledge-driven insights gleaned from geological characteristics and expert experience at the working face. This integrated strategy effectively addresses data inconsistencies, such as those arising from varying instrument parameters, by focusing on the robust trends of apparent resistivity rather than sensitive absolute values. By carefully designing models for specific construction face layers, our method minimizes potential errors and provides more reliable predictions. Moreover, the underlying principles of this dual-driven approach offer a versatile framework for interpreting various types of geophysical detection data. This study is limited by a relatively small number of TEM samples. In future work we will compile a much larger and more diverse TEM dataset drawn from tunnels in varied geological conditions, so as to rigorously verify the general applicability of the proposed method.

Author Contributions

Methodology, Y.H.; Software, W.F.; Supervision, X.H. All authors have read and agreed to the published version of the manuscript.

Funding

This work was supported by the National Key R&D Program of China under Grant 2021YFB2300603, the Key R&D Program of China Railway First Survey and Design Institute Group Co., Ltd. under Grant 2022KY53ZD(CHY)-10, and the Major Science and Technology R&D Program of China Railway Construction Corporation Limited under Grant 2024-W04 and 2024-W02.

Institutional Review Board Statement

Not applicable.

Informed Consent Statement

Not applicable.

Data Availability Statement

The datasets presented in this article are not readily available due to technical/time limitations.

Acknowledgments

The authors would like to thank the editors and anonymous reviewers for their numerous detailed and inspiring suggestions and comments that helped improving the quality and readability of this paper.

Conflicts of Interest

Author Wei Fu was employed by China Railway First Survey and Design Institute Group Co., Ltd. The remaining authors declare that the research was conducted in the absence of any commercial or financial relationships that could be construed as a potential conflict of interest.

References

  1. Zhang, H.; Sun, J.C.; Liu, X.C.; Tu, P. Investigation and analysis on the setting of cross passage and auxiliary passage in extra-long highway tunnel. Procedia Eng. 2018, 211, 659–667. [Google Scholar] [CrossRef]
  2. Li, S.; Xu, Z.; Huang, X.; Lin, P.; Zhao, X.; Zhang, Q.; Yang, L.; Zhang, X.; Sun, H.; Pan, D. Classification, geological identification, hazard mode and typical case studies of hazard-causing structures for water and mud inrush in tunnels. Chin. J. Rock Mech. Eng. 2018, 37, 1041–1069. [Google Scholar]
  3. Li, L.; Li, S.; Zhang, Q. Study of mechanism of water inrush induced by hydraulic fracturing in karst tunnels. Rock Soil Mech. 2010, 31, 523–528. [Google Scholar]
  4. Li, L.; Jin, H.; Tu, W.; Zhou, Z. Study on the minimum safe thickness of water inrush prevention in karst tunnel under the coupling effect of blasting power and water pressure. Tunn. Undergr. Space Technol. 2024, 153, 105994. [Google Scholar] [CrossRef]
  5. Lou, G.; Song, Y.; Man, L.; Sun, Z. A new method for detecting karst and groundwater by 3D seismic wave: Case study of the karst tunnel in Zhangjihuai Railway, China. Bull. Eng. Geol. Environ. 2023, 82, 451. [Google Scholar] [CrossRef]
  6. Ou, G.; Jiao, Y.; Zhang, G.; Zou, J.; Tan, F.; Zhang, W. Collapse risk assessment of deep-buried tunnel during construction and its application. Tunn. Undergr. Space Technol. 2021, 115, 104019. [Google Scholar] [CrossRef]
  7. Zhu, Y.; Zhou, J.; Zhang, B.; Wang, H.; Huang, M. Statistical analysis of major tunnel construction accidents in China from 2010 to 2020. Tunn. Undergr. Space Technol. 2022, 124, 104460. [Google Scholar] [CrossRef]
  8. Li, S.; He, P.; Li, L.; Shi, S.; Zhang, Q.; Zhang, J.; Hu, J. Gaussian process model of water inflow prediction in tunnel construction and its engineering applications. Tunn. Undergr. Space Technol. 2017, 69, 155–161. [Google Scholar] [CrossRef]
  9. Huang, Z.; Fu, H.; Chen, W.; Zhang, J.; Huang, H. Damage detection and quantitative analysis of shield tunnel structure. Autom. Constr. 2018, 94, 303–316. [Google Scholar] [CrossRef]
  10. Zhou, C.; Yin, K.; Cao, Y.; Ahmed, B. Application of time series analysis and PSO-SVM model in predicting the Bazimen landslide in the Three Gorges Reservoir, China. Eng. Geol. 2016, 204, 108–120. [Google Scholar] [CrossRef]
  11. Jan, J.; Hung, S.L.; Chi, S.; Chern, J. Neural network forecast model in deep excavation. J. Comput. Civ. Eng. 2002, 16, 59–65. [Google Scholar] [CrossRef]
  12. Liu, K.; Liu, B. Intelligent information-based construction in tunnel engineering based on the GA and CCGPR coupled algorithm. Tunn. Undergr. Space Technol. 2019, 88, 113–128. [Google Scholar] [CrossRef]
  13. Li, S.; Liu, C.; Zhou, Z.; Li, L.; Shi, S.; Yuan, Y. Multi-sources information fusion analysis of water inrush disaster in tunnels based on improved theory of evidence. Tunn. Undergr. Space Technol. 2021, 113, 103948. [Google Scholar] [CrossRef]
  14. Li, S.; Liu, H.; Li, L.; Zhang, Q.; Wang, K.; Wang, K. Large scale three-dimensional seepage analysis model test and numerical simulation research on undersea tunnel. Appl. Ocean. Res. 2016, 59, 510–520. [Google Scholar] [CrossRef]
  15. Zhou, Z.; Ranjith, P.G.; Li, S. Criteria for assessment of internal stability of granular soil. Proc. Inst. Civ.-Eng.-Geotech. Eng. 2017, 170, 73–83. [Google Scholar] [CrossRef]
  16. Jiang, H.; Li, L.; Rong, X.; Wang, M.; Xia, Y.; Zhang, Z. Model test to investigate waterproof-resistant slab minimum safety thickness for water inrush geohazards. Tunn. Undergr. Space Technol. 2017, 62, 35–42. [Google Scholar] [CrossRef]
  17. Ma, D.; Rezania, M.; Yu, H.; Bai, H. Variations of hydraulic properties of granular sandstones during water inrush: Effect of small particle migration. Eng. Geol. 2017, 217, 61–70. [Google Scholar] [CrossRef]
  18. Lin, D.; Lou, F.; Yuan, R.; Shang, Y.; Zhao, Y.; Ma, J.; Zhang, L.; Li, K.; Bao, W. Rock mass characterization for shallow granite by integrating rock core indices and seismic velocity. Int. J. Rock Mech. Min. Sci. 2017, 93, 130–137. [Google Scholar] [CrossRef]
  19. Cosenza, P.; Marmet, E.; Rejiba, F.; Cui, Y.J.; Tabbagh, A.; Charlery, Y. Correlations between geotechnical and electrical data: A case study at Garchy in France. J. Appl. Geophys. 2006, 60, 165–178. [Google Scholar] [CrossRef]
  20. Hasan, M.; Shang, Y.; Jin, W.; Akhter, G. Site suitability for engineering-infrastructure (EI) development and groundwater exploitation using integrated geophysical approach in Guangdong, China. Bull. Eng. Geol. Environ. 2022, 81, 7. [Google Scholar] [CrossRef]
  21. Chambers, J.E.; Kuras, O.; Meldrum, P.I.; Ogilvy, R.D.; Hollands, J. Electrical resistivity tomography applied to geologic, hydrogeologic, and engineering investigations at a former waste-disposal site. Geophysics 2006, 71, B231–B239. [Google Scholar] [CrossRef]
  22. Marescot, L.; Monnet, R.; Chapellier, D. Resistivity and induced polarization surveys for slope instability studies in the Swiss Alps. Eng. Geol. 2008, 98, 18–28. [Google Scholar] [CrossRef]
  23. Hasan, M.; Shang, Y. Geophysical evaluation of geological model uncertainty for infrastructure design and groundwater assessments. Eng. Geol. 2022, 299, 106560. [Google Scholar] [CrossRef]
  24. Chen, Y.; Tang, L.; Zhu, S. Comprehensive study on identification of water inrush sources from deep mining roadway. Environ. Sci. Pollut. Res. 2022, 29, 19608–19623. [Google Scholar] [CrossRef] [PubMed]
  25. Chen, H.; Liu, S. Advanced geological prediction technology of tunnel based on image recognition. Arab. J. Geosci. 2019, 12, 601. [Google Scholar] [CrossRef]
Figure 1. Framework.
Information 16 00659 g001
Figure 2. Apparent resistivity distribution when the construction face is moist.
Information 16 00659 g002
Figure 3. Box plot before apparent resistivity outlier removal.
Information 16 00659 g003
Figure 4. Box plot after apparent resistivity outlier removal.
Information 16 00659 g004
Figure 5. Comparison of forecast accuracy between the proposed method and manual forecasting.
Information 16 00659 g005
Table 1. Lithology of the twelve TEM segments.
Segment(s)Rock Type
1–3Gneiss
4Quartzite
5–12Diorite
Table 2. Performance evaluation metrics for groundwater conditions by different methods.
MethodAccuracyPrecisionRecallF1
Proposed0.93530.87630.90470.8886
SVM0.91180.78200.76400.7660
MLP0.90000.70360.76060.7226
XGBoost0.90590.73340.76230.7424
KNN0.89410.69750.75880.7202
Disclaimer/Publisher’s Note: The statements, opinions and data contained in all publications are solely those of the individual author(s) and contributor(s) and not of MDPI and/or the editor(s). MDPI and/or the editor(s) disclaim responsibility for any injury to people or property resulting from any ideas, methods, instructions or products referred to in the content.

