Article

A Fundamental Statistics Self-Learning Method with Python Programming for Data Science Implementations

by
Prismahardi Aji Riyantoko
1,
Nobuo Funabiki
1,*,
Komang Candra Brata
1,2,
Mustika Mentari
1,
Aviolla Terza Damaliana
3 and
Dwi Arman Prasetya
3
1
Department of Information and Communication Systems, Okayama University, Okayama 700-8530, Japan
2
Department of Informatics Engineering, Universitas Brawijaya, Malang 65145, Indonesia
3
Department of Data Science, Universitas Pembangunan Nasional Veteran Jawa Timur, Surabaya 60294, Indonesia
*
Author to whom correspondence should be addressed.
Information 2025, 16(7), 607; https://doi.org/10.3390/info16070607
Submission received: 25 April 2025 / Revised: 6 July 2025 / Accepted: 9 July 2025 / Published: 15 July 2025

Abstract

The increasing demand for data-driven decision making to maintain the innovations and competitiveness of organizations highlights the need for data science educations across academia and industry. At its core is a solid understanding of statistics, which is necessary for conducting a thorough analysis of data and deriving valuable insights. Unfortunately, conventional statistics learning often lacks practice in real-world applications using computer programs, causing a separation between conceptual knowledge of statistics equations and their hands-on skills. Integrating statistics learning into Python programming can convey an effective solution for this problem, where it has become essential in data science implementations, with extensive and versatile libraries. In this paper, we present a self-learning method for fundamental statistics through Python programming for data science studies. Unlike conventional approaches, our method integrates three types of interactive problems—element fill-in-blank problem (EFP), grammar-concept understanding problem (GUP), and value trace problem (VTP)—in the Programming Learning Assistant System (PLAS). This combination allows students to write code, understand concepts, and trace the output value while obtaining instant feedback so that they can improve retention, knowledge, and practical skills in learning statistics using Python programming. For evaluations, we generated 22 instances using source codes for fundamental statistics topics, and assigned them to 40 first-year undergraduate students at UPN Veteran Jawa Timur, Indonesia. Statistics analytical methods were utilized to analyze the student learning performances. The results show that a significant correlation ( ρ < 0.05 ) exists between the students who solved our proposal and those who did not. The results confirm that it can effectively assist students in learning fundamental statistics self-learning using Python programming for data science implementations.

1. Introduction

The continuing growth of data science has highlighted the importance of statistics in data-driven decisions [1]. Statistics is a core knowledge in data science that is broadly taught in universities around the world. Practical knowledge and skills of statistics have an essential role in the implementation of data science regarding analyzing data and gaining valuable insights from it [2].
However, conventional statistics learning in universities often lacks practices in real-world data science applications using computer programs. The current situation can cause a separation between the understanding of the fundamental statistics concept involving statistics equations and their practical hands-on skills. In real-world applications, data processing, calculations, and visualizations are often performed using Python programming [3,4,5]. Therefore, an integrated learning method of combining fundamental statistics with Python programming should be offered to bridge the gap and give a solution for students to improve their practical skills in data science implementations.
Python programming has become an essential tool in data science implementations due to its extensive and versatile libraries for statistics, such as NumPy, Pandas, and SciPy [6,7]. It supports a simple and readable syntax that makes it easy to understand and write codes in statistics. The integration of statistics with Python programming allows students to practice computational procedures and understand logic behind syntax.
Many studies highlight the growing trend of implementing Python to enhance practical statistics learning. Guler et al. demonstrated that the implementation of Python in Jupyter Notebooks as digital formative assessment tools significantly improved the self-efficacy of teachers in digital assessment activities [8]. Avila-Garzon & Bacca-Acosta, through a bibliometric analysis, identified active learning strategies, such as project-based learning driven by Python programming exercises, as dominant trends in data science curricula [9]. Tufino et al. successfully integrated Python modules for data analysis into a first-year laboratory course, reporting a 30% increase in students’ data handling proficiency [10]. Moreover, Branko et al. found that the collaborative development of modular interactive Jupyter Notebooks enhances undergraduate mastery of statistical concepts by providing immediate coding feedback within learning platforms [11]. Conversely, recent pedagogical trends emphasize the integration focus on incorporating interactive computational tools like Python within Jupyter Notebooks to encourage active learning. These approaches leverage Python’s readability, extensive ecosystem, and community support to bridge the gap between theory and practice.
Previously, we have studied a system for assisting in learning basic statistics topics with Python programming [12]. This preliminary system integrates the 
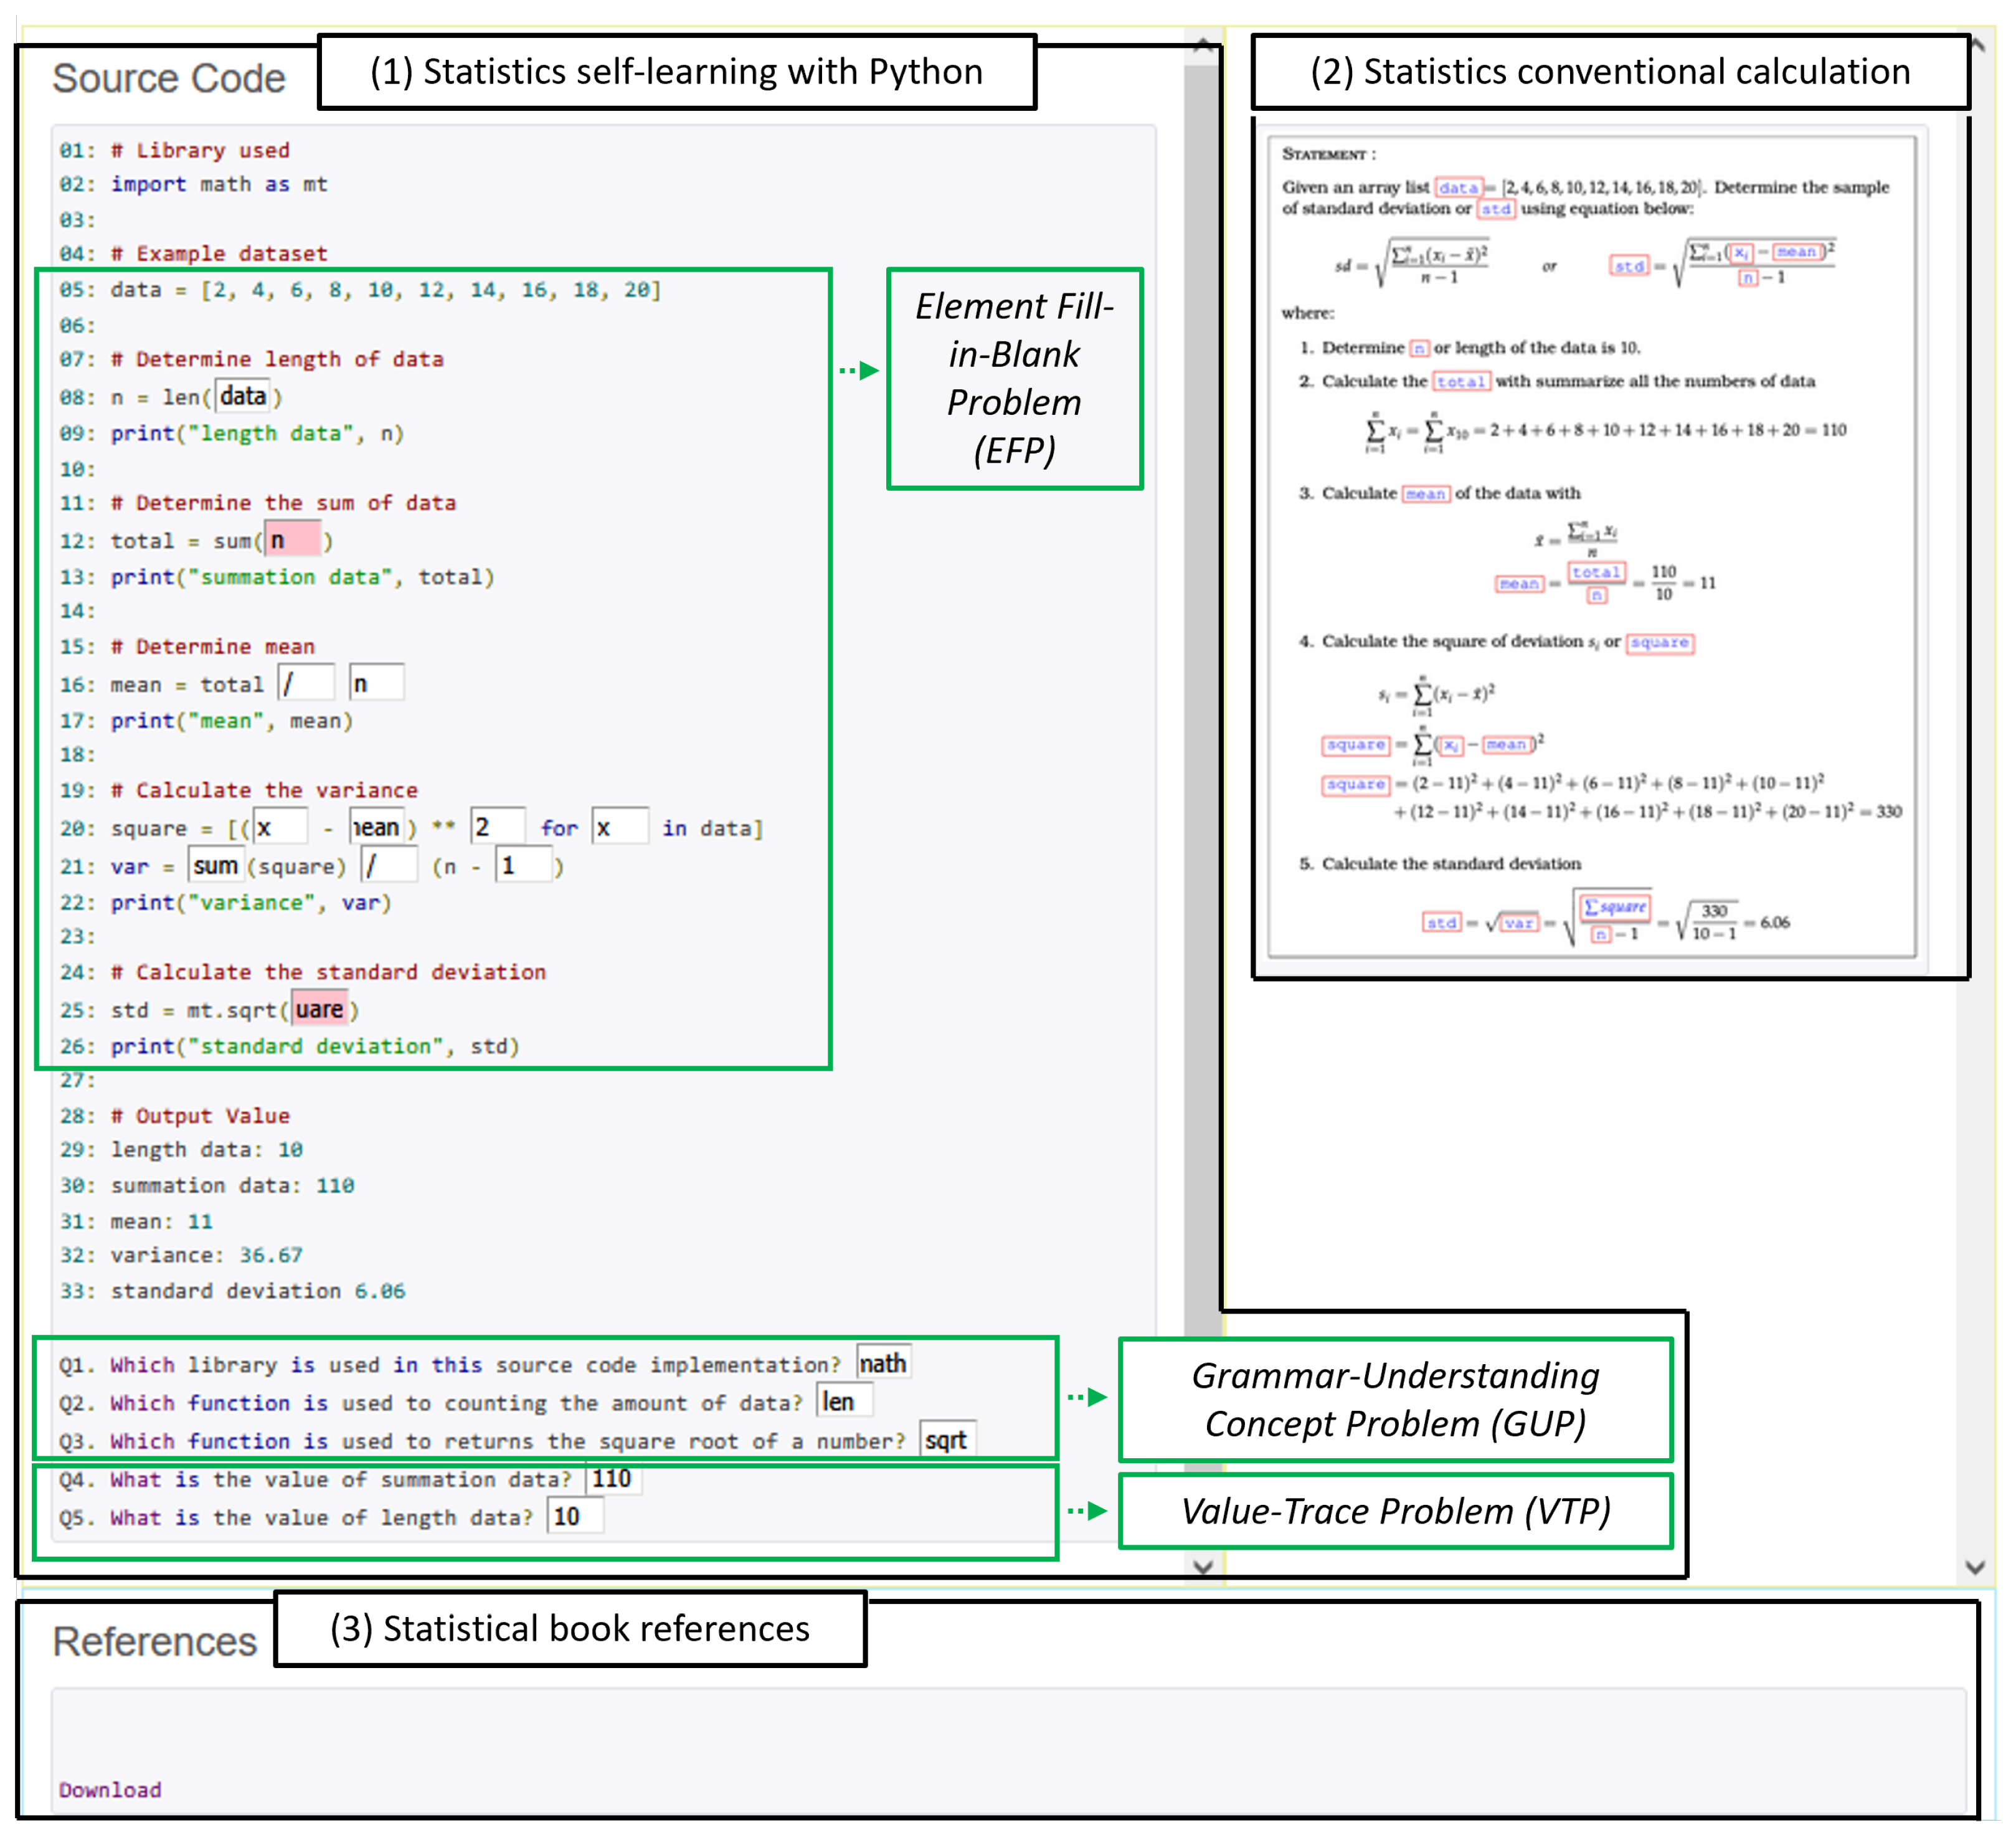
element fill-in-blank (EFP), the grammar concept understanding problem (GUP), and the value trace problem (VTP) in the Programming Learning Assistant System (PLAS) that has been developed as a self-learning platform for various programming languages. The EFP asks one to fill in the blanks for missing elements in the source code provided, the GUP asks for answers regarding grammar and libraries, and the VTP asks for answers regarding the values of important variables or the outputs while running the given code. The application results for students demonstrated that the system supports the practical learning of basic statistics topics effectively. Unfortunately, this system does not cover some required fundamental statistics topics in data science implementations.
In this paper, we present a self-learning method through Python programming that covers fundamental statistics topics for data science implementations. This study proposes the integration of the EFP, GUP, and VTP in the PLAS to assist students in improving their skills of Python programming for data science implementations. To assist students in learning statistics efficiently, reference documents on the statistics topics are also provided. This combination allows students to write codes, understand fundamental statistics concepts, and track execution flows while obtaining instant feedback, which will improve retention, understanding, and practical skills in learning statistics using Python programming.
For evaluations, we generated 22 instances using Python source codes for fundamental statistics topics and assigned them to 40 first-year undergraduate students in the two-session evaluation at UPN Veteran Jawa Timur, Indonesia. The application results of the number of submissions and the correct answer rate were analyzed using statistics analytical methods to assess the difficulty of instances and student learning performances. In addition, the final grades were compared between the students who used the proposed method and those who did not use it.
The structure of this paper is organized as follows. Section 2 presents a literature review. Section 3 describes an overview of the programming assistant learning system (PLAS) in previous studies. Section 4 presents the fundamental statistics self-learning method with Python programming. Section 5 shows the evaluation results of the proposal. Finally, Section 6 provides the conclusion and future works.

2. Literature Review

In this section, we briefly review related works in the literature. These works mainly present statistics learning with programming tools. However, many of these approaches lack comprehensive coverage of fundamental statistics topics using Python programming or do not sufficiently support self-learning with interactive exercises and immediate feedback. Our proposed method aims to fill these gaps.
In ref. [13], Holman & Hachler examine the use of Python to teach Monte Carlo simulation, focusing on a teaching strategy where the teacher asks students to complete simulation exercises in Google Spreadsheets before transitioning to Python. This approach aims to enhance the comprehension of students who are comfortable with spreadsheets but new to statistical computing. The method could enhance student learning and the transition from spreadsheets to Python proved to be effective. However, this method does not cover fundamental statistics topics using Python programming, which limits its applicability for broader data science education.
In ref. [14], Burckhardt et al. proposed a platform that utilizes R programming for learning statistics and data analysis. They emphasized fundamental concepts and introduced various types of data early on, without requiring programming prerequisites. The platform, known as the Integrated Statistics Learning Environment (ISLE), is a web-based e-learning and lesson authoring framework for teaching statistics. Nevertheless, the platform has not been evaluated regarding student feedback and learning outcomes, leaving its educational effectiveness unclear.
In ref. [15], Al-Haddad et al. explored challenges of teaching statistics courses and emphasized the importance of using technology to engage students in learning. They implemented a technology-enhanced supportive instruction (TSI) model using Microsoft Excel as a tool to teach statistics, helping students to stay engaged in both face-to-face and distance learning environments. The findings show that both teaching techniques did not differ significantly, supporting the potential usefulness of this model. Unfortunately, this system does not facilitate self-directed learning, as it requires the presence of a teacher for effective implementation.
In ref. [16], Lu demonstrated that web-based applets are usable for teaching statistics. The applets were designed for a traditional introductory statistics course, focusing on two specific areas: real-time response data and dataset generation for assignments. However, the lack of formal assessment of the applets’ effectiveness led to confusion among students on using the system and understanding core statistics concepts.
In ref. [17], Gerbing used R programming in introductory statistics courses to help students to practice applying statistical concepts in data analysis. An R package-4.1.2 was developed based on feedback from hundreds of introductory statistics students over multiple years, providing a set of functions to apply basic statistical principles using command-line R. The findings indicate that the implementation was successful in teaching and homework assignments. However, students faced challenges in obtaining timely feedback during practice, highlighting the need for immediate guidance in programming-based learning.
In ref. [18], Schawrz explored the implementation of ChatGPT 4.0 for statistical data analysis and its application in statistics education at universities. They used ChatGPT to perform statistical analyses and evaluate its capabilities and limitations. The results indicate that while ChatGPT can generate appropriate codes, it emphasizes minimal knowledge of statistics. Consequently, students still require instructor support when using this approach for learning statistics.
In ref. [19], Munthe investigated implementations of programming in mathematics classes and the types of difficulties that students experienced when working on programming tasks. A student’s main problem was converting a mathematical procedure into a programming code. The teacher mitigated this issue by simplifying the equation and converting complex mathematical symbols into programming elements that were easier to understand. This was achieved by simplifying variables and utilizing functions in programming, specifically using Python programming. This pedagogical strategy informs our method to reduce errors in student implementations.
In ref. [20], Quinones et al. demonstrated an innovative statistics tool, namely “EastApp”. This application is designed for teaching and learning descriptive statistics in university courses. It enhances the understanding of (1) statistical models through interactive graphs and data visualizers; (2) probability concepts via a probability calculator; and (3) descriptive statistics through real-time data generation and visualizers. However, the evaluation focused mainly on usability, while the educational effectiveness and learning outcomes remained underexplored.
In summary, various tools and methods have been developed to integrate programming with statistics learning, and we found that most of them have several limitations. Many focus on specific statistical topics or tools like Monte Carlo simulation, R programming, and Excel, lack comprehensive coverage of fundamental statistics using Python programming, or do not support fully self-directed learning environments. Additionally, there is often an insufficient evaluation of learning outcomes, limited immediate feedback mechanisms, and reliance on instructor presence, which constrain scalability and effectiveness.
Our proposed method provides a comprehensive self-learning framework that integrates fundamental statistics topics with Python programming through hands-on exercises on the PLAS platform. This approach supports conceptual understanding, coding skills, and timely feedback, enabling effective and autonomous learning for data science implementation.

3. Review of Previous Studies

In this section, we briefly review the Programming Learning Assistant System (PLAS) and its application to statistics learning in our previous studies.

3.1. PLAS Overview

The PLAS is a web-based platform designed for self-learning that includes popular programming languages such as C, Java, and Python. Besides for programming learning, the PLAS has been implemented in several educational disciplines, including Flutter programming, portrait drawing, and exercise performances. For teachers, it supports generating instances and analyzing students’ responses. For students, it supports practicing and using the system. Figure 1 shows an overview of the PLAS.

3.2. Exercise Problems

The PLAS offers several programming exercise problems that are varied in difficulty levels and objectives. Element fill-in-blank problems (EFPs) ask students to complete missing elements in provided source code [21]. Grammar-concept understanding problems (GUPs) ask students to answer questions about the grammar in source codes or libraries [22]. Value trace problems (VTPs) require students to determine the values of key variables or expected outputs [23]. In our preliminary application of the PLAS to statistics learning, these three exercise problems were adopted. We integrate these exercise problems for EFPs to learn syntax recognition, GUPs to understand grammatical concepts, and VTPs to learn algorithmic thinking. These gradual phases allow students to systematically improve their fundamental statistics learning competencies.

3.3. Technical Implementation of the PLAS

The PLAS platform is developed as a web-based self-learning environment running on a web browser. It has been built using HTML5, CSS, and JavaScript to provide an answer interface where students can access exercises, input responses, and receive immediate feedback. User interaction and data storage functionalities are implemented using JavaScript. This design simplifies deployments and maintenance.
The exercises are created and managed by teachers via an administrative interface that allows them to define question instances, classify them into categories, and specify correct answers along with validation rules. Upon a student submission, the system automatically compares the responses against the stored answers, highlights the incorrect inputs, and records them for further analysis.
Students interact with the PLAS platform through a web browser to solve the exercises. The platform logs the data, including the submission and answer histories, which will be used to analyze student progress and identify instance difficulties.

4. Proposal of Fundamental Statistics Self-Learning Method

In this section, we present the fundamental statistics self-learning method with Python programming.

4.1. Fundamental Statistics Topics

In the proposed method, we select fundamental statistics topics for novice students because these present essential data summarization skills and establish a predictive analysis for data-driven decision making. They include descriptive statistics, inferential statistics, probability statistics, and applied statistics. According to a recent study, they can be categorized into two groups: fundamental statistics and applied statistics [24]. In this paper, basic statistics topics cover descriptive statistics and advanced statistics topics cover probability statistics.
Descriptive statistics is used to summarize and highlight the key characteristics of a data set. It represents measures of central tendency, measures of spread, measures of position, and data distribution [25,26]. Measures of central tendency involve calculating the mean, median, and mode from the dataset. Measures of position involve the values of variance, standard deviation, coefficient of variation, and range from the dataset. Measures of position also include the position of the dataset using quartile, decile, and percentile calculations. Measures of data distribution are used to calculate skewness and kurtosis.
Probability determines the likelihood that an event will occur. The probability distribution can be categorized into discrete distributions and continuous distributions [27]. Discrete distributions include binomial distribution, multinomial distribution, geometric distribution, and Poisson distribution. Continuous distributions include normal distribution, t-distribution, exponential distribution, and chi-square distribution. Table 1 shows the selected topics in this study.

4.2. Python Codes for Statistics Topics

In the method, corresponding Python source codes need to be selected for the statistics topics. The purpose of the conversion to Python code is to explain how Python code snippets are selected and organized according to each statistics topic, as well as to provide concrete examples that form the basis for generating instances problems in the PLAS. Listing 1 displays an example source code for standard deviation.
Listing 1. Standard deviation.
1import math as mt
2
3data = [2, 4, 6, 8, 10, 12, 14, 16, 18, 20]
4
5n = len(data)
6total = sum(data)
7mean = total / n
8
9square = [(x - mean) ** 2 for x in data]
10var = sum(square) / (n - 1)
11
12std = mt.sqrt(var)
13
14print("length data", n)
15print("summation data", total)
16print("mean", mean)
17print("variance", var)
18print("standard deviation", std)
19
20length data 10
21summation data 110
22mean 11
23variance 36.67
24standard deviation 6.06

4.3. EFP Implementation

The element fill-in-the-blank problem (EFP) asks one to fill in the blank elements in the provided source code with the correct words. The EFP emphasizes the study of partial code writing. For blanks, we mainly select elements related to statistics equations. The statistics equations are formulated in the form of a mathematical algebra that includes variables, operators, constants [28], and functions [29]. The following elements in a source code can be selected for blanks in the EFP:
  • Variable is a combination of letters or letters and numbers that represents a value that can change, and is used to store values.
  • Operator is a symbol that represents certain arithmetic operations, such as + , , * , / , * * . Operators are used to manipulate values or variables, generate new values, or perform certain actions.
  • Constant is a number whose value is fixed and unchanging, such as i n t e g e r , f l o a t . In this case, the fixed numbers considered to be used include values such as p h i = 3.14 and E u l e r s   n u m b e r = 2.71 .
  • Function is an organized block of code that performs a specific task. Statistical functions that support the Python libraries, such as s t a t i s t i c s , n u m p y , s c i p y , and m a t h , are used in this case.
For example, Table 2 shows the elements that can be blanked for EFPs from the code in Listing 1.
The EFP is designed to facilitate students in partial code writing by completing critical elements directly related to statistics equations. This approach serves several key purposes, includes focusing learning on essential statistical computing components, reinforcing conceptual understanding through incremental implementation, and facilitating the transition from statistics theories to code implementations.

4.4. GUP Implementation

The grammar concept understanding problem (GUP) asks one to answer keywords, libraries, or functions in the given source code. It represents important concepts, where the questions describe their definitions. GUPs emphasize the study of grammar. A list for them needs to be made to generate GUP instances. Keywords represent elements used to define statistical equations. Libraries define Python elements used to perform certain functions in the calculation process. By reading the questions carefully and answering them, students are expected not only to learn important grammatical concepts but also to understand the meaning behind the code and the logic underlying statistics learning. Table 3 shows the elements for GUPs and their corresponding questions in the source code in Listing 1.
It is noted here that if an element has already been selected for EFP, it is not selected for GUP to avoid redundancy. The GUP is designed to ask about Python syntax through questions on usage in a statistics code. The GUP requires understanding programming concepts rather than completing codes, reinforcing both coding fundamentals and their statistics applications.

4.5. VTP Implementation

The value trace problem (VTP) requires identifying the values of important variables and output messages in the source code, emphasizing the study of code reading. Each question asks the output value of an important variable or message in the source code, as specified by the execution results. Therefore, the source code should include standard output statements corresponding to these values, allowing students to easily identify which values are being asked for in the questions. Table 4 shows the variables, their values, and questions in VTPs for the code in Listing 1.
The VTP is designed to trace variable values and code outputs. It complements the EFP and GUP by focusing specifically on runtime behaviors.

4.6. Automatic Instance Generation in EFP, GUP, and VTP

For generating instances of EFP, GUP, and VTP, we implemented a rule-based algorithm for automation to improve efficiency and maintain consistency. Algorithm 1 classifies the elements of the source code through three stages. For the EFP, the blank elements are extracted from variables, operators, constants, and functions in the source code. For the GUP, the questioned elements are selected from keywords, libraries, and functions that are not included in the EFP. For the VTP, the questioned variables are identified from the outputs.
Algorithm 1 Elements Selection
1:
procedure  RuleBasedSelection
2:
    Input: Source code
3:
    Output: Selected elements for EFP, GUP, and VTP
4:
    Initialize e f p [ ] , g u p , v t p
5:
    for each line in source code do
6:
        if line contains "=" then
7:
           Extract elements (variables, operators, constants) from equations
8:
           for each element in equations do
9:
               if element selected for EFP then
10:
                   Add element to e f p
11:
               end if
12:
           end for
13:
        end if
14:
    end for
15:
    for each keyword in keywords do
16:
        if keyword not in e f p  then
17:
           Add to g u p
18:
        end if
19:
    end for
20:
    for each function in functions do
21:
        if function not in e f p  then
22:
           Add to g u p
23:
        end if
24:
    end for
25:
    for each library in libraries do
26:
        if library not in e f p  then
27:
           Add to g u p
28:
        end if
29:
    end for
30:
    for each output in outputs do
31:
        if output has value then
32:
           Add to v t p
33:
        end if
34:
    end for
35:
    Output:  e f p , g u p , v t p
36:
end procedure
An instance can be generated through the following procedure:
  • Prepare a source code containing the Statistics topics to be studied in this instance.
  • Execute this source code and take the answer in the text file.
  • Select the elements to be used in this source code as the questions to be answered by students.
  • Make the modified source code by changing the selected elements. It should be noted that, currently, these steps are carried out automatically, selected on the basis of a rule-based selection Algorithm 1.
  • Save the modified source code in one text file. This text file is used as the input file for the answer interface program.
  • Execute the answer interface program with the input text file to generate instance files, including HTML, CSS, and JavaScript, for the answer interface on a web browser.
  • Add the screenshots for references and the textbook in the generated files.

4.7. Answer Interface

Figure 2 shows the answer interface on a web browser for solving an instance for fundamental statistics with Python programming. When the student’s answer is incorrect, the input form will turn red. Otherwise, it will remain white. Students can check their answers using this interface and submit them at any time until all answers are correct.
This design of the answer interface aims to present additional support during the learning process through manual statistics calculation features and textbook references. This feature is used to show that psychological elements such as these help students to manage their cognitive load [30] and bridge theoretical concepts with practical applications [31].

5. Evaluation and Results

In this section, we evaluate the proposal through applications to undergraduate students in UPN Veteran Jawa Timur, Indonesia.

5.1. Evaluation Setup

To evaluate the effectiveness of our proposal, we generated 22 instances that cover 14 basic statistics topics and 8 advanced ones. These instances were designed with varying levels of difficulty to examine the students’ conceptual understanding and practical skills in statistics using Python programming. In evaluations, we assigned these instances to first-year undergraduate students who enrolled in an Introductory Statistics course. The students have different levels of programming experience, and most are actually beginners. The study participants were students aged 17–18 years, consisting of 22 female and 18 male students ( N = 40 ). These students used the application to assess their learning performance, with their final grade scores being compared to those of students who did not use our proposed method. To establish a uniform baseline and minimize background bias, we provided preparatory materials on fundamental statistics concepts and relevant Python code examples prior to the evaluations.
Using statistical analysis, we evaluated instance difficulties and student learning performances. Additionally, we analyzed pre-test scores and final grades using the correlation analysis and regressions to assess the effectiveness of our proposed methods. Our results provide key findings and interpretations from the data.

5.2. Instances for Basic Statistics Topics

Table 5 presents the composition of each exercise instance for 14 basic statistics, listing the number of EFP, GUP, and VTP questions that are generated using the rule-based algorithm, as well as the total to illustrate the difficulty of instances.

5.3. Instances for Advanced Statistics Topics

Table 6 presents the composition of each exercise instance for eight advanced statistics topics, enumerating the number of EFP, GUP, and VTP questions generated by the rule-based algorithm, along with the total to illustrate the difficulty of instances.

5.4. Results of Basic Statistics Topics

First, we discuss the solution results for basic statistics topics.

5.4.1. Results of Individual Instances

Figure 3 presents the number of submissions and the average correct answer rates in 14 basic statistics instances that were assessed in both evaluation sessions. This evaluation aims to identify the difficulty of individual instances in basic statistics topics. Instance ID 7 (Range) shows the lowest number of submissions, about 1.2 attempts, which indicates the easiest instances. In contrast, instance IDs 13 and 14 (Skewness and Kurtosis) show the highest number of submissions, around 2.5 attempts, which indicates the most difficult instances. Consistent correct answer rates across all the instances suggest successful knowledge acquisitions of basic statistics topics by the students.

5.4.2. Results of Individual Student

Figure 4 presents the number of submissions and the correct answer rate across 40 students in both evaluation sessions for completing instances in the basic statistics topics. This evaluation aims to identify which students have difficulty in completing each instance. The student IDs 12, 26, and 27 show the lowest number of submissions, around 1.2 attempts, indicating that they are optimized for completing each instance. The student IDs 22, 29, 36, and 37 show the highest number of submissions, around three attempts, indicating that they need effort to complete each instance. The student ID 21 shows an increasing number of submissions in Session 2, with twice as many, indicating that they need more effort and understanding of the topics. However, the correct answer results show that all students completed each instance in basic statistics topics successfully. Overall, student learning performances were consistent, reflected in the submission completion and answer accuracy in both sessions.

5.5. Results of Advanced Statistics Topics

Next, we discuss the solution results for advanced statistics topics.

5.5.1. Results of Individual Instances

Figure 5 presents the number of submissions and the correct answer rates across eight advanced statistics instances. Instance ID 15 (Binomial Distribution) shows the lowest number of submissions, around 2.3 attempts, which indicates the easiest instances. Instance ID 22 (Chi-Square Distribution) shows the highest number of submissions, around 4.8 attempts, indicating the most difficult instances. ID 20 (t-Distribution) and ID 22 (Chi-Square Distribution) demonstrated consistent improvements in both sessions. They confirm that students successfully solved advanced statistics topics.

5.5.2. Results of Individual Students

Figure 6 show the number of submissions and the correct answer rate across 40 students in both evaluation sessions for completing the instances in the advanced statistics topics. Three student IDs, 14, 23, and 30, show exceptional consistency, with the lowest number of submissions and the highest correct answer rates across sessions. Conversely, student ID 4 required approximately eight attempts in Session 2, the highest number of submissions, while declining in their correct answer rate, indicating that they need further substantial efforts. Overall, students improved their learning performances, evidenced by increased correct answer rates in Session 2, while maintaining consistency in the number of submissions.

5.6. Statistical Analysis Results

Statistical analysis, including descriptive statistics, correlation analysis, and multiple linear regression, was conducted to examine five key variables, such as the number of questions, number of submissions, correct answer rates, pre-test scores, and final grades. This methodological approach enabled an interpretation of the results and yielded insights from the calculation findings.

5.6.1. Summary of Results

Table 7 shows the average and standard deviation of a number of submissions and correct answer rates of the student results for both topics across two sessions. The instances for basic statistics topics were easy for them, where the students solved all of them with fewer than two answer submissions on average. The instances for advanced statistics were more difficult than for basic statistics topics but were not too difficult, where the students solved more than 98% of them, with about 3.3 answer submissions on average. These results support that our proposal achieves the design goal of providing exercise problems for novice statistics learners.

5.6.2. Analysis of Instances Difficulty and Students’ Ability

To assess instance difficulty, we analyzed the relationship between the number of submissions and the number of questions using Pearson’s correlation based on the variables in Table 8. The normality test assumes that both variables are approximately normally distributed, as confirmed by Shapiro–Wilk tests  ρ > 0.05 . The correlation results revealed a weak positive correlation, with r = 0.22 , ρ = 0.32 , indicating that while instances with more questions tend to require marginally more submissions, the number of questions explains only 4.8 % of the variation in submissions R 2 = 0.048 . This suggests that other unmeasured factors likely influence perceived difficulty.
To examine the relationship between pre-test scores and average correct answer rates, we conducted a Pearson correlation analysis, which assumes the normally distributed data presented in Table 9. We verified this assumption using Shapiro–Wilk tests by ρ > 0.05 , confirming that the variables followed a normal distribution. The correlation analysis revealed a negligible positive correlation with r = 0.109 , ρ = 0.506 , with pre-test scores explaining only 1.2 % of the variance in correct answer rates by R 2 = 0.012 . Although the coefficient suggests that higher pre-test scores weakly correlate with slightly higher correct answer rates, the effect is practically insignificant. In other words, students’ initial knowledge levels did not meaningfully predict their accuracy in subsequent tasks.
The results of these two analyses indicate that the instance difficulty and the student’s ability contributed little to the differences in the number of submissions and correct answer rate. Submission and correct answer rate variability may also be influenced by other factors, such as individualized learning strategies, motivations, or experiences with the PLAS interface.

5.6.3. Analysis of Question Difficulty, Student Effort, and Answer Accuracy

Table 10 shows the number of questions, average number of submissions, and average correct answer rate to then apply correlation analysis and multiple linear regression models. Prior to analysis, we verified the statistical assumptions using Shapiro–Wilk tests, which confirmed that all variables were normally distributed with ρ > 0.05 .
Table 11 shows the correlation analysis results. The correlation analysis showed a weak positive relationship between the number of questions and the average answer submissions, with r = 0.217 , indicating that more questions tend to ask students to try more times, although the effect is relatively small. The correlation between the number of questions and the accuracy was also very low, with r = 0.117 . Meanwhile, the strong negative correlation between the average submissions and the average answer accuracy, with r = 0.796 , confirms that the correct rate decreases if students make more submissions.
The results of the multiple linear regression provide a quantitative perspective model:
y ^ = 1.0092 + 0.000358 X 1 0.008156 X 2
with R 2 = 0.72 . This means that 72% of the variation in the average correct answer rate can be explained by the combination of the number of questions ( X 1 ) and the average number of answer submissions ( X 2 ). The positive coefficient on X 1 indicates that more questions slightly increase the predicted accuracy. The negative coefficient on X 2 indicates that any increase in the number of answer submissions tends to decrease the correct answer rate. Figure 7 illustrates the multiple linear regression results.

5.6.4. Comparison of Final Grades

To verify the effectiveness of the use of the proposal in the fundamental statistics course in UPN Veteran Jawa Timur, Indonesia, we compare the final grades of the students who solved it with those of the students who did not. For this course, the students are divided into two classes with 40 students for each, such that their average academic performances are almost equal. For Class 1, the students were assigned the proposed instances, whereas for Class 2, the students were not.
Table 12 shows the average and the standard deviation of the final grades in each class. It suggests that the students in Class 1 achieved higher and more consistent final grades than the students in Class 2. When the independent sample t-test is applied for them, p = 0.003 < 0.05 is obtained, which rejects the null hypothesis at 5% and concludes that the average final grade differs significantly between the two classes. The students who solved the proposal achieved higher final grades than the students who did not solve it. Thus, the effectiveness of the proposal was confirmed.
Figure 8 compares the final course grades between Class 1 (used the proposed method) and Class 2 (did not use it). Class 1 had the higher average grade, with a smaller variation than Class 2. The t-test gave a ρ -value of 0.0029 , suggesting a statistically significant difference. The effect size or Cohen’s d score was 0.697 , which is a medium effect. Thus, the effectiveness of the proposal in terms of improving final grades is confirmed.

5.7. Discussion

Although the evaluation with 40 first-year undergraduate students demonstrated the effectiveness of our proposal, some limitations must be acknowledged.
The participants in this evaluation consisted of 40 first-year undergraduates from a single institution, which may limit the generalizability of the results to broader populations, such as senior students or learners from other disciplines with different backgrounds in statistics and programming. The assessments of a variety of learners and more complex or specialized statistical topics will be necessary. The complexity of instances was measured based on the number of questions alone, without accounting for the relative difficulty or weighting of each question type. Other influential factors such as the students’ prior programming experience, motivation, or engagement were not quantitatively measured.
Despite these limitations, the current study provides preliminary evidence supporting the effectiveness of the proposed integrated self-learning approach. This research builds a foundation of basic statistical knowledge, including descriptive statistics and statistical probability, as the fundamental for advanced topics in data science statistics, such as machine learning algorithms and spatial analysis.

6. Conclusions

This paper introduces a self-learning approach for fundamental statistics using Python programming, implemented on the PLAS platform. It integrates three exercise types: element fill-in-blank problems (EFPs), grammar-concept understanding problems (GUPs), and value trace problems (VTPs).
The evaluation results found that the correct answer rate was over 95%, the course final grades were higher for the students using the proposal than the others, and a strong negative correlation was observed between the average submissions and the average answer accuracy.
Future works will expand the exercise repositories to them, compare the proposal with other teaching methods, and evaluate long-term retention and real-world skill transfer. To support wider adoptions, the PLAS can be easily integrated into Jupyter courses and Docker deployments, and is adaptable through configurable difficulty levels, making it suitable for use in various educational environments.

Supplementary Materials

The following supporting information can be downloaded at: https://github.com/prismahardiards/splas/tree/master/input%20source%20code (accessed on 8 July 2025).

Author Contributions

Conceptualization, P.A.R. and N.F.; methodology, P.A.R. and N.F.; application tools, P.A.R. and M.M.; visualization, K.C.B. and M.M.; implementation, P.A.R., D.A.P. and A.T.D.; writing—original draft, P.A.R.; writing—review and editing, N.F.; supervision, N.F. All authors have read and agreed to the published version of the manuscript.

Funding

This research received no external funding.

Institutional Review Board Statement

This study was conducted following the ethical guidelines of UPN Veteran Jawa Timur. Formal approval from the Institutional Review Board was not required because the research involved normal educational practices and anonymized academic performance data, posing no risks to participants.

Informed Consent Statement

Informed consent was implied through voluntary participation in the programming exercises. All participants were informed that their anonymized performance data would be used for research purposes.

Data Availability Statement

Data is contained within the article (and Supplementary Materials).

Acknowledgments

We would like to thank all the colleagues in the Distributing System Laboratory at Okayama University and the Department of Data Science at the Universitas Pembangunan National Veteran Jawa Timur who participated in this study.

Conflicts of Interest

The authors declare no conflicts of interest.

References

  1. Weihs, C.; Ickstadt, K. Data Science: The impact of statistics. Int. J. Data Sci. Anal. 2018, 6, 189–194. [Google Scholar] [CrossRef]
  2. Pallavi, G.; Nitin, V.T. The Impact and Importance of Statistics in Data Science. Int. J. Comput. Appl. 2020, 176, 10–14. [Google Scholar] [CrossRef]
  3. Ranjan, M.; Barot, K.; Khairnar, V.; Rawal, V.; Pimpalgaonkar, A.; Saxena, S.; Sattar, A. Python: Empowering Data Science Applications and Research. J. Oper. Syst. Dev. Trends 2023, 10, 27–33. [Google Scholar] [CrossRef]
  4. Siva, P.; Yamaganti, D.; Rohita, D.; Sikharam, U. A Review on Python for Data Science, Machine Learning and IOT. Int. J. Sci. Eng. Res. 2023, 10, 851–858. [Google Scholar] [CrossRef]
  5. Yadav, N.; DeBello, J.E. Recommended Practices for Python Pedagogy in Graduate Data Science Courses. In Proceedings of the 2019 IEEE Frontiers in Education Conference (FIE), Covington, KY, USA, 16–19 October 2019; pp. 1–7. [Google Scholar] [CrossRef]
  6. Kabir, M.A.; Ahmed, F.; Islam, M.M.; Ahmed, M.R. Python For Data Analytics: A Systematic Literature Review Of Tools, Techniques, And Applications. Acad. J. Sci. Technol. Eng. Math. Educ. 2024, 4, 134–154. [Google Scholar] [CrossRef]
  7. Donald, A.; Aditya, T.; Srinivas, T.A. A Short Review of Python Libraries and Data Science Tools. South Asian Res. J. Eng. Technol. 2022, 5, 1–5. [Google Scholar] [CrossRef]
  8. Yavuz Temel, G.; Barenthien, J.; Padubrin, T. Using Jupyter Notebooks as digital assessment tools: An empirical examination of student teachers’ attitudes and skills towards digital assessment. Educ. Inf. Technol. 2025, 30, 1–30. [Google Scholar] [CrossRef]
  9. Avila-Garzon, C.; Bacca-Acosta, J. Curriculum, Pedagogy, and Teaching/Learning Strategies in Data Science Education. Educ. Sci. 2025, 15, 186. [Google Scholar] [CrossRef]
  10. Tufino, E.; Oss, S.; Alemani, M. Integrating Python data analysis in an existing introductory laboratory course. Eur. J. Phys. 2024, 45, 045707. [Google Scholar] [CrossRef]
  11. Duda, M.; Sovacool, K.; Farzaneh, N.; Nguyen, V.; Haynes, S.; Falk, H.; Furman, K.; Walker, L.; Diao, R.; Oneka, M.; et al. Teaching Python for Data Science: Collaborative development of a modular interactive curriculum. J. Open Source Educ. 2021, 4, 138. [Google Scholar] [CrossRef]
  12. Riyantoko, P.; Funabiki, N.; Wai, K.; Aung, S.; Muhaimin, A.; Trimono. A Proposal of Python Programming Exercise Problems for Basic Statistics Learning. In Proceedings of the 2024 Seventh International Conference on Vocational Education and Electrical Engineering (ICVEE), Malang, Indonesia, 30–31 October 2024; pp. 289–295. [Google Scholar] [CrossRef]
  13. Holman, J.O.; Hacherl, A. Teaching Monte Carlo Simulation with Python. J. Stat. Data Sci. Educ. 2023, 31, 33–44. [Google Scholar] [CrossRef]
  14. Burckhardt, P.; Nugent, R.; Genovese, C.R. Teaching Statistical Concepts and Modern Data Analysis with a Computing-Integrated Learning Environment. J. Stat. Data Sci. Educ. 2021, 29, S61–S73. [Google Scholar] [CrossRef]
  15. Al-Haddad, S.; Chick, N.; Safi, F. Teaching Statistics: A Technology-Enhanced Supportive Instruction (TSI) Model During the Covid-19 Pandemic and Beyond. J. Stat. Data Sci. Educ. 2024, 32, 129–142. [Google Scholar] [CrossRef]
  16. Lu, Y. Web-Based Applets for Facilitating Simulations and Generating Randomized Datasets for Teaching Statistics. J. Stat. Data Sci. Educ. 2023, 31, 264–272. [Google Scholar] [CrossRef]
  17. Gerbing, W.D. Enhancement of the Command-Line Environment for use in the Introductory Statistics Course and Beyond. J. Stat. Data Sci. Educ. 2021, 29, 251–266. [Google Scholar] [CrossRef]
  18. Schwarz, J. The use of generative AI in statistical data analysis and its impact on teaching statistics at universities of applied sciences. Teach. Stat. 2025, 47, 118–128. [Google Scholar] [CrossRef]
  19. Munthe, M. Programming in the mathematics classroom—Adversities students encounter. Acta Didact. Nord. 2022, 16, 22 sider. [Google Scholar] [CrossRef]
  20. Quiñones, D.; Ruz, F.; Díaz-Arancibia, J.; Paz, F.; Osega, J.; Rojas, L.F. Innovating Statistics Education: The Design of a Novel App Using Design Thinking. Appl. Sci. 2024, 14, 8515. [Google Scholar] [CrossRef]
  21. Hnin, H.W.; Zaw, K.K. Element Fill-in-Blank Problems in Python Programming Learning Assistant System. In Proceedings of the 2020 International Conference on Advanced Information Technologies (ICAIT), Yangon, Myanmar, 4–5 November 2020; pp. 88–93. [Google Scholar] [CrossRef]
  22. Htet, E.E.; Shwe, S.H.; Aung, S.T.; Funabiki, N.; Fajrianti, E.D.; Sukaridhoto, S. A Study of Grammar-Concept Understanding Problem for Python Programming Learning. In Proceedings of the 2022 IEEE 4th Global Conference on Life Sciences and Technologies (LifeTech), Osaka, Japan, 7–9 March 2022; pp. 241–242. [Google Scholar] [CrossRef]
  23. Shwe, S.; Funabiki, N.; Syaifudin, Y.; Tar, P.; Kyaw, H.H.; Hnin Aye, T.; Kao, W.C.; Min, N.; Myint, T.; Htet, E. Value trace problems with assisting references for Python programming self-study. Int. J. Web Inf. Syst. 2021; ahead-of-print. [Google Scholar] [CrossRef]
  24. Muhammed, S.; Eltahir, O.; Khan, Z.; Ebert, J. Mastering Statistics: A Journey from Data Science to Doctoral Excellence. Int. J. Innov. Sci. Res. Rev. 2025, 7, 7613–7621. [Google Scholar]
  25. Sial, M.; Abid, A. Measurement of Central Tendencies. J. Res. Appl. Sci. Biotechnol. 2023, 2, 212–214. [Google Scholar] [CrossRef]
  26. Rakrak, M. Exploring Variability in Data: The Role of Range, Variance, and Standard Deviation. Int. J. Multidiscip. Res. Anal. 2025, 8, 1327–1331. [Google Scholar] [CrossRef]
  27. Viti, A.; Terzi, A.; Bertolaccini, L. A practical overview on probability distributions. J. Thorac. Dis. 2015, 7, E03–E07. [Google Scholar] [CrossRef]
  28. Munthe, M.; Naalsund, M. Designing Mathematical Programming Problems. Digit. Exp. Math. Educ. 2024, 10, 260–286. [Google Scholar] [CrossRef]
  29. Ross, M.; Church, K.; Rolon-Mérette, D. Tutorial 3: Introduction to Functions and Libraries in Python. Quant. Methods Psychol. 2021, 17, S13–S20. [Google Scholar] [CrossRef]
  30. Yadav, V. An Introduction to Cognitive Load Theory; ABS Book: Delhi, India, 2023; pp. 30–45. [Google Scholar]
  31. Mayer, R. The Past, Present, and Future of the Cognitive Theory of Multimedia Learning. Educ. Psychol. Rev. 2024, 36, 8. [Google Scholar] [CrossRef]
Figure 1. Overview of PLAS.
Information 16 00607 g001
Figure 2. Answer interface.
Information 16 00607 g002
Figure 3. 
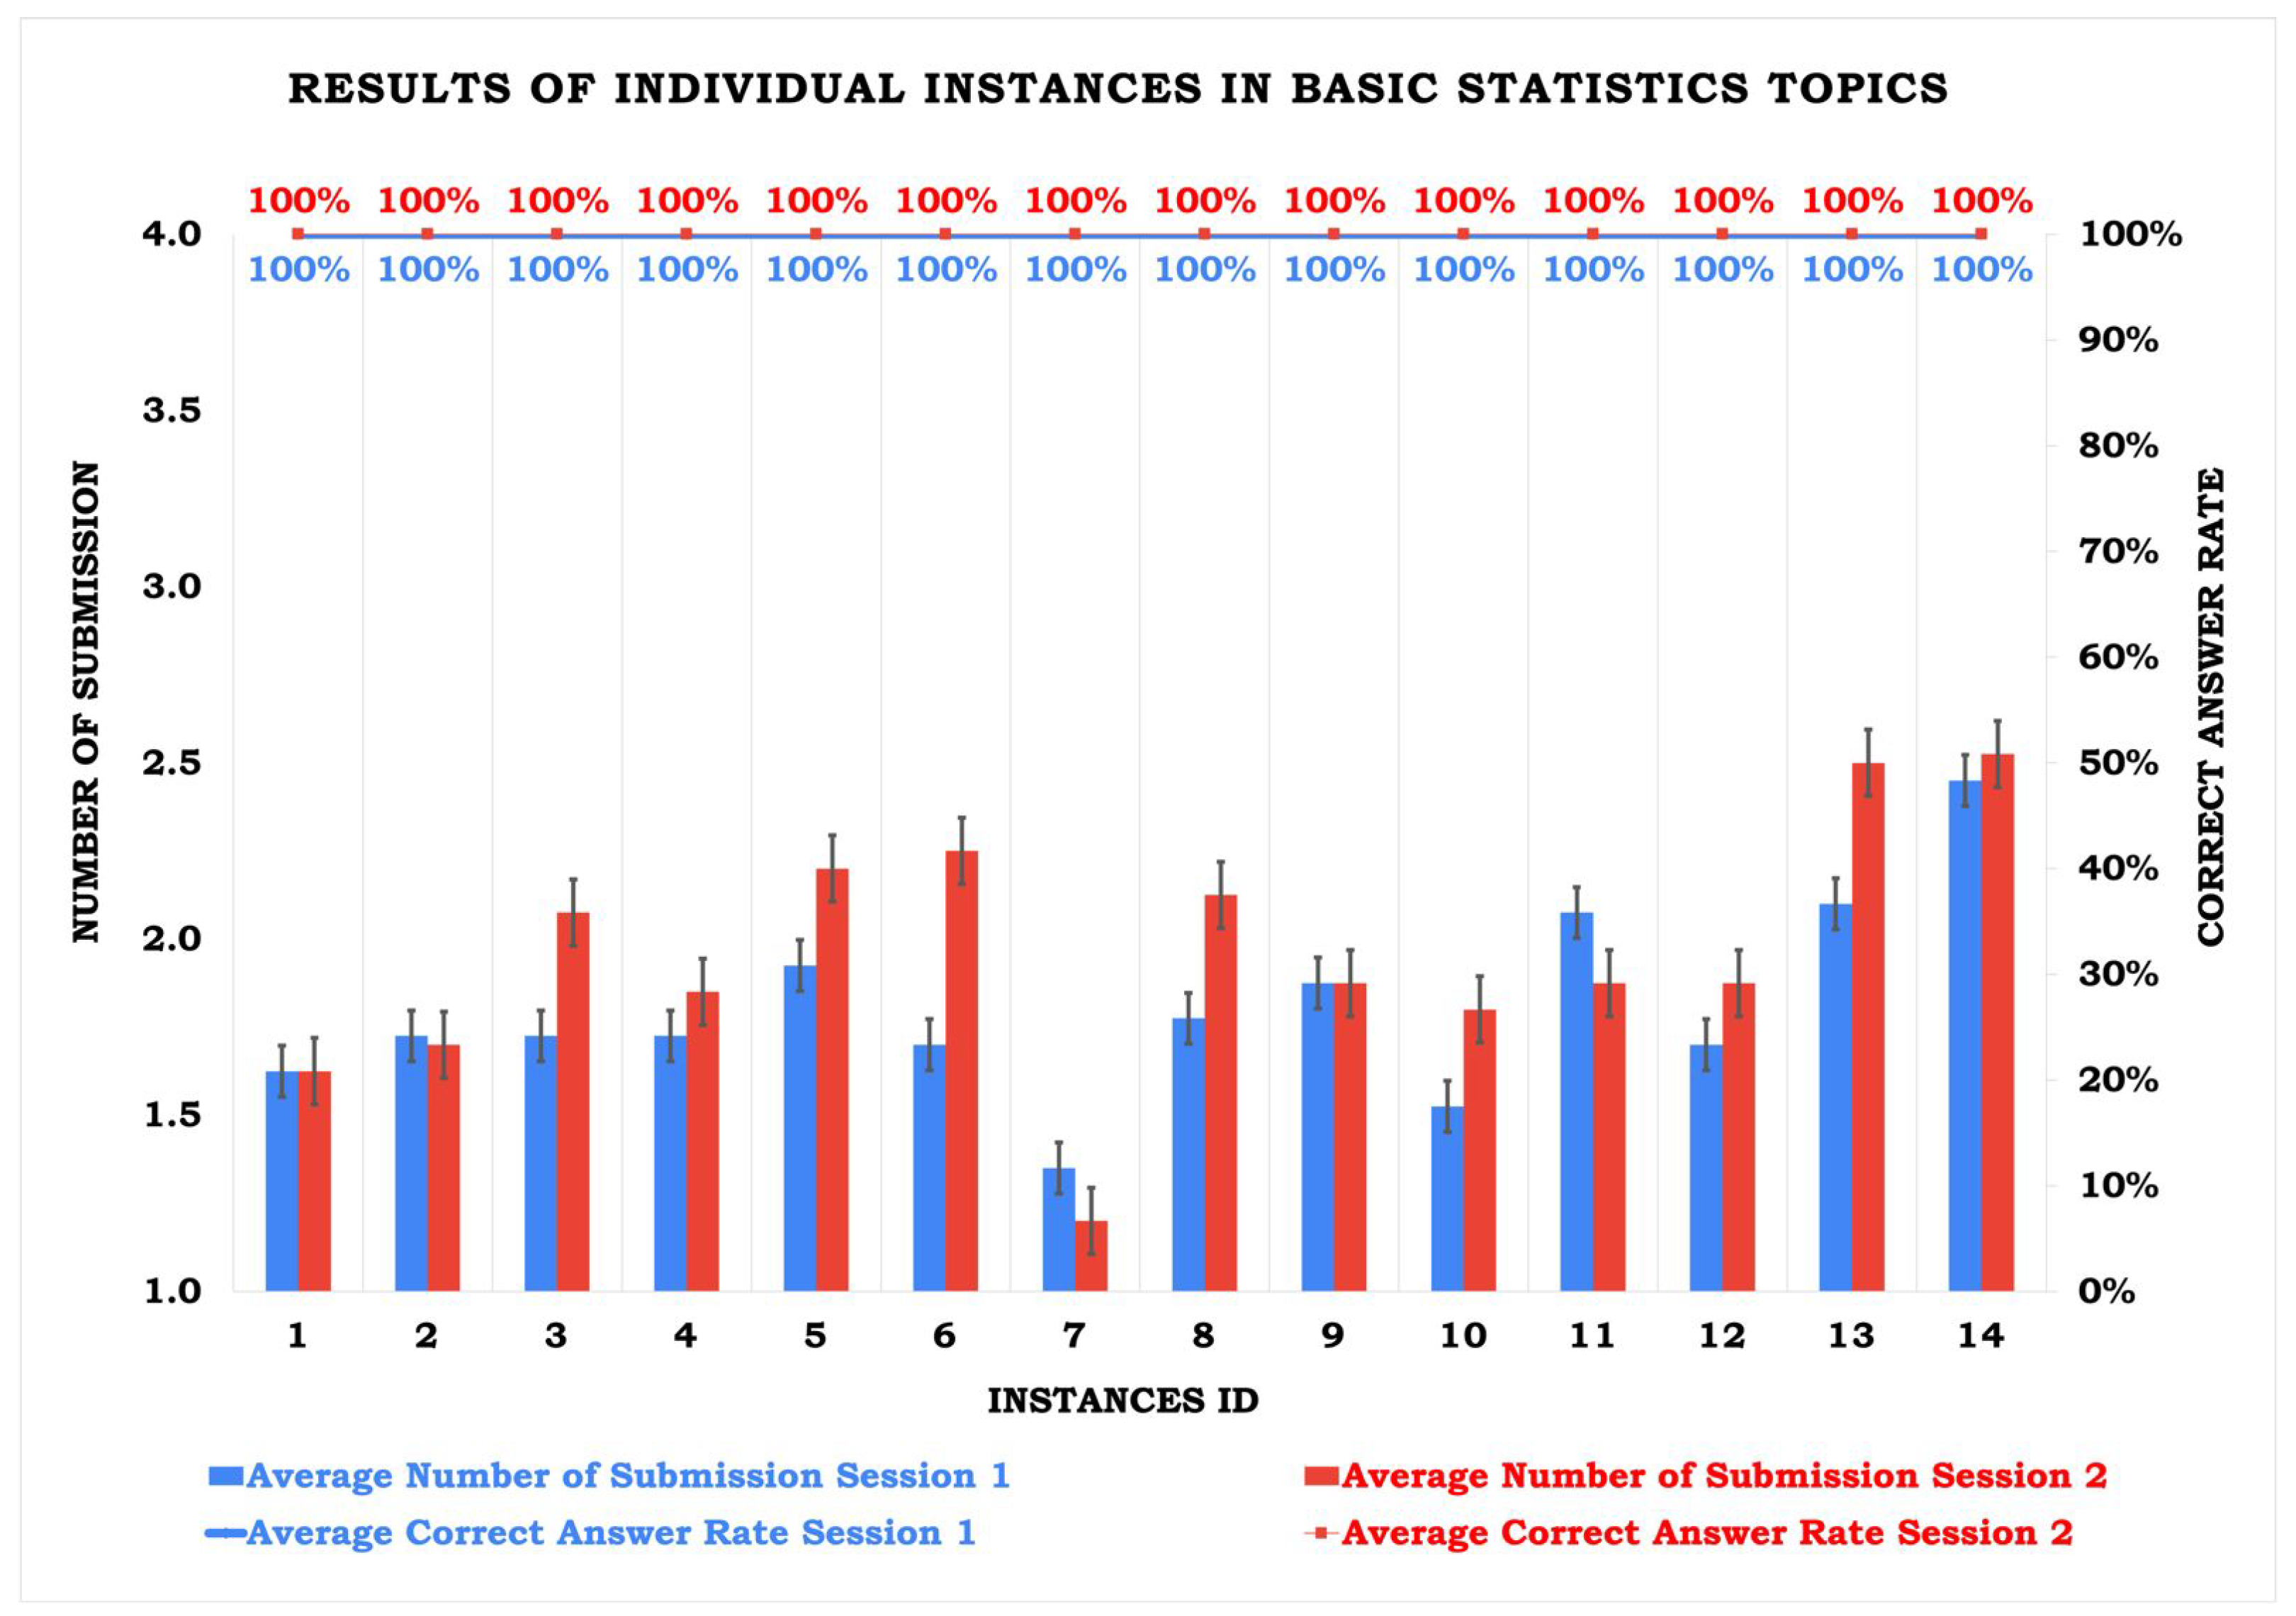
Results of individual instances in basic statistics topics.
Information 16 00607 g003
Figure 4. 
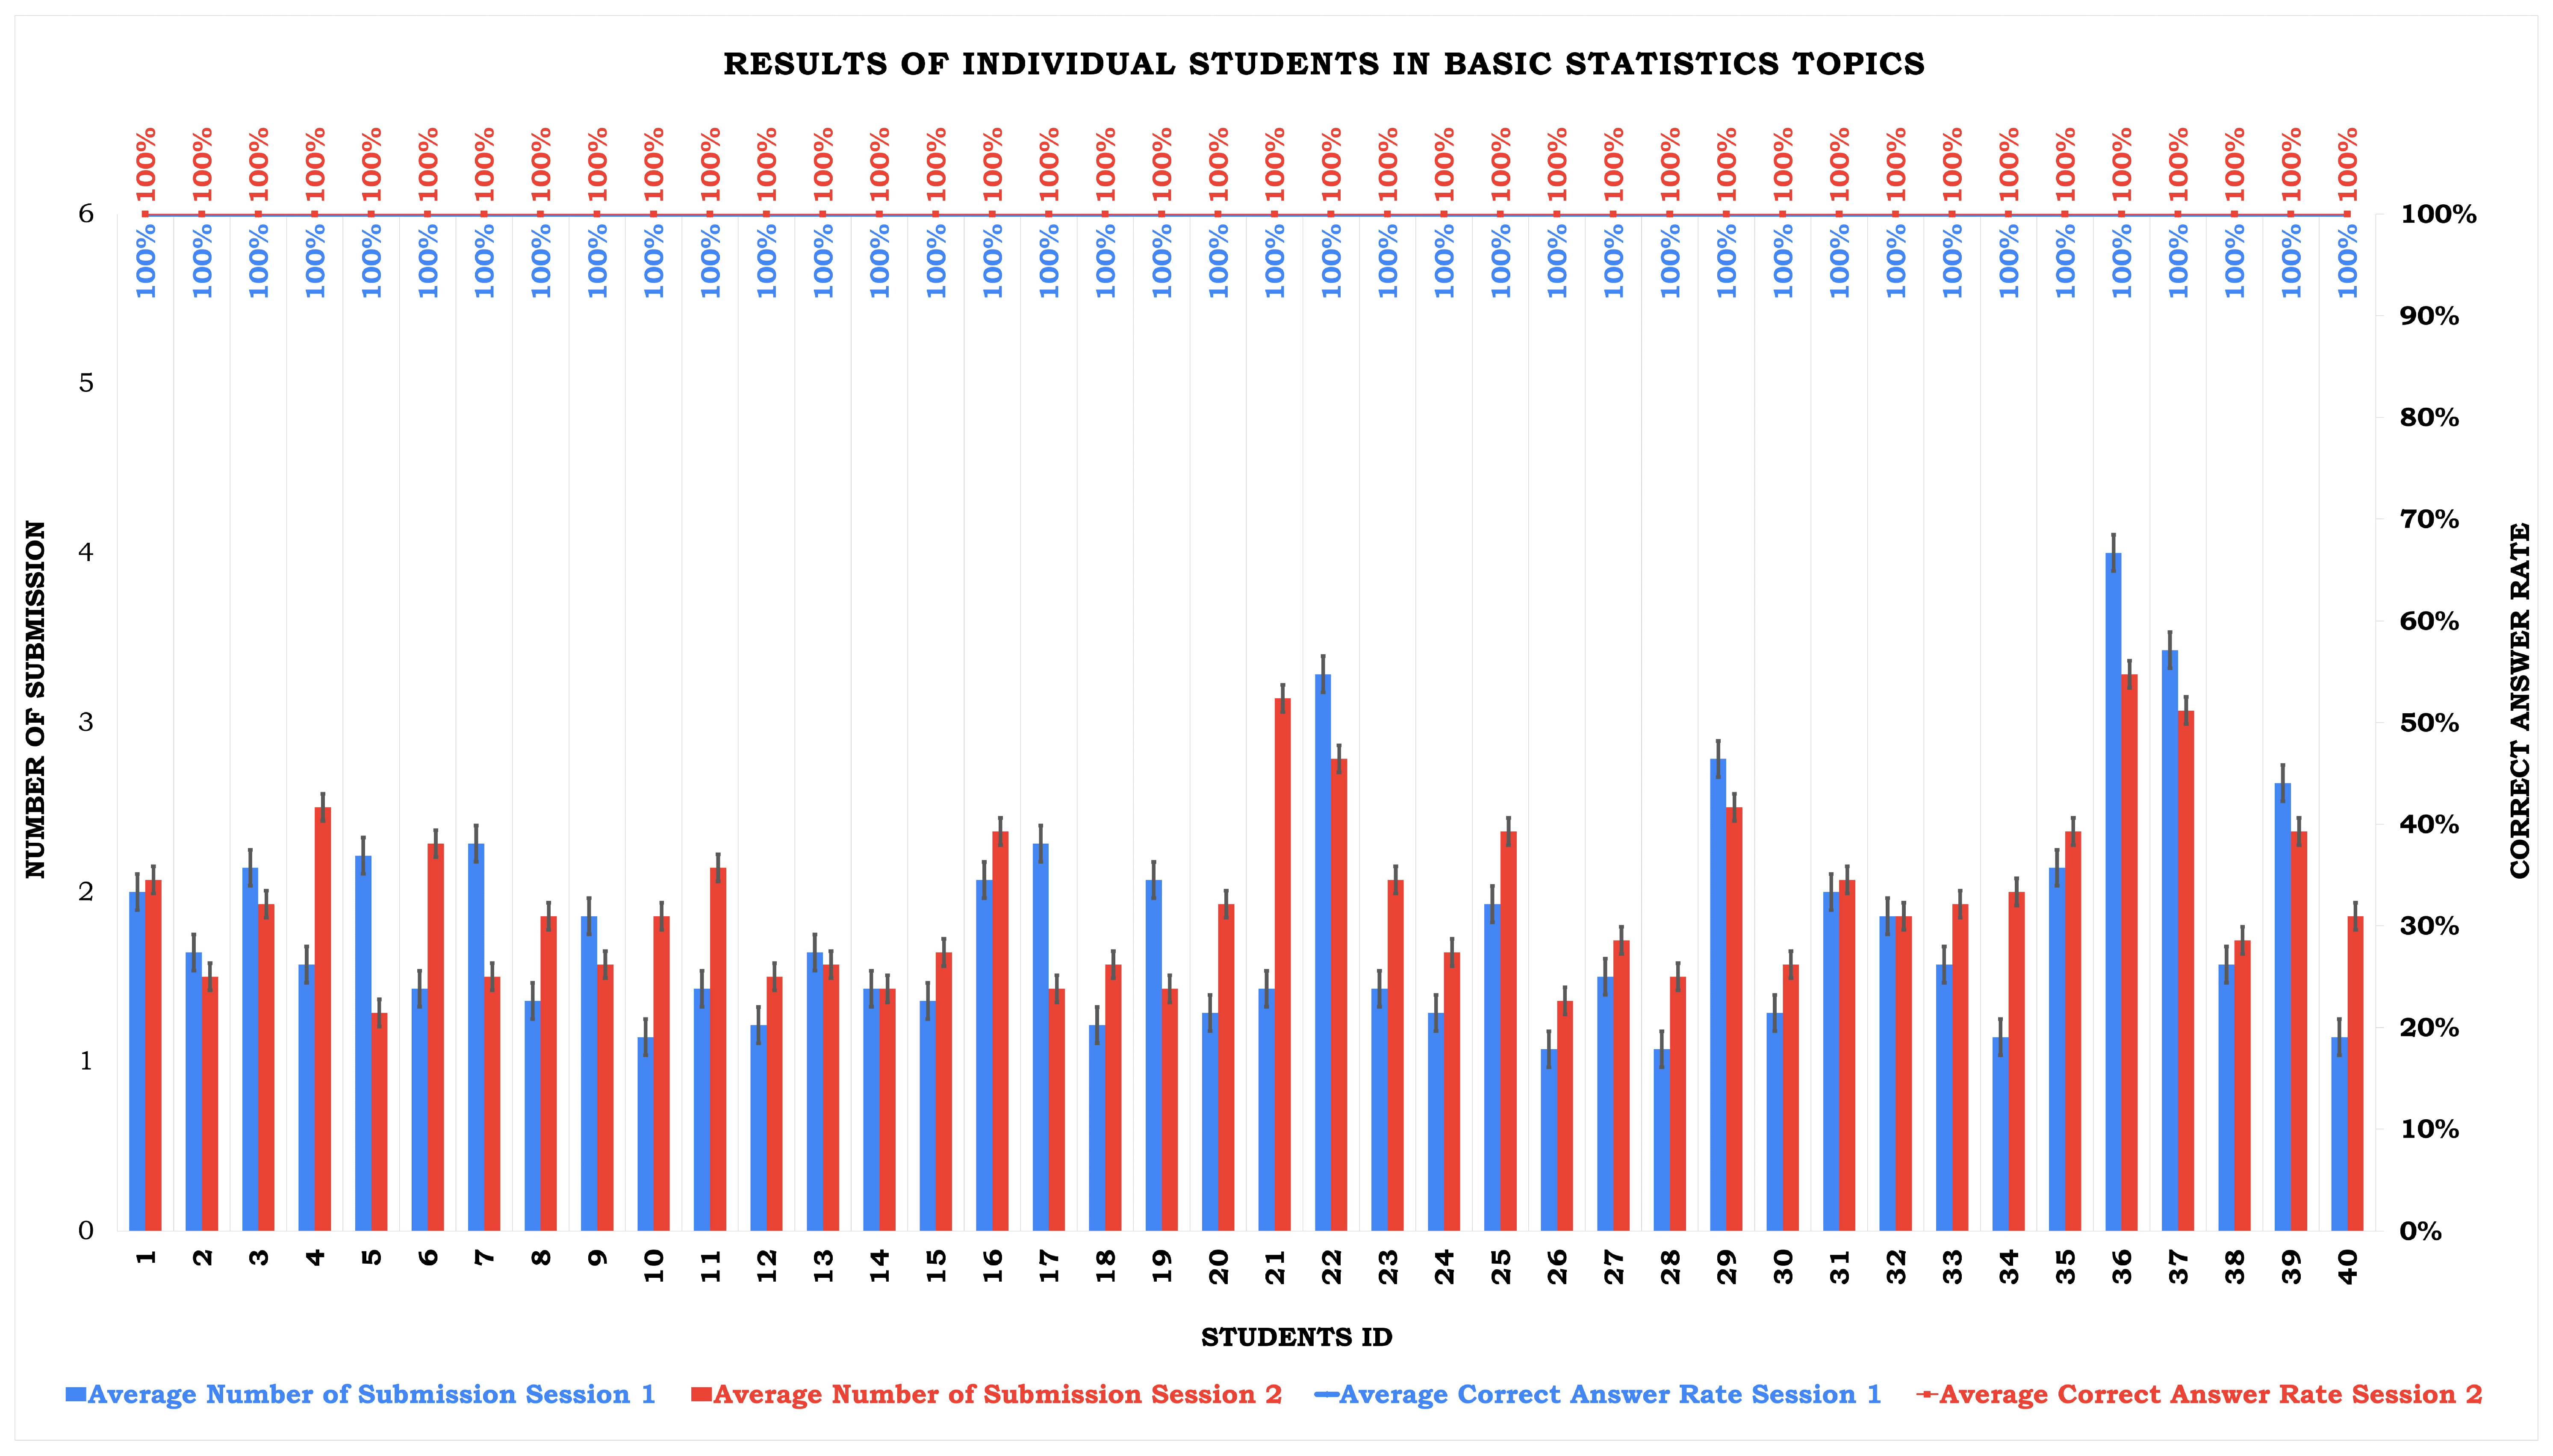
Results of individual students in basic statistics topics.
Information 16 00607 g004
Figure 5. 
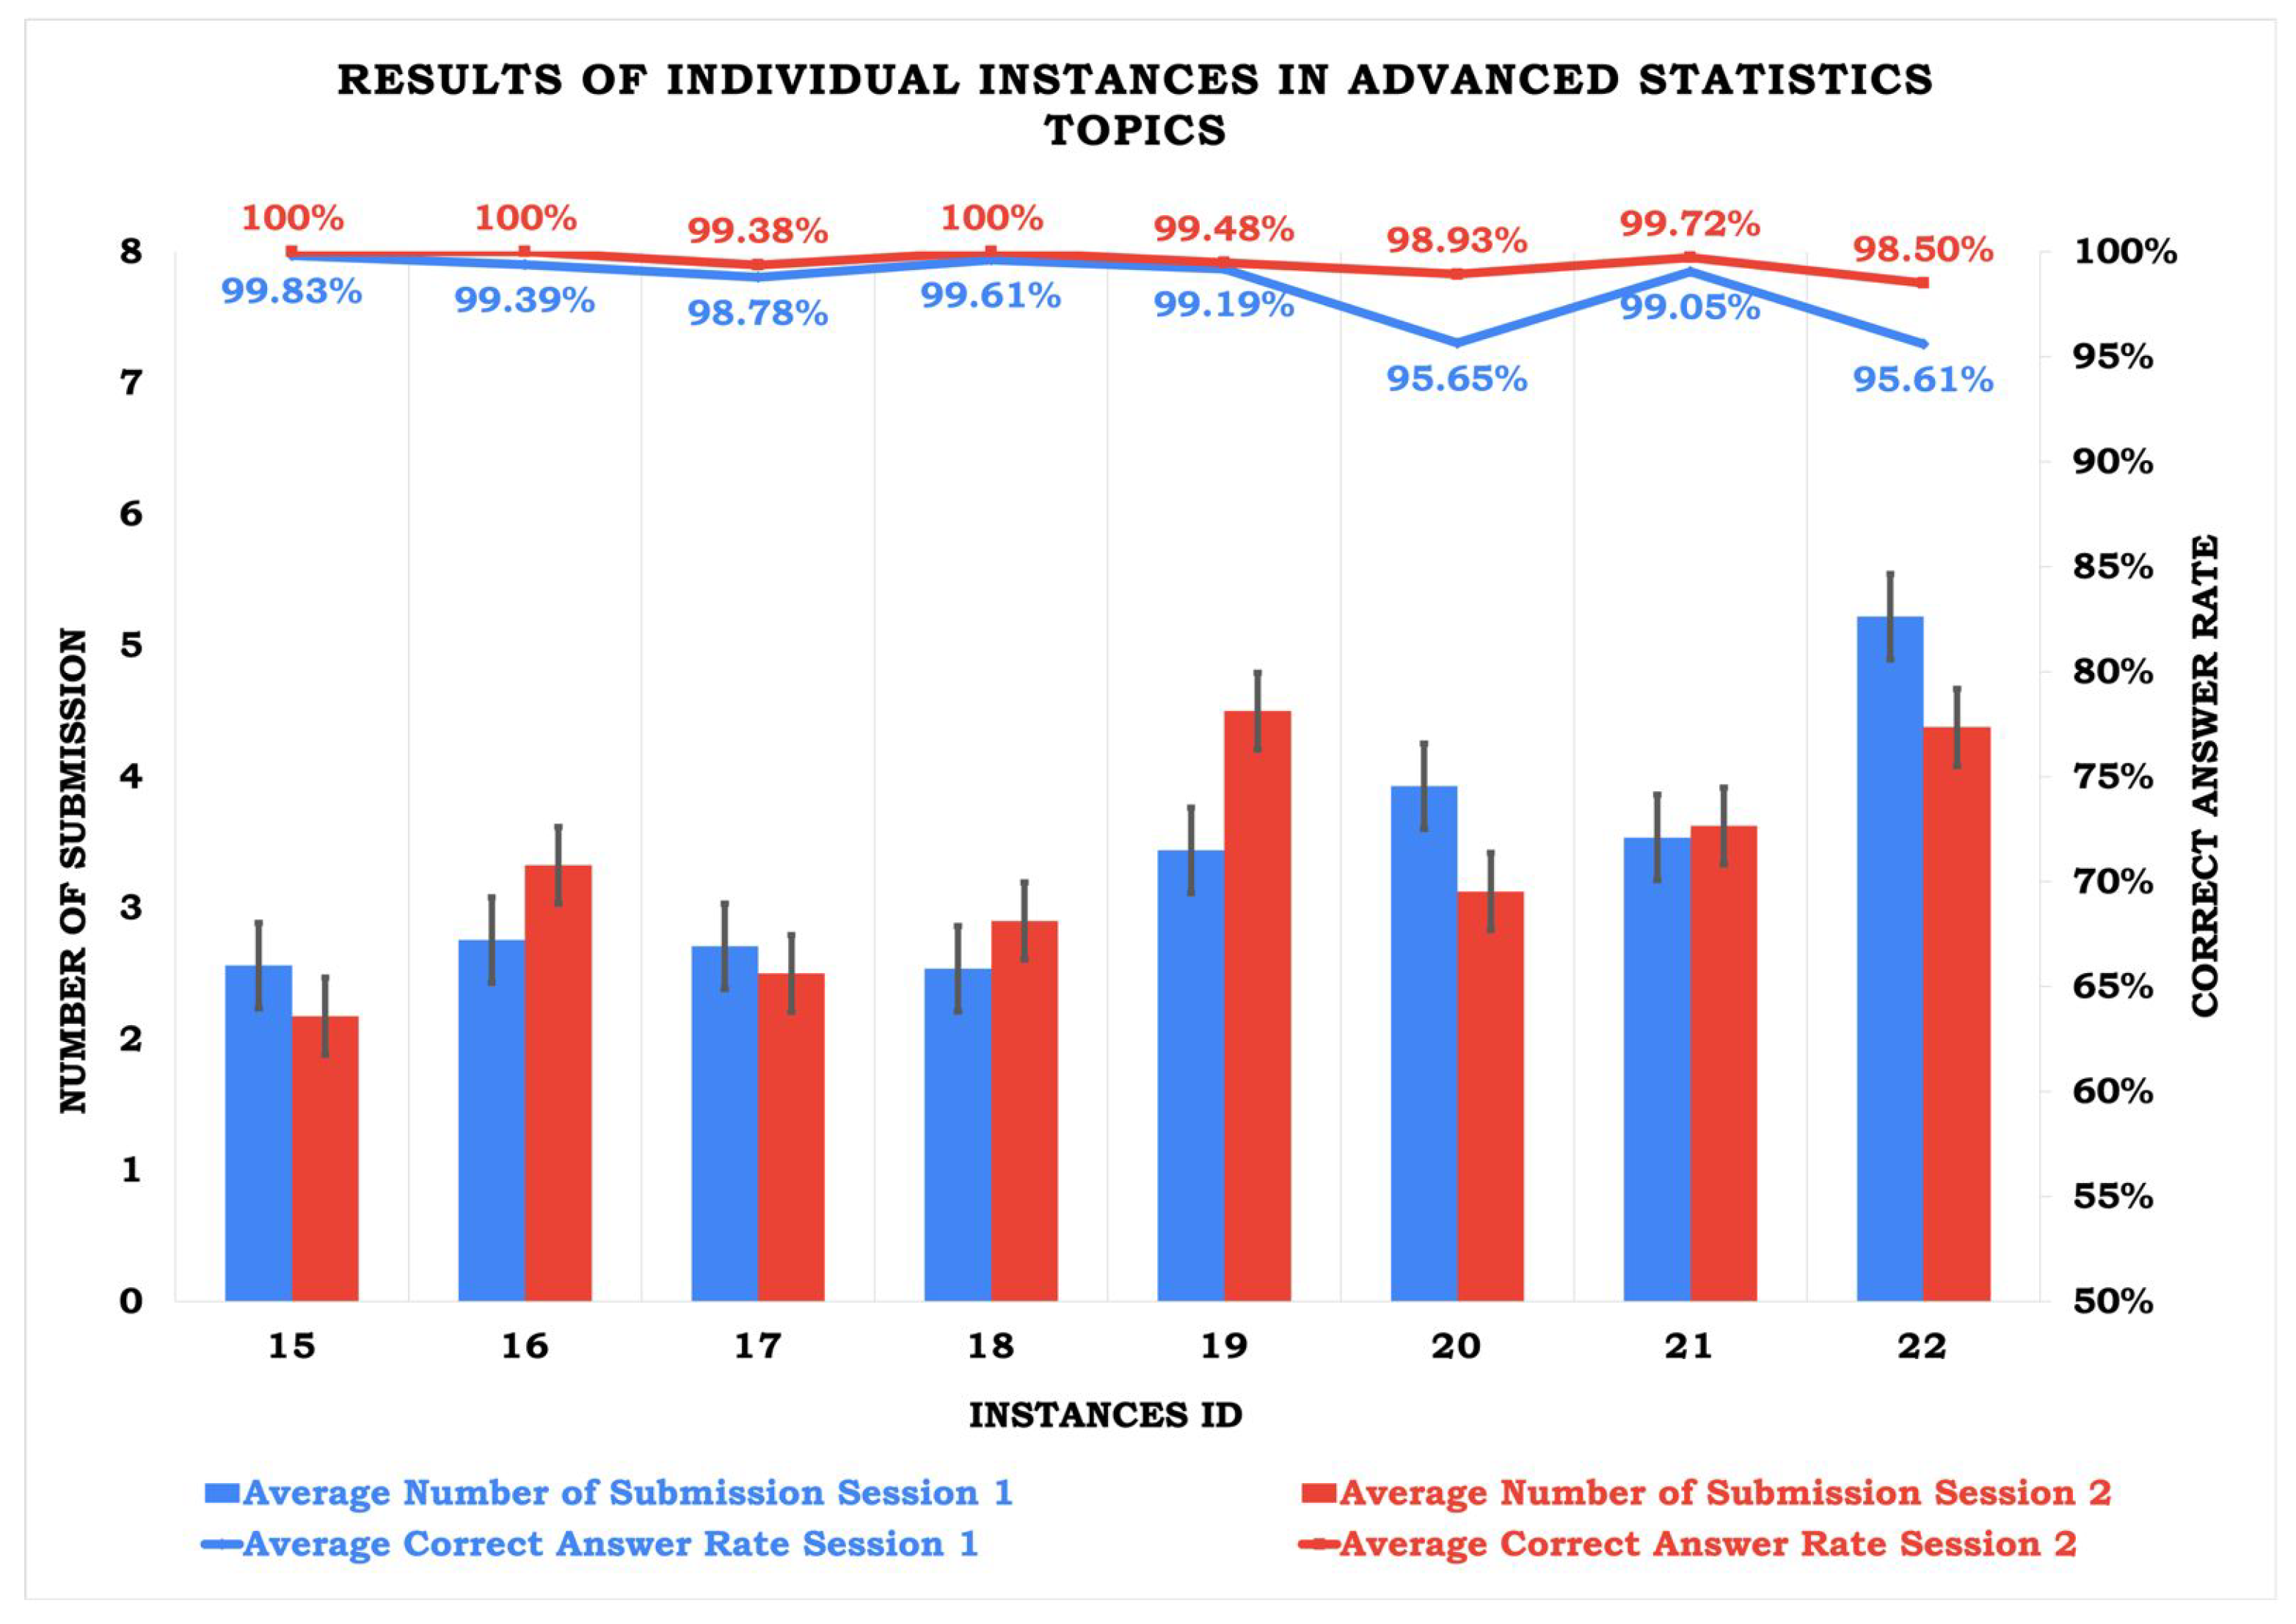
Results of individual instances in advanced statistics topics.
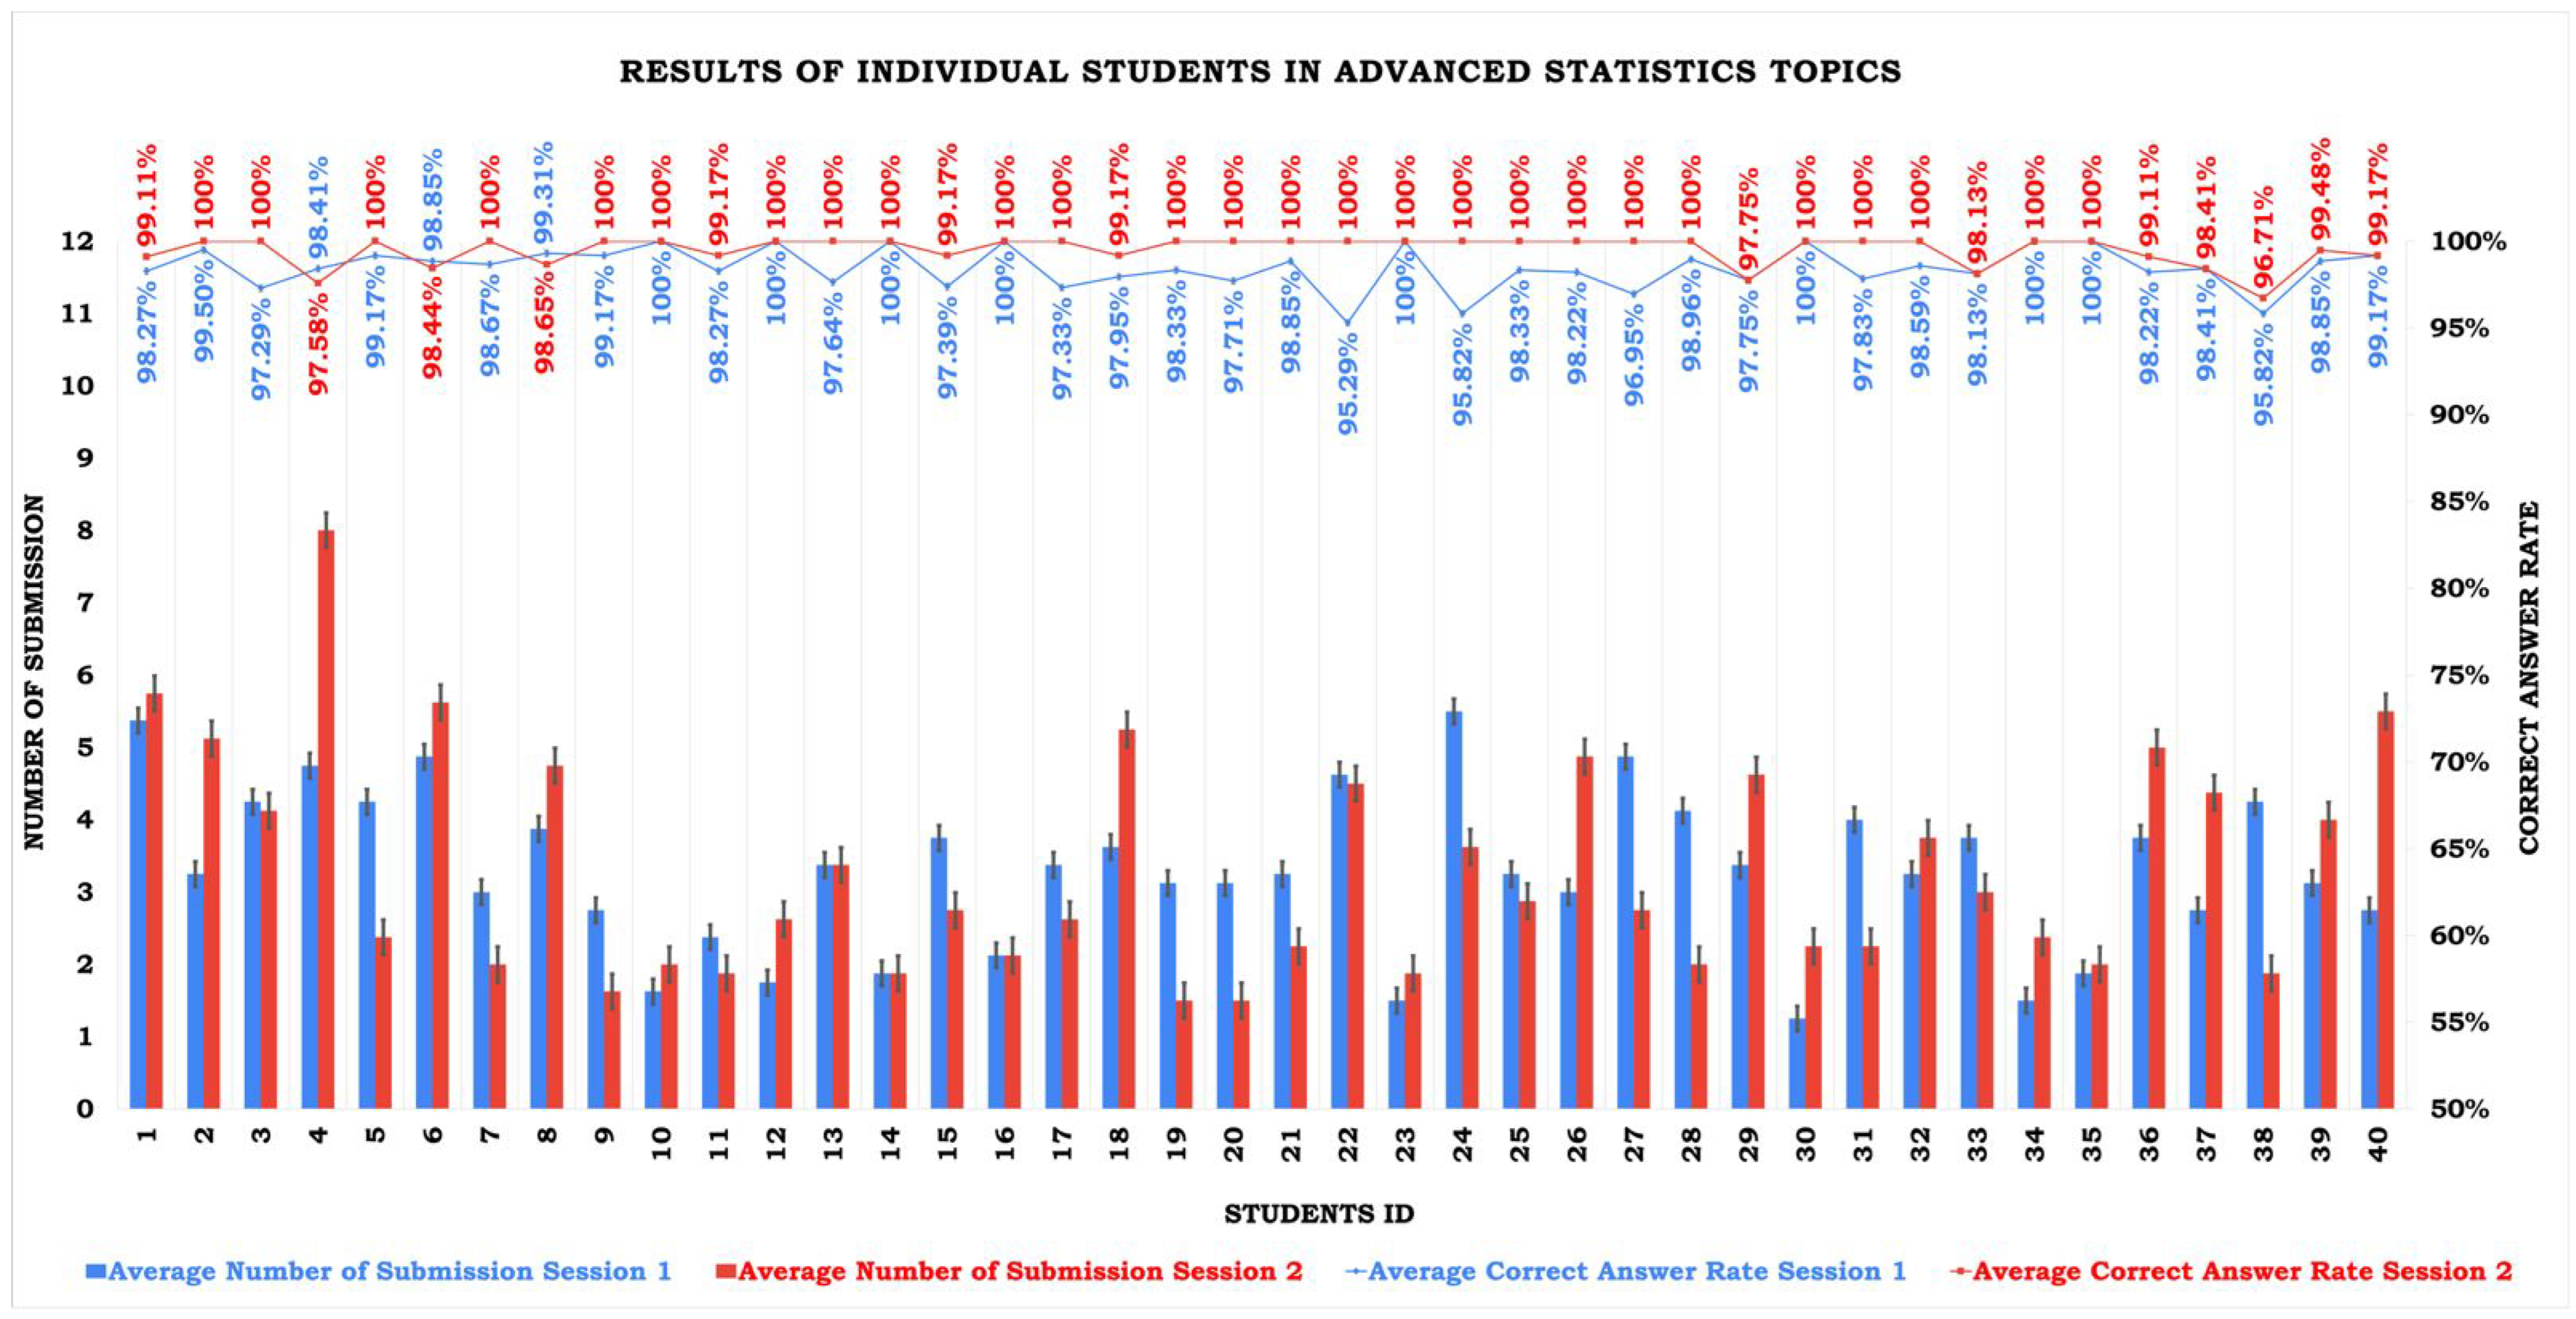
Information 16 00607 g005
Figure 6. Results of individual students in advanced statistics topics.
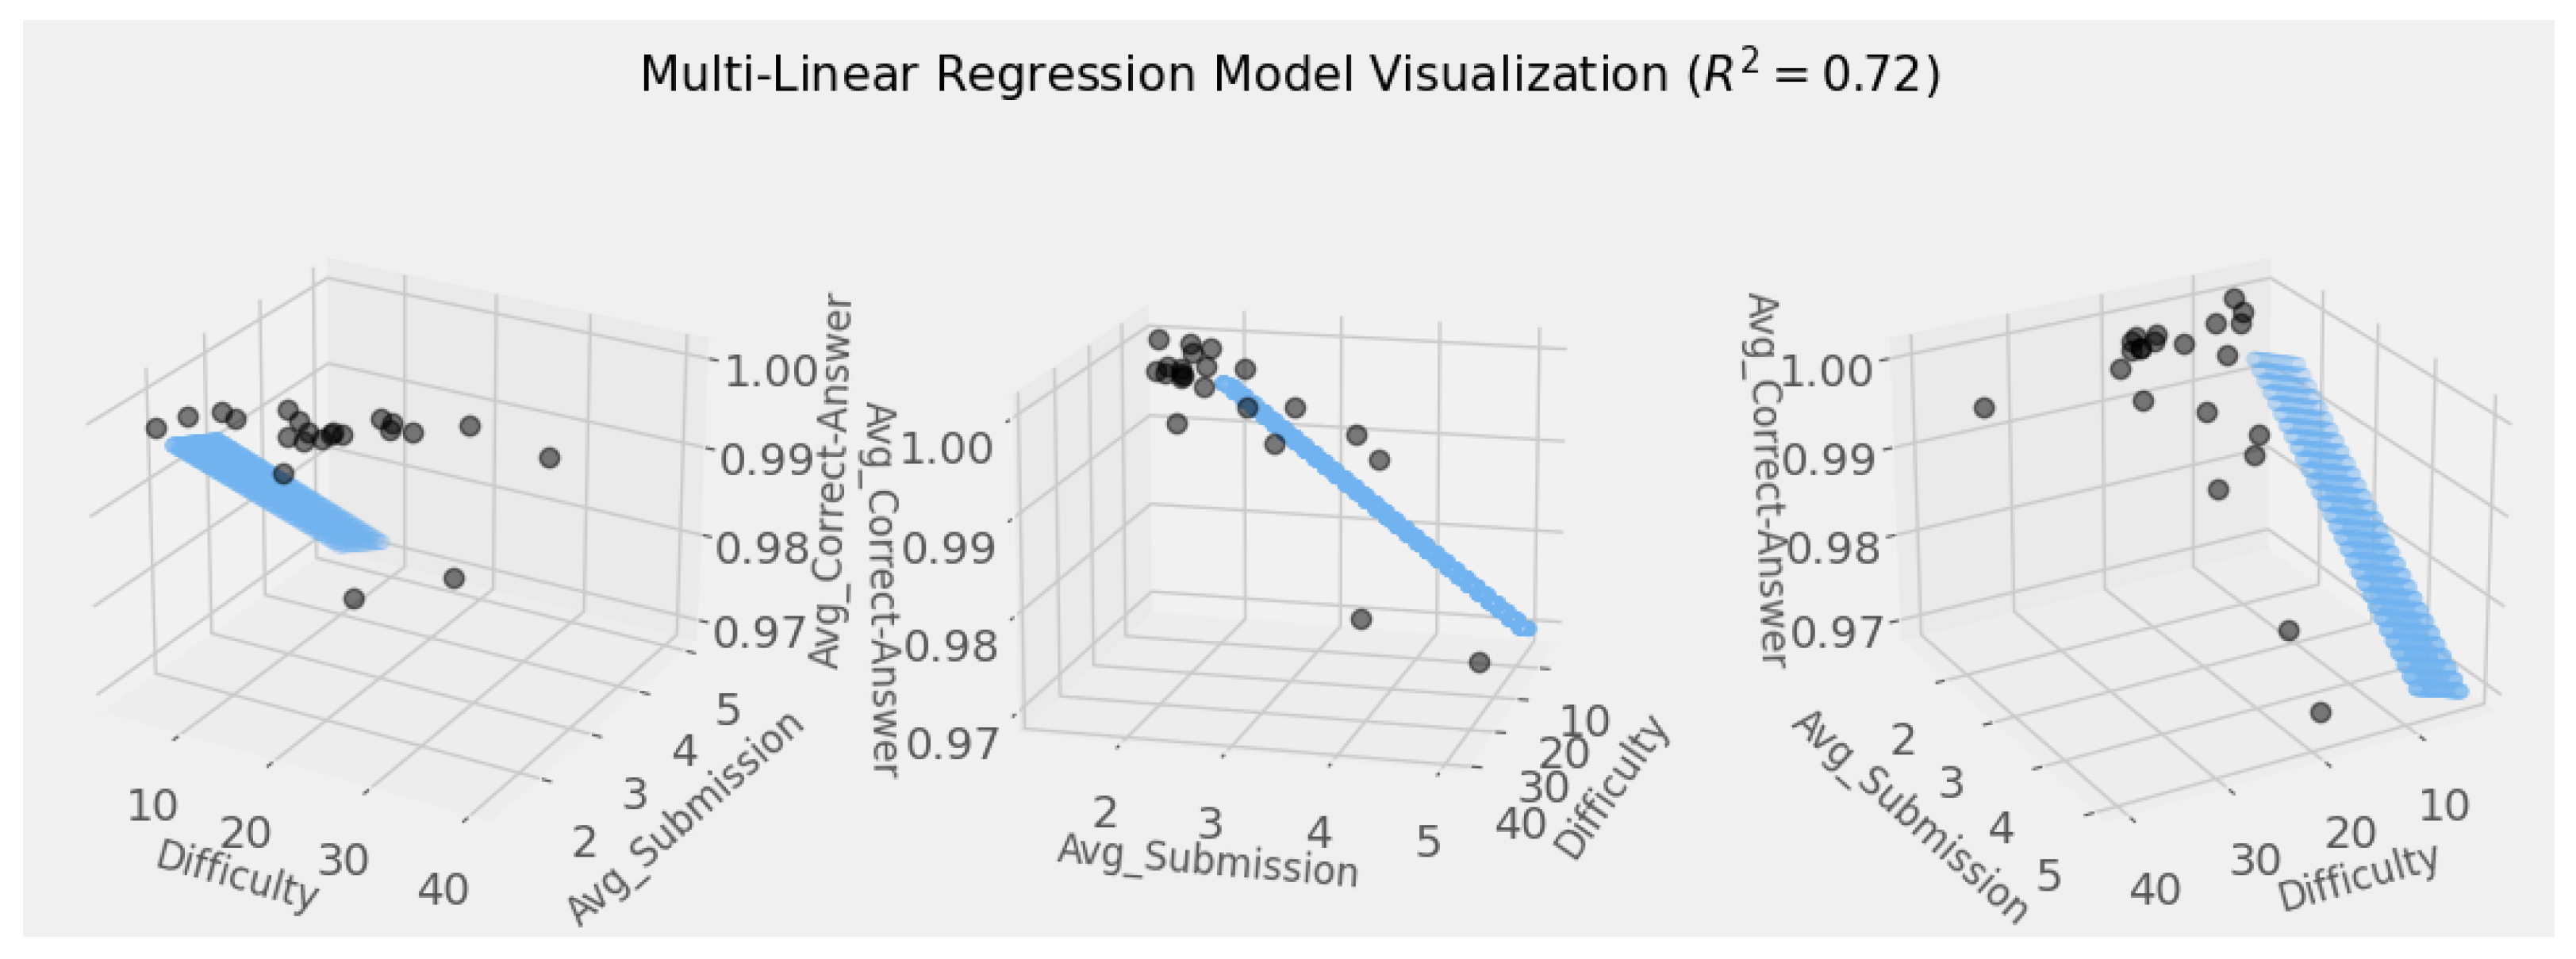
Information 16 00607 g006
Figure 7. Three-dimensional visualizations of multiple linear regression models.
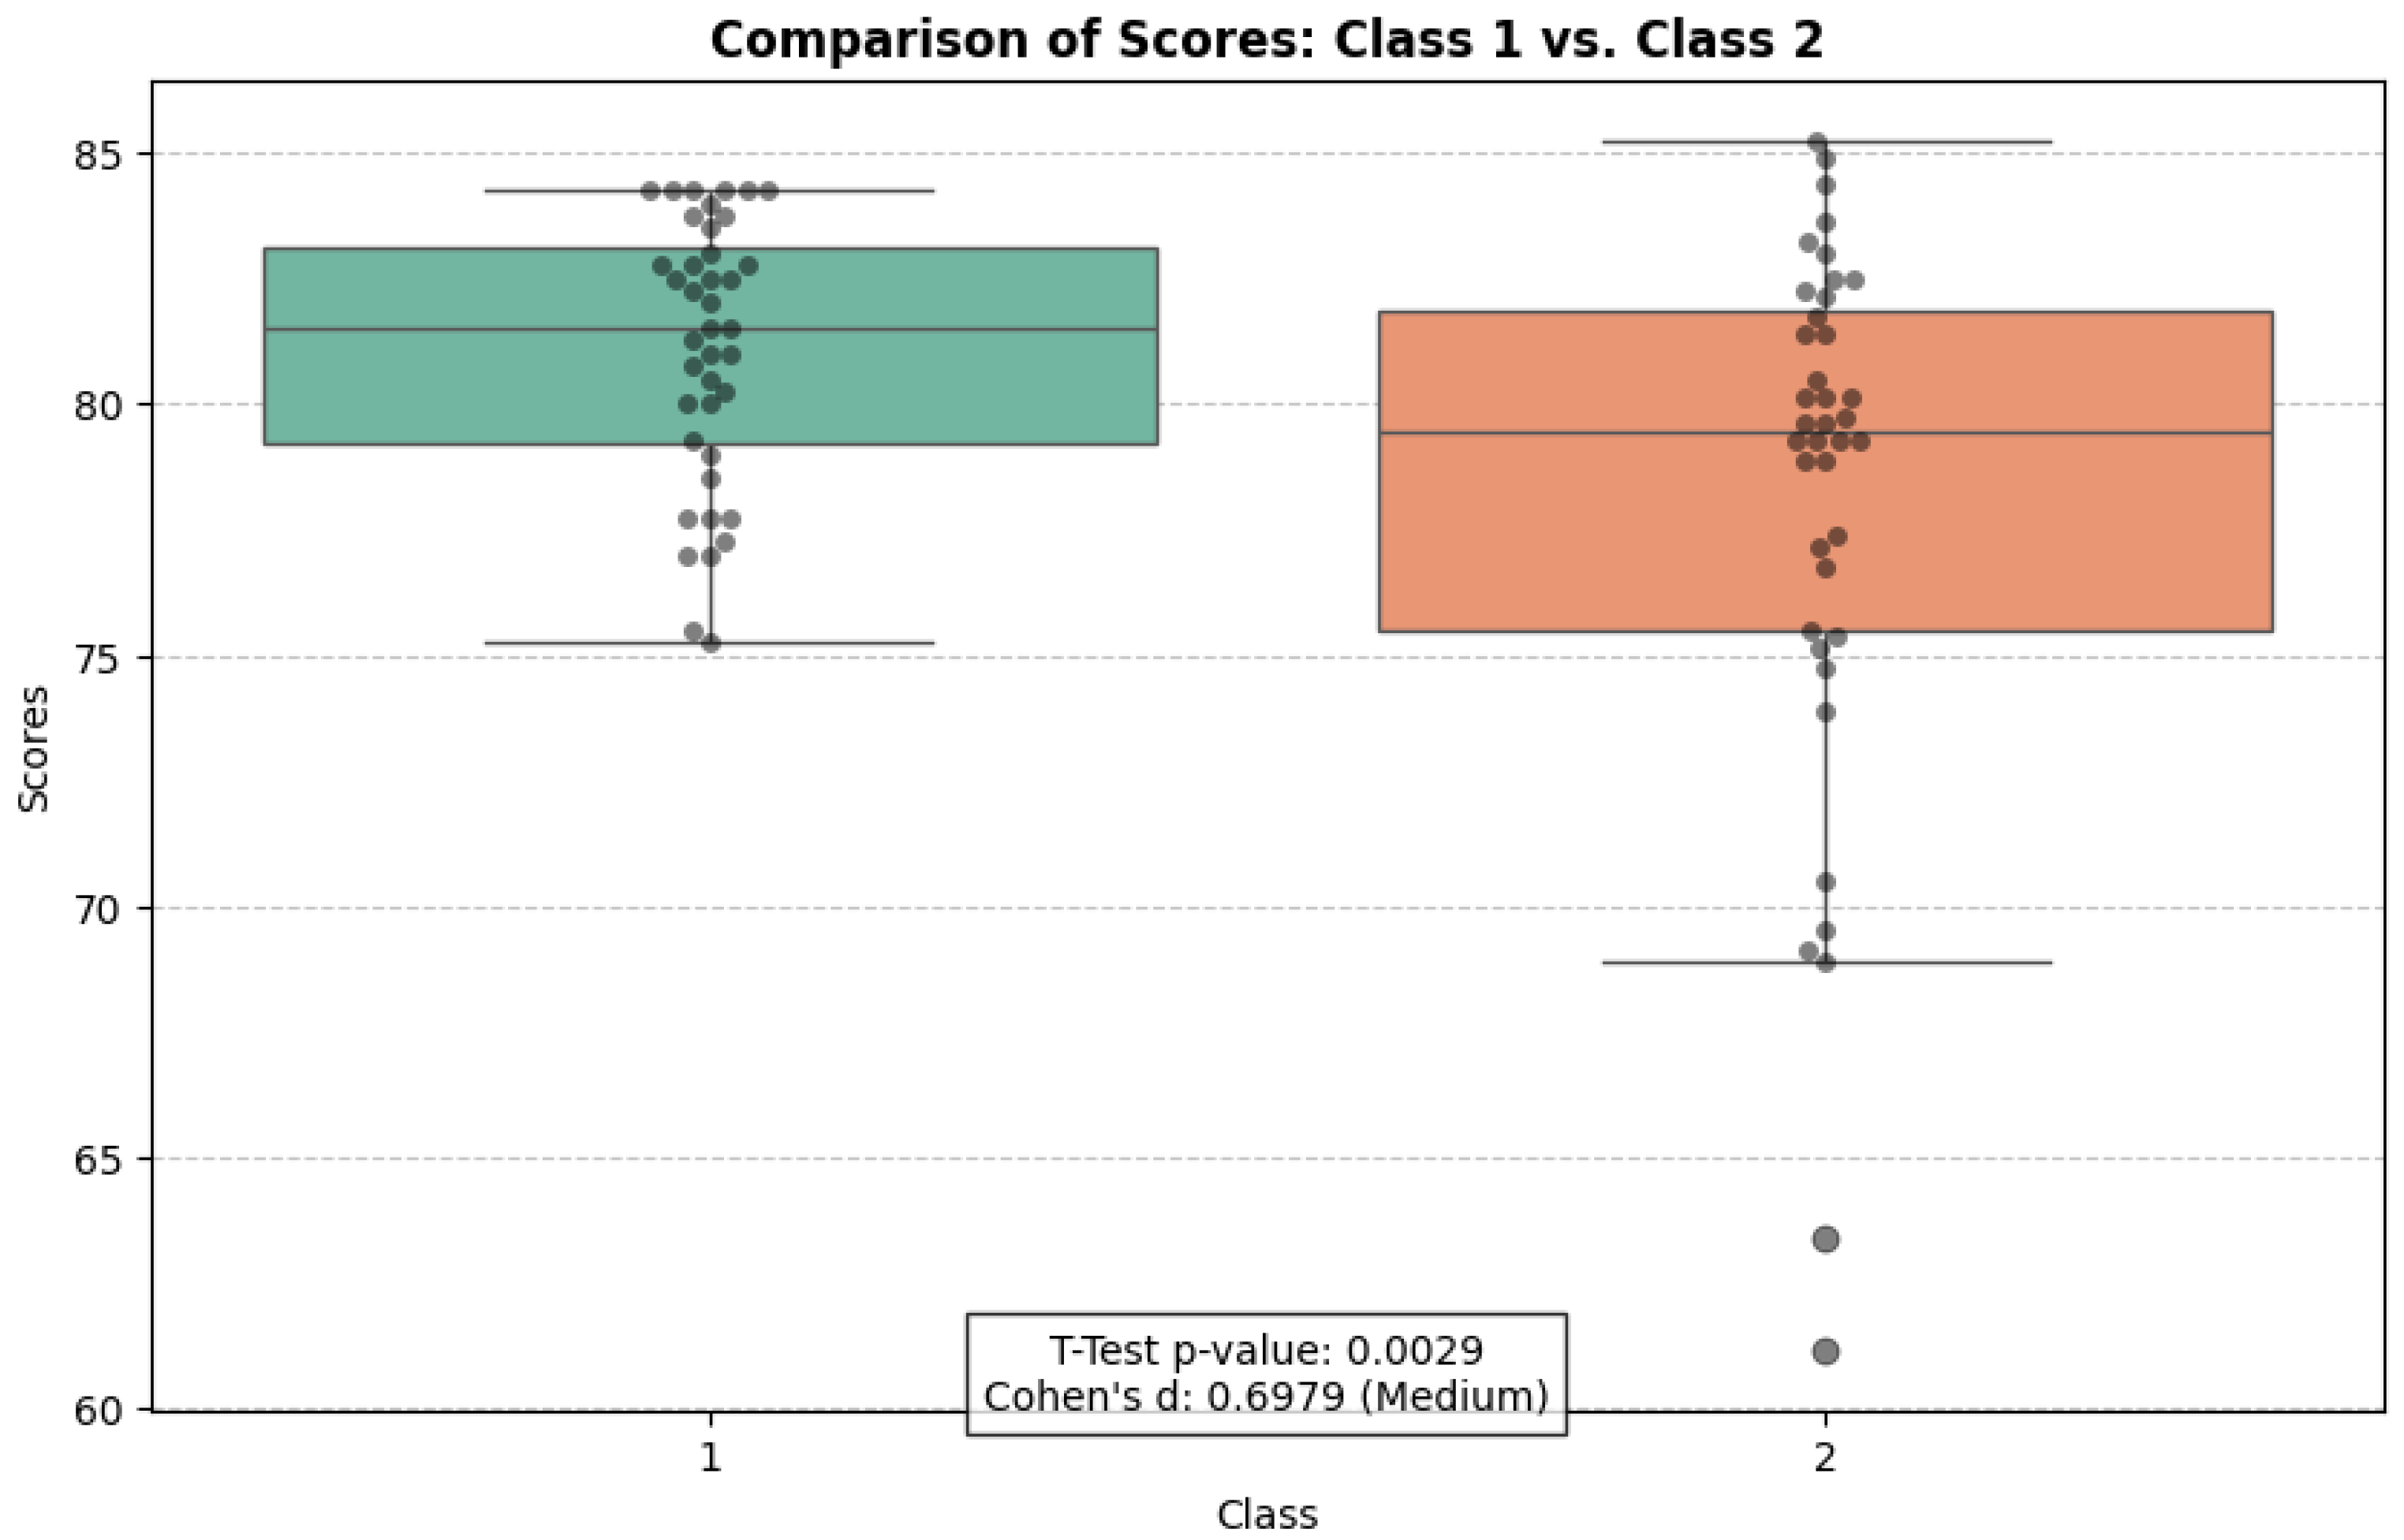
Information 16 00607 g007
Figure 8. Comparison of scores between Class 1 and Class 2 to provide the effect size using Cohen’s d score.
Information 16 00607 g008
Table 1. Selected statistics topics.
NoCategoryTopicsInstance IDs
1basicmean, median, mode1, 2, 3
2basicvariance, standard deviation, coefficient of variation, range4, 5, 6, 7
3basicquartile 1, quartile 2, quartile 3, decile, percentile8, 9, 10, 11, 12
4basicskewness, kurtosis13, 14
5advancedbinomial distribution, multinomial distribution, geometric distribution, Poisson distribution15, 16, 17, 18
6advancednormal distribution, t-distribution, exponential distribution, chi-square distribution19, 20, 21, 22
Table 2. Possible blank elements for EFPs.
NoCategoryElements
1Variable d a t a , t o t a l , n, x, m e a n , s q u a r e , v a r
2Operator/, −, * *
3Constant2, 1
4Function l e n , s u m , s q r t
Table 3. Elements and questions for GUPs.
NoCategoryElementsQuestions
1Keywords d a t a Which keyword is used to determine the initial data?
2KeywordsnWhich keyword is used to count the amount of data?
3Keywords t o t a l Which keyword is used to determine data summarization?
4Keywords m e a n Which keyword is used to calculate the average value?
5Keywords s q u a r e Which keyword is used to calculate the squared differences between the data and mean value?
6Keywords v a r Which keyword is used to calculate the variance value?
7Keywords s t d Which keyword is used to calculate the standard deviation value?
8Library m a t h Which library is used in the standard deviation calculation?
9Function l e n Which function is used to count the amount of data?
10Function s u m Which function is used to summarize the data?
11Function s q r t Which function is used to return the square root of a number?
Table 4. Variables, values, and questions in VTPs.
NoValue DescriptionResultsQuestions
1Length of data10What is the value from the length of data?
2Summation of data110What is the value from the summation of data?
3Mean11What is the average value of the given dataset?
4Variance 36.67 What is the value of variance?
5Standard deviation 6.06 What is the value of standard deviation?
Table 5. Instances in basic statistics topics.
IDTopicNumber of Questions
EFPGUPVTPTotal
1Mean4228
2Median161118
3Mode54110
4Variance110112
5Standard Deviation123217
6Coefficient of Variation164222
7Range4217
8Quartile 1181221
9Quartile 2161219
10Quartile 3162220
11Decile163221
12Percentile163221
13Skewness212225
14Kurtosis362240
Table 6. Instances in advanced statistics topics.
IDTopicNumber of Questions
EFPGUPVTPTotal
15Binomial Distribution103114
16Multinomial Distribution145120
17Geometric Distribution101112
18Poisson Distribution204125
19Normal Distribution185124
20t-Distribution75214
21Exponential Distribution161118
22Chi-Square Distribution115218
Table 7. Summary of solution results in basic and advanced statistics topics.
Statistics TopicsVariablesParametersNumber of SubmissionCorrect Answer Rate
Session 1Session 2Session 1Session 2
Basic StatisticsInstancesMean1.811.96100%100%
Std Dev0.260.340%0%
StudentsMean1.811.96100%100%
Std Dev0.670.500%0%
Advanced StatisticsInstancesMean3.343.3298.39%99.50%
Std Dev0.860.771.62%0.52%
StudentsMean3.313.3298.46%99.50%
Std Dev1.081.511.18%0.82%
Table 8. Data of average number of submissions and number of questions for determining instances difficulty analysis.
Instance IDsAverage # of SubmissionsNumber of Questions
11.638
21.7118
31.9010
41.7912
52.0617
61.9822
71.287
81.9521
91.8819
101.6620
111.9821
121.7921
132.3025
142.4940
152.3714
163.0420
172.6012
182.7225
193.9724
203.5314
213.5818
224.8018
Table 9. Average of correct answer rate and pre-test score data for student ability analysis.
Student IDsAverage Correct Answer RatePre-Test Score
199.3585
299.8885
399.32100
499.00100
599.7985
699.3285
799.6785
899.4985
999.79100
1010085
1199.36100
1210075
1399.41100
1410095
1599.1485
1610085
1799.3385
1899.2885
1999.58100
2099.43100
2199.7175
2298.82100
2310085
2498.96100
2599.58100
2699.55100
2799.24100
2899.74100
2998.8875
30100100
3199.46100
3299.65100
3399.0675
34100100
3510085
3699.3375
3799.21100
3898.1385
3999.5885
4099.58100
Table 10. Summary of data for use of statistics in correlation analysis and multiple linear regression analysis.
Instance IDNumber of Questions (Difficulty)Avg. SubmissionAvg. Correct Answer Rate (%)
181.63100
2181.71100
3101.90100
4121.79100
5172.06100
6221.98100
771.28100
8211.95100
9191.88100
10201.66100
11211.98100
12211.79100
13252.30100
14402.49100
15142.3799.91
16203.0499.70
17122.6099.08
18252.7299.80
19243.9799.33
20143.5397.29
21183.5899.39
22184.8097.05
Table 11. Correlation analysis between three factors for each instance.
Number of QuestionsAvg. SubmissionAvg. Correct Answer Rates
Number of Questions1.0000.2170.117
Avg. Submission0.2171.000 0.796
Avg. Correct Answer Rates0.117 0.796 1.000
Table 12. Student final grades in the fundamental statistics course.
ClassNumber of StudentsMeanStd. Dev
Class 14081.082.65
Class 24078.045.58
Disclaimer/Publisher’s Note: The statements, opinions and data contained in all publications are solely those of the individual author(s) and contributor(s) and not of MDPI and/or the editor(s). MDPI and/or the editor(s) disclaim responsibility for any injury to people or property resulting from any ideas, methods, instructions or products referred to in the content.

