
EVOCA: Explainable Verification of Claims by Graph Alignment


 and
and
Abstract
1. Introduction
- Entailment, when the meaning of the hypothesis can be inferred from the premise.
- Contradiction, when the hypothesis contradicts the premise.
- Neutral, when the relationship between the hypothesis and the premise is indeterminate.
2. Related Work
- Claim generation based on information extracted from Wikipedia.
- Claim annotation—labeling claims as supported, refuted, or not enough info—and selecting relevant evidence.
- One model predicts the set of relations R that connect a claim c with an entity e.
- The other estimates the maximum number of reasoning steps n required from e.
- Retrieving triples where both nodes are present in the entity list.
- Including relations between nodes that match lemmatized words in the claim.
- Retrieving all triples that are reachable within one step from any node in the entity list.
3. Methodology
3.1. Parsing
| Algorithm 1: Filtering tokens |
 |
3.2. Alignment
3.3. Verbalization
4. Case Study and Evaluation
5. Conclusions
Author Contributions
Funding
Institutional Review Board Statement
Informed Consent Statement
Data Availability Statement
Conflicts of Interest
References
- Muharram, A.P.; Purwarianti, A. Enhancing Natural Language Inference Performance with Knowledge Graph for COVID-19 Automated Fact-Checking in Indonesian Language. arXiv 2024, arXiv:2409.00061. [Google Scholar]
- Karkera, N.; Ghosh, S.; Escames, G.; Palaniappan, S.K. MelAnalyze: Fact-Checking Melatonin claims using LLMs and NLI. BioRxiv 2024. [Google Scholar]
- Martín, A.; Huertas-Tato, J.; Huertas-Garcia, A.; Villar-Rodríguez, G.; Camacho, D. FacTeR-Check: Semi-automated fact-checking through Semantic Similarity and Natural Language Inference. arXiv 2021, arXiv:2110.14532. [Google Scholar] [CrossRef]
- Bowman, S.R.; Angeli, G.; Potts, C.; Manning, C.D. A Large Annotated Corpus for Learning Natural Language Inference. In Proceedings of the 2015 Conference on Empirical Methods in Natural Language Processing (EMNLP), Lisbon, Portugal, 17–21 September 2015. [Google Scholar]
- Vaswani, A.; Shazeer, N.; Parmar, N.; Uszkoreit, J.; Jones, L.; Gomez, A.; Kaiser, L.; Polosukhin, I. Attention is All you Need. In Proceedings of the Neural Information Processing Systems, Long Beach, CA, USA, 4–9 December 2017. [Google Scholar]
- Devlin, J.; Chang, M.; Lee, K.; Toutanova, K. BERT: Pre-training of Deep Bidirectional Transformers for Language Understanding. In Proceedings of the NAACL, Minneapolis, MN, USA, 2–7 June 2019. [Google Scholar]
- Liu, Y.; Ott, M.; Goyal, N.; Du, J.; Joshi, M.; Chen, D.; Levy, O.; Lewis, M.; Zettlemoyer, L.; Stoyanov, V. RoBERTa: A Robustly Optimized BERT Pretraining Approach. arXiv 2019, arXiv:1907.11692. [Google Scholar]
- Yang, Z.; Dong, S.; Hu, J. Explainable Natural Language Inference via Identifying Important Rationales. IEEE Trans. Artif. Intell. 2023, 4, 438–449. [Google Scholar] [CrossRef]
- Mongiovì, M.; Gangemi, A. Graph-based Retrieval for Claim Verification over Cross-document Evidence. In Complex Networks & Their Applications X; Springer: Berlin/Heidelberg, Germany, 2022. [Google Scholar]
- Mongiovì, M.; Gangemi, A. GRAAL: Graph-Based Retrieval for Collecting Related Passages across Multiple Documents. Information 2024, 15, 318. [Google Scholar] [CrossRef]
- Levy, M.; Jacoby, A.; Goldberg, Y. Same Task, More Tokens: The Impact of Input Length on the Reasoning Performance of Large Language Models. In Proceedings of the ACL, Bangkok, Thailand, 11–16 August 2024. [Google Scholar]
- Chen, C.; Cai, F.; Hu, X.; Zheng, J.; Ling, Y.; Chen, H. An entity-graph based reasoning method for fact verification. Inf. Process. Manag. 2021, 58, 102472. [Google Scholar] [CrossRef]
- Lan, Y.; Liu, Z.; Gu, Y.; Yi, X.; Li, X.; Yang, L.; Yu, G. Multi-Evidence based Fact Verification via A Confidential Graph Neural Network. arXiv 2024, arXiv:2405.10481. [Google Scholar] [CrossRef]
- Thorne, J.; Vlachos, A.; Christodoulopoulos, C.; Mittal, A. FEVER: A Large-scale Dataset for Fact Extraction and VERification. arXiv 2018, arXiv:1803.05355. [Google Scholar]
- Giarelis, N.; Kanakaris, N.; Karacapilidis, N. An Innovative Graph-Based Approach to Advance Feature Selection from Multiple Textual Documents. In Proceedings of the AIAI 2020, IFIP AICT, Neos Marmaras, Greece, 5–7 June 2020; Springer: Cham, Switzerland, 2020; Volume 583. [Google Scholar]
- Jalil, Z.; Nasir, M.; Alazab, M.; Nasir, J.; Amjad, T.; Alqammaz, A. Grapharizer: A Graph-Based Technique for Extractive Multi-Document Summarization. Electronics 2023, 12, 1895. [Google Scholar] [CrossRef]
- Tosik, M. Abstract Meaning Representation—A Survey. 2015. Available online: https://www.melanietosik.com/files/amr.pdf (accessed on 19 May 2025).
- Banarescu, L.; Bonial, C.; Cai, S.; Georgescu, M.; Griffitt, K.; Hermjakob, U.; Knight, K.; Koehn, P.; Palmer, M.; Schneider, N. Abstract Meaning Representation for Sembanking. In Proceedings of the LAW VII, Sofia, Bulgaria, 8–9 August 2013. [Google Scholar]
- Bevilacqua, M.; Blloshmi, R.; Navigli, R. One SPRING to Rule Them Both: Symmetric AMR Semantic Parsing and Generation without a Complex Pipeline. In Proceedings of the AAAI, Vancouver, BC, Canada, 20–27 February 2024. [Google Scholar]
- Diggelmann, T.; Boyd-Graber, J.; Bulian, J.; Ciaramita, M.; Leippold, M. CLIMATE-FEVER: A Dataset for Verification of Real-World Climate Claims. arXiv 2021, arXiv:2012.00614. [Google Scholar] [CrossRef]
- Pew Research Center. News Consumption Across Social Media in 2021. Pew Research Center: Journalism & Media. 2021. Available online: https://www.pewresearch.org/journalism/2021/09/20/news-consumption-across-social-media-in-2021/ (accessed on 19 May 2025).
- Vosoughi, S.; Roy, D.; Aral, S. The spread of true and false news online. Science 2018, 359, 1146–1151. [Google Scholar] [CrossRef] [PubMed]
- Borges do Nascimento, I.J.; Pizarro, A.B.; Almeida, J.M.; Azzopardi-Muscat, N.; Gonçalves, M.A.; Björklund, M.; Novillo-Ortiz, D. Infodemics and health misinformation: A systematic review of reviews. Bull. World Health Organ. 2022, 100, 544–561. [Google Scholar] [CrossRef] [PubMed]
- Allcott, H.; Gentzkow, M. Social media and fake news in the 2016 election. J. Econ. Perspect. 2017, 31, 211–236. [Google Scholar] [CrossRef]
- Zhou, J.; Han, X.; Yang, C.; Liu, Z.; Wang, L.; Li, C.; Sun, M. GEAR: Graph-Based Evidence Aggregating and Reasoning for Fact Verification. arXiv 2019, arXiv:1908.01843. [Google Scholar]
- Zhong, W.; Xu, J.; Tang, D.; Xu, Z.; Duan, N.; Zhou, M.; Wang, J.; Yin, J. Reasoning Over Semantic-Level Graph for Fact Checking. arXiv 2019, arXiv:1909.03745. [Google Scholar]
- Nie, Y.; Chen, H.; Bansal, M. Combining Fact Extraction and Verification with Neural Semantic Matching Networks. In Proceedings of the AAAI, Honolulu, HI, USA, 27 January–1 February 2019; Volume 33. [Google Scholar]
- Ma, J.; Gao, W.; Joty, S.; Wong, K.F. Sentence-Level Evidence Embedding for Claim Verification with Hierarchical Attention Networks. In Proceedings of the ACL, Florence, Italy, 28 July–2 August 2019; pp. 2561–2571. [Google Scholar]
- Soleimani, A.; Monz, C.; Worring, M. BERT for Evidence Retrieval and Claim Verification. arXiv 2019, arXiv:1910.02655. [Google Scholar]
- Liu, Z.; Xiong, C.; Sun, M.; Liu, Z. Fine-Grained Fact Verification with Kernel Graph Attention Network. In Proceedings of the 58th Annual Meeting of the Association for Computational Linguistics: Association for Computational Linguistics, Online, 5–10 July 2020; pp. 7342–7351. [Google Scholar]
- Hanselowski, A.; Zhang, H.; Li, Z.; Sorokin, D.; Schiller, B.; Schulz, C.; Gurevych, I. UKP-Athene: Multi-Sentence Textual Entailment for Claim Verification. arXiv 2019, arXiv:1809.01479v5. [Google Scholar]
- Kim, J.; Park, S.; Kwon, Y.; Jo, Y.; Thorne, J.; Choi, E. FactKG: Fact Verification via Reasoning on Knowledge Graphs. In Proceedings of the 61st Annual Meeting of the Association for Computational Linguistics (Volume 1: Long Papers); Rogers, A., Boyd-Graber, J., Okazaki, N., Eds.; Association for Computational Linguistics: Toronto, ON, Canada, 2023; pp. 16190–16206. [Google Scholar]
- Vedula, N.; Parthasarathy, S. FACE-KEG: Fact Checking Explained Using KnowledgE Graphs. In Proceedings of the 14th ACM International Conference on Web Search and Data Mining, Virtual Event, 8–12 March 2021; pp. 526–534. [Google Scholar]
- Hagberg, A.A.; Schult, D.A.; Swart, P.J. Exploring network structure, dynamics, and function using NetworkX. In Proceedings of the 7th Python in Science Conference (SciPy2008), Pasadena, CA USA, 19–24 August 2008; pp. 11–15. [Google Scholar]
- Kim, Y. ClimateBERT FactCheck Dataset, 2022. HuggingFace Datasets Repository. Available online: https://huggingface.co/datasets/Yoonseong/climatebert_factcheck (accessed on 19 May 2025).
- Robins, G.; Zelikovsky, A. Tighter Bounds for Graph Steiner Tree Approximation. SIAM J. Discrete Math. 2005, 19, 122–134. [Google Scholar] [CrossRef]
- Mehlhorn, K. A Faster Approximation Algorithm for the Steiner Problem in Graphs. Inf. Process. Lett. 1988, 27, 125–128. [Google Scholar] [CrossRef]
- Kou, L.; Markowsky, G.; Berman, L. A Fast Algorithm for Steiner Trees. Acta Inform. 1981, 15, 141–145. [Google Scholar] [CrossRef]
- Lewis, M.; Liu, Y.; Goyal, N.; Ghazvininejad, M.; Mohamed, A.; Levy, O.; Stoyanov, V.; Zettlemoyer, L. BART: Denoising Sequence-to-Sequence Pre-training for Natural Language Generation, Translation, and Comprehension. arXiv 2019, arXiv:1910.13461. [Google Scholar]
- Martínez Lorenzo, A.C.; Huguet Cabot, P.L.; Navigli, R. Cross-lingual AMR Aligner: Paying Attention to Cross-Attention. In Proceedings of the Findings of the Association for Computational Linguistics: ACL 2023, Toronto, ON, Canada, 9–14 July 2023; pp. 1726–1742. [Google Scholar]
- Page, M.J.; McKenzie, J.E.; Bossuyt, P.M.; Boutron, I.; Hoffmann, T.C.; Mulrow, C.D.; Shamseer, L.; Tetzlaff, J.M.; Akl, E.A.; Brennan, M.; et al. The PRISMA 2020 statement: An updated guideline for reporting systematic reviews. BMJ 2021, 372, n71. [Google Scholar] [CrossRef] [PubMed]


| Premise | Label | Hypothesis |
|---|---|---|
| Children smiling and waving at camera | entailment | There are children present |
| A Little League team tries to catch a runner sliding into a base in an afternoon game. | neutral | A team is trying to score the game’s winning out. |
| An older man is drinking orange juice at a restaurant. | contradiction | Two women are at a restaurant drinking wine. |
| Evidence | Sub-Evidence | Claim |
|---|---|---|
| By August 2014, a three-year drought was prompting changes to the agriculture industry in the valley. | A three-year drought. | While the north-east, midwest and upper great plains have experienced a 30% increase in heavy rainfall episodes—considered once-in-every-five year downpours—parts of the west, particularly California, have been parched by drought. |
| The IUGG concurs with scientific assessments stating that human activities are the primary cause of recent climate change. | Activities which are the primary evidence of recent climate change. | The IPCC was formed to build the scientific case for humanity being the primary cause of global warming. |
| This increase in acidity inhibits all marine life—having a greater impact on smaller organisms as well as shelled organisms (see scallops). | All marine life will be inhibited by this increase in acidity, which will have a great impact on the small shells and fishes. | More than half of the 44 studies selected for publication found that raised levels of CO2 had little or no impact on marine life, including crabs, limpets, sea urchins, and sponges. |
| Subgraph Dimension | Subgraph | Original Graph Dimension | Original Graph |
|---|---|---|---|
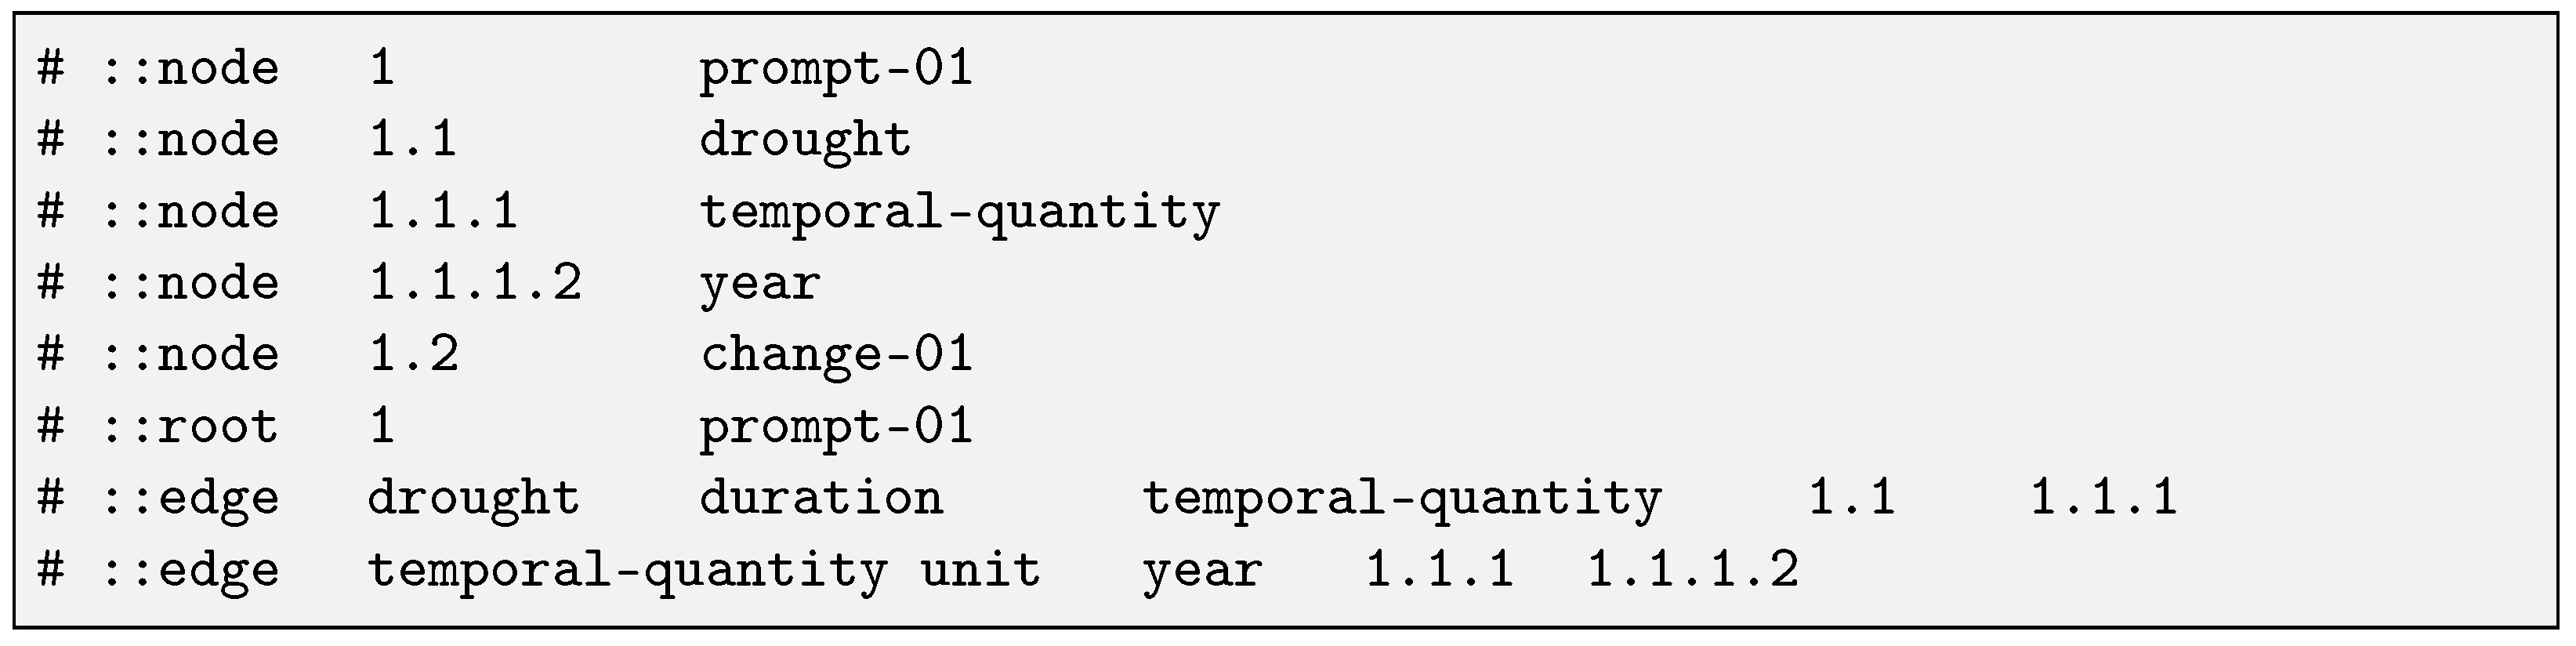
| 5 nodes, 4 edges | (drought :ARG0 prompt-01 :duration (temporal-quantity :quant 3 :unit year)) | 13 nodes, 12 edges | (z0 / prompt-01 :ARG0 (z1 / drought :duration (z2 / temporal-quantity :quant 3 :unit (z3 / year))) :ARG1 (z4 / change-01 :ARG1 (z5 / industry :mod (z6 / agriculture) :location (z7 / valley))) :time (z8 / by :op1 (z9 / date-entity :month 8 :year 2014))) |
| 7 nodes, 6 edges | (cause-01 :ARG1 evidence-01 :ARG0 activity-06 :ARG1 (change-01 :ARG1-of climate :time recent) :mod primary) | 36 nodes, 37 edges | (z0 / concur-01 :ARG0 (z1 / organization :wiki “International_Panel_on_Climate_Change” :name (z2 / name :op1 “IUGG”)) :ARG1 (z3 / and :op1 (z4 / assess-01 :ARG0 (z5 / organization :wiki “Intergovernmental_Panel_on_Climate_Change” :name (z6 / name :op1 “Intergovernmental” :op2 “Panel” :op3 “on” :op4 “Climate” :op5 “Change”)) :mod (z7 / science) :mod (z8 / comprehensive) :ARG1-of (z9 / accept-01 :ARG1-of (z10 / wide-02)) :ARG1-of (z11 / endorse-01 :ARG1-of z10)) :op2 (z12 / establish-01 :ARG0 (z13 / and :op1 (z14 / body :mod (z15 / region)) :op2 (z16 / body :mod (z17 / nation))) :ARG1 (z18 / evidence-01 :ARG0 z7 :ARG1 (z19 / cause-01 :ARG0 (z20 / activity-06 :ARG0 (z21 / human)) :ARG1 (z22 / change-01 :ARG1 (z23 / climate) :time (z24 / recent)) :mod (z25 / primary))) :ARG1-of (z26 / firm-03))) :medium (z27 / it)) |
| 14 nodes, 13 edges | (inhibit-01 :ARG0 (increase-01 :ARG1 acidity :mod this) :ARG1 (life :mod all :mod marine :ARG0-of (impact-01 :ARG1 (and :op1 (organism :mod small :mod shell) :op2 organism) :mod great))) | 21 nodes, 20 edges | (z0 / multi-sentence :snt1 (z1 / inhibit-01 :ARG0 (z2 / increase-01 :ARG1 (z3 / acidity) :mod (z4 / this)) :ARG1 (z5 / life :mod (z6 / all) :mod (z7 / marine) :ARG0-of (z8 / impact-01 :ARG1 (z9 / and :op1 (z10 / organism :mod (z11 / small :degree (z12 / more))) :op2 (z13 / organism :mod (z14 / shell))) :mod (z15 / great :degree (z16 / more))))) :snt2 (z17 / see-01 :mode imperative :ARG0 (z18 / you) :ARG1 (z19 / scallop))) |
| Evidence Type | Model | Learning Rate | F1-Score | Accuracy |
|---|---|---|---|---|
| Full evidence | RoBERTa-large-MNLI | 0.681 | 0.676 | |
| Reduced evidence | RoBERTa-large-MNLI | 0.662 | 0.670 | |
| Full evidence | RoBERTa-large-MNLI | 0.724 | 0.720 | |
| Reduced evidence | RoBERTa-large-MNLI | 0.669 | 0.670 | |
| Full evidence | Bart-large-MNLI | 0.706 | 0.736 | |
| Reduced evidence | Bart-large-MNLI | 0.665 | 0.664 | |
| Full evidence | Bart-large-MNLI | 0.651 | 0.642 | |
| Reduced evidence | Bart-large-MNLI | 0.642 | 0.648 | |
| ine Full evidence | Bart-large-MNLI | 0.683 | 0.687 | |
| Reduced evidence | Bart-large-MNLI | 0.679 | 0.687 |
Disclaimer/Publisher’s Note: The statements, opinions and data contained in all publications are solely those of the individual author(s) and contributor(s) and not of MDPI and/or the editor(s). MDPI and/or the editor(s) disclaim responsibility for any injury to people or property resulting from any ideas, methods, instructions or products referred to in the content. |
© 2025 by the authors. Licensee MDPI, Basel, Switzerland. This article is an open access article distributed under the terms and conditions of the Creative Commons Attribution (CC BY) license (https://creativecommons.org/licenses/by/4.0/).
Share and Cite
De Felice, C.; Longo, C.F.; Mongiovì, M.; Santamaria, D.F.; Tuccari, G.G. EVOCA: Explainable Verification of Claims by Graph Alignment. Information 2025, 16, 597. https://doi.org/10.3390/info16070597
De Felice C, Longo CF, Mongiovì M, Santamaria DF, Tuccari GG. EVOCA: Explainable Verification of Claims by Graph Alignment. Information. 2025; 16(7):597. https://doi.org/10.3390/info16070597
Chicago/Turabian StyleDe Felice, Carmela, Carmelo Fabio Longo, Misael Mongiovì, Daniele Francesco Santamaria, and Giusy Giulia Tuccari. 2025. "EVOCA: Explainable Verification of Claims by Graph Alignment" Information 16, no. 7: 597. https://doi.org/10.3390/info16070597
APA StyleDe Felice, C., Longo, C. F., Mongiovì, M., Santamaria, D. F., & Tuccari, G. G. (2025). EVOCA: Explainable Verification of Claims by Graph Alignment. Information, 16(7), 597. https://doi.org/10.3390/info16070597