1. Introduction
Modern human societies operate on an underlying structure of critical infrastructure, which is made up of a wide range of resources and systems that are necessary to maintain essential operations. These infrastructures are crucial to maintaining public safety, economic stability, and national security. They include the complex networks of electricity grids, transportation systems, water treatment plants, and financial institutions. But the same digital technologies that have ushered critical infrastructure sectors into the modern era have also made them a tempting target for malicious cyber actors looking for ways to undermine national security, disrupt operations, or steal sensitive data.
Over the past decade, there has been a notable escalation in cyber threats targeting critical infrastructure sectors worldwide. As noted in [
1], the 2015 cyberattack on Ukraine’s power grid, widely attributed to state-sponsored actors, stands as a stark example of the vulnerabilities inherent in such systems. This attack resulted in widespread blackouts that affected hundreds of thousands of people and highlighted the potential catastrophic consequences of cyber disruptions to critical infrastructure. Similarly, the Not Petya ransomware attack in 2017 [
2] wreaked havoc on several major ports, logistics companies, and financial institutions globally, causing billions of dollars in damages and disrupting operations for long periods.
In this environment of heightened cyber risk and evolving threat landscapes, protecting critical infrastructure systems from cyber intrusions has become of highest importance for governments, industry stakeholders, and cybersecurity professionals alike. Predicting, identifying, and effectively mitigating cyber risks is crucial for preserving the confidentiality, availability, and integrity of vital infrastructure services, as well as reducing the possible effects of cyber incidents on public safety and national security.
Moreover, the ongoing digitization of critical infrastructure systems, coupled with the expansion of associated devices and the Internet of Things, has further increased the difficulties faced by critical infrastructure custodians, as highlighted in this study [
3]. These systems’ growing interconnectedness and complexity have significantly widened the attack surface, giving attackers numerous ways of entry to take advantage of weaknesses and conduct sophisticated cyberattacks [
3]. From remote access points in power grid substations to internet-connected sensors in water treatment plants, the sheer breadth of potential targets presents a formidable challenge for organizations seeking to safeguard critical infrastructure assets from cyber threats.
In response to the escalating cyber threats targeting critical infrastructure, the organizations responsible for their protection have implemented a range of cybersecurity measures to safeguard systems and assets. These measures encompass preventive, detective, and corrective controls aimed at reducing the likelihood and impact of cyber incidents, as per [
4]. Among these controls, IDSs are a crucial element of cybersecurity defenses, functioning to monitor network traffic, detect anomalous behavior, and notify security personnel of possible security breaches, among other things.
Traditional IDSs operate on predefined rules, signatures, or heuristics to detect known patterns of malicious behavior, such as known malware signatures or abnormal network traffic patterns. While effective against recognized threats, these IDSs often struggle to detect novel or previously unseen attacks, such as zero-day exploits or polymorphic malware. Additionally, traditional IDSs may generate a high volume of false positives, alerting security personnel to benign activities or legitimate network traffic.
The evolution of cybersecurity threats has prompted the exploration of innovative approaches to enhance the capabilities of IDSs and improve their effectiveness in identifying and reducing risks associated with the internet. One of these strategies is integrating machine learning that allows systems to maximize predictions and extract insights from data into traditional IDSs. By enabling IDSs to detect and identify attacks that were previously not known, reduce false positives, and adapt to emerging threats, machine learning techniques present a promising way to enhance IDS capabilities.
The merger of machine learning with traditional IDSs holds several potential advantages for enhancing cybersecurity defenses. By leveraging machine learning algorithms, IDSs can improve detection accuracy, adaptability, and responsiveness to emerging threats. Dependency on established rules and signatures is reduced because machine learning algorithms can evaluate massive amounts of network data, extract essential details, and identify abnormalities indicative of malicious activity. Furthermore, machine learning gives IDSs the capability to continuously acquire from new data and enhance their models to improve detection accuracy over time, ensuring efficient defense against changing cyberthreats.
Several machine learning algorithms have shown promise in the field of cybersecurity and are potential candidates for integration with traditional IDSs. Algorithms such as 1DCNN and LSTM have been successfully applied to malware detection tasks, as studied by [
5], achieving high detection accuracy and low false-positive rates. Unsupervised learning algorithms, such as one-class SVM and isolation forest, give the possibility of identifying anomalies in typical network behavior, which could lead to the detection of unknown or zero-day attacks.
In this paper, we will delve deeper into the cybersecurity challenges facing critical infrastructure sectors and explore the role of machine learning-enabled IDS models in mitigating cyber threats. We will look at the drawbacks of conventional IDSs and talk about how machine learning approaches might help mitigate these drawbacks while refining the effectiveness and resilience of these systems in protecting vital infrastructure assets. Additionally, we will review existing research and case studies on the implementation of machine learning in IDSs for critical infrastructure protection, highlighting key findings and insights.
The present research focuses on evaluating the scalability, flexibility, and generalizability of machine learning-based intrusion detection systems by assessing how well machine learning algorithms detect known and unknown cyber threats using these datasets. Furthermore, by addressing challenges such as data quality, model interpretability, and computational complexity in the context of publicly available datasets, this research aims to provide insights and recommendations that can be applied across various critical infrastructure sectors.
Through empirical studies conducted on publicly available datasets and rigorous experimentation, this research endeavors to aid in the progress of intrusion detection techniques for critical infrastructure protection. Additionally, by focusing on publicly available datasets, this research aims to facilitate transparency, reproducibility, and accessibility in cybersecurity research, thereby enabling broader participation and collaboration within the research community.
Research Questions
Through analysis of the existing literature and careful experimentation in the domain of critical infrastructure datasets and machine learnings algorithms, we look to address the following questions:
- -
How effective are machine learning algorithms in detecting cyberattacks on critical infrastructure systems?
This question examines how effectively various machine learning algorithms perform in locating and mitigating cyberthreats to vital infrastructure. The study intends to ascertain these algorithm’s applicability and reliability in real-world circumstances by examining their accuracy, precision, recall, and general resilience. To protect against ever-evolving cyber threats, machine learning must be effective in fortifying the security posture of vital systems.
- -
What form of learning algorithms, supervised or unsupervised, are best suited for intrusion detection in critical infrastructure systems?
This question explores the comparative advantages of supervised and unsupervised learning algorithms in the context of intrusion detection for critical infrastructure. The question evaluates how each type of algorithm performs in detecting anomalies and cyberattacks, considering factors such as data availability, anomaly characteristics, and operational efficiency. The study aims to provide a clear understanding of which approach offers superior performance, aiding in the development of more effective security strategies for critical infrastructure protection.
2. IDSs and Machine Learning
An attacker securing illicit access to a device, network, or system is referred to as an intrusion in the context of cybersecurity. Cybercriminals infiltrate organizations covertly by employing ever more advanced methods and strategies. This includes conventional techniques such as coordinated attacks, fragmentation, address spoofing, and pattern deception. By keeping an eye on system logs and network traffic, an IDS is crucial for spotting and stopping these infiltration attempts.
An intrusion detection system (IDS) is a vital part of cybersecurity infrastructure, tasked with monitoring network traffic to detect potential threats and unauthorized activities. IDSs scrutinize system logs and network traffic to identify suspicious patterns or behaviors that could indicate security breaches. Upon detecting an anomaly, the system notifies IT and security teams, enabling them to investigate and address potential security threats, as highlighted in the study by [
6]. While some IDS solutions merely report unusual activities, others can proactively respond by blocking malicious traffic. According to [
7], IDS products are commonly implemented as software applications on corporate hardware or as part of network security measures. With the rise of cloud computing, numerous cloud-based IDS solutions are available to safeguard a company’s systems, data, and resources.
There are various types of IDS solutions, each with their own set of capabilities, as per [
8]:
A Network Intrusion Detection System (NIDS) is positioned at key locations within the network of an organization. It keeps track of all incoming and outgoing traffic, identifying malicious and suspicious activities across all connected devices.
A Host Intrusion Detection System (HIDS) is deployed on separate devices with internal network and internet connections. It identifies both internal and external threats, such as malware infections and unauthorized access attempts.
A Signature-based Intrusion Detection System (SIDS) gathers information about known attack signatures from a repository and uses this information to compare observed network packets to a list of known threats.
An Anomaly-based Intrusion Detection System (AIDS) creates a baseline of typical network behavior and notifies administrators of any deviations from this norm, which may signal potential security breaches.
A Perimeter Intrusion Detection System (PIDS) is deployed at the boundary of critical infrastructures. It detects intrusion attempts aimed at breaching the network perimeter.
A Virtual Machine-based Intrusion Detection System (VMIDS) monitors virtual machines to identify attacks and malicious activities within these virtualized environments.
A Stack-based Intrusion Detection System (SBIDS) is combined into the network layer of the organizational network to analyze packets before they interact with the application layer of the network.
Incorporating machine learning approaches into IDSs has emerged as an intriguing methodology to improve the integrity of critical infrastructure in recent years. Mentioned in [
9], the growing sophistication of cyberattacks aimed against vital industries like energy, transportation, and water supply makes conventional rule-based IDSs insufficient in identifying and countering new risks. Additionally, IDSs may more precisely scan enormous amounts of data, spot intricate patterns, and identify legitimate activity through the utilization of machine learning algorithms. IDSs can identify and address attacks in actual time by utilizing machine learning, giving enterprises a proactive defense against intrusions. As a result, there has been an increase in the interest of using machine learning algorithms to complement IDSs, allowing them to adapt to changing threat environments and mitigate newly emerging risks to security.
When it comes to protecting vital infrastructure, IDSs can benefit greatly from machine learning. When compared to conventional rule-based or signature-based approaches, machine learning algorithms are more accurate in detecting small patterns or abnormalities that could be signs of security concerns because they are better at analyzing large amounts of data, as described by [
10]. Particularly in anomaly detection, ML techniques can identify previously unknown or zero-day attacks by learning the normal behavior of network traffic or system activities, thus enhancing the IDS’s ability to detect novel threats. Moreover, ML algorithms are scalable, adaptable, and capable of efficiently processing large datasets and adapting to changing environments and emerging threats without manual intervention, ensuring continuous protection against evolving cyber threats. ML-based IDSs can operate in near real time, enabling rapid detection and response to security incidents by continuously monitoring network traffic and system logs. Furthermore, ML algorithms can reduce false positives, lowering warning fatigue and allowing security professionals to concentrate on legitimate security issues by examining contextual data and the association between occurrences.
These advantages underscore the effectiveness of ML in enhancing the capabilities of IDSs for critical infrastructure protection, providing a proactive defense against sophisticated cyber threats. Machine learning algorithms offer a wide range of tools and approaches for processing enormous amounts of data and identifying patterns, anomalies, and potential security breaches, as highlighted in the study by [
11]. As studied by [
12], algorithms can be classified according to their learning methodology and application domain, such as supervised learning, unsupervised learning, and semi-supervised learning approaches.
Supervised Learning: Labeled datasets are used to train these algorithms, with each occurrence attached to a defined class or result. These algorithms are trained to classify novel instances based upon how identical they are to preexisting samples. Supervised learning is a useful feature of IDSs that helps distinguish between malicious and benign network data.
Unsupervised Learning: Algorithms for unsupervised learning analyze unlabeled data, attempting to identify hidden structures or patterns [
13]. When it comes to identifying unfamiliar or new dangers that might not be included in training data, these algorithms are especially helpful. Unsupervised learning methods like anomaly detection and clustering can assist IDSs in detecting odd activity that may be a sign of security breaches.
Semi-supervised Learning: By using both labeled and unlabeled data for training, semi-supervised learning incorporates aspects of supervised and unsupervised learning, as per [
10]. This method works well in situations where obtaining labeled data is difficult or costly. By harnessing the benefits of both supervised and unsupervised methods, semi-supervised learning in IDSs can raise detection accuracy.
Deep Learning: Raw network traffic or system logs can be analyzed by deep learning models, which can then extract high-level features that point to potential security risks. As mentioned in the study by [
14], in IDSs, convolutional neural networks (CNNs) and recurrent neural networks (RNNs) are frequently employed for tasks, including malware classification and intrusion detection.
All these approaches to learning from existing data and predicting the outcomes in the new data are suitable and find their applications in varying ways. Not all these approaches are suitable for datasets or environments that vary the nature and amount of data that these algorithms operate upon.
Table 1 shows a comparison of machine learning algorithms.
4. Research Methodology
This section describes the research pathway that will be implemented to explore the answers to our research questions and fulfil the research objectives. We will discuss the complete arc of this research, starting from the literature selection and its analysis to the way we select and work with the proposed dataset, and finally the anomaly detection algorithms and methods used for this research.
5. Experimental Analysis and Discussion
5.1. System Description
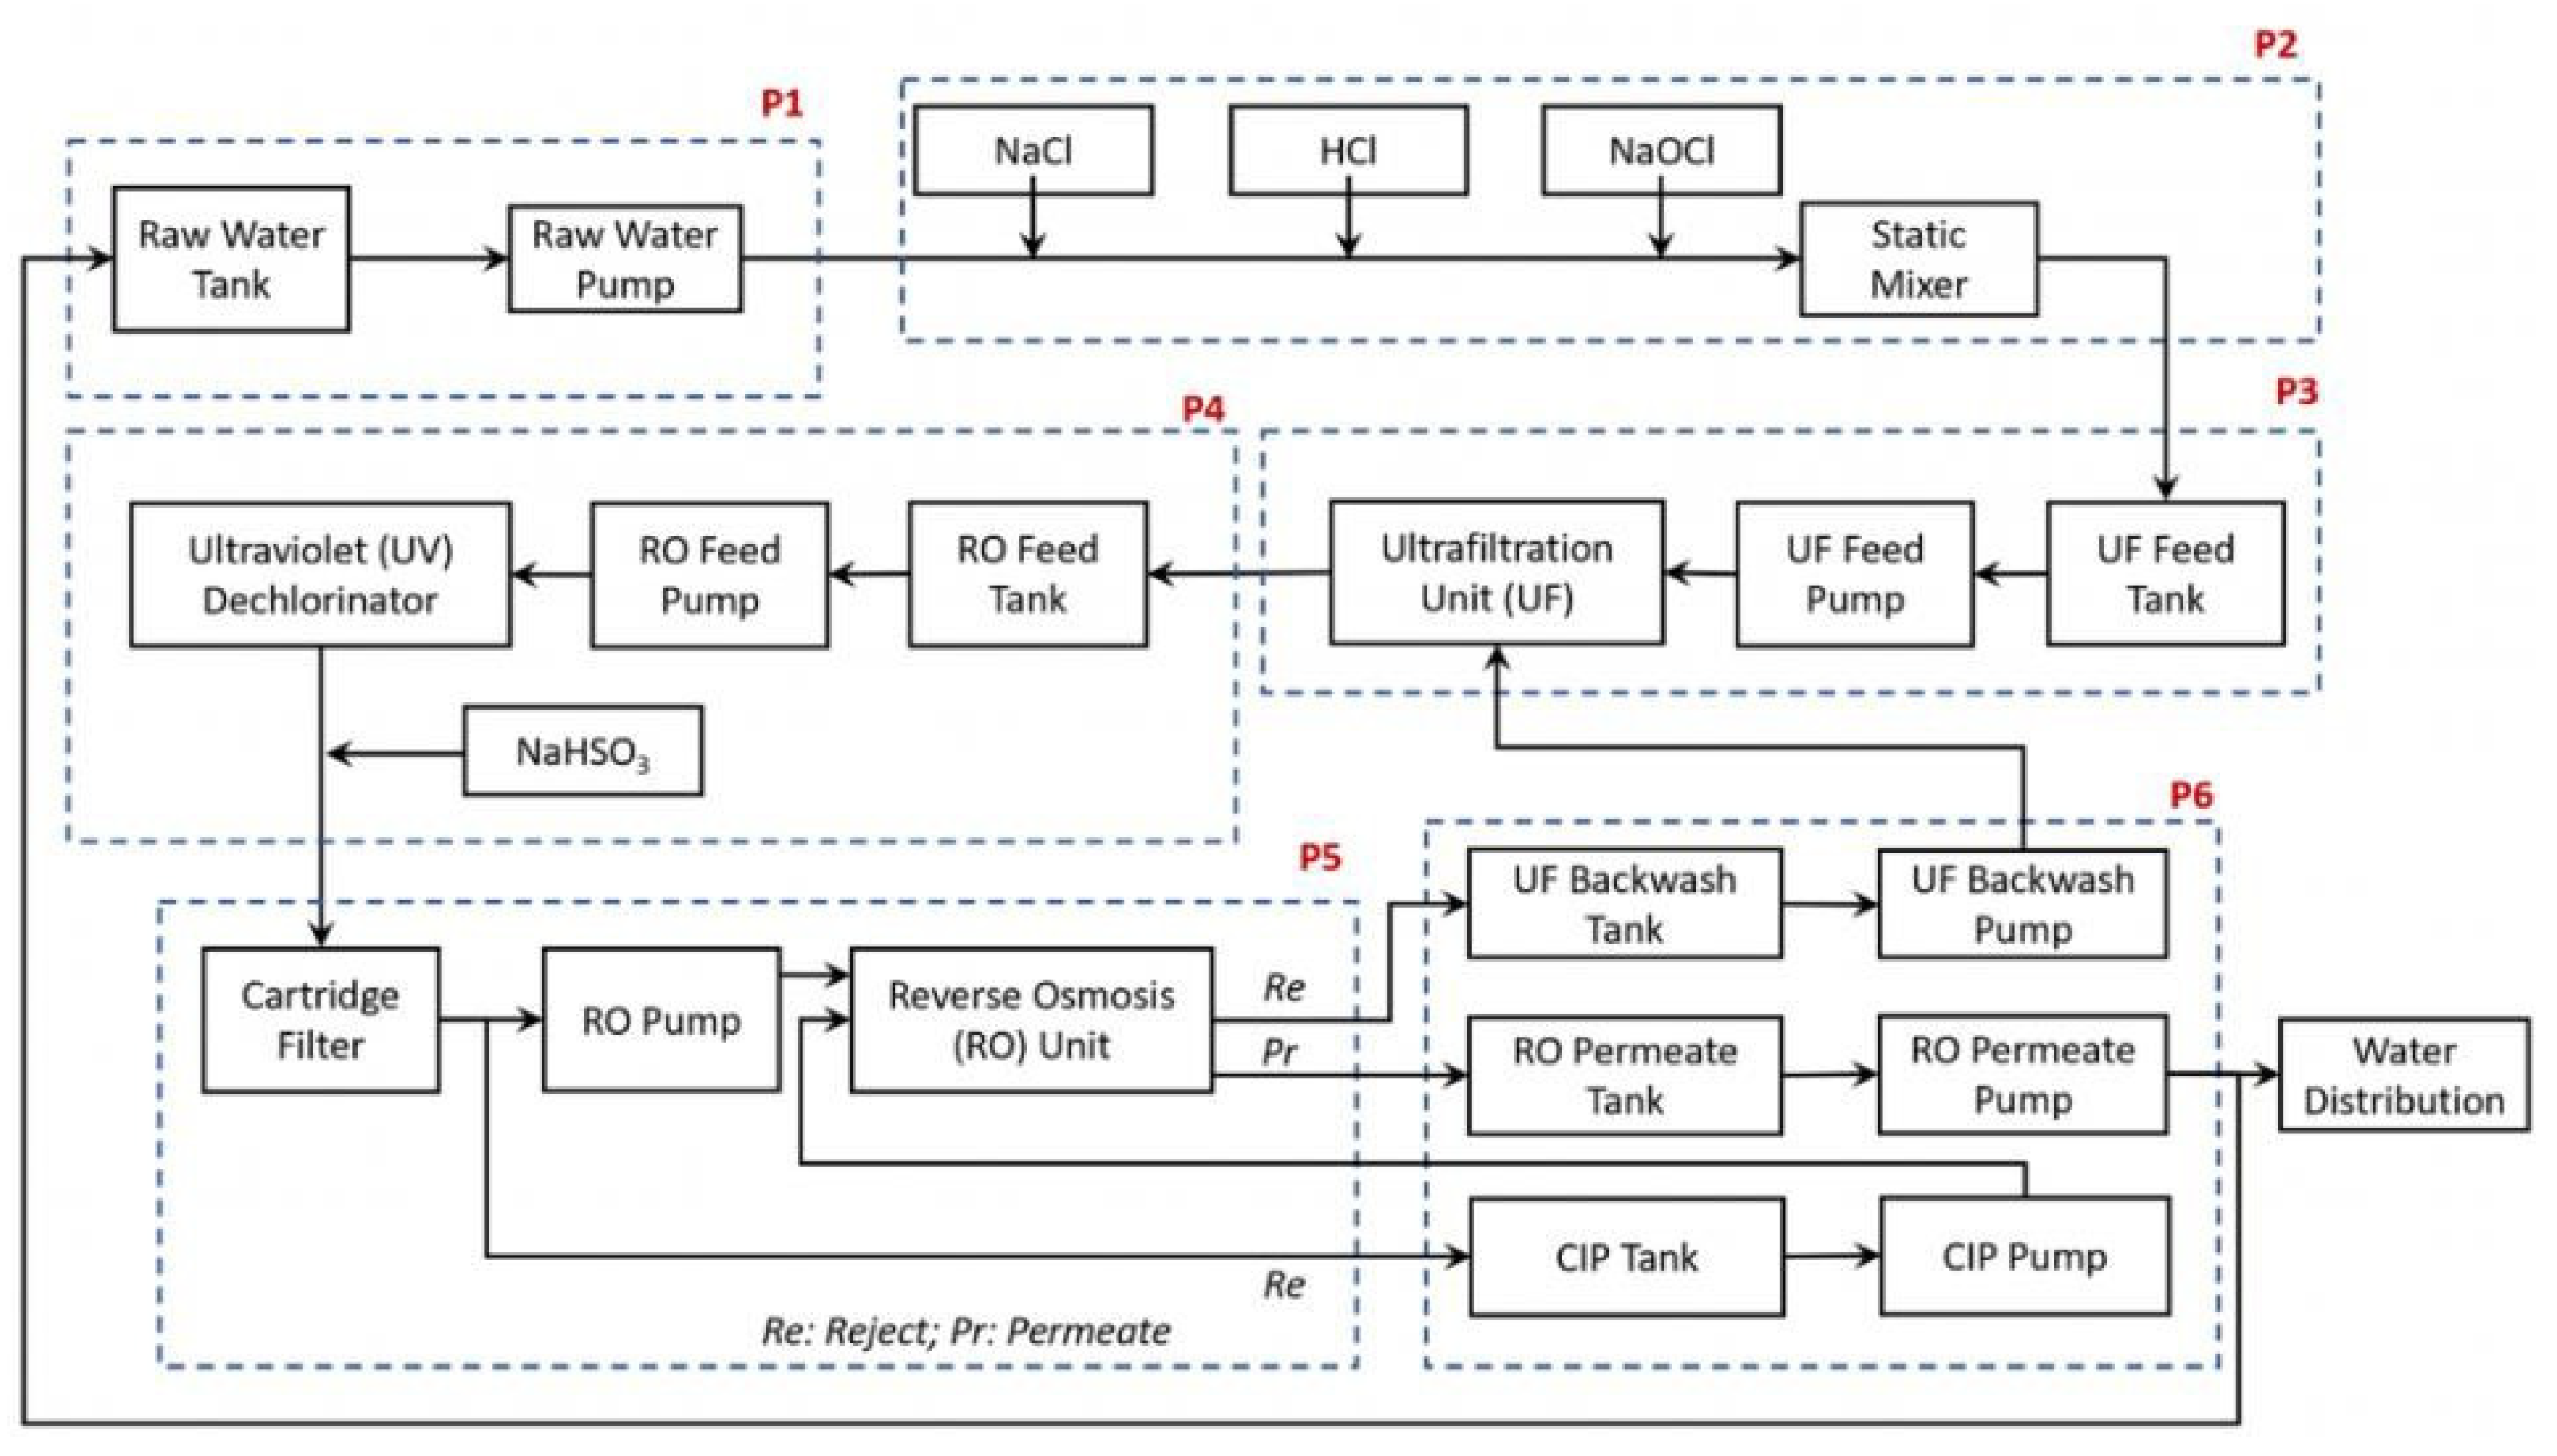
The Secure Water Treatment (SWaT) testbed is an actual-world environment designed for examining and experimentation within the domain of industrial control system (ICS) security. It serves as a simulation of a water treatment plant, mimicking the processes and infrastructure found in real-world critical infrastructure systems.
The SWaT testbed consists of various components that replicate the functionalities and processes of a typical water treatment plant. These components include the following:
Pumps and Valves:
The testbed comprises pumps and valves responsible for controlling the passage of water through various phases of the treatment process. These components are critical for regulating water pressure and ensuring the smooth operation of the system.
Tanks and Reservoirs:
Tanks and reservoirs store water at various stages of the treatment process. Their function is essential in preserving a steady flow of water and facilitating the different treatment procedures.
Sensors and Actuators:
Sensors are distributed throughout the testbed in order to gather information regarding various parameters like water flow, pressure, temperature, and chemical levels. Actuators are devices that respond to sensor data by controlling the operation of pumps, valves, and other components.
Control Systems:
The control systems in the SWaT testbed oversee the operation of the entire water treatment process. They take data from sensors, process the data using preset algorithms, and then instruct actuators to change the parameters of the system as necessary. The process testbed chart is shown in
Figure 2.
The Secure Water Treatment (SWaT) testbed is designed for emulating the functioning of a contemporary water treatment plant, comprising six distinct processes aimed at purifying water for potable use. Each stage in the SWaT testbed performs a vital part in the treatment process, guaranteeing the removal of impurities and the provision of clean, safe water to users.
Raw Water Intake (P1):
This stage controls the inflow of untreated water into the treatment system. A valve regulates the movement of water into the untreated water tank from the inflow pipe, where it awaits further processing.
Chemical Disinfection (P2):
In this stage, the raw water undergoes chemical treatment for disinfection purposes. Chlorination is performed using a chemical dosing station, which adds chlorine to the water to eliminate pathogens and bacteria.
Ultrafiltration (P3):
The water treated in the previous stages is sent to an Ultra-Filtration (UF) feed water storage unit. Here, a UF feed pump propels the water through UF membranes, removing suspended solids, microorganisms, and other impurities.
Dichlorination and Ultraviolet Treatment (P4):
Prior to passing through the reverse osmosis (RO) unit, the water undergoes dichlorination to remove any residual chlorine. Ultraviolet (UV) lamps are used for this purpose, controlled by a PLC. Additionally, sodium bisulphate may be added to regulate the Oxidation Reduction Potential (ORP) of the water.
Purification by Reverse Osmosis (P5):
After being dechlorinated, the water is filtered through three stages of reverse osmosis. RO membranes remove dissolved salts, organic compounds, and other contaminants, producing purified water that is reserved in an absorbent tank.
Ultrafiltration Membrane Backwash and Cleaning (P6):
This stage is responsible for maintaining the efficiency of the UF membranes by periodically cleaning them through a backwash process. A UF backwash pump initiates the cleaning cycle, which is triggered automatically based on differential pressure measurements across the UF unit.
Throughout these stages, various sensors and actuators collect data and control the operation of the equipment. PLCs (Programmable Logic Controllers) play a central role in orchestrating the treatment process, monitoring sensor readings, and executing control algorithms to ensure optimal performance and safety. Sensor data is logged and transmitted for real-time monitoring and analysis, facilitating the detection of anomalies or deviations from expected behavior.
5.4. Data Pre-Processing of the SWaT Dataset
Upon receipt of the SWaT dataset in XLSX format, it underwent several preprocessing steps to ensure its suitability for analysis. Initially, the dataset was converted to CSV format for ease of handling. Subsequently, rigorous data cleaning procedures were implemented, including the removal of extraneous markings and headers. Quality checks were conducted to identify and address missing values (NaN) and outliers.
Normalization techniques were applied to features exhibiting high variance, ensuring uniformity and comparability across the dataset. Furthermore, features with discrete states were encoded using techniques such as one-hot encoding and label encoding to facilitate compatibility with machine learning algorithms.
The removal of sensor components and actuator values that remained constant throughout the dataset was carefully considered to reduce the possibility of overfitting of the machine leaning models. These unchanging values could potentially bias machine learning models, leading to inaccurate results.
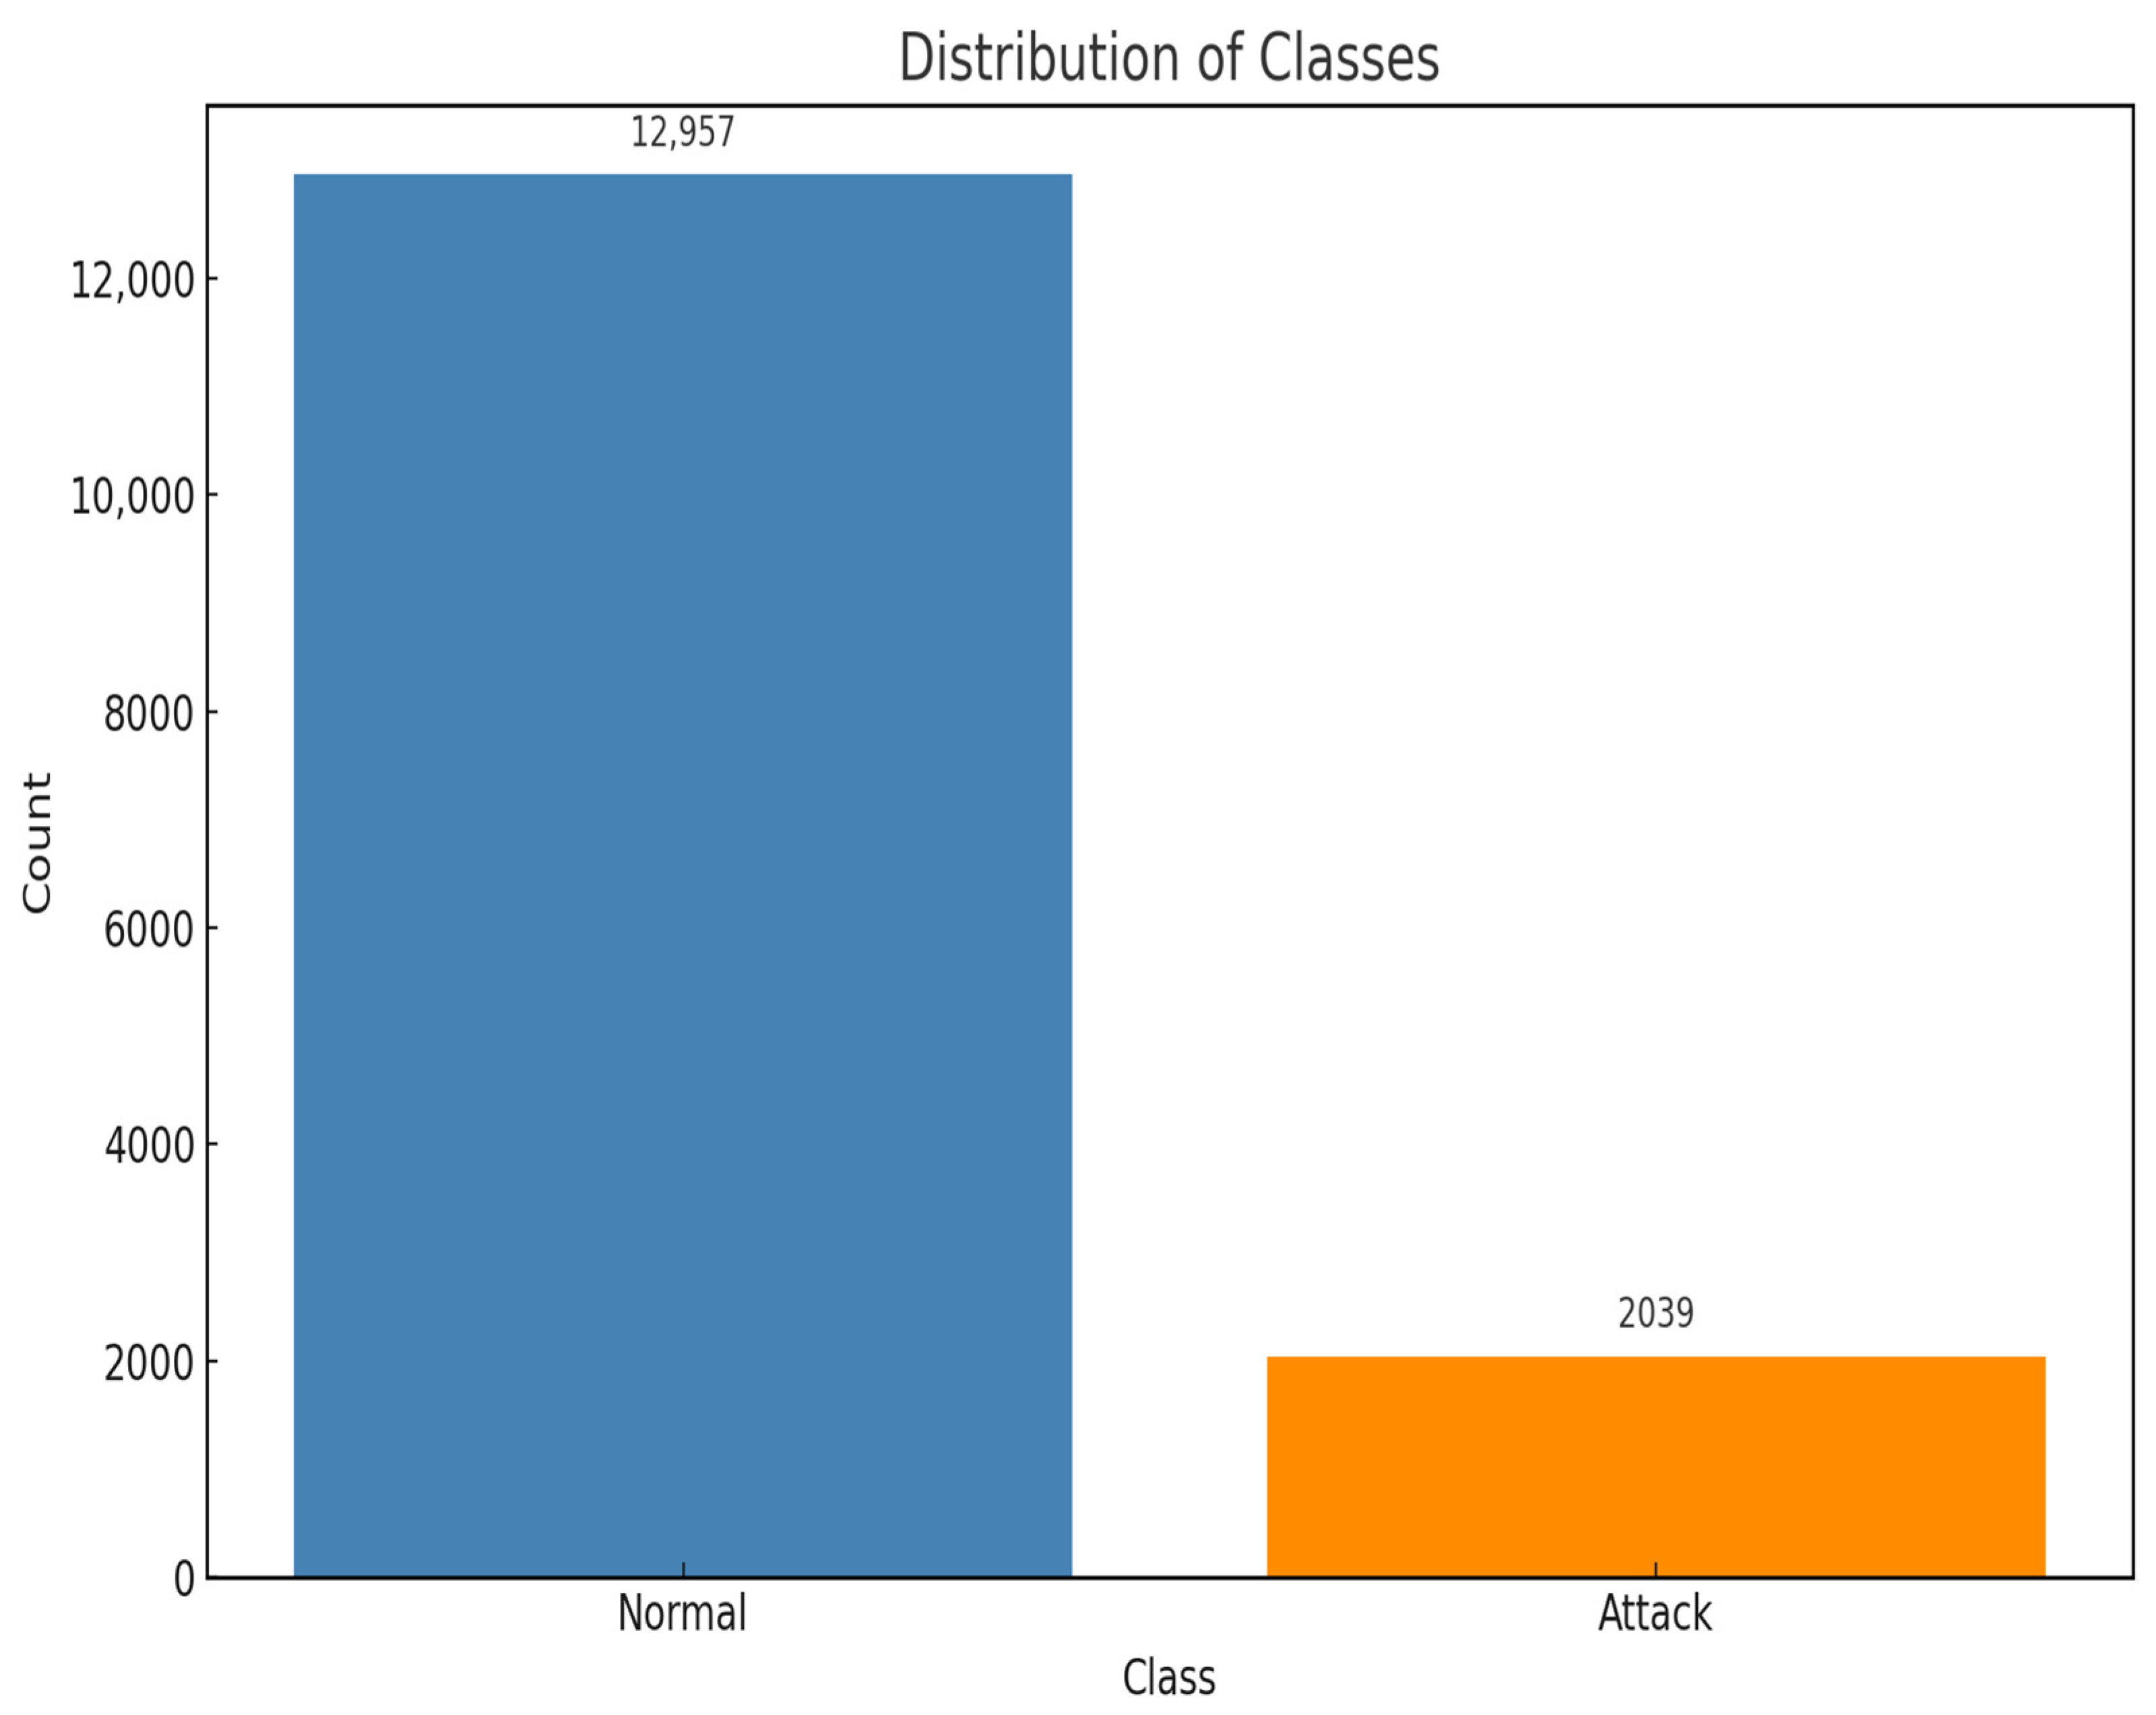
Additionally, timestamp data within the dataset was standardized to a consistent datetime format, enabling easier manipulation and analysis. To facilitate supervised learning tasks, an “Attack” column was added to the dataset, labelling data corresponding to periods of simulated attacks as provided within the dataset documentation. The addition of the attack column was necessary for classification in the algorithms used for anomaly detection. This was performed based on the timestamp data of attack initiation and termination provided by iTrust along with the dataset. After adding the attack labels, the volume of normal and attack classes was checked. It was discovered that there was a severe class imbalance in the dataset when it came to normal and attack classes. In machine learning, class imbalance is a prevalent problem [
40], predominantly in scenarios where one class (“normal” instances) heavily outweighs the other class (“attack” instances). Addressing class imbalance in machine learning datasets, particularly in scenarios where one class significantly outweighs the other, is crucial to prevent biased models and ensure accurate predictions. As per the research by [
41], several methods are commonly employed to mitigate class imbalance before utilizing machine learning algorithms for classification. Resampling techniques try to balance the class distribution by either replicating instances from the minority class, deleting instances from the majority class, oversampling the minority class, or under sampling the majority class. Class imbalance can be addressed by algorithms, such as ensemble techniques like Random Forest and Gradient Boosting, which give misclassified instances of the minority class more significance during training. Assigning varying costs to misclassification errors for every class is a component of cost-sensitive training, encouraging models to focus on correctly predicting the minority class instances, as mentioned by [
42]. Additionally, techniques for detecting anomalies handle the minority class as anomalies or outliers, identifying deviations from the majority class as anomalies.
Figure 3 shows the distribution of classes in the dataset.
Ref. [
43] states that while the methods mentioned above can help mitigate class imbalance, they may not always be suitable for real-world critical infrastructure datasets due to concerns about data integrity, impact on performance, and the cost of misclassification. Generating synthetic data or undersampling the majority class can compromise data integrity, while oversampling techniques may lead to overfitting and poor generalization performance. Moreover, this sentiment is reinforced in the study by [
44], which outlines that the misclassification of attacks as normal behavior (false negatives) can have severe consequences in critical infrastructure, necessitating careful consideration of the costs associated with misclassification errors. Therefore, when working with real-world critical infrastructure datasets, it is essential to evaluate the implications of addressing class imbalance and choose appropriate methods that prioritize model robustness, reliability, and interpretability. Expert input and domain knowledge play a crucial role in making informed decisions about how to handle class imbalance effectively while mitigating the risks associated with misclassification. Owing to these reasons, it was decided to not address the class imbalance to achieve results as close to real-world scenarios as possible.
5.6. Machine Learning Implementation and Discussion
A one-dimensional CNN is suitable for the detection of anomalies in critical infrastructure owing to its capability to capture local patterns and dependencies in sequential data. By applying convolutional filters along the temporal dimension, as stated in [
45], 1D CNNs can identify subtle deviations or irregularities indicative of security breaches or system anomalies. Additionally, 1D CNNs can capture intricate temporal patterns because they automatically learn structured representations of the input data and the relationships present in critical infrastructure data, further enhancing their anomaly detection capabilities.
We began the analysis by strategically exploring the best configuration for the model to achieve the best performance with the minimum cost to the system.
In our study, we experimented with various hyperparameters, shown in
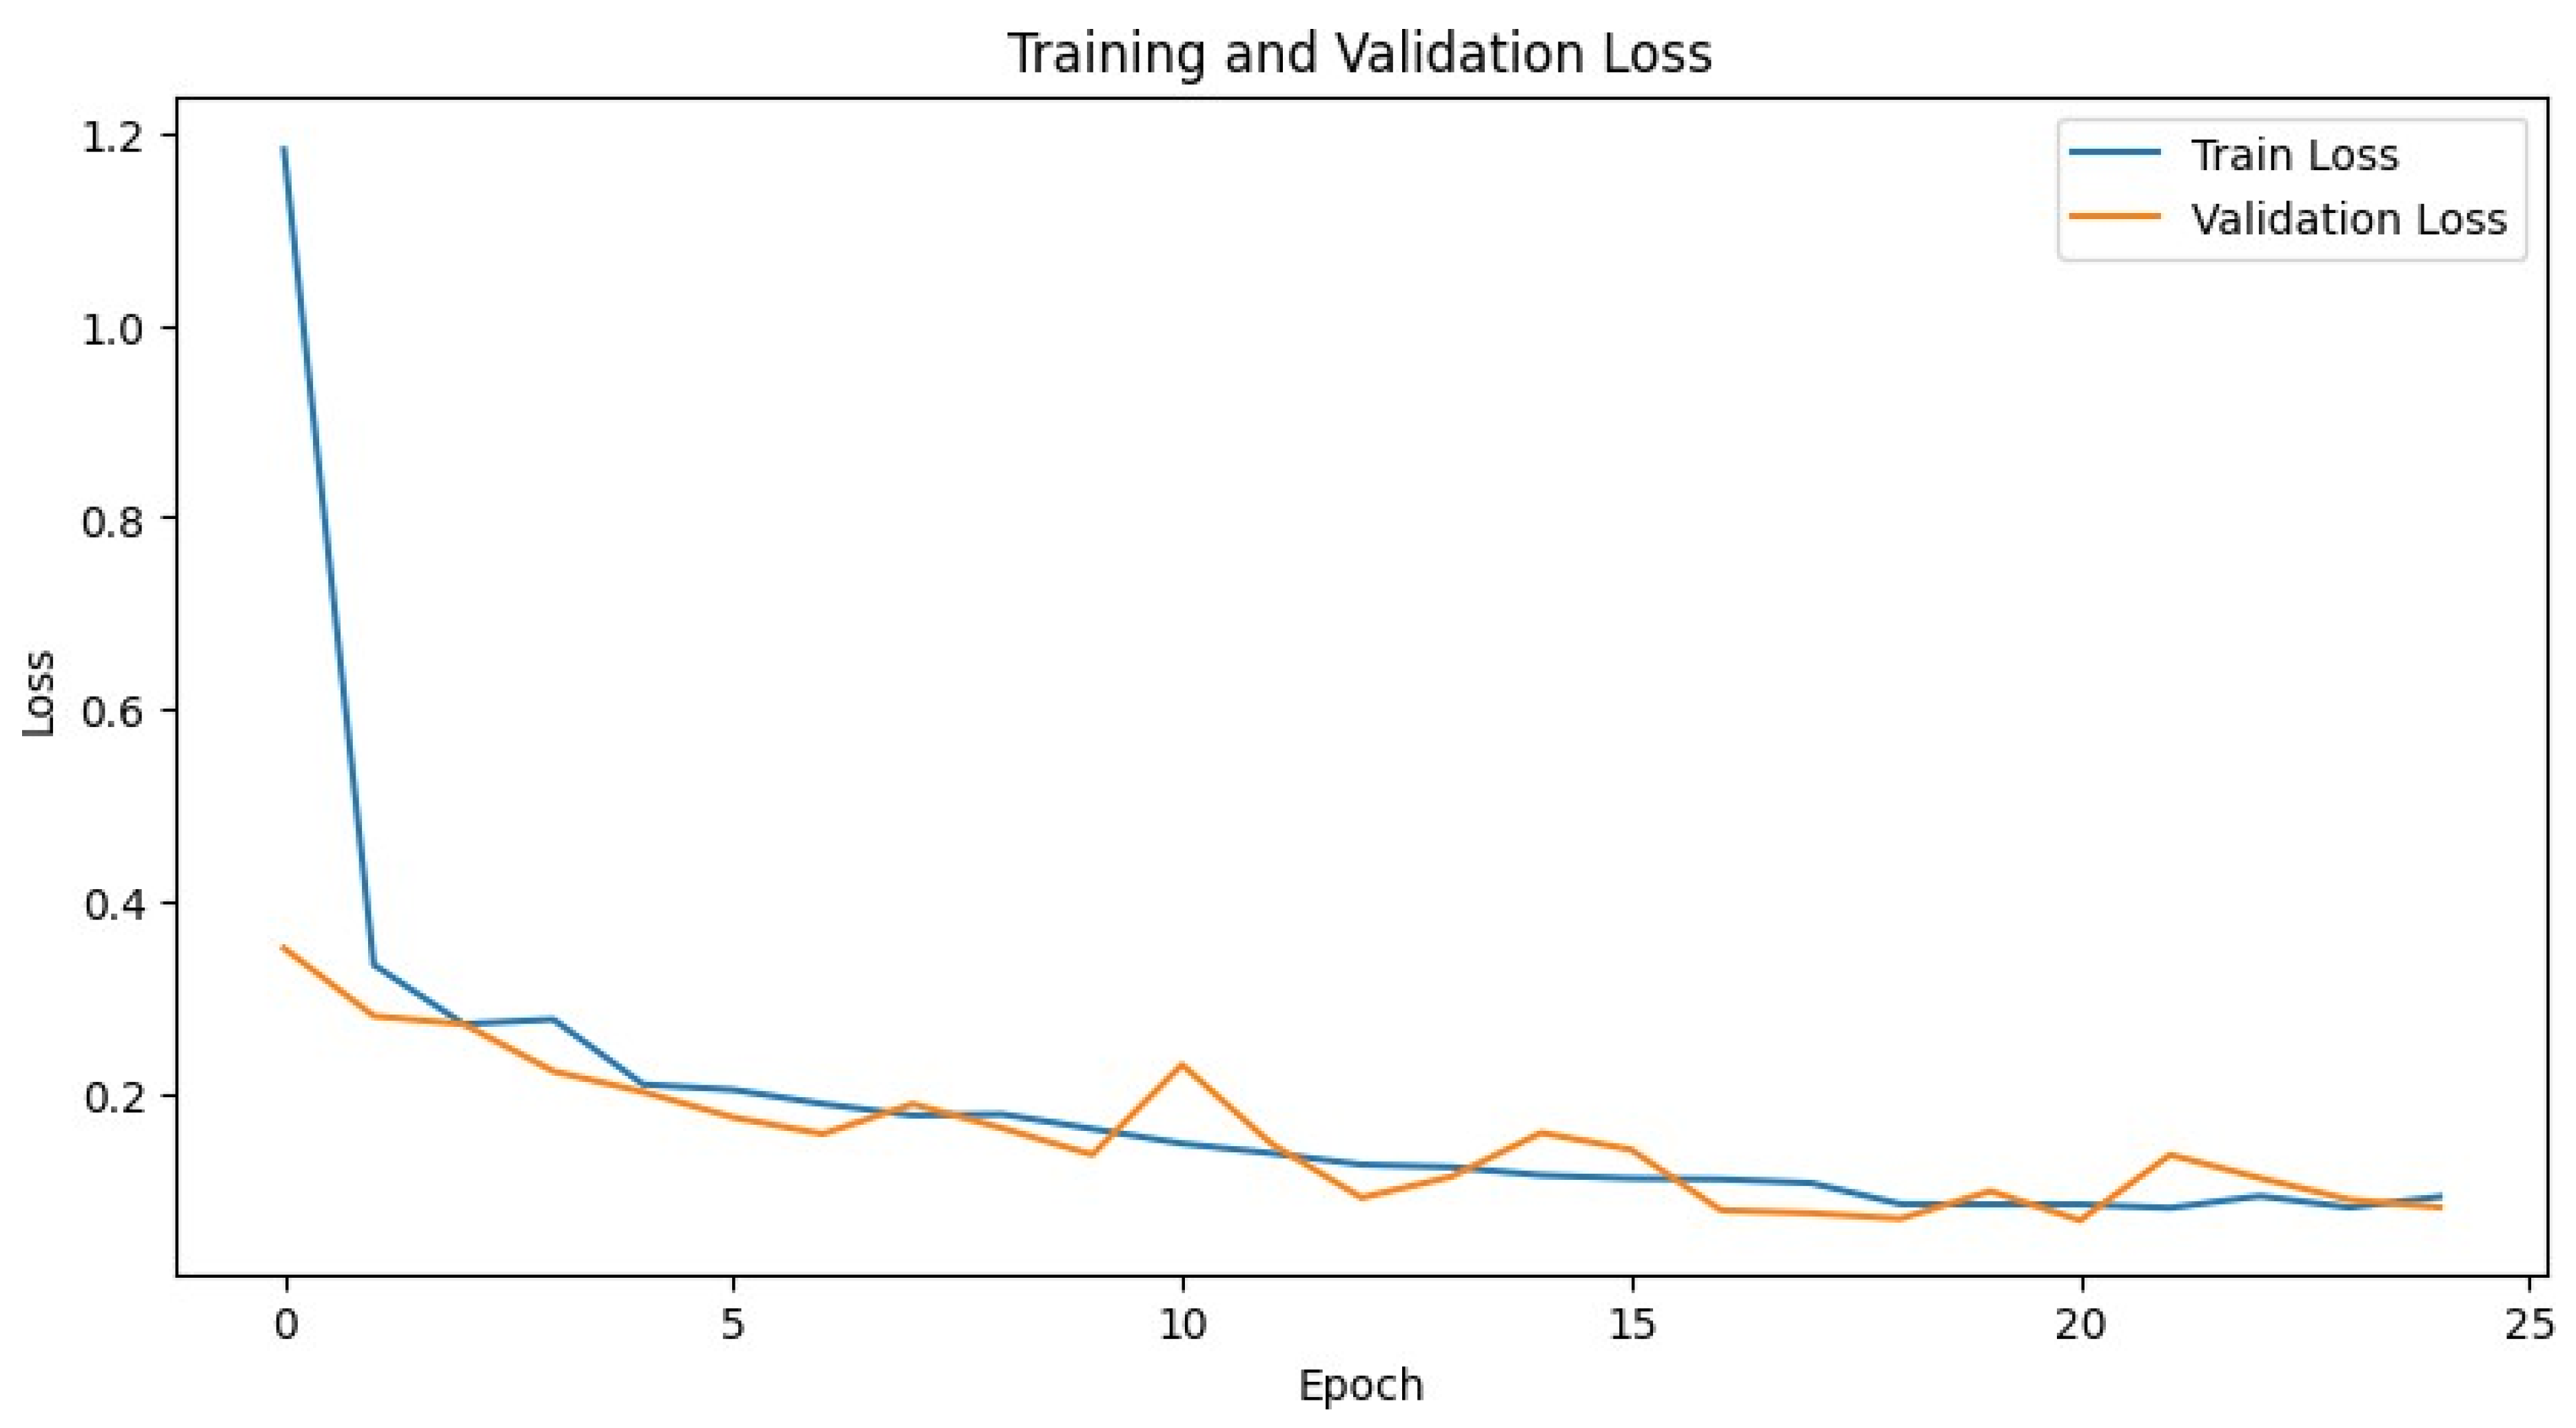
Table 3, to optimize the performance of the 1D CNN. The selected configuration (parameters in bold) included the Adam optimizer, 64 filters, a kernel size of 7, a dropout rate of 0.2, 25 epochs, and a batch size of 32. These hyperparameters were chosen based on their ability to balance training speed and model accuracy while preventing overfitting.
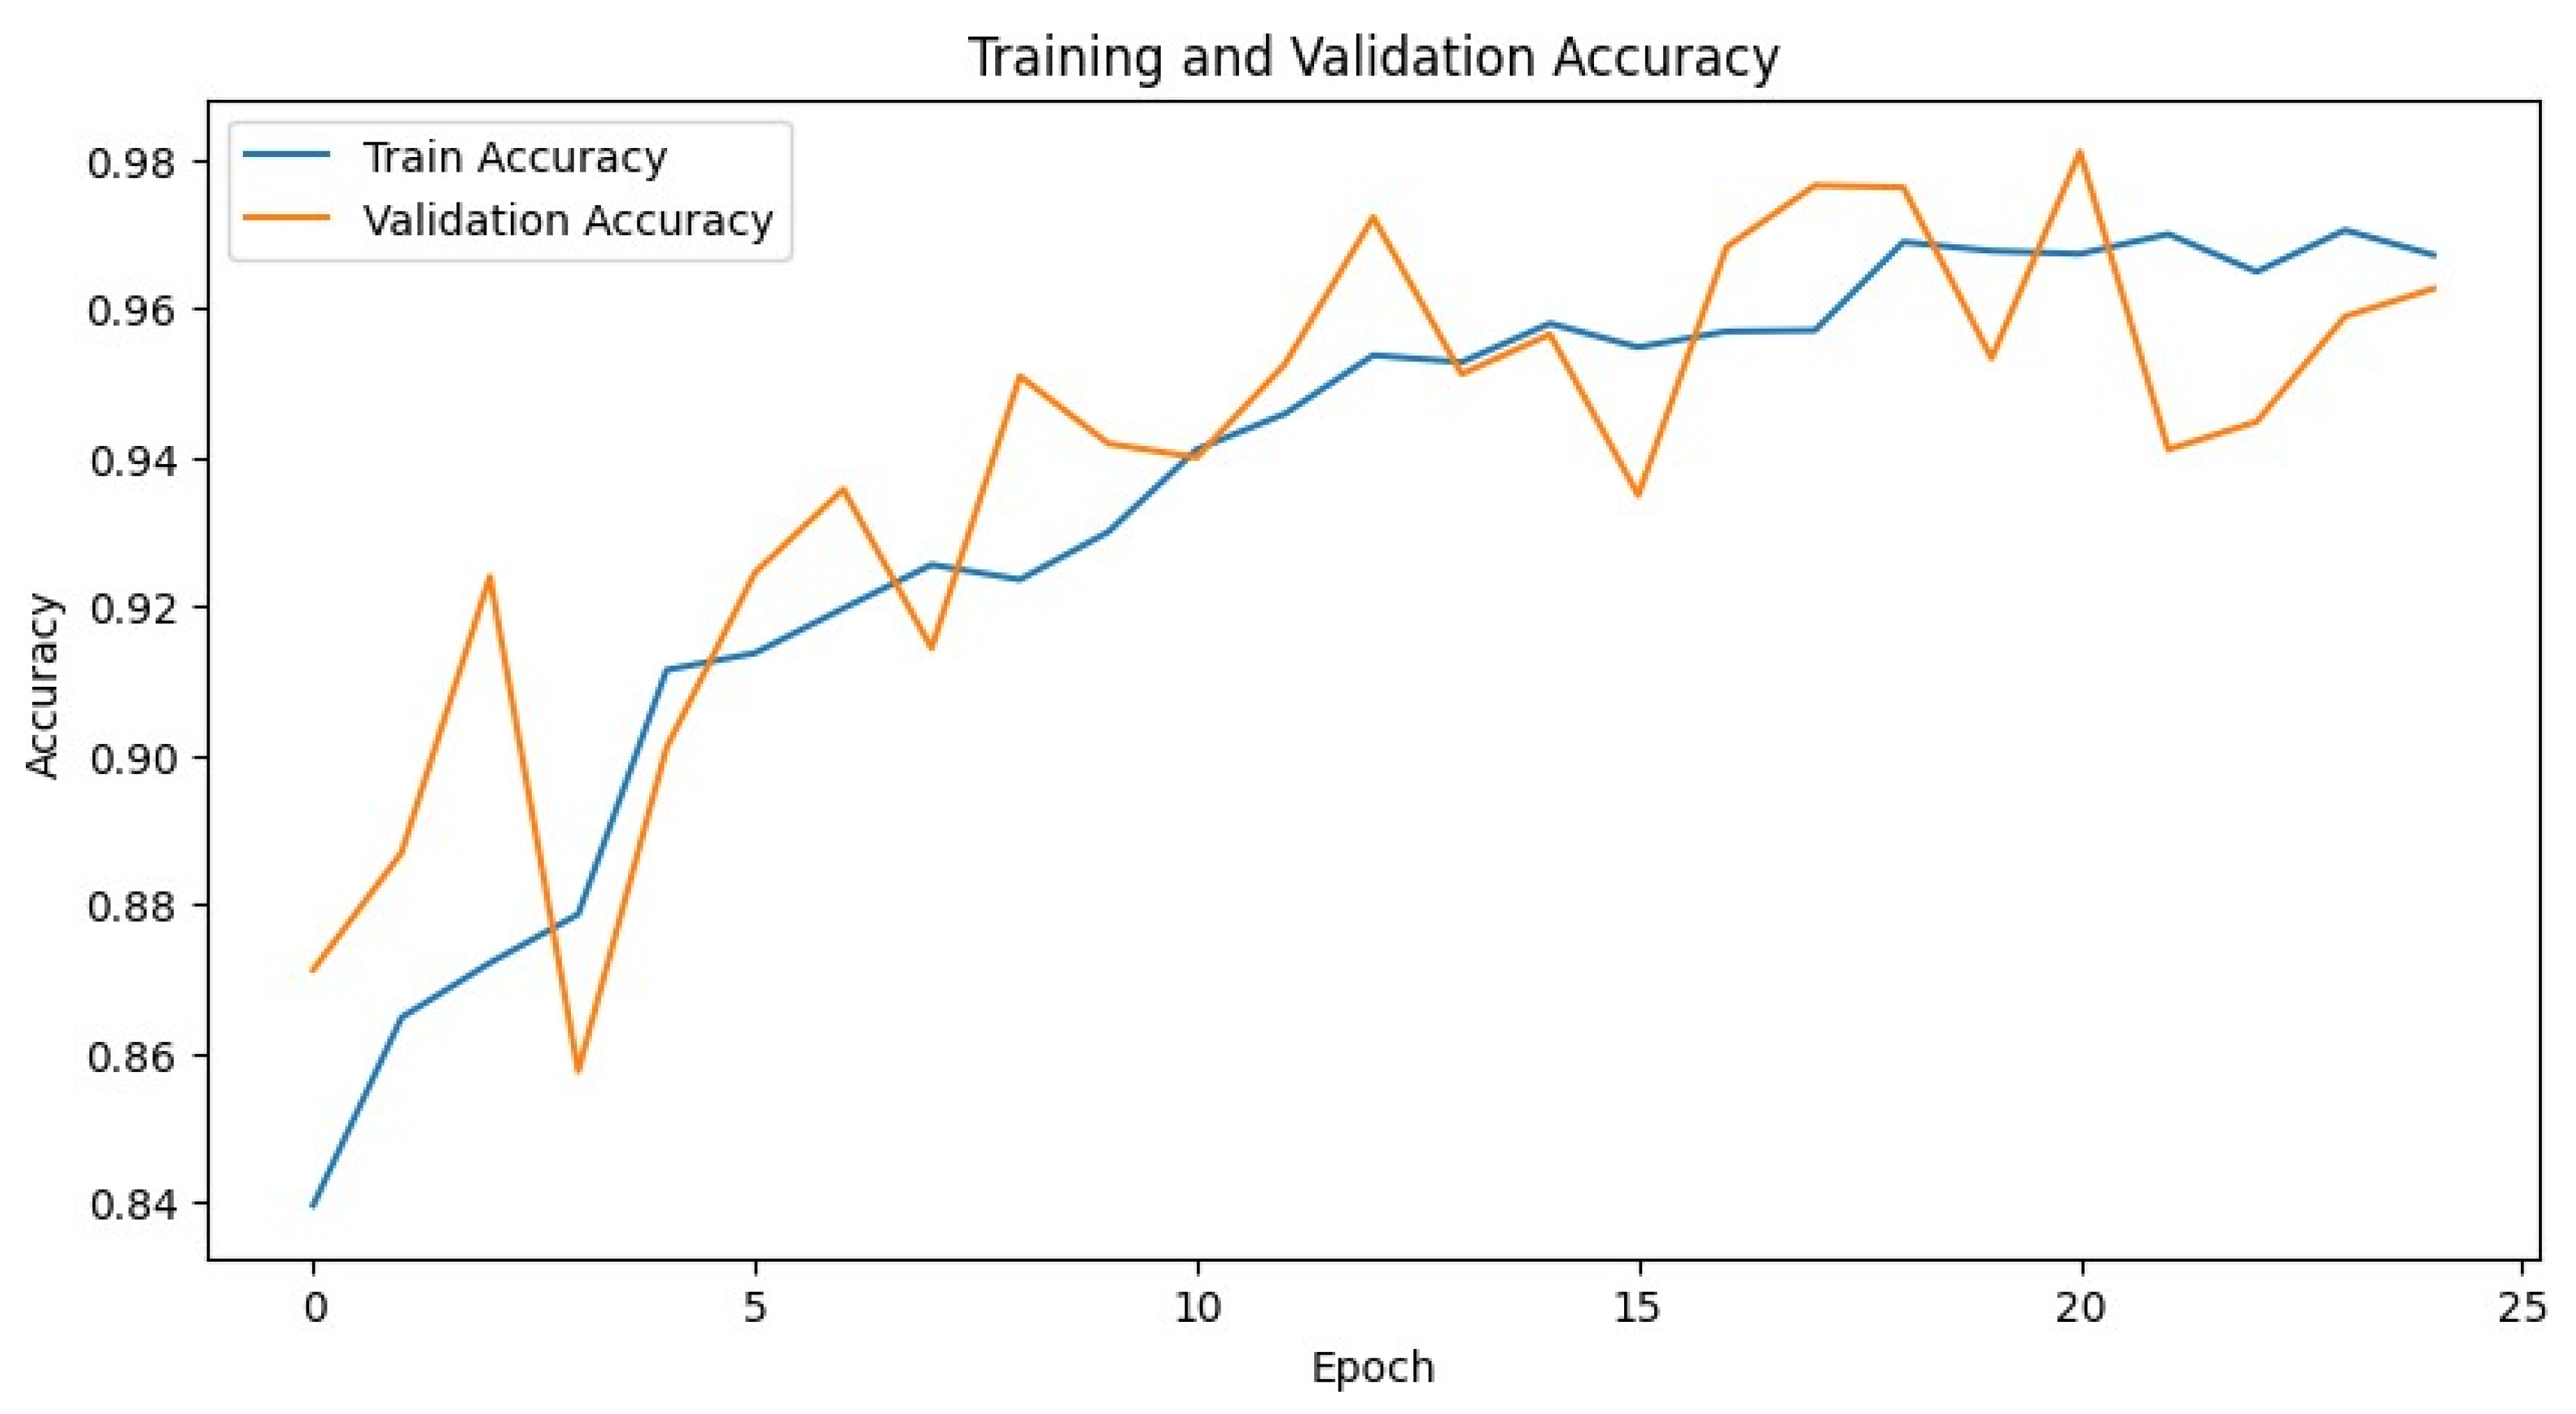
Figure 4 shows the training and validation loss for the 1D CNN, and
Figure 5 shows its training and validation accuracy.
One of the key strengths of the 1D CNN is its ability to capture temporal patterns and dependencies in data. This is particularly important for the SWaT dataset, where the sequence of events and time-stamped sensor readings play a critical role in identifying anomalies. By using convolutional layers, the 1D CNN can automatically learn and extract relevant features from the raw data, reducing the need for extensive manual feature engineering.
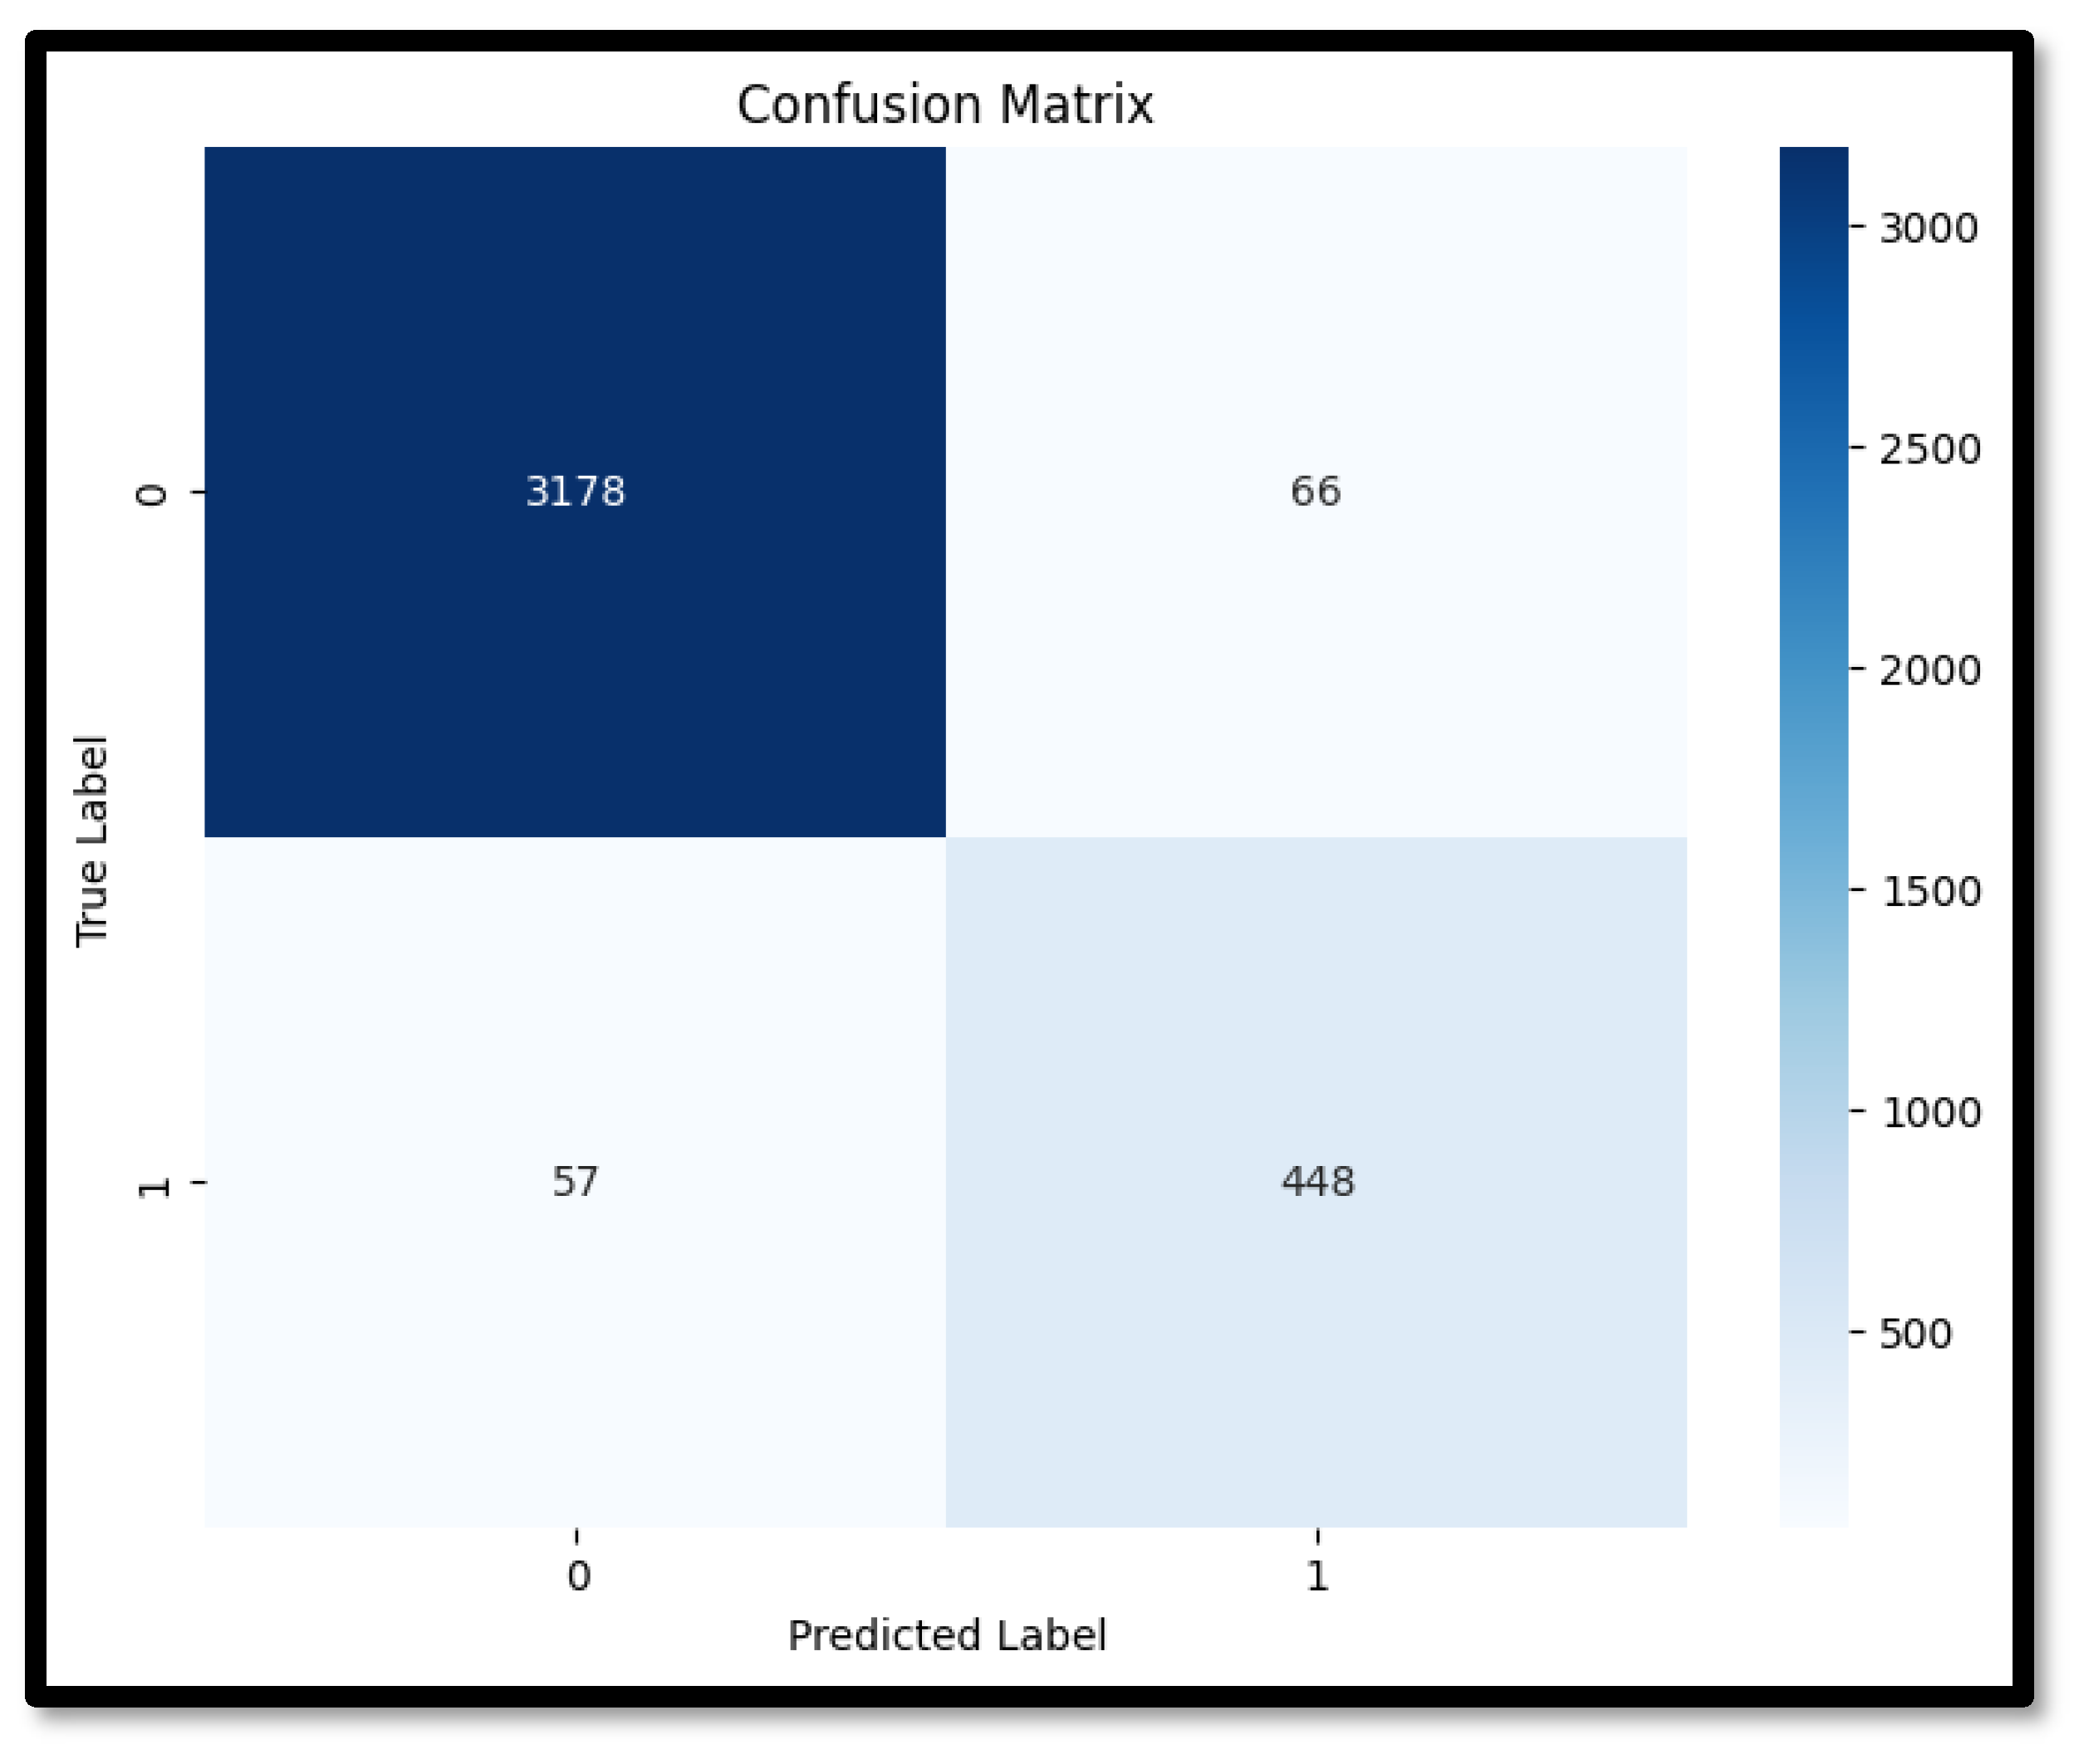
Table 4 lists the performance results for 1D CNN. The accuracy of 96.71% indicates that the 1D CNN can reliably distinguish between normal and anomalous events, making it a valuable tool for monitoring and protecting critical systems—the SWaT testbed in this instance. The precision of 87.35% reflects the model’s effectiveness in correctly identifying true-positive anomalies, reducing the occurrence of false positives, which is essential for maintaining operational efficiency and avoiding unnecessary disruptions. The recall of 89.81% shows that the model can detect a high proportion of actual anomalies, ensuring that potential security threats are identified promptly. The F1 score of 88.13% balances precision and recall, providing a comprehensive measure of the model’s overall performance. The Confusion matrix for the 1D CNN is shown in
Figure 6.
However, the 1D CNN also has some limitations. Training deep learning models like CNNs can be computationally intensive and time-consuming, requiring significant processing power and memory resources. This can pose challenges in real-time monitoring scenarios where rapid detection and response are crucial. Additionally, deep learning models can be difficult to interpret, making it challenging to understand and explain their decision-making processes. This lack of transparency can be a drawback in critical infrastructure applications, where accountability and explainability are important for ensuring trust and compliance.
Despite these challenges, the 1D CNN’s ability to handle large volumes of sequential data and its strong performance metrics make it a promising candidate for anomaly detection in critical infrastructure. Its ability to learn and adapt to complex patterns in the data provides a significant advantage over traditional methods, which may struggle to capture the same level of detail and nuance.
In the context of existing research, our findings align with studies that have demonstrated the effectiveness of CNNs for anomaly detection in time-series data. For example, Ref. [
21] emphasized the utility of CNN-based models in detecting anomalies in industrial control systems, showing their potential in improving security and reliability. Similarly, Ref. [
45] highlighted the advantages of using CNNs in critical infrastructure settings, noting their ability to process large-scale data efficiently and accurately. Furthermore, the work by [
44] demonstrated that CNNs could effectively detect cyberattacks in smart grid environments, reinforcing the model’s applicability to various critical infrastructure domains.
Overall, the 1D CNN offers a robust solution for detecting anomalies in critical infrastructure systems. Its ability to process and analyze sequential data, combined with its strong performance metrics, makes it a valuable tool for enhancing the security and resilience of these systems. However, the computational demands and interpretability challenges associated with deep learning models must be carefully managed to ensure their successful deployment in real-world applications.
5.6.1. Long Short-Term Memory (LSTM)
For our LSTM model, we chose to keep the feature selection and setup as close to the real-world scenario as possible. We initially chose even the static features to test the model, but that resulted in model overfitting. So as discussed in the research methodology, we chose to remove the static features and proceeded to build and train our model. We tested multiple sets of hyperparameters for the LSTM, and they are listed in
Table 5 with the selected parameters in bold. Unlike CNNs, which are typically used for spatial data, LSTM models are designed to capture temporal dependencies by maintaining a memory of previous inputs. This capability is crucial for identifying anomalies in datasets where the order and timing of events are important, such as the SWaT dataset.
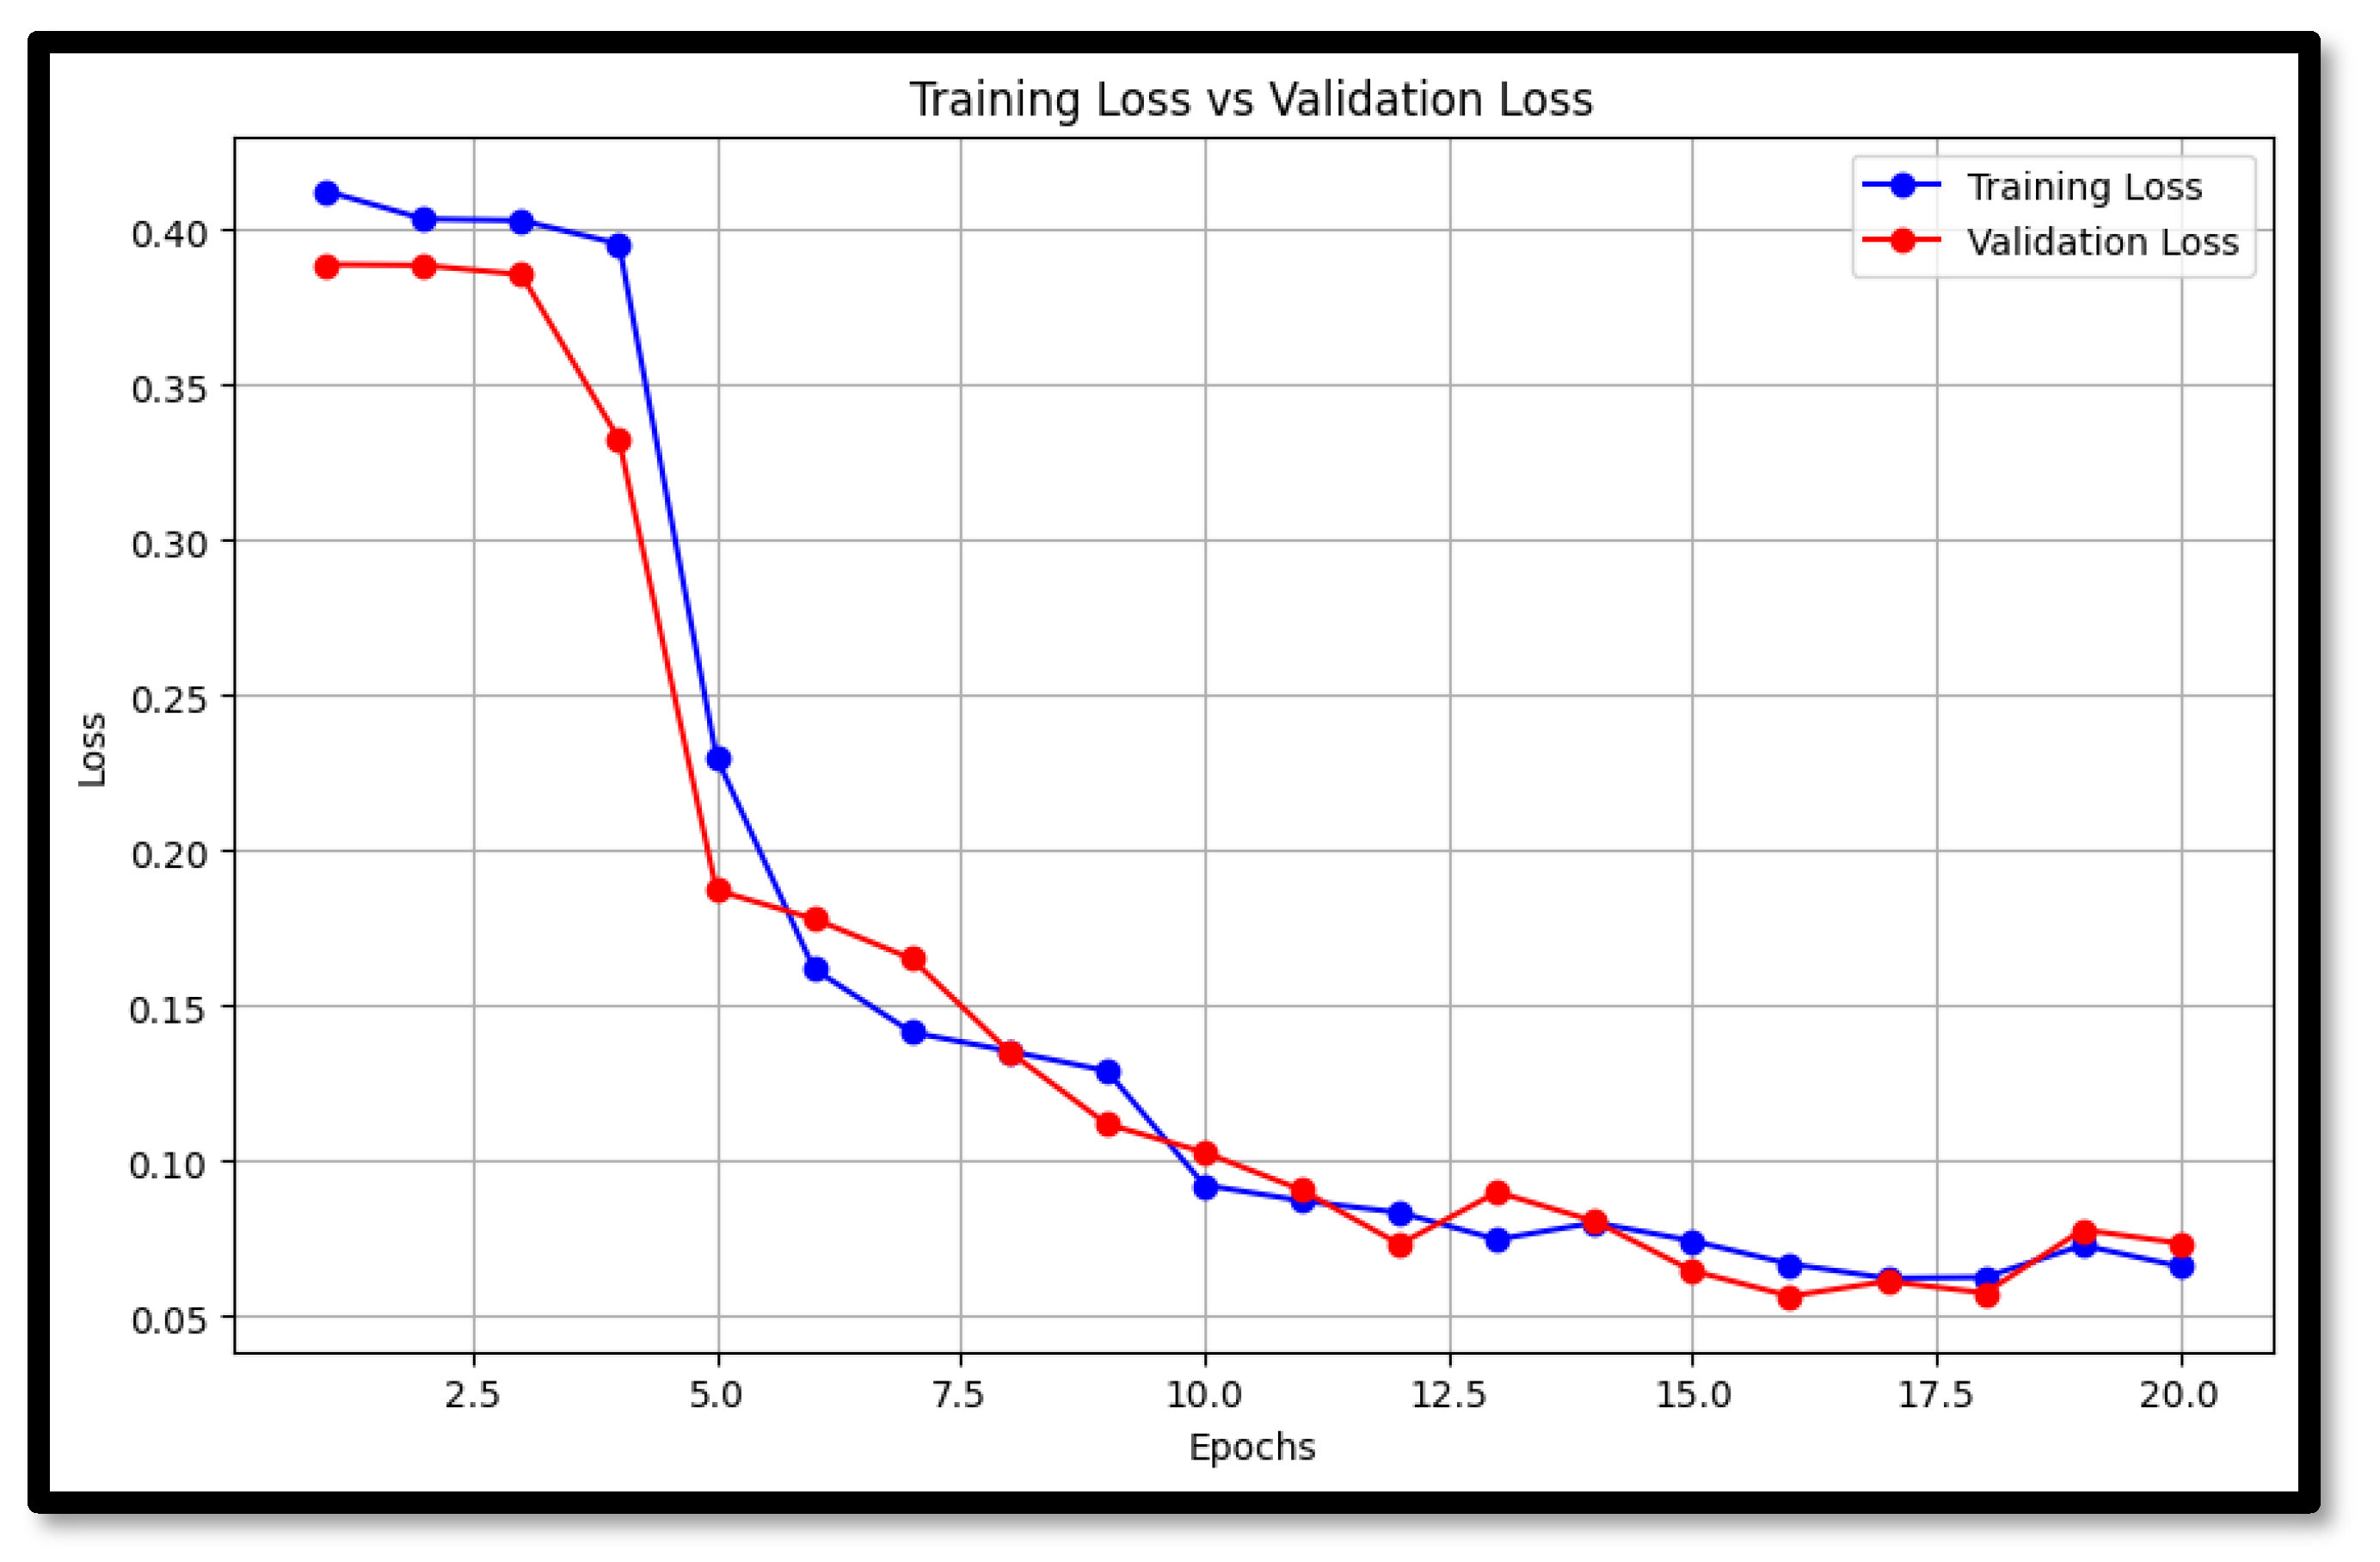
In this study, the LSTM model was configured with 128 units, a sequence length of 5, a batch size of 64, a learning rate of 0.001, 20 epochs, the Adam optimizer, and a single dense layer. These hyperparameters were selected to balance the complexity and performance of the model, ensuring it could effectively learn from the time-series data without overfitting. The training and validation loss for LSTM is shown in
Figure 7.
The following are the results from the optimal hyperparameter set of the LSTM model (
Table 6):
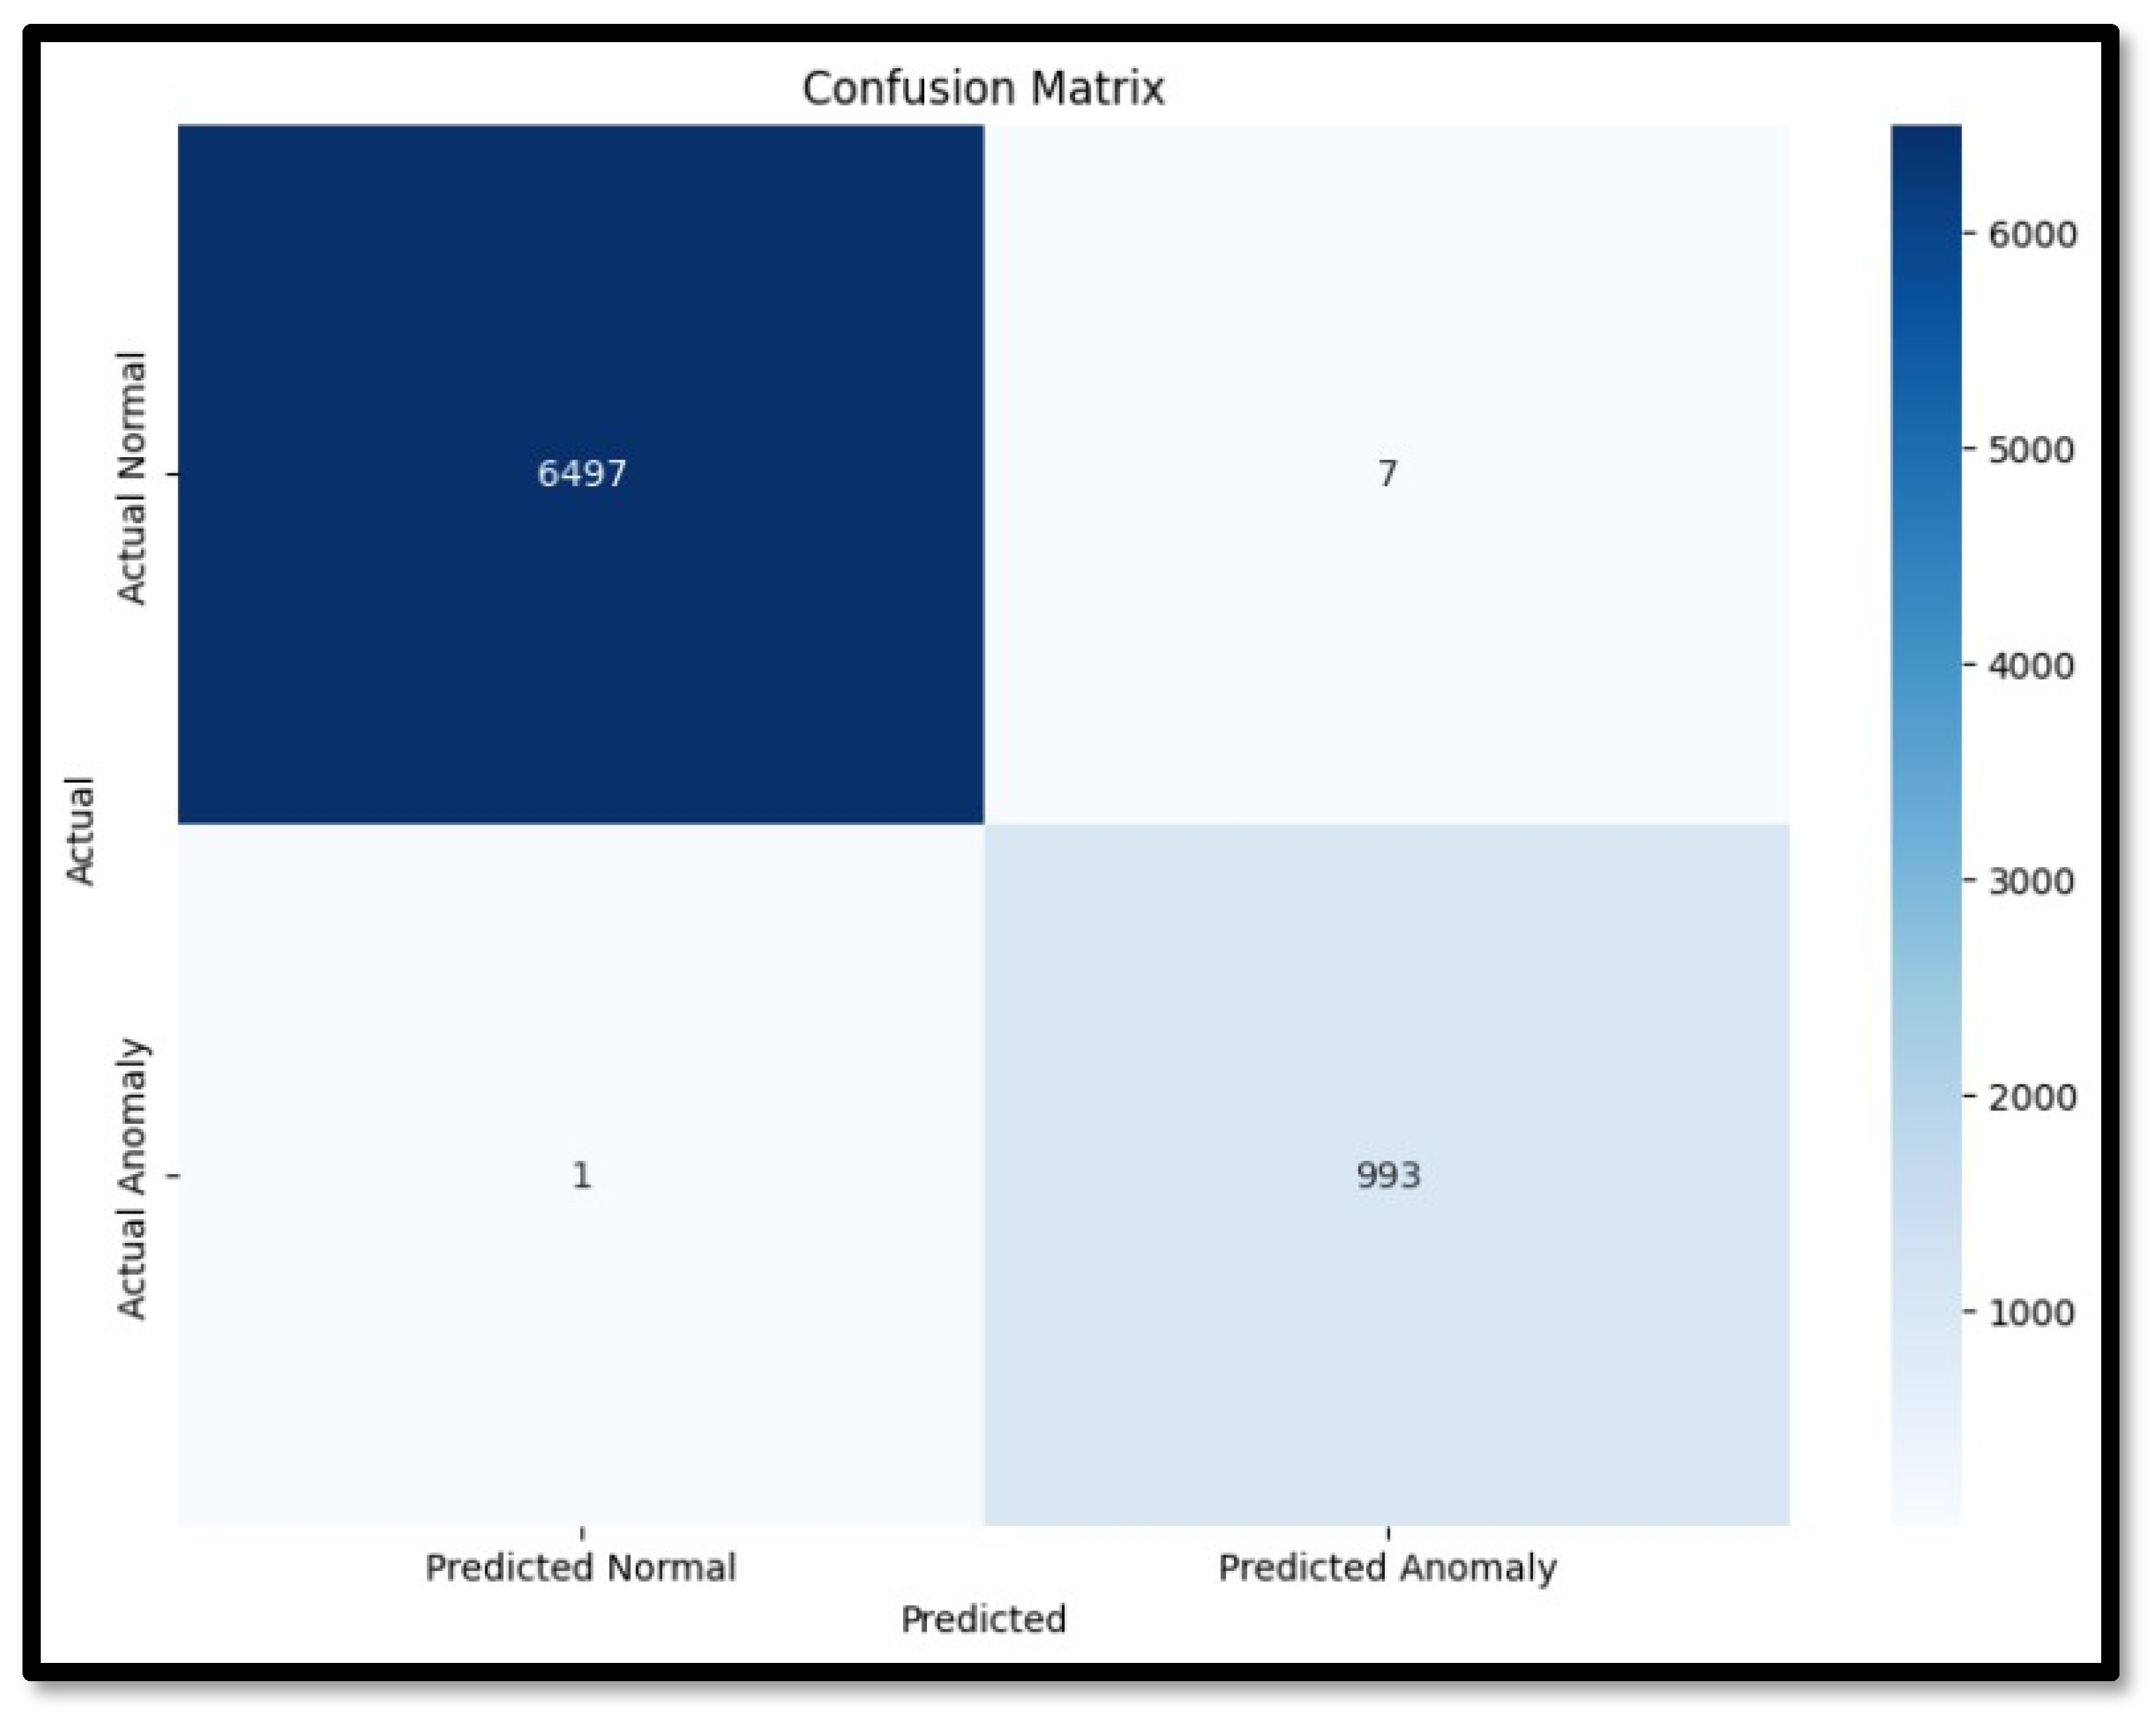
The high accuracy (97.22%) indicates LSTM’s proficiency in distinguishing between normal operation and attacks, which is critical for effective intrusion detection. Precision (96.39%) demonstrates the model’s ability to correctly identify true positives, minimizing false alarms and ensuring that security resources are allocated efficiently. The recall (81.80%) reflects the model’s capability to capture a significant proportion of actual anomalies, although there is still potential for improvement in detecting all threats. The F1 score (88.50%) provides a balanced measure of overall performance, incorporating both precision and recall. These results highlight LSTM’s ability to accurately detect anomalies in the SWaT dataset, which is essential for maintaining the security and operational integrity of critical infrastructure.
The primary advantage of LSTM is its ability to handle long-term dependencies and capture temporal patterns in data. This comes into effect on the SWaT dataset, where the sequence and timing of sensor readings are crucial for identifying anomalies. The memory cells in LSTM models allow them to retain important information over extended sequences, which provides a significant advantage over traditional anomaly detection methods that may not effectively capture such temporal dependencies.
However, LSTM models also present some challenges: the complex nature of LSTM models makes them difficult to interpret, posing challenges in understanding and explaining their decision-making processes. This lack of transparency can be a drawback in critical infrastructure applications, where accountability and explainability are essential for ensuring trust and compliance.
Despite these challenges, LSTM’s strong performance metrics and ability to handle sequential data make it a promising tool for anomaly detection in critical infrastructure. Its ability to learn and adapt to complex patterns in the data provides a significant advantage over traditional methods, which may struggle to capture the same level of detail and nuance.
In comparison to the 1D CNN, which focuses on spatial patterns, the LSTM’s strength lies in its ability to model temporal sequences. This makes it particularly effective for time-series data, where understanding the order of events is crucial. While the 1D CNN showed strong performance in anomaly detection, LSTM’s ability to remember and utilize past information offers a complementary approach that enhances its overall detection capability. The Confusion matrix for LSTM is shown in
Figure 8.
Our findings align with existing research highlighting the effectiveness of LSTM models for anomaly detection in time-series data. For example, Ref. [
46] demonstrated the superiority of LSTM models over traditional models for sequence prediction and anomaly detection in industrial systems, showcasing their potential for improving security and reliability [
46]. Similarly, Ref. [
27] emphasized the advantages of using LSTM models for detecting cyberattacks in industrial control systems, noting their ability to accurately model complex temporal dependencies. Ref. [
47] also reinforced the applicability of LSTM models to various critical infrastructure domains, highlighting their efficiency in processing large-scale time-series data.
It can thus be stated that LSTM offers a robust solution for detecting anomalies in critical infrastructure systems. Its ability to process and analyze sequential data, combined with its strong performance metrics, makes it a valuable tool for enhancing the security and resilience of these systems. However, the computational demands and interpretability challenges associated with deep learning models must be carefully managed to ensure their successful deployment in real-world applications.
5.6.2. Random Forest
Random Forest is suitable for anomaly detection in critical infrastructure systems due to its ensemble learning approach, which combines multiple decision trees to improve overall prediction accuracy and robustness. This allows Random Forest to capture complex relationships and patterns present in critical infrastructure data, enhancing its ability to detect anomalies, as seen in the earlier study by [
13]. Additionally, Random Forest is a non-parametric learning algorithm, meaning it makes no assumptions about the underlying distribution of the data, making it flexible and adaptable to diverse data distributions commonly encountered in critical infrastructure systems.
Table 7 lists the hyperparameter sets for Random Forest with selected parameters in bold, and its performance can be seen in
Table 8.
In our experiments, we evaluated Random Forest with a range of hyperparameters. The chosen configuration included 25 trees, a feature subset size of the square root of the total number of features, no maximum depth constraint, a minimum sample split of 2, a minimum leaf sample of 1, and bootstrap sampling enabled. This configuration was selected after rigorous hyperparameter tuning to optimize performance.
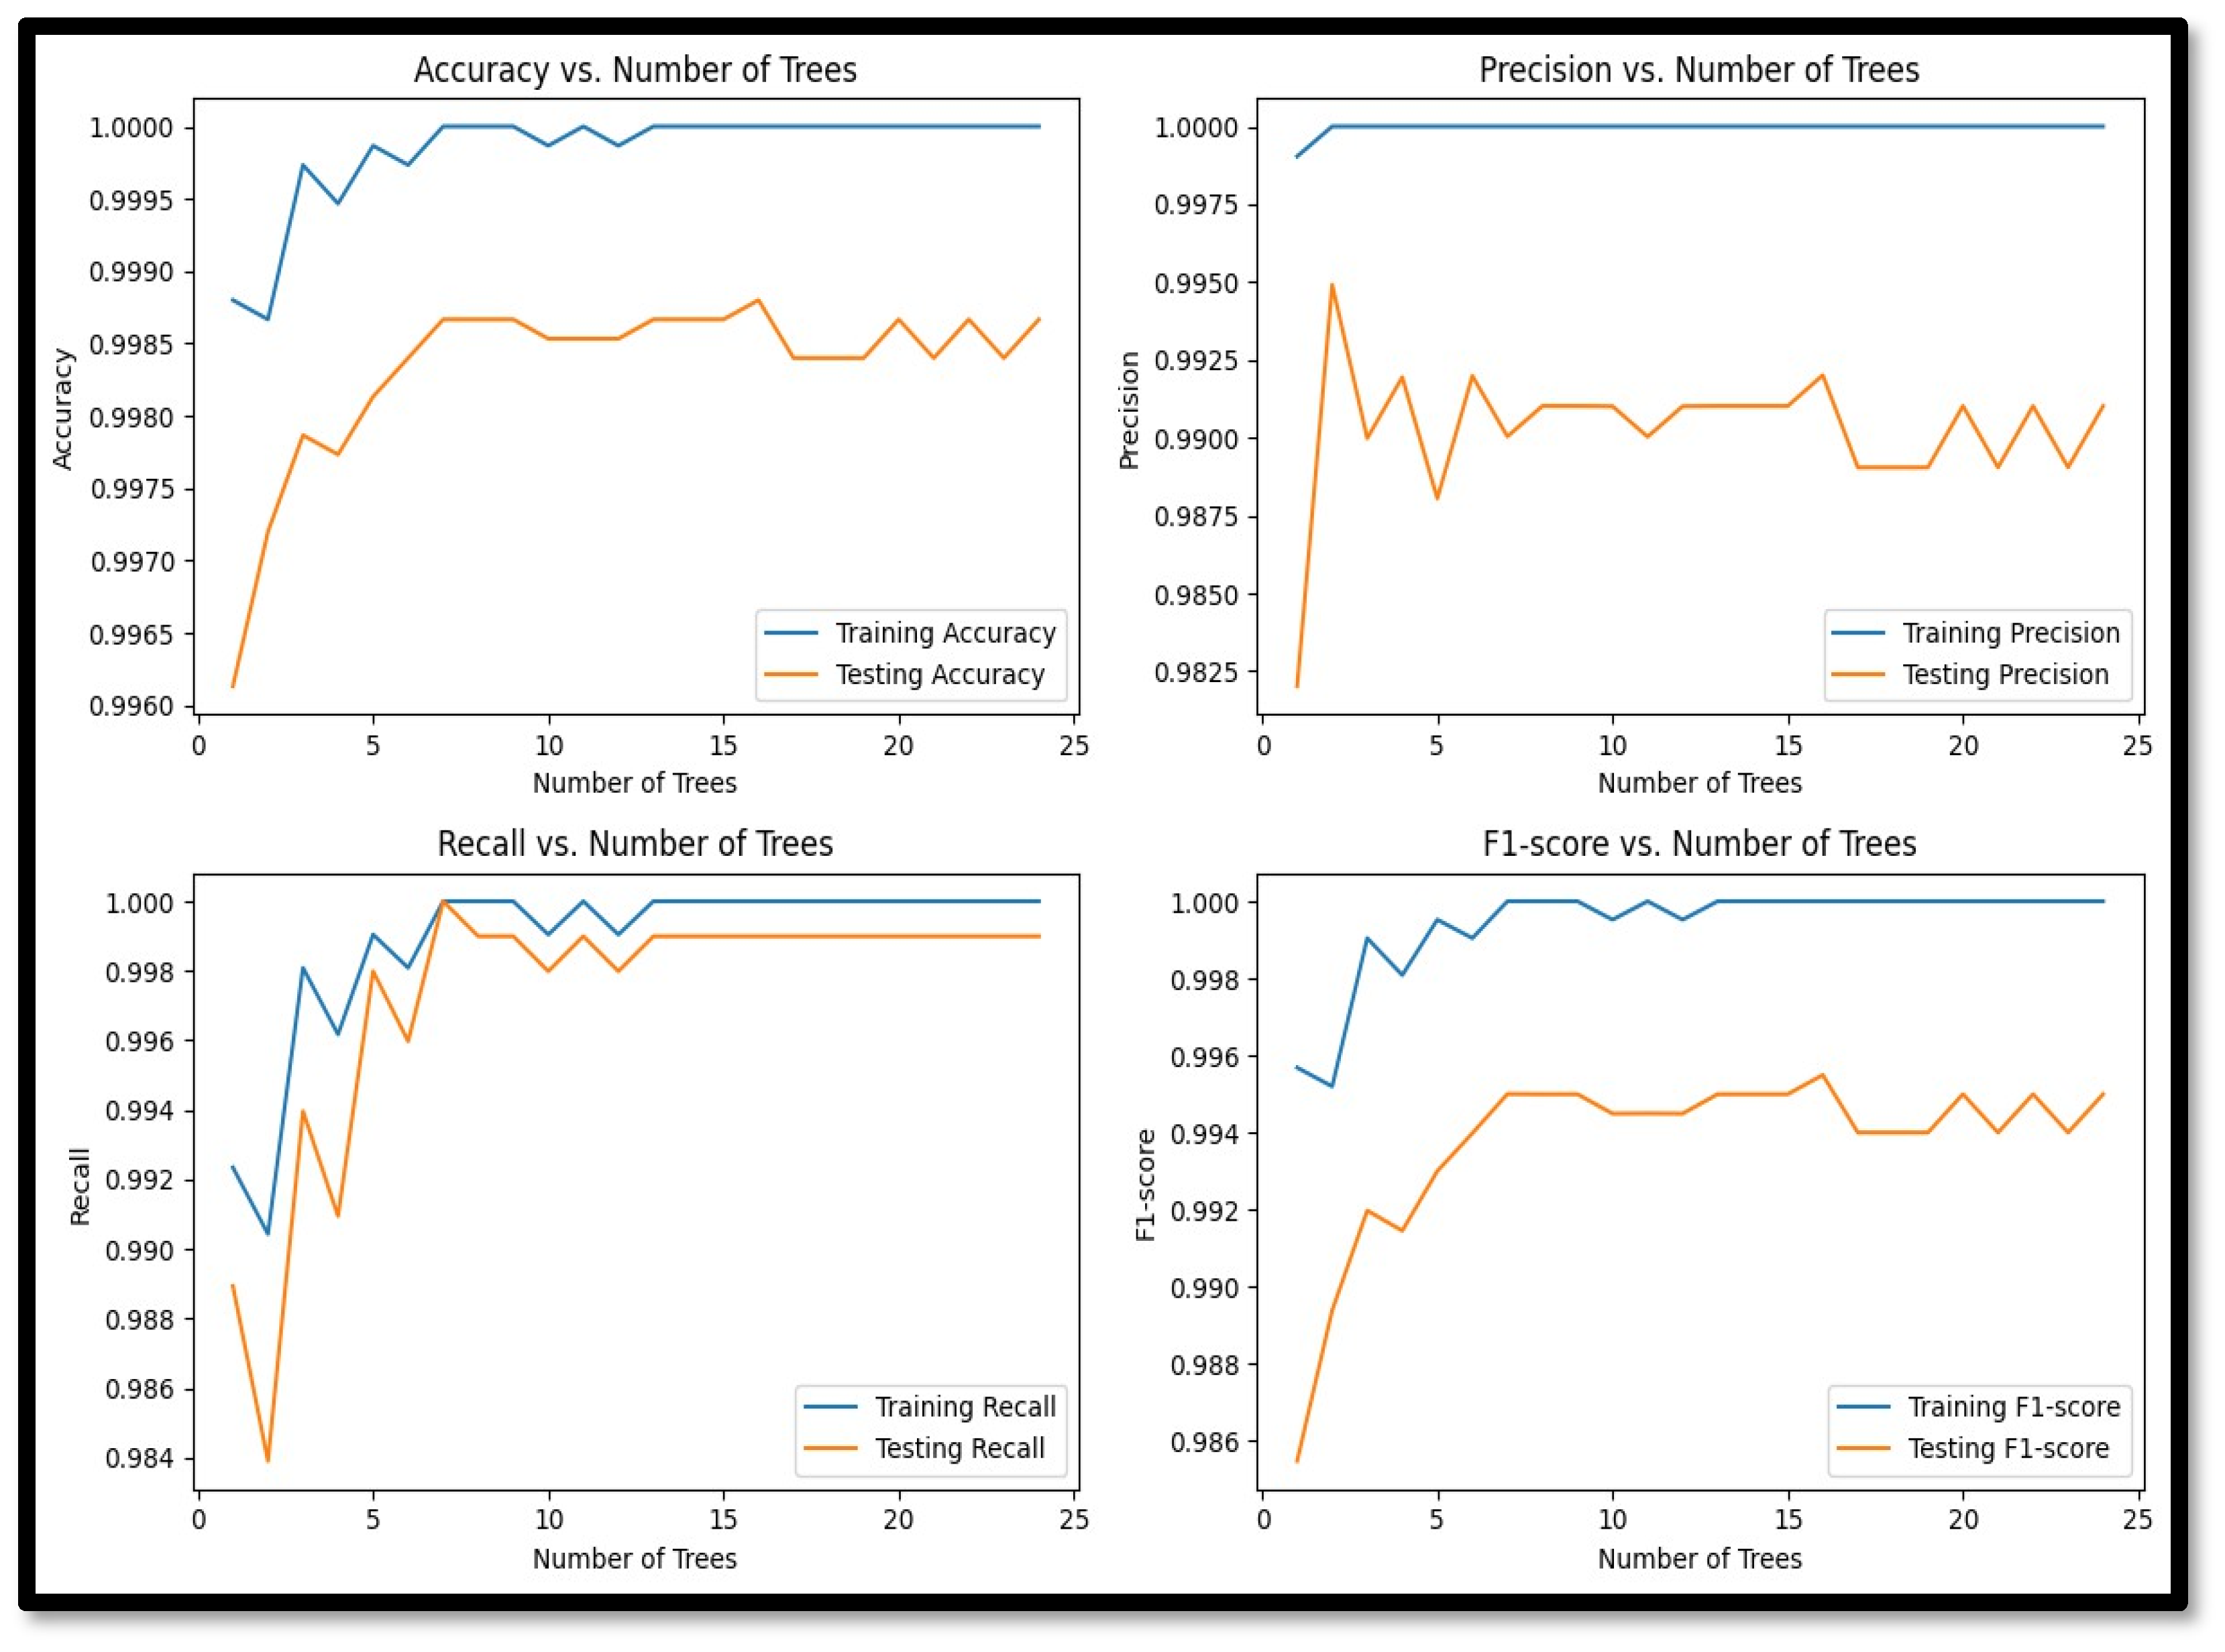
While splitting the dataset for Random Forest, we decided to test various combinations of data splits. We began with the usual 70/30 ratio, which was observed to produce good results. Since Random Forests are known for their resilience to overfitting, we decided to train the model on half of the dataset and test and validate the model’s performance on the remaining half of the dataset. We decided to allocate 50 percent of the test data towards validation. This resulted in robust training of the model, albeit with a lower number of attack instances, which further tested the efficiency of the algorithm. The similarity in training vs. testing accuracy confirmed that the model was not prone to overfitting and performed well in detecting both normal and attack classes.
The performance metrics for Random Forest were impressive, with an accuracy of 99.89%, a precision of 99.30%, a recall of 99.90%, and an F1 score of 99.60%. These results demonstrate the algorithm’s exceptional ability to accurately classify normal and anomalous events in the SWaT dataset. The high precision indicates that the Random Forest model is highly effective in correctly identifying true positives, minimizing the rate of false alarms, which is crucial for operational environments where false positives can lead to unnecessary interventions and increased operational costs. The near-perfect recall ensures that almost all actual anomalies are detected, highlighting the model’s reliability in identifying security threats. The Confusion matrix for Random Forest is shown in
Figure 9.
Random Forest’s robustness to overfitting, due to its ensemble approach of combining multiple decision trees, contributes to its high performance. This characteristic is particularly beneficial in the context of critical infrastructure, where data can be noisy and include various operational conditions, as per [
38]. In our context, this level of performance, although encouraging, could also be because of localized factors such as the small size of attack classes in the dataset, as well as slight variations in the readings during the attack. Since the variations are extremely small, and the model is trained on the normal data, it becomes highly sensitive to slight variations in the data pattern. Also, half of the test data was dedicated towards validating the training process, which further improved the model’s ability to clearly distinguish between false positives and false negatives. The algorithm’s ability to handle many features without significant loss of accuracy makes it well-suited to the complex and multifaceted nature of industrial control systems. In the context of critical infrastructure, the application of Random Forest for IDSs provides significant advantages. Its high detection accuracy ensures that most intrusions can be identified promptly, thereby mitigating potential damage to critical systems.
Figure 10 shows the performance metric variation by epochs for Random Forest.
Despite these strengths, the Random Forest algorithm has a major drawback. The interpretability of Random Forest models can be challenging. While the ensemble approach enhances predictive performance, it also makes it harder to understand the decision-making process of the model, which is a crucial aspect in security applications where transparency and accountability are important.
Comparing our findings with existing research, Random Forest has consistently shown strong performance in anomaly detection within industrial control systems. Studies such as those by [
48] have also reported high detection rates and low false-positive rates, corroborating our results. This consistency across different studies and datasets underscores the reliability of Random Forest as a robust tool for enhancing the security of critical infrastructure. It can clearly be seen that the application of Random Forest in IDSs for critical infrastructure showcases its capability to accurately and reliably detect anomalies. The model’s strengths in handling high-dimensional data and its robustness against overfitting make it an asset in the cybersecurity toolkit for protecting critical systems. However, attention must be paid to its need for interpretability in security applications.
5.6.3. One-Class Support Vector Machine (One-Class SVM)
The one-class support vector machine (one-class SVM) is an alternative form of the traditional support vector machine (SVM) algorithm intended for novelty recognition or outlier detection tasks. Unlike the traditional SVM, which is primarily used for binary classification, the one-class SVM learns a decision boundary that encompasses most of the information in a particular class (“normal” class), thereby identifying outliers or anomalies that deviate from the normal class.
For the SWaT dataset, the one-class SVM was configured with the linear kernel, a nu parameter of 0.1, and the gamma parameter set to “scale” (refer to
Table 9 with the selected parameters in bold). The choice of the linear kernel helps in maintaining simplicity and interpretability, while the nu parameter defines an upper bound on the fraction of margin errors and a lower bound on the fraction of support vectors, controlling the trade-off between the training error and model complexity. The “scale” setting for gamma is based on the inverse of the number of features, ensuring that each feature contributes equally to the decision boundary.
The one-class SVM is suitable for anomaly detection in critical infrastructure systems due to its novelty detection capabilities [
23]. It learns the normal behavior of the system and detects deviations or abnormalities indicative of security breaches or system malfunctions. The one-class SVM is inherently robust to imbalanced datasets according to [
24], where anomalies are relatively rare compared to normal system behavior, making it suitable for anomaly detection in critical infrastructure systems. Additionally, the one-class SVM utilizes a kernel function to map input data into a high-dimensional feature space, allowing it to capture complex relationships and non-linear decision boundaries present in critical infrastructure data, further enhancing its anomaly detection capabilities.
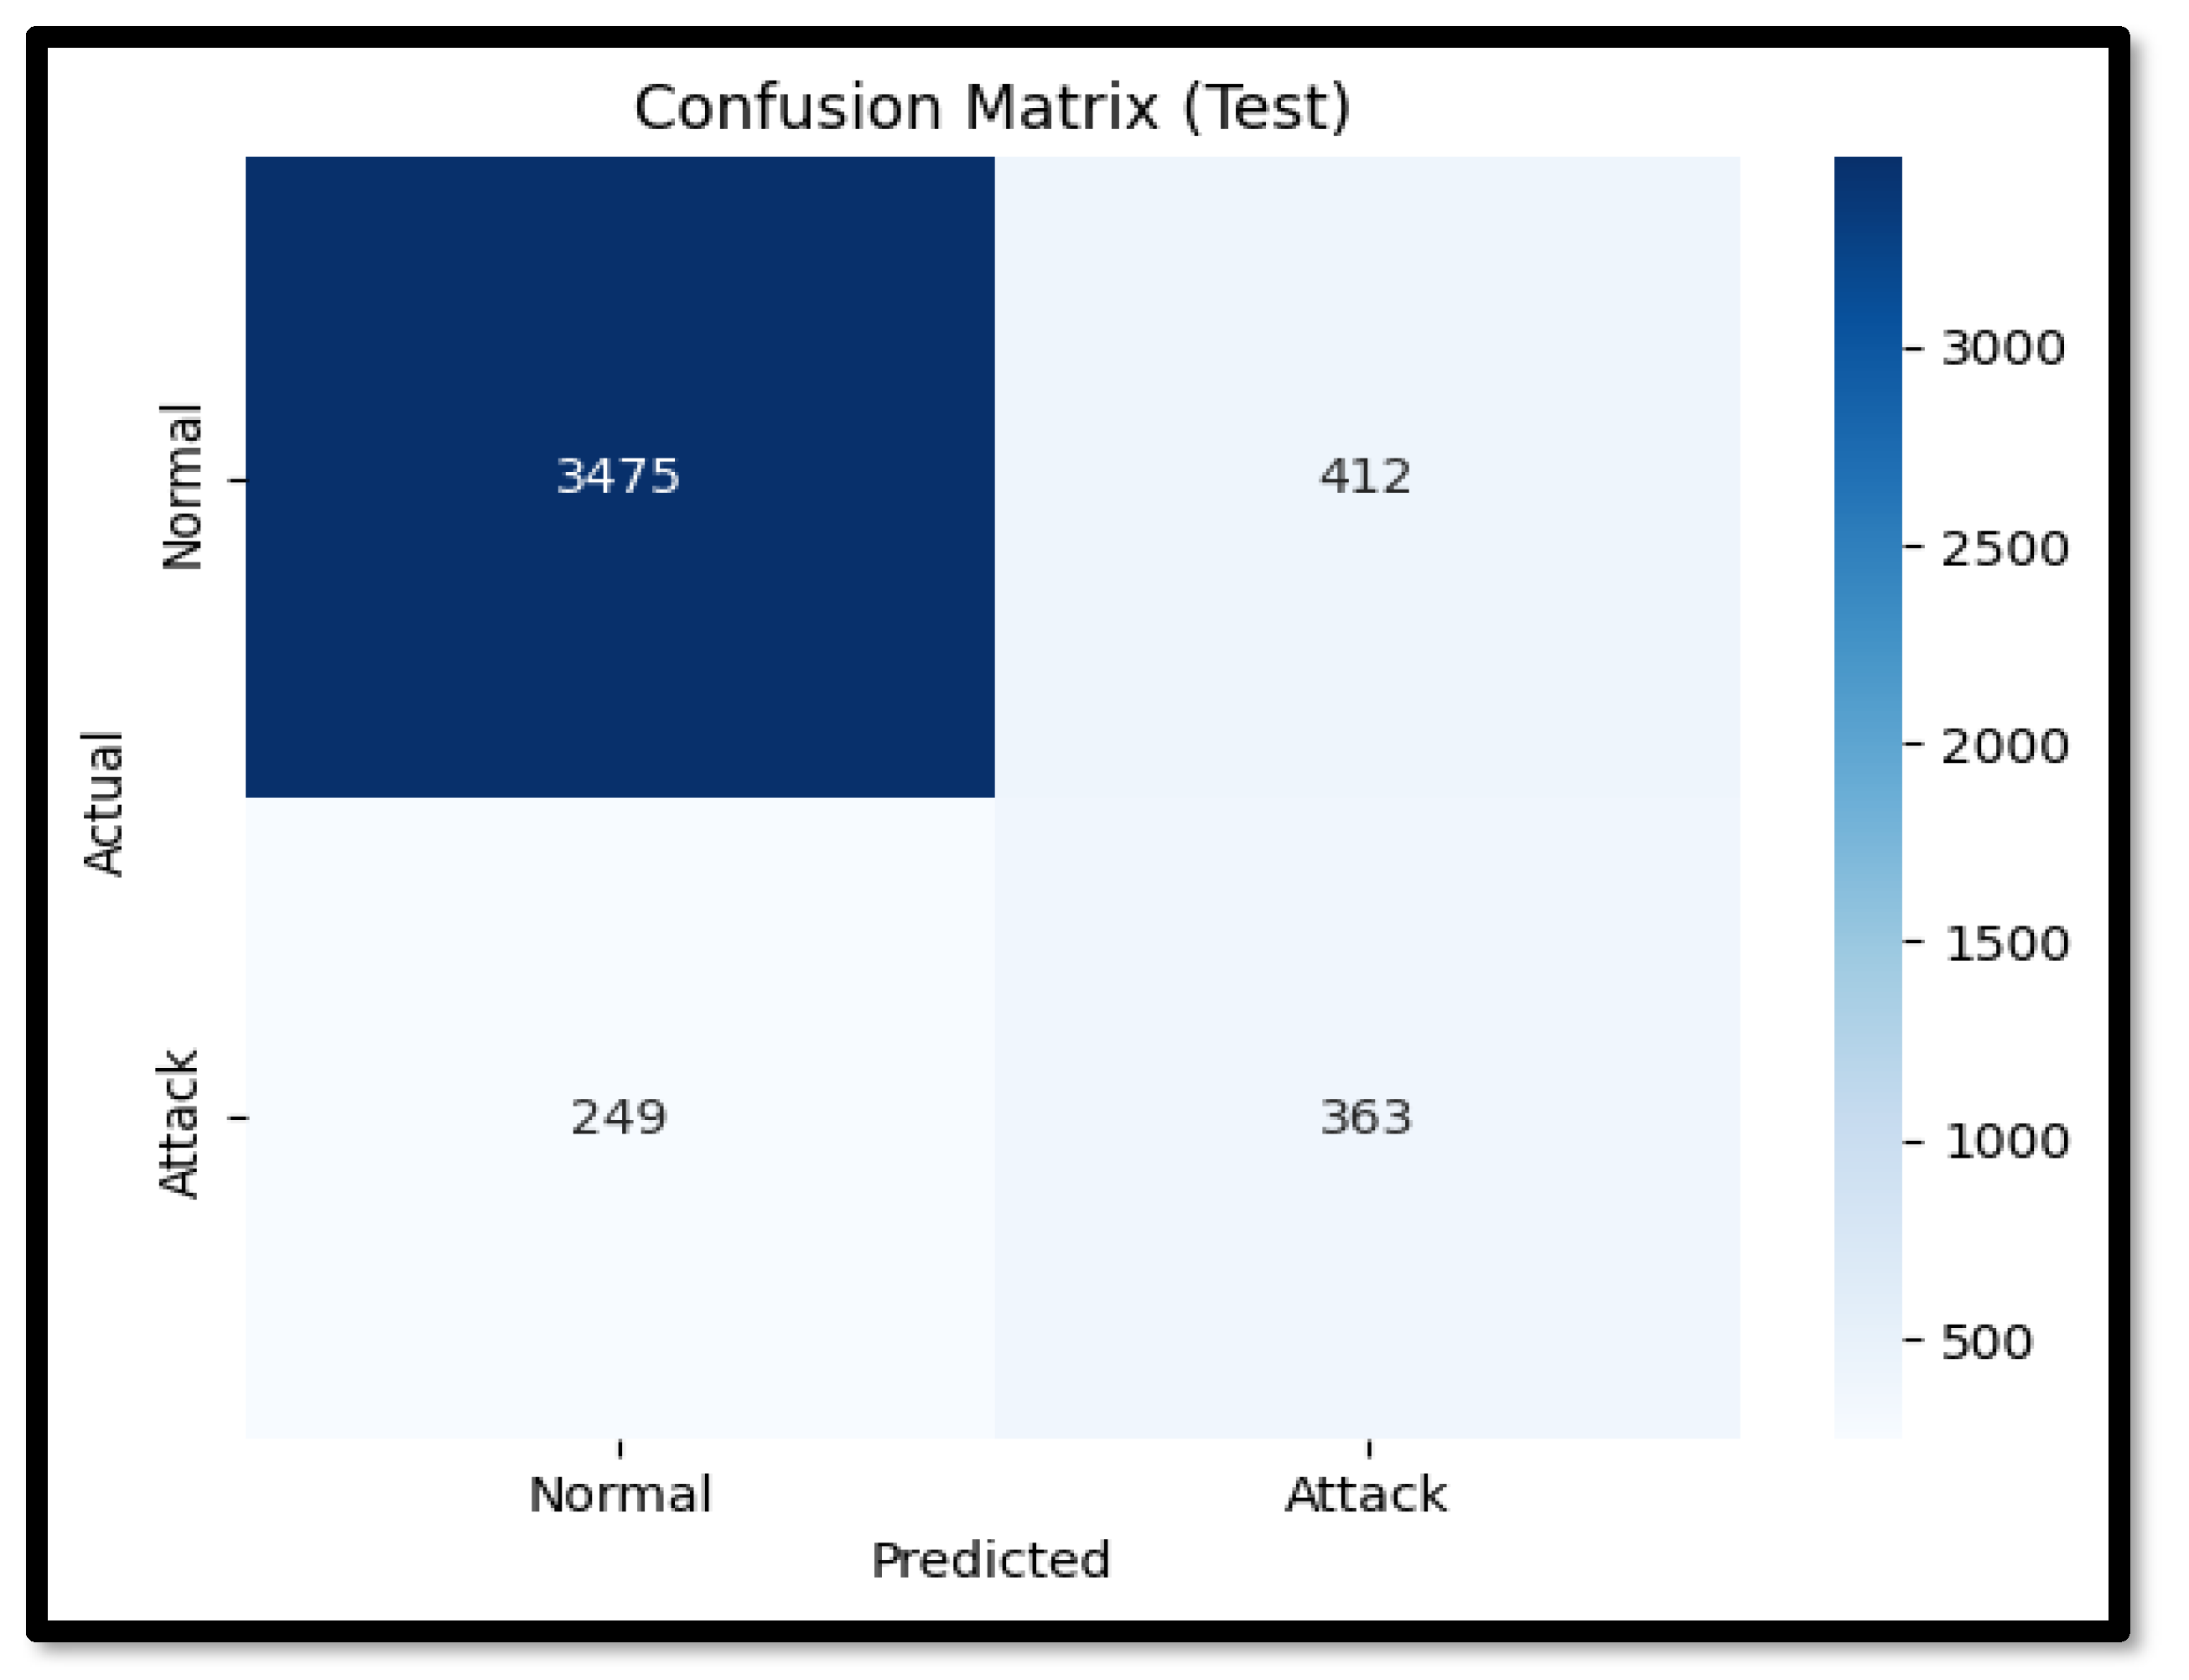
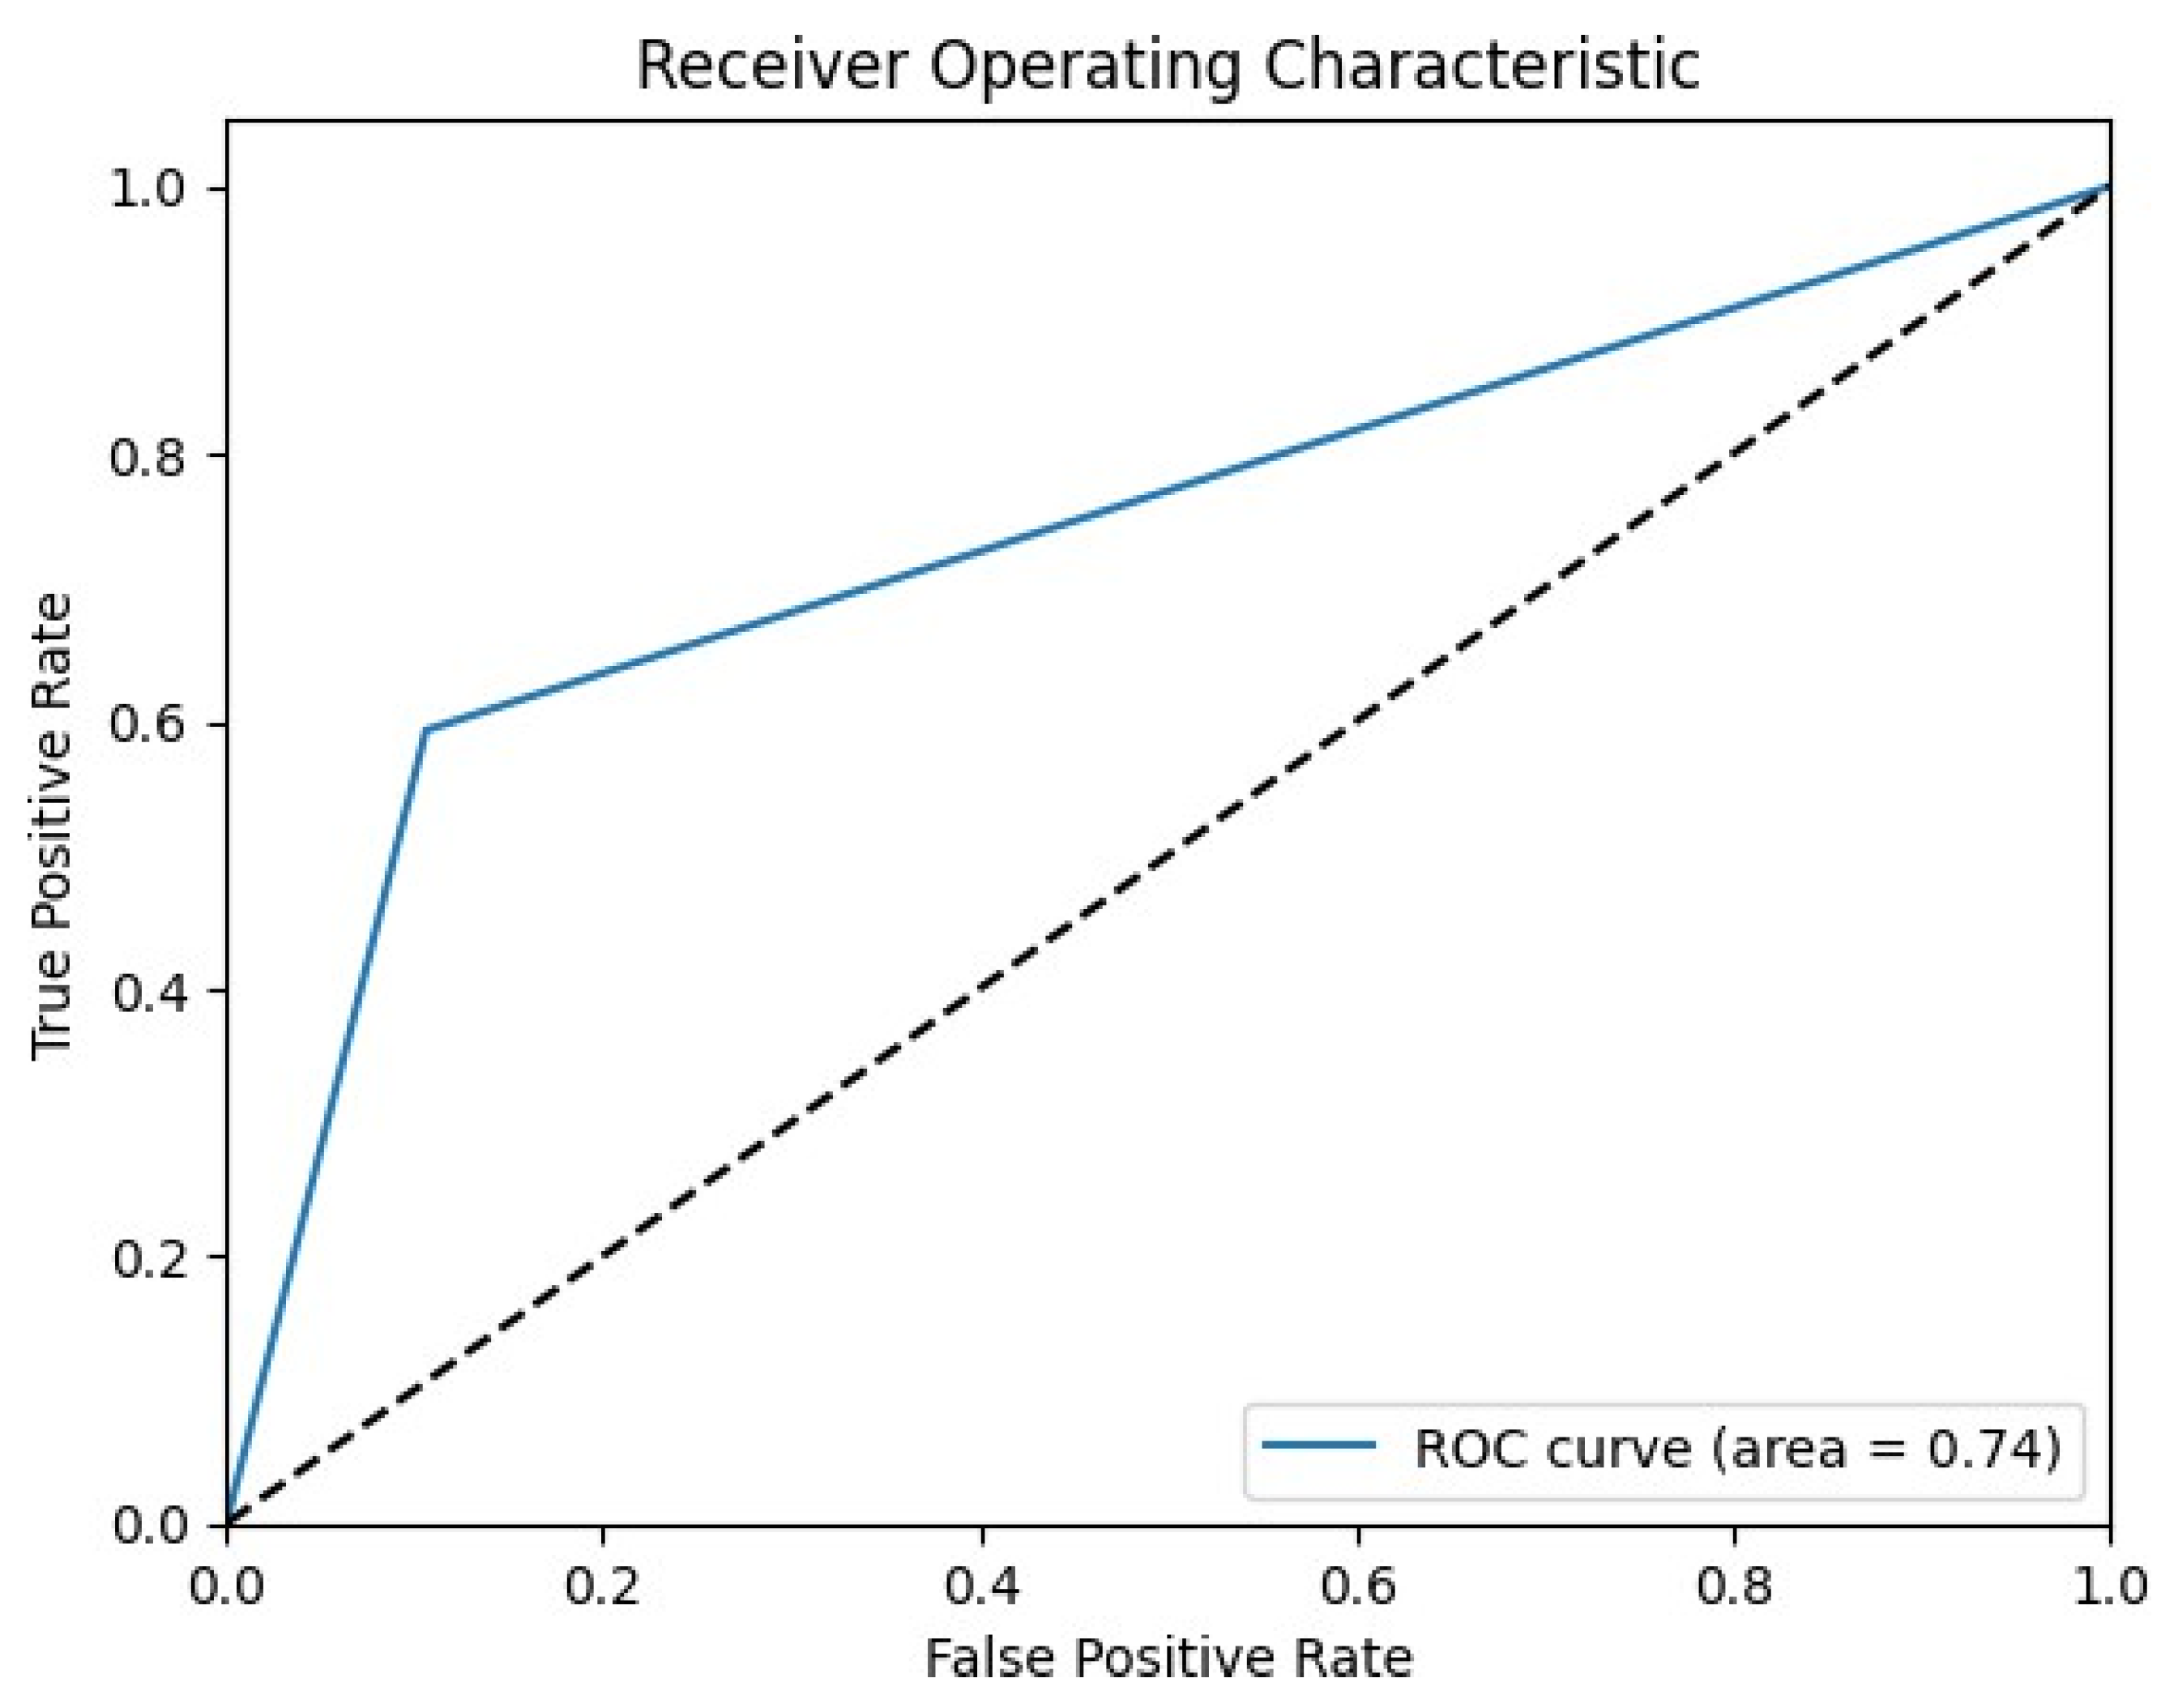
The performance metrics of the one-class SVM on the SWaT dataset reveal an accuracy of 85.09%, indicating a solid performance in distinguishing between normal and anomalous events. The precision of 0.4785 and recall of 0.5944 show that while the model is relatively balanced in identifying anomalies, it has a notable number of false positives and false negatives. The F1 score of 0.5261 further illustrates this balance between precision and recall. The ROC area of 0.74 signifies that the model’s ability to distinguish between the two classes is fairly good, but there is room for improvement.
Table 10 lists all the performance metrics for the one-class SVM.
In the context of the SWaT dataset, the one-class SVM’s performance can be explained by the inherent complexity and variability of the sensor data. The dataset includes numerous sensor readings under normal conditions and several simulated attack scenarios. Anomalies in this context are often subtle and context-dependent, such as slight deviations in sensor readings that indicate malicious activity. The linear kernel’s simplicity might struggle with capturing these subtle and complex patterns, which could explain the number of false positives and negatives observed.
Despite these challenges, the one-class SVM remains a valuable tool for anomaly detection in critical infrastructure. Its effectiveness is demonstrated in scenarios where the normal operational patterns are well-defined and the anomalies are distinctly different, as in [
49].
Figure 11 shows the Confusion matrix for the one-class SVM.
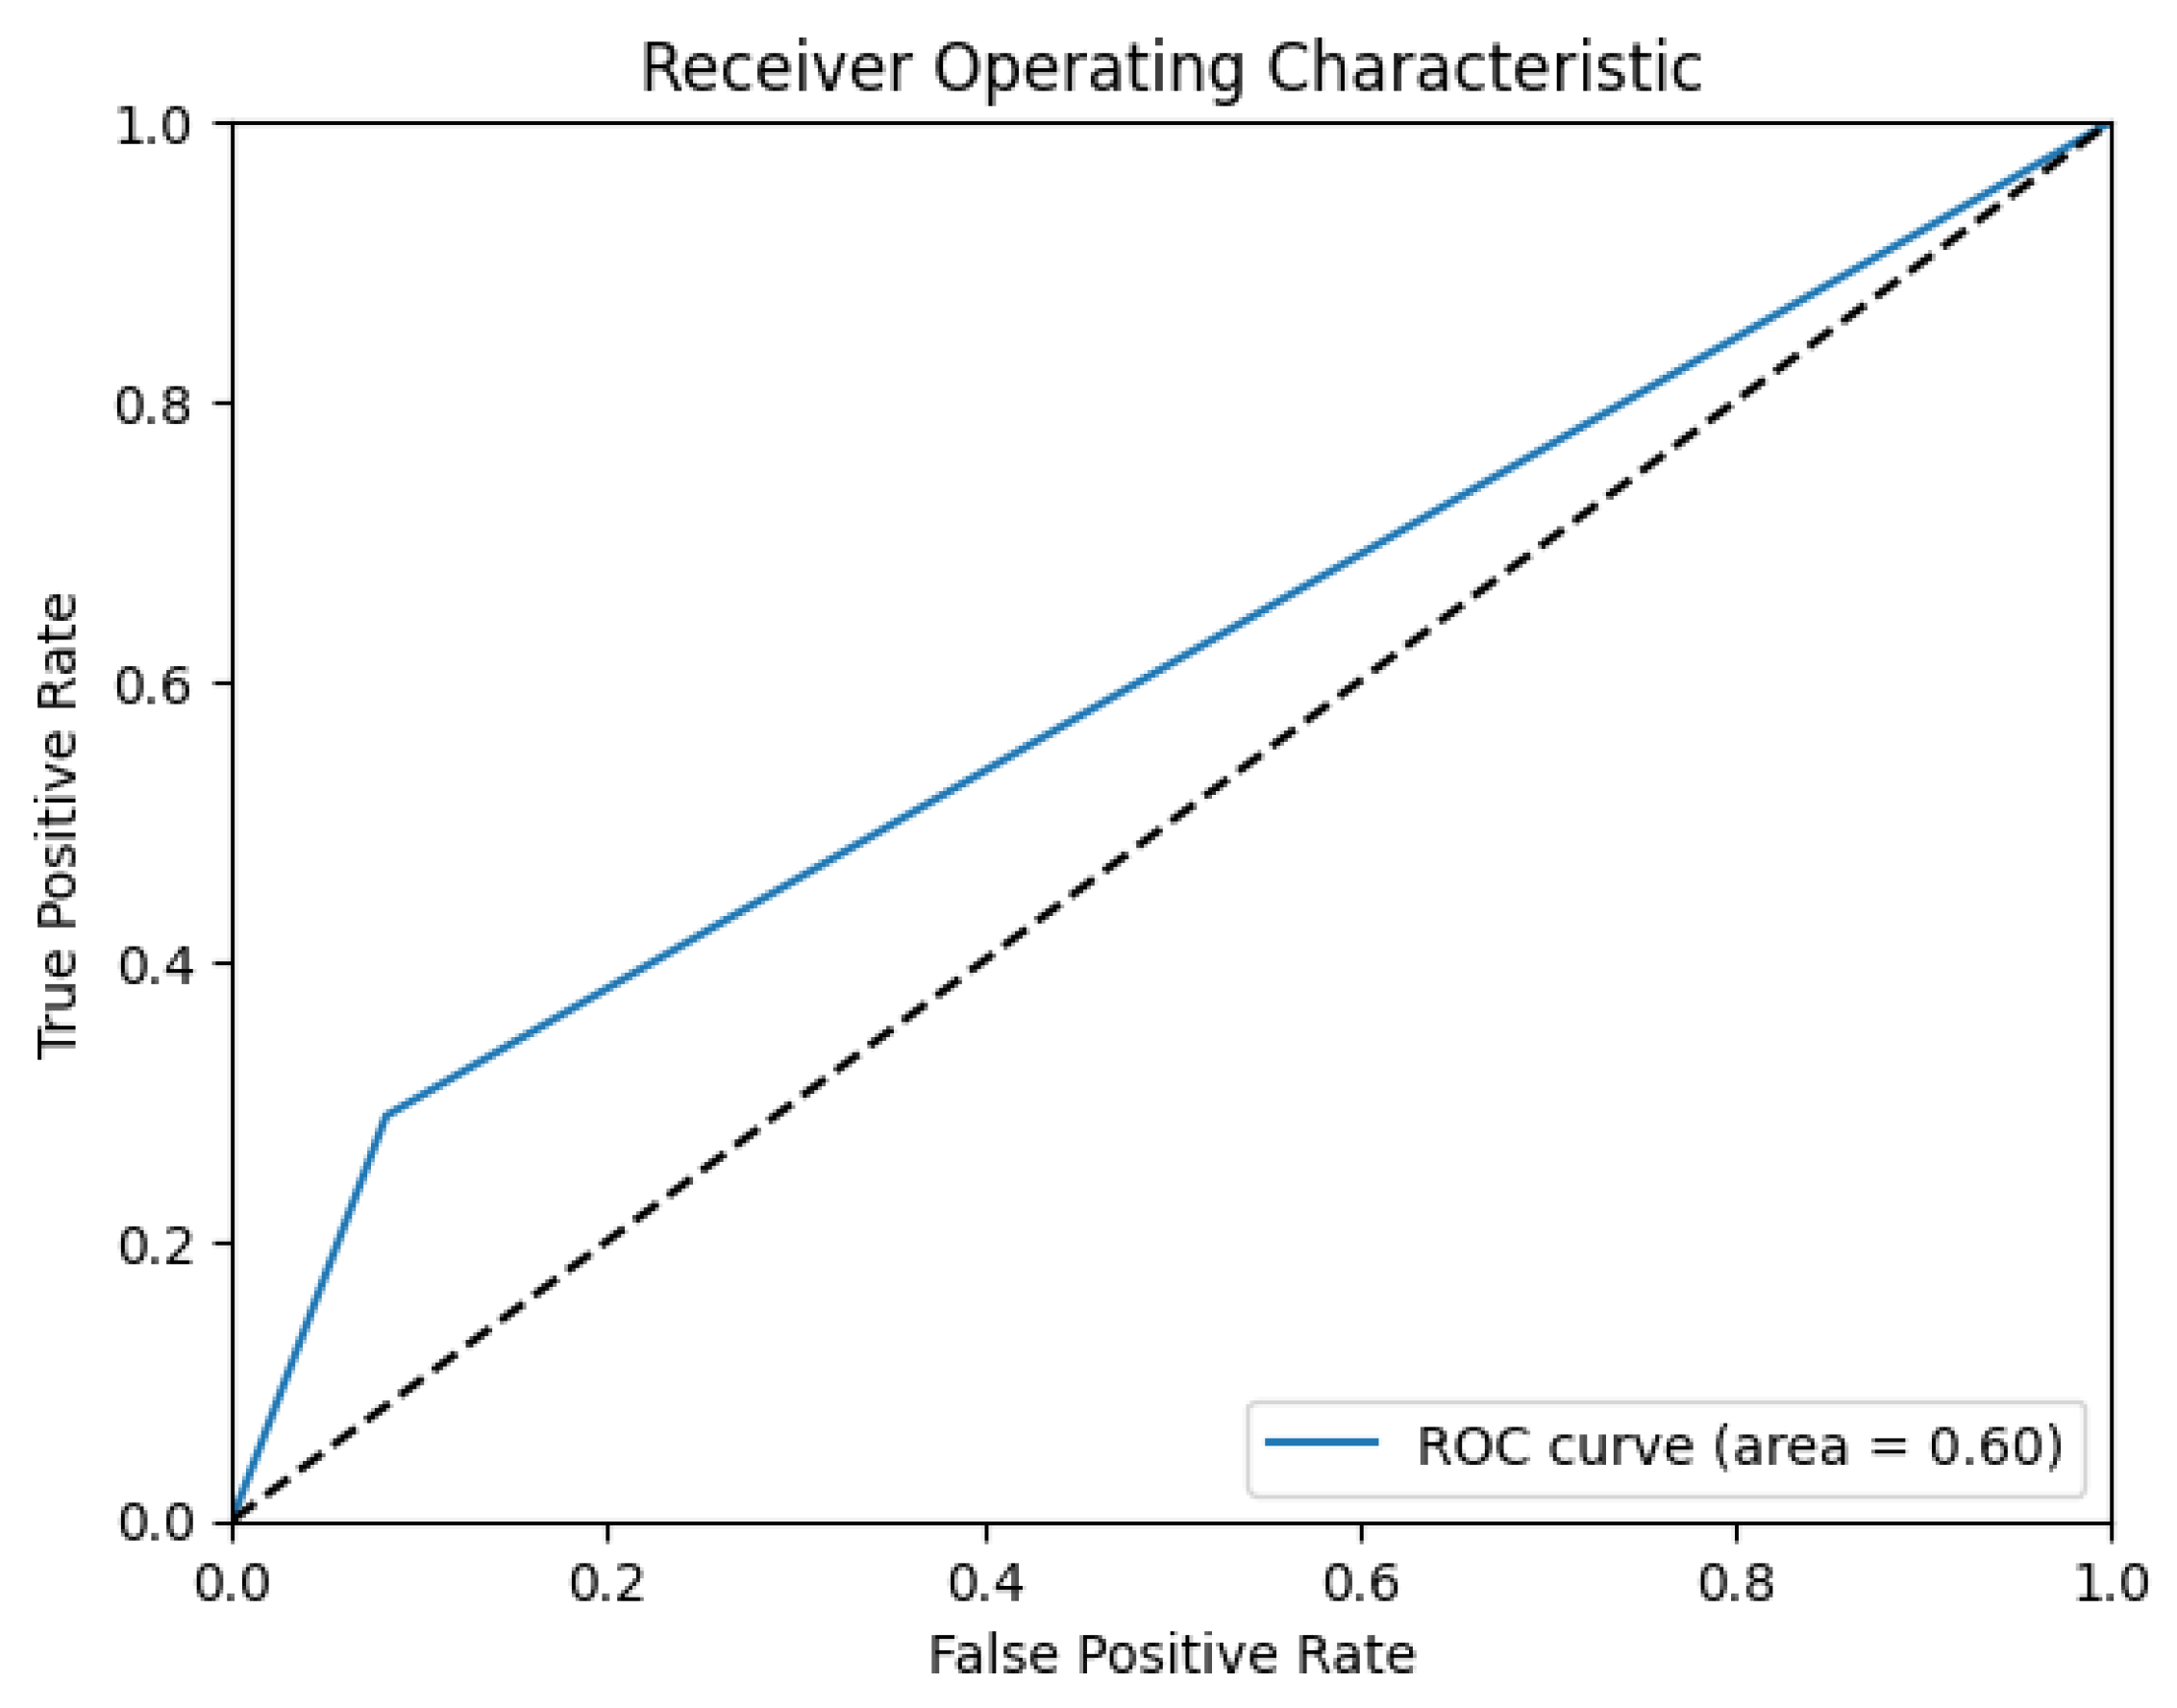
The relatively high ROC area (
Figure 12) indicates that the model can separate normal from abnormal events better than random chance, which is crucial for the timely detection and mitigation of attacks on critical infrastructure.
Improving the performance of the one-class SVM in this domain could involve experimenting with different kernels, such as the radial basis function (RBF), which might capture the non-linear relationships in the data more effectively. Adjusting the nu parameter to a higher value could also reduce the number of false negatives, as it would allow the model to consider more support vectors, thereby capturing more complex patterns. Additionally, feature engineering and normalization can enhance the model’s ability to discern anomalies by ensuring that all features contribute meaningfully to the decision boundary. Integrating the one-class SVM with other anomaly detection techniques, such as supervised learning models trained on a subset of labeled data, can further improve its performance. This hybrid approach can leverage the strengths of unsupervised detection while incorporating the precision of supervised models, thereby providing a more comprehensive and reliable detection mechanism.
In conclusion, the one-class SVM offers a robust method for unsupervised anomaly detection in critical infrastructure. Its application to the SWaT dataset highlights its potential and the challenges inherent in detecting subtle and context-dependent anomalies. The model’s performance underscores the need for continuous refinement and integration with other detection techniques to enhance the resilience of critical infrastructure systems against evolving cyber threats. The existing literature, for example [
50], corroborates these findings, emphasizing the importance of robust and adaptable anomaly detection mechanisms in maintaining the security and integrity of critical infrastructure.
5.6.4. Isolation Forest
Isolation forest (IF) is an anomaly detection-focused unsupervised machine learning technique. Unlike traditional classification or regression algorithms, choosing a feature at random and then choosing a split value between the maximum and minimum values of that feature is how isolation forests work. This isolates observations. The key insight is that because anomalies are rare and distinctive, isolation is more likely to occur. This process isolates anomalies with fewer splits compared to normal points, which require more splits to be isolated. Moreover, isolation forests are different from Random Forests in their approach to constructing trees. While Random Forests are an ensemble of decision trees used for classification and regression tasks by aggregating the results of individual trees, isolation forests focus solely on isolating anomalies. The trees in an isolation forest are specifically constructed to isolate points, making them shallow and efficient.
For this study, the isolation forest was configured with 50 trees, a feature subset size of 0.6, a sample size of 0.6, and a contamination factor of 0.1. These hyperparameters (
Table 11 with selected parameters in bold) were chosen to balance detection performance and computational efficiency.
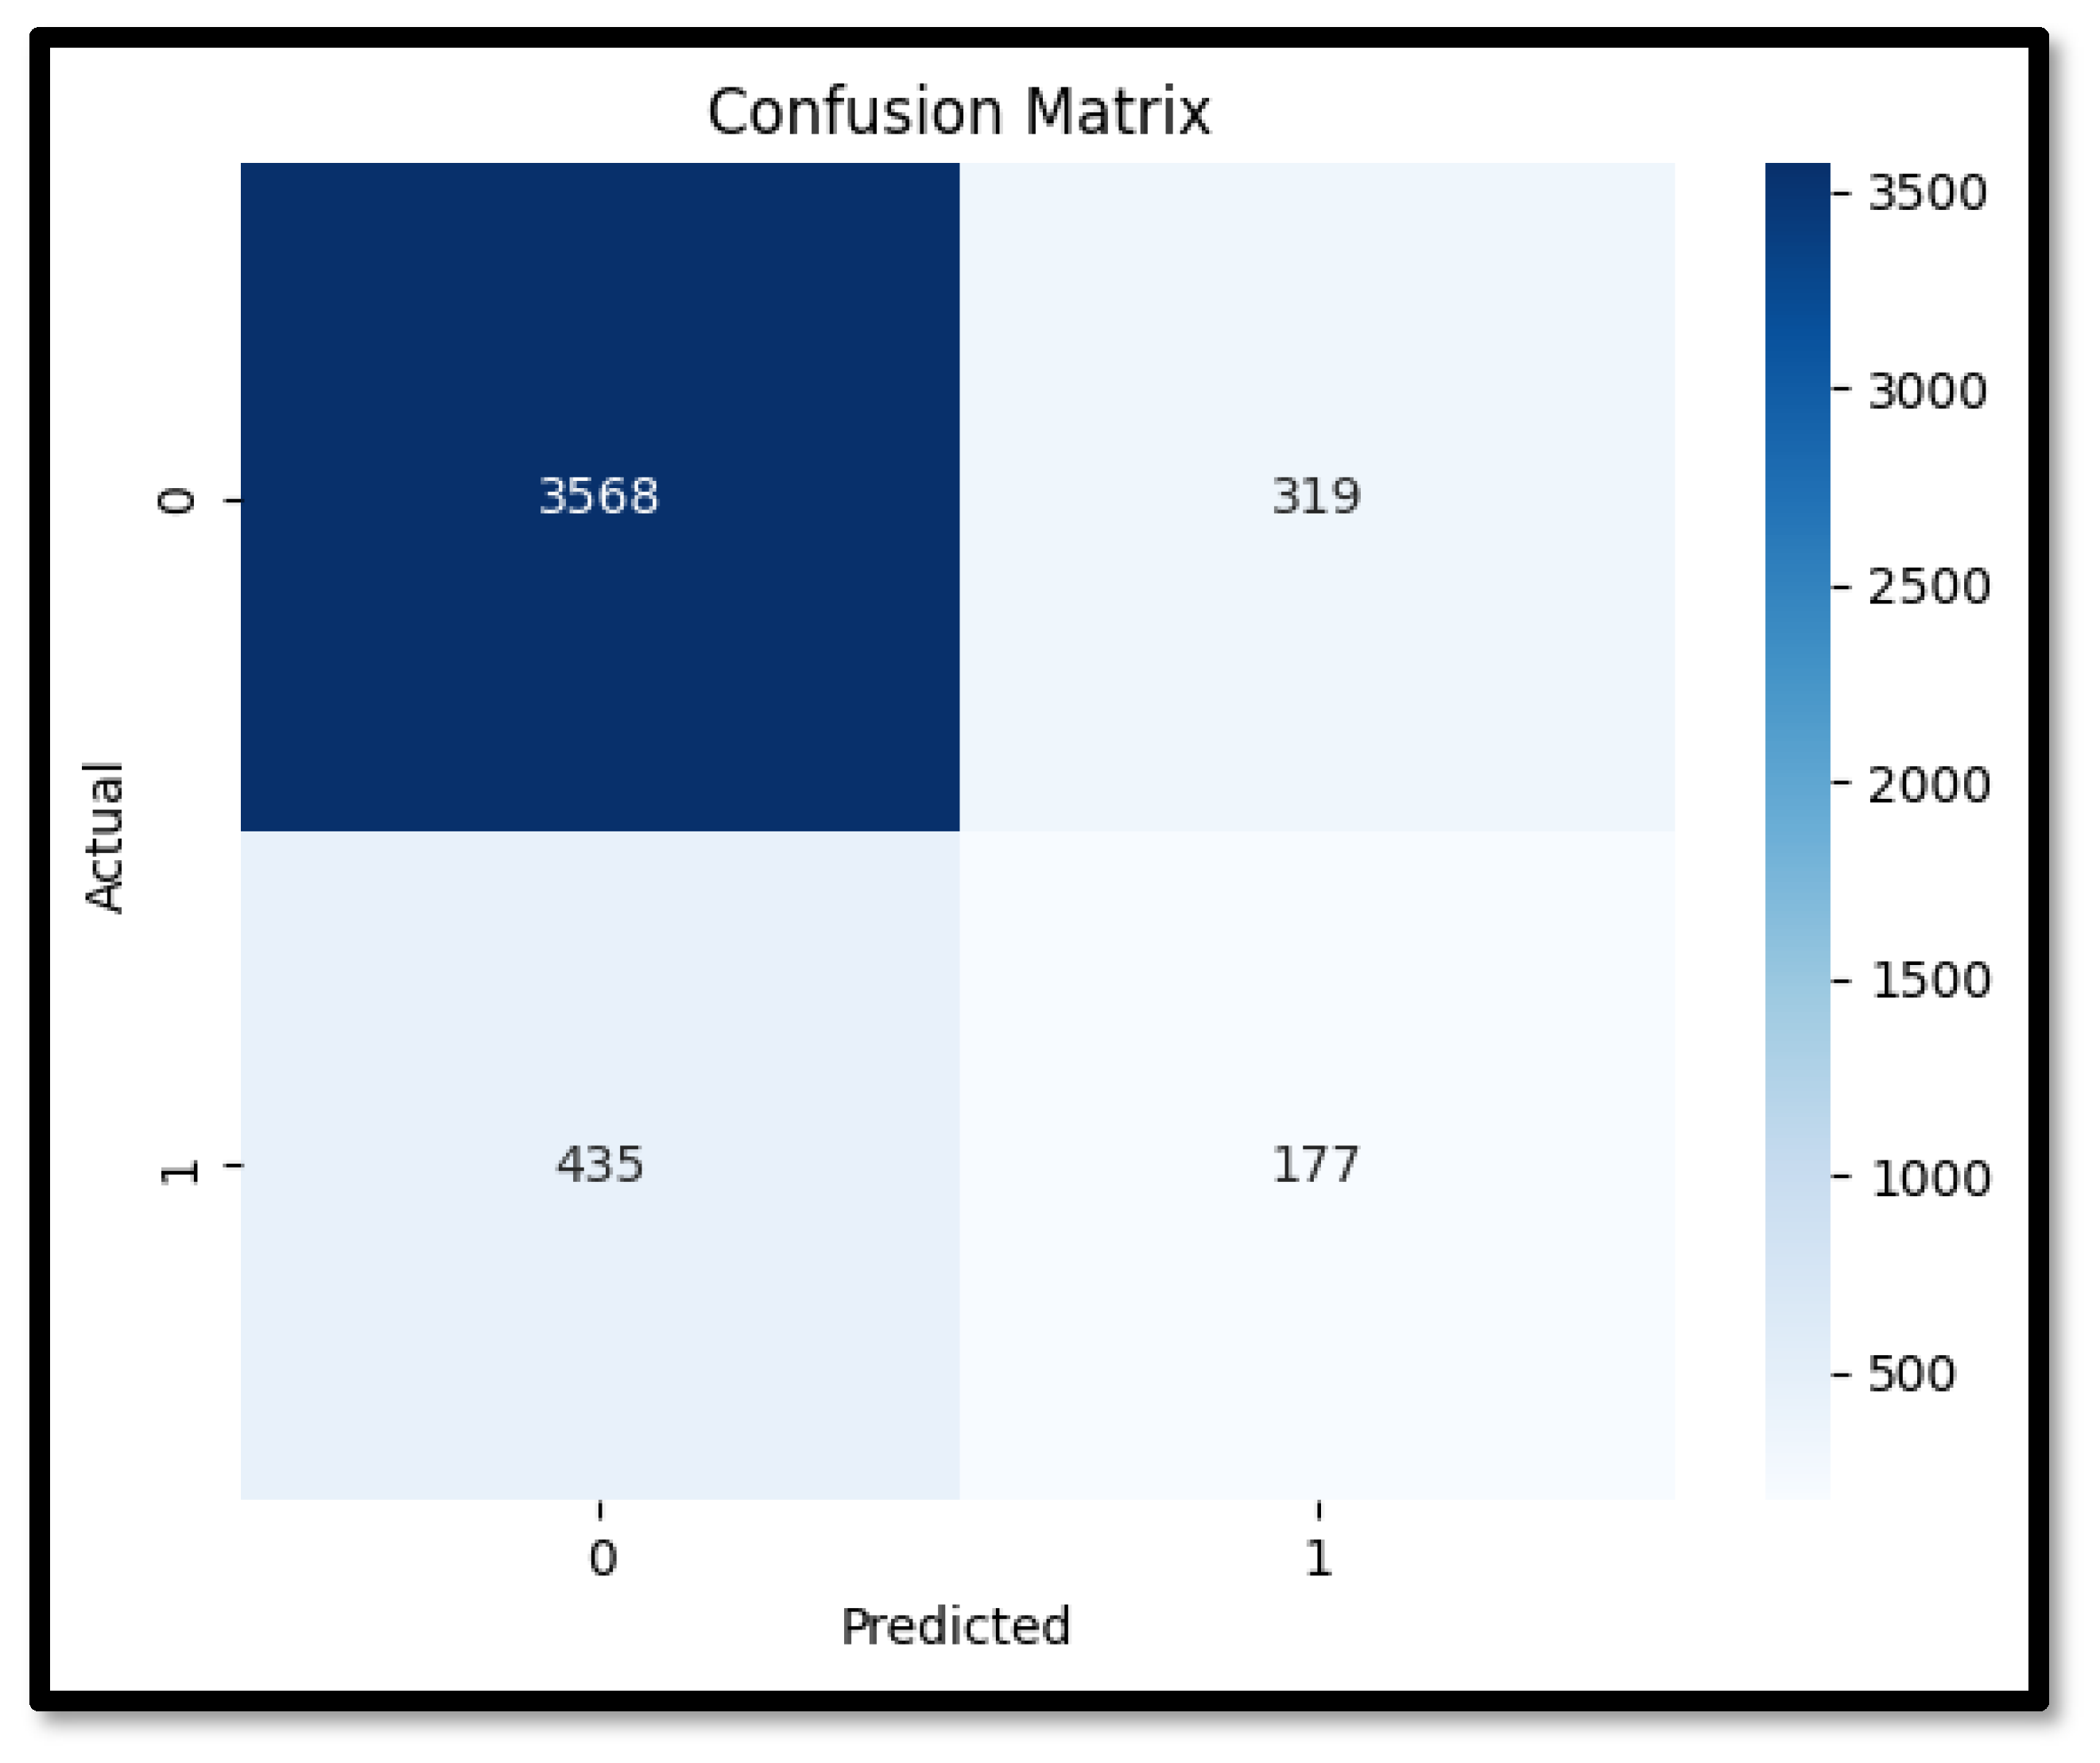
The performance metrics for the isolation forest on the SWaT dataset show an overall accuracy of 83%, indicating a reasonable ability to differentiate between normal and anomalous events. The precision for detecting normal events was high at 0.89, reflecting the model’s capability to accurately identify true positives. However, the precision for anomalies was significantly lower at 0.36, suggesting a considerable number of false positives. Similarly, the recall for normal events was strong at 0.92, but the recall for anomalies was only 0.29, indicating that the model missed a substantial proportion of actual anomalies. The F1 score for normal events was robust at 0.90, but for anomalies, it was relatively low at 0.32. Additionally, the ROC curve area of 0.60 indicates that the model’s ability to distinguish between normal and anomalous events is only moderately better than random guessing.
Table 12 lists all the performance metrics for the IF. The technical performance of the isolation forest can be dissected further to understand these results. The algorithm’s reliance on random partitioning to isolate anomalies inherently means that its effectiveness can vary significantly based on the dataset’s characteristics. The SWaT dataset includes time-series data from a water treatment testbed, with both normal operations and several simulated attack scenarios. Normal data instances vastly outnumber the anomalies, which is typical for critical infrastructure datasets but poses a challenge for unsupervised learning algorithms.
The lower precision and recall for anomalies suggests that while the isolation forest can identify many normal events accurately, it struggles with the detection of all instances of malicious activity. The severe class imbalance and absence of any prior knowledge or understanding of what malicious behavior may look like in terms of sensor readings also worsen the performance of the algorithm. The model’s decision boundaries, defined by the randomly generated splits, may not capture these subtle deviations effectively, leading to missed detections (false negatives) and incorrect classifications of normal data as anomalies (false positives).
Figure 13 shows the Confusion matrix for IF and
Figure 14 shows its ROC characteristics.
Improving the performance of the isolation forest on such datasets might involve increasing the number of trees to provide a more nuanced partitioning of the feature space, as per the research by [
51], although this comes at the cost of increased computational resources. Adjusting the contamination parameter, which estimates the proportion of anomalies in the data, can also impact performance. In scenarios like SWaT, where anomalies are rare, setting a lower contamination factor might help the model focus more on rare events.
Thus, while the isolation forest provides a reasonably decent method for unsupervised anomaly detection in critical infrastructure, albeit with plenty of room for improvement, its performance in detecting rare and subtle anomalies highlights the need for continuous refinement and combination with other detection techniques. This approach ensures comprehensive coverage and enhances the resilience of critical infrastructure systems against evolving threats. The existing literature, such as the research by [
52], supports these findings, emphasizing the balance between computational efficiency and the need for nuanced detection mechanisms in critical infrastructure.
Table 13 shows a summary of the reviewed algorithms with the key performance metrics examined: Random Forest emerges as a good candidate for anomaly detection in critical infrastructure.
6. Conclusions
This research comprehensively evaluated the effectiveness of machine learning using both supervised and unsupervised machine learning algorithms to detect anomalies within critical infrastructure, specifically using the SWaT dataset from the iTrust water treatment testbed. Among the supervised algorithms, Random Forest emerged as the most effective, showcasing robustness and high accuracy, essential for handling the complexity and variety of potential anomalies in such systems. One-dimensional convolutional neural network (1D CNN) and Long Short-Term Memory (LSTM) models also demonstrated strong performance, excelling in capturing spatial dependencies and effectively identifying temporal patterns. These attributes make supervised algorithms particularly suitable for anomaly detection in critical infrastructure, where the ability to process and analyze high-dimensional and temporal data is crucial.
Unsupervised algorithms, including isolation forest and one-class support vector machine (one-class SVM), provided valuable insights into anomaly detection without making use of labeled data. Isolation forest showed reasonable accuracy by isolating rare events through random partitioning, but its higher rates of false positives and negatives indicated a need for further refinement. One-class SVM, with its balanced performance, highlighted the importance of appropriate kernel selection to capture complex patterns in critical infrastructure data. One major challenge with unsupervised methods is their reliance on the assumption that anomalies are rare and distinct from normal data. In our dataset, the nature of attacks may not always produce clear, isolated anomalies. Subtle or sophisticated attacks might blend in with normal behavior, making it difficult for unsupervised algorithms to effectively distinguish between benign and malicious activities. This can result in higher false-positive rates, where normal instances are incorrectly flagged as anomalies, or false negatives, where actual anomalies go undetected.
Overall, while supervised algorithms demonstrated superior accuracy and reliability due to their ability to leverage labeled data and capture intricate patterns, unsupervised algorithms offer a complementary approach by providing preliminary anomaly detection in scenarios where labeled data is scarce. The combination of both methods can enhance the robustness and resilience of intrusion detection systems in critical infrastructure, ensuring comprehensive coverage and the early detection of potential threats.
Combining the strengths of supervised and unsupervised algorithms can provide a more comprehensive detection mechanism. For instance, using unsupervised algorithms like isolation forest and one-class SVM to pre-filter data can help in identifying potential anomalies, which can then be analyzed more thoroughly using supervised models. This hybrid approach can reduce the chances of false positives and negatives, providing a more reliable detection system.
This study has several limitations that should be acknowledged. The results are based on the SWaT dataset, which, while representative, may not capture the full diversity of potential anomalies in all critical infrastructure systems. The dataset’s specific characteristics, such as its focus on a water treatment plant, may limit the generalizability of the findings to other types of critical infrastructure. The dataset also has only 4 h of operational data, which could be a drawback in the performance of unsupervised learning methods such as one-class SVM and isolation forest, since the models may not have had enough data to learn the system behavior intricately and effectively.
The findings from this research offer several practical recommendations for industry professionals. The demonstrated effectiveness of Random Forest suggests it to be a prime candidate for anomaly detection in critical infrastructure. Integrating LSTM networks into IDSs can significantly enhance detection capabilities by capturing temporal patterns in the data. This is particularly important for detecting anomalies that develop gradually, ensuring timely intervention before significant damage occurs.
Overall, this research underscores the critical role of machine learning in enhancing the security and resilience of critical infrastructure systems. The application of machine learning algorithms, particularly those capable of handling both spatial and temporal data, provides a robust method for detecting and mitigating potential threats. The long-term impact of this research lies in its potential to inform the development of more advanced and adaptive IDS frameworks, ultimately contributing to the safeguarding of essential services and the prevention of disruptions caused by cyberattacks.
As the field evolves, continuous research and innovation will be crucial in addressing emerging threats and ensuring the security of critical infrastructure. The integration of machine learning into IDS frameworks represents a significant step forward in cybersecurity, offering the potential to detect and respond to threats more effectively and efficiently. This research provides a foundation for future studies, highlighting the need for ongoing refinement and the development of more sophisticated detection mechanisms to protect critical infrastructure from evolving cyber threats.


