Article

Towards MR-Only Radiotherapy in Head and Neck: Generation of Synthetic CT from Zero-TE MRI Using Deep Learning

by
Souha Aouadi
*,
Mojtaba Barzegar
,
Alla Al-Sabahi
,
Tarraf Torfeh
,
Satheesh Paloor
,
Mohamed Riyas
,
Palmira Caparrotti
,
Rabih Hammoud
and
Noora Al-Hammadi
Department of Radiation Oncology, National Center for Cancer Care and Research, Hamad Medical Corporation, Doha 3050, Qatar
*
Author to whom correspondence should be addressed.
Information 2025, 16(6), 477; https://doi.org/10.3390/info16060477
Submission received: 30 April 2025 / Revised: 3 June 2025 / Accepted: 4 June 2025 / Published: 6 June 2025

Abstract

This study investigates the generation of synthetic CT (sCT) images from zero echo time (ZTE) MRI to support MR-only radiotherapy, which can reduce image registration errors and lower treatment planning costs. Since MRI lacks the electron density data required for accurate dose calculations, generating reliable sCTs is essential. ZTE MRI, offering high bone contrast, was used with two deep learning models: attention deep residual U-Net (ADR-Unet) and derived conditional generative adversarial network (cGAN). Data from 17 head and neck cancer patients were used to train and evaluate the models. ADR-Unet was enhanced with deep residual blocks and attention mechanisms to improve learning and reconstruction quality. Both models were implemented in-house and compared to standard U-Net and Unet++ architectures using image quality metrics, visual inspection, and dosimetric analysis. Volumetric modulated arc therapy (VMAT) planning was performed on both planning CT and generated sCTs. ADR-Unet achieved a mean absolute error of 55.49 HU and a Dice score of 0.86 for bone structures. All the models demonstrated Gamma pass rates above 99.4% and dose deviations within 2–3%, confirming clinical acceptability. These results highlight ADR-Unet and cGAN as promising solutions for accurate sCT generation, enabling effective MR-only radiotherapy.

1. Introduction

In external beam radiation therapy (EBRT), both CT and MRI scans are utilized for treatment planning [1,2]. MRI provides superior soft-tissue contrast, functional insights, and high resolution, and is radiation-free compared to CT. Consequently, MRI is fused with CT to delineate organs at risk (OARs) and tumor structures. However, this fusion introduces CT/MRI registration uncertainties, typically around 2–5 mm [3]. Adopting an MRI-only approach for EBRT could help minimize these uncertainties and enhance the radiotherapy workflow by reducing patient visits and imaging costs. The main challenge, however, is that MRI lacks electron density information, which is crucial for dose calculation. To overcome this limitation, a synthetic CT (sCT) must be generated from MRI to restore critical features such as cortical bone, which is not visible in MRI but clearly defined in CT.
sCT generation approaches could be classified into five categories: sequence-based, tissue segmentation-based, atlas-based, learning-based, and hybrid approaches.
Sequence-based sCT methods leverage signal intensity variations across multiple MRI sequences (T1W, T2W, Dixon, etc.) to estimate tissue-specific Hounsfield Units (HUs) without requiring prior CT data. Techniques such as voxel-based weighted summation [4] and dual-model HU conversion (linear for soft tissue, polynomial for bone) [5] have demonstrated high concordance with conventional CT in HU accuracy, dose reduction ratio, and dose profiles.
Tissue segmentation-based methods [6,7,8,9] involve segmenting the patient’s MRI volume into primary tissue types, such as bone, soft tissue, fat, and air, followed by assigning a discrete CT number to each tissue type. These methods typically utilize multiple MRI sequences, including specialized sequences such as ultrashort echo time (UTE) or zero echo time (ZTE), to visualize tissues with short T2 relaxation times, such as cortical bone (T2 = 420 μs), and distinguish them from air.
Atlas-based methods involve performing deformable registration between one or more MR atlases and the target patient’s MR image [10,11]. The resulting deformation field is then used to align the corresponding CT atlases to the target patient, thereby generating the synthetic CT (sCT). However, pure atlas-based methods are highly sensitive to registration accuracy, which can be challenging and error-prone for patients with significant pathological or anatomical variations. Patch-based approaches address this limitation by requiring only linear registration between images; 3D patches (voxel intensities from a subregion of the MRI) are extracted from the target MRI and compared locally to a library of patches. The CT intensities at the center of the most similar patches are averaged to determine the sCT intensity at the center of the target patch [12].
Recently, learning-based methods, particularly deep learning (DL) approaches, have gained significant traction [13]. DL models are being employed for various tasks in radiation therapy, including image segmentation, processing, reconstruction, registration, treatment planning, and radiomics [14,15,16,17,18,19]. These methods have also been utilized for synthetic CT (sCT) prediction from MRI [17], primarily leveraging convolutional neural networks (CNNs) or generative adversarial networks (GANs). CNNs are multi-layer, fully trainable architectures capable of modeling complex, high-dimensional relationships between inputs and outputs. GANs, on the other hand, consist of a generator (G) based on CNNs and a discriminator (D). The generator aims to create realistic images to deceive the discriminator, while the discriminator works to differentiate between real and synthetic data.
Hybrid approaches integrate deep learning with atlas-based refinement or multi-sequence MRI fusion. These hybrid methods aim to leverage the strengths of each technique to enhance the accuracy and robustness of sCT generation, particularly in anatomically complex regions such as the head and neck. For instance, Lauritzen et al. [20] proposed a method that combines multi-atlas registration with deep neural networks, resulting in enhanced bone structure representation in the synthesized CT images. Multiple MRI sequences, which have shown promise in capturing diverse tissue contrasts, were incorporated into DL approaches for sCT generation in [21].
In this study, we implemented and compared four deep learning models for synthetic CT (sCT) generation from ZTE. This work made the following key contributions:
-
Utilization of ZTE MRI: ZTE was employed for its unique ability to capture signals from short-T2 tissues such as cortical bone—overcoming limitations of conventional MRI sequences—while also providing silent acquisition and reduced artifact sensitivity [22].
-
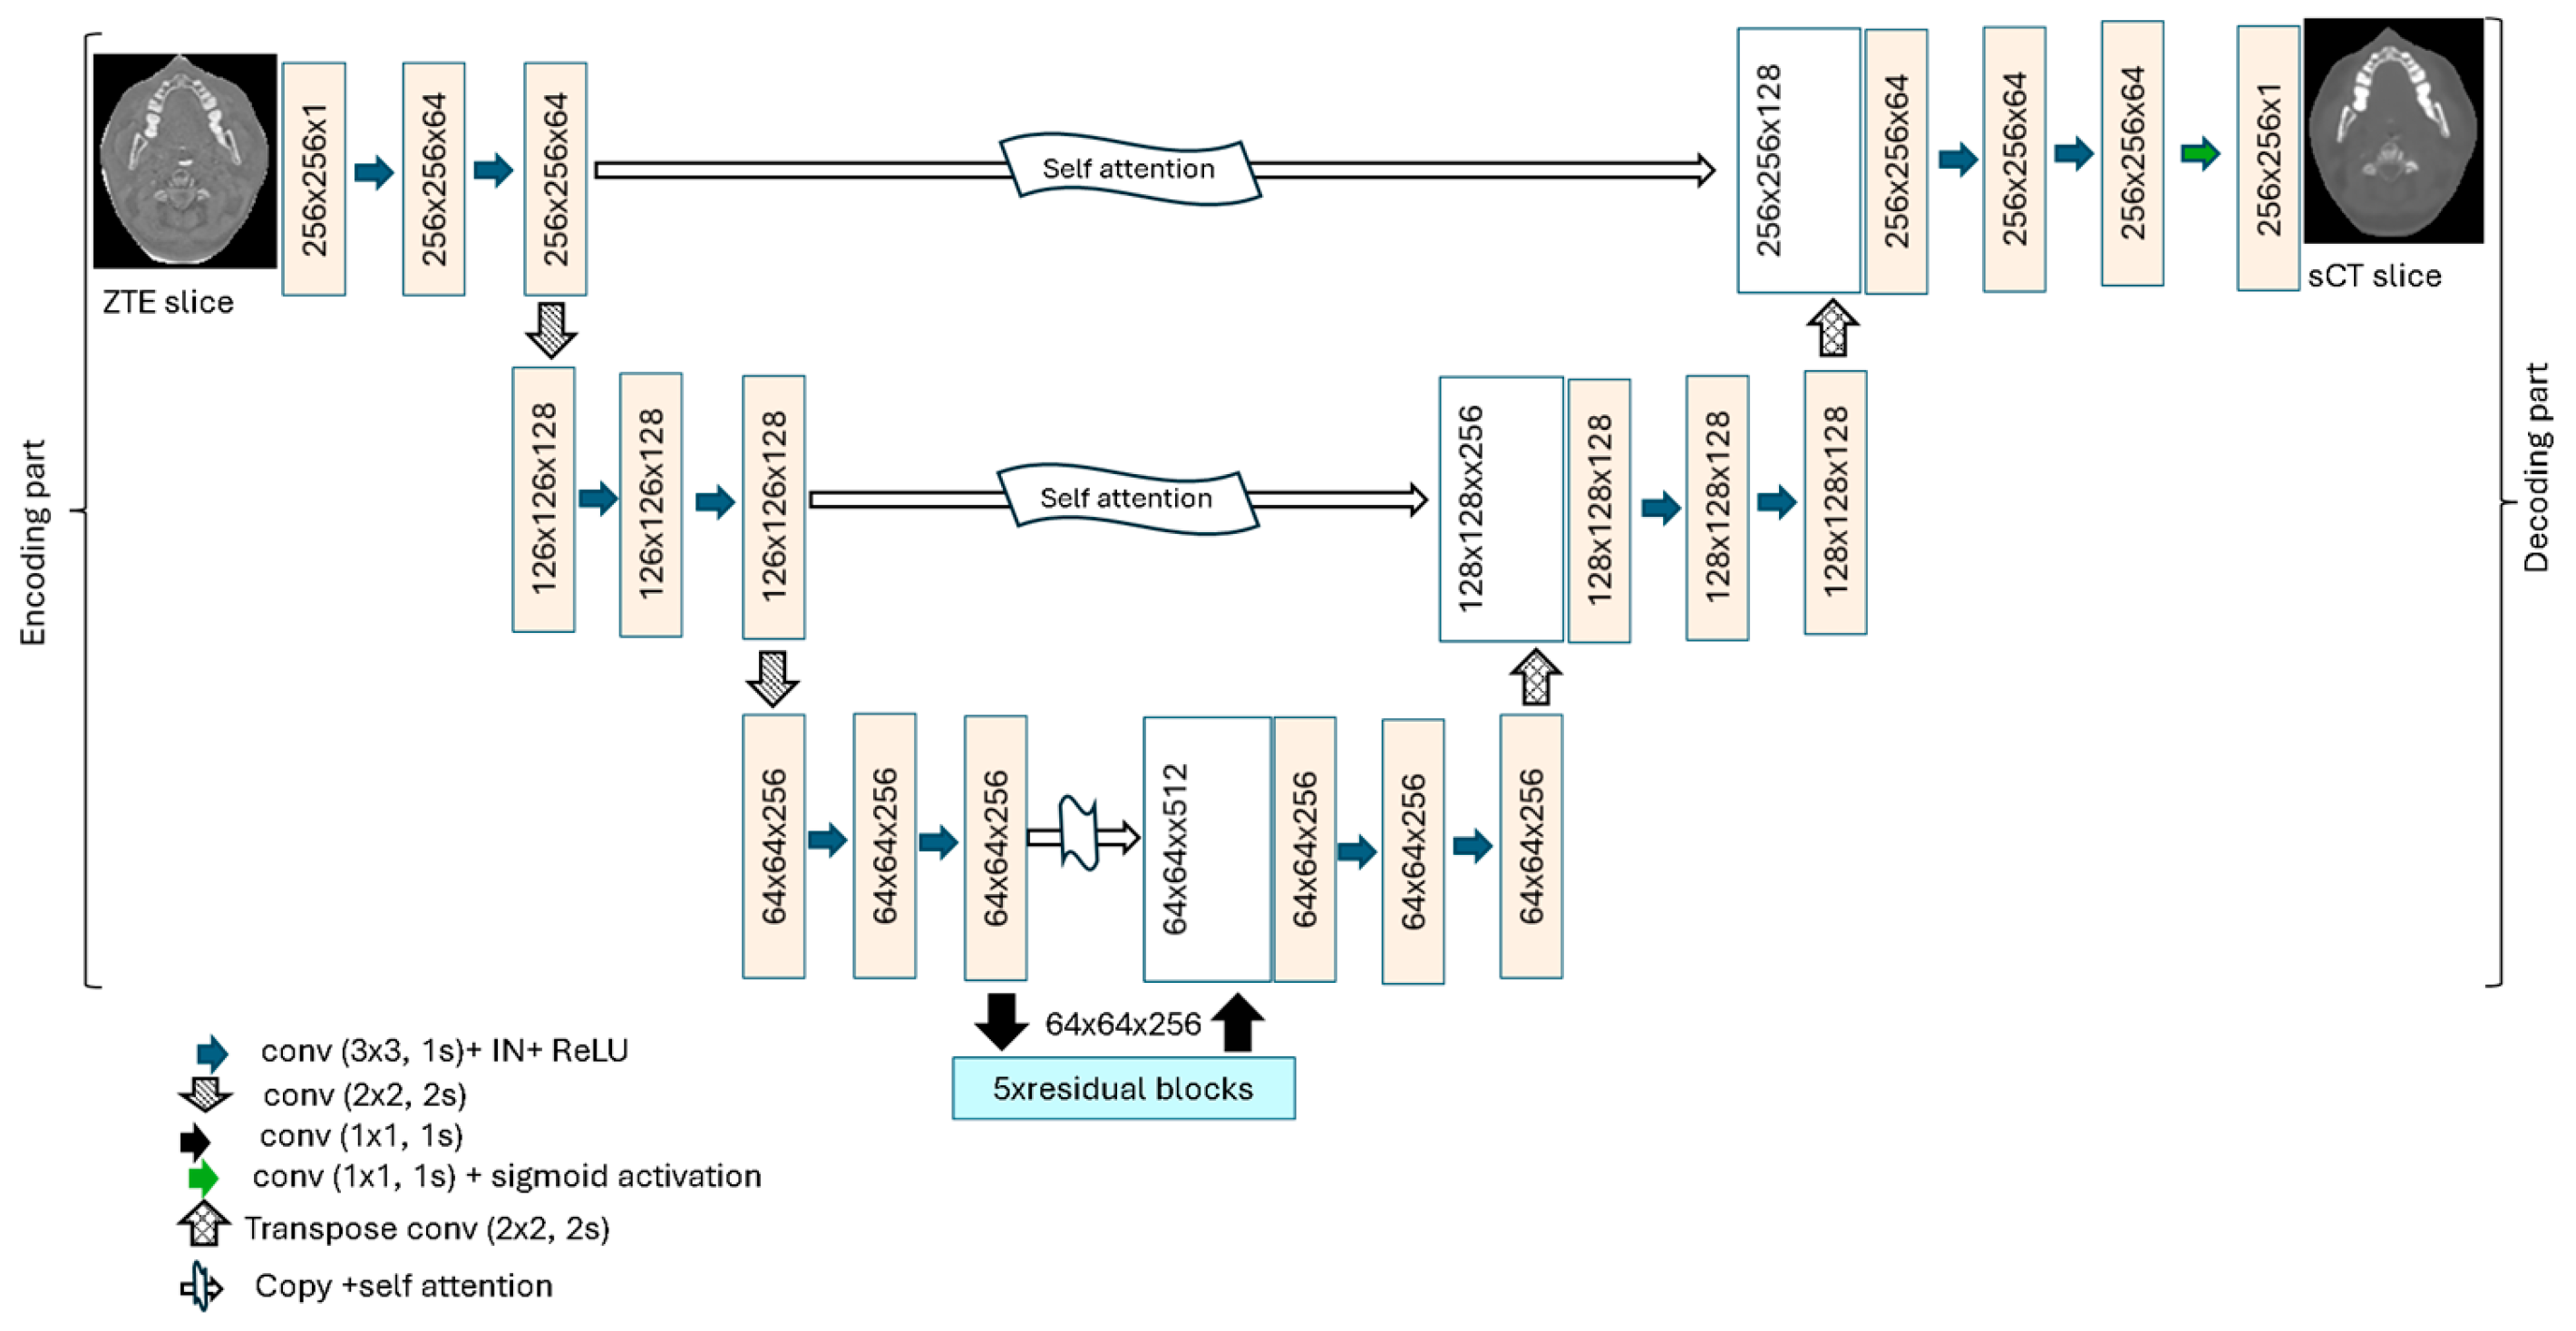
Development of a novel synthetic CT (sCT) generation framework: A 2D attention deep residual U-Net (ADR-Unet) that extends the standard U-Net by incorporating attention gates and deep residual units was proposed. The attention mechanisms enable the model to focus on anatomically relevant regions and suppress irrelevant features, while the residual blocks improve training stability by mitigating vanishing gradient issues.
-
Comprehensive benchmarking and validation: ADR-Unet was evaluated under both adversarial and non-adversarial training schemes and compared with baseline architectures (U-Net [23] and Unet++ [24]) adapted from image segmentation to sCT generation. The benefits of the architectural enhancements were validated through both geometric and dosimetric evaluations, demonstrating the superior performance of ADR-Unet for MR-only radiotherapy planning.

2. Materials and Methods

2.1. Data Description

2.1.1. Data Collection

A database, composed of CT and ZTE images, was collected prospectively from 17 patients treated for head and neck (HN) cancer in our institution. ZTE images were acquired after patient consent for participation in this IRB-approved study (protocol number IRGC-02-SI-010) on the same day of the CT scan and in parallel with other clinically used MRI. The CT scans were acquired with a SIEMENS scanner (Somatom Sensation 16-slice scanner, Siemens Healthineers, Forchheim, Germany) using 120 kVp, 190 mAs, a voxel size of 0.97 × 0.97 × 3 mm3, and a matrix size of 512 × 512. ZTE MR images were acquired on GE 1.5T Optima 450w using the GEM RT Head & Neck coil suite (GE HealthCare, Chicago, IL, USA). Sequence parameters were flip angle, FA = 2º, receiver bandwidth ± 50 kHz, repetition time TR = 5.1 ms, nominal echo time TE ≈ 0 ms, field of view FOV = 350 mm, acquisition matrix 256 × 256, and a voxel size of 1.36 × 1.36 × 1.4 mm3. The scan time was ~5 min. For image encoding, 3D straight, center-out, radial spokes (384 spokes per segment) were scanned sequentially in a smooth spiral trajectory along the surface of spherical k-space. ZTE employs a readout gradient with a constant amplitude maintained throughout the scan, with only minor directional adjustments between repetitions. This method enables unique features, including silent scanning and a nominal zero echo time (TE = 0). An alternative method for bone imaging is UTE, which requires longer imaging times and produces a darker, more prominent bone signal due to increased susceptibility effects. However, this reduces the ability to differentiate cortical bone from medullary bone and other short-T2 tissues [22]. In contrast, ZTE offers the advantage of being a more rapid and silent sequence that is resistant to susceptibility artifacts.

2.1.2. Data Preprocessing

A reconstruction with logarithmic inversion of the grayscale that enhances bone and reduces signal from soft tissues was rendered by the GE ZTE module. In this paper, ZTE refers to this type of scan (Figure 1) and the sCT is predicted from this type of sequence.
Each patient’s CT/ZTE image pair was aligned rigidly and deformably using VelocityTM v4.0 (Varian Medical Systems, Palo Alto, CA, USA). The rigid registration was based on the optimization of a mutual information similarity measure. The deformable registration was a type of modified B-spline deformable with mutual information-based matching [25]. The CT was resampled to the same FOV of ZTE and is named pCT in this paper. To better evaluate the accuracy of sCT estimation, the HN region was separated from the non-anatomical background region using the segmentation module of the treatment planning system (TPS) EclipseTM v18.1 (Varian Medical Systems, Palo Alto, CA, USA).

2.2. Attention Deep Residual U-Net for sCT Generation

2.2.1. ADR-Unet Architecture

In this study, we developed a 2D ADR-Unet to learn a direct mapping function that transforms a ZTE slice (2D) as input into its corresponding CT slice (2D) as output. Due to limited training data, a 2D deep learning (DL) model was implemented. The model was trained using a dataset comprising all ZTE slices and their matching CT slices from paired ZTE/CT scans. Once trained, the model was applied slice-by-slice to a new ZTE, and the resulting 3D sCT was reconstructed by assembling the predicted slices.
ADR-Unet combines deep residual units (DRU) and self-attention gates (AG) within a U-Net-based architecture. The U-Net has a symmetric hierarchical structure consisting of encoding, bridge, and decoding components [23] (Figure 2). In this study, the encoder (Contracting Path) extracts features from the input image by performing convolutional operations followed by downsampling, which is performed using a 2 × 2 convolution with stride 2. This process captures contextual information and reduces spatial resolution. The bridge connects the encoding and decoding blocks and consists of five DRUs. The decoder (Expanding Path) propagates the features obtained from the bridge from coarser to finer resolution through upsampling (2 × 2 transpose convolution with stride 2). At each level, the corresponding features in the encoder are processed by the AG before being concatenated with the upsampling output and fed into convolution layers to generate denser representations. At the last level of the decoder, a 2D convolution with a sigmoid activation function is applied to map each 64-component feature vector to a normalized CT number (in [0, 1]). The output of the decoder is an image slice with the same dimensions as the encoder input, with the CT number obtained as follows:
X = X 0 × 4095 1024
where X0 and X are the normalized decoder output in [0, 1] and the estimated CT number, respectively.
The DRU consists of two 3 × 3 convolutional blocks and an identity mapping block (Figure 3a). Each convolutional block includes 3 × 3 convolution with stride 1, an instance normalization, and rectified linear unit (ReLU) activation layers. The identity mapping (skip connection) adds the output of the second convolutional block to the input of the DRU. This residual connection allows the network to learn more efficiently by preserving gradient flow and focusing on the residual mapping between input and output.
AG is incorporated during the decoding phase to enhance the focus on anatomically relevant regions (Figure 3b). It operates by projecting the input tensor into three separate feature spaces—λ, β, and φ—using 1 × 1 convolutions followed by instance normalization. An attention map is generated through an element-wise multiplication of λ and β, followed by ReLU activation, which emphasizes important spatial features. This map is then multiplied with φ to produce the refined output tensor, highlighting salient regions while suppressing less relevant features (Figure 3b) [26]. The resulting tensor is concatenated with the corresponding decoder feature map, allowing the AG to guide the network’s focus more effectively during reconstruction. Figure 2 shows how the AG is integrated with the U-Net backbone and DRU.
The entire network model could be considered a complex end-to-end mapping mechanism that converts an input ZTE slice into its corresponding CT slice. This mapping is learned by estimating the network parameters θ achieved by minimizing a loss or prediction error between the predicted images G(X,θ) (sCT) and the planning CT images Y (pCT). In this study, a loss function that is a weighted average of mean squared error, mean absolute error, and structural similarity index measure is used as follows:
L θ = α 0 M S E Y , G X , θ + α 1 M A E Y , G X , θ + α 2 1 S S I M Y , G X , θ , M S E Y , G X , θ = 1 / M i = 0 M Y i G X , θ i 2 M A E Y , G X , θ = 1 / M i = 0 M Y i G X , θ i S S I M Y , G X , θ = 2 μ x μ y + C 1 σ x y + C 2 μ x 2 + μ y 2 + C 1 σ x 2 + σ y 2 + C 2 ,
where α0, α1, and α2 are the weighting parameters of the loss function, M represents the number of pixels in the images, μx, μy, σx, σy are, respectively, mean intensity and standard deviation of G(X,θ) or Y intensities, σxy is the covariance between G(X,θ) (sCT) and Y (pCT), and C1 and C2 are constants to avoid measure instability. Combining MSE, MAE, and SSIM as a loss function for CT prediction from ZTE leverages their complementary strengths: MSE focuses on pixel-wise accuracy, MAE ensures robustness to outliers, and SSIM captures structural and perceptual quality by preserving anatomical details. This hybrid approach aims to improve both the quantitative accuracy and visual fidelity of the predicted CT images.

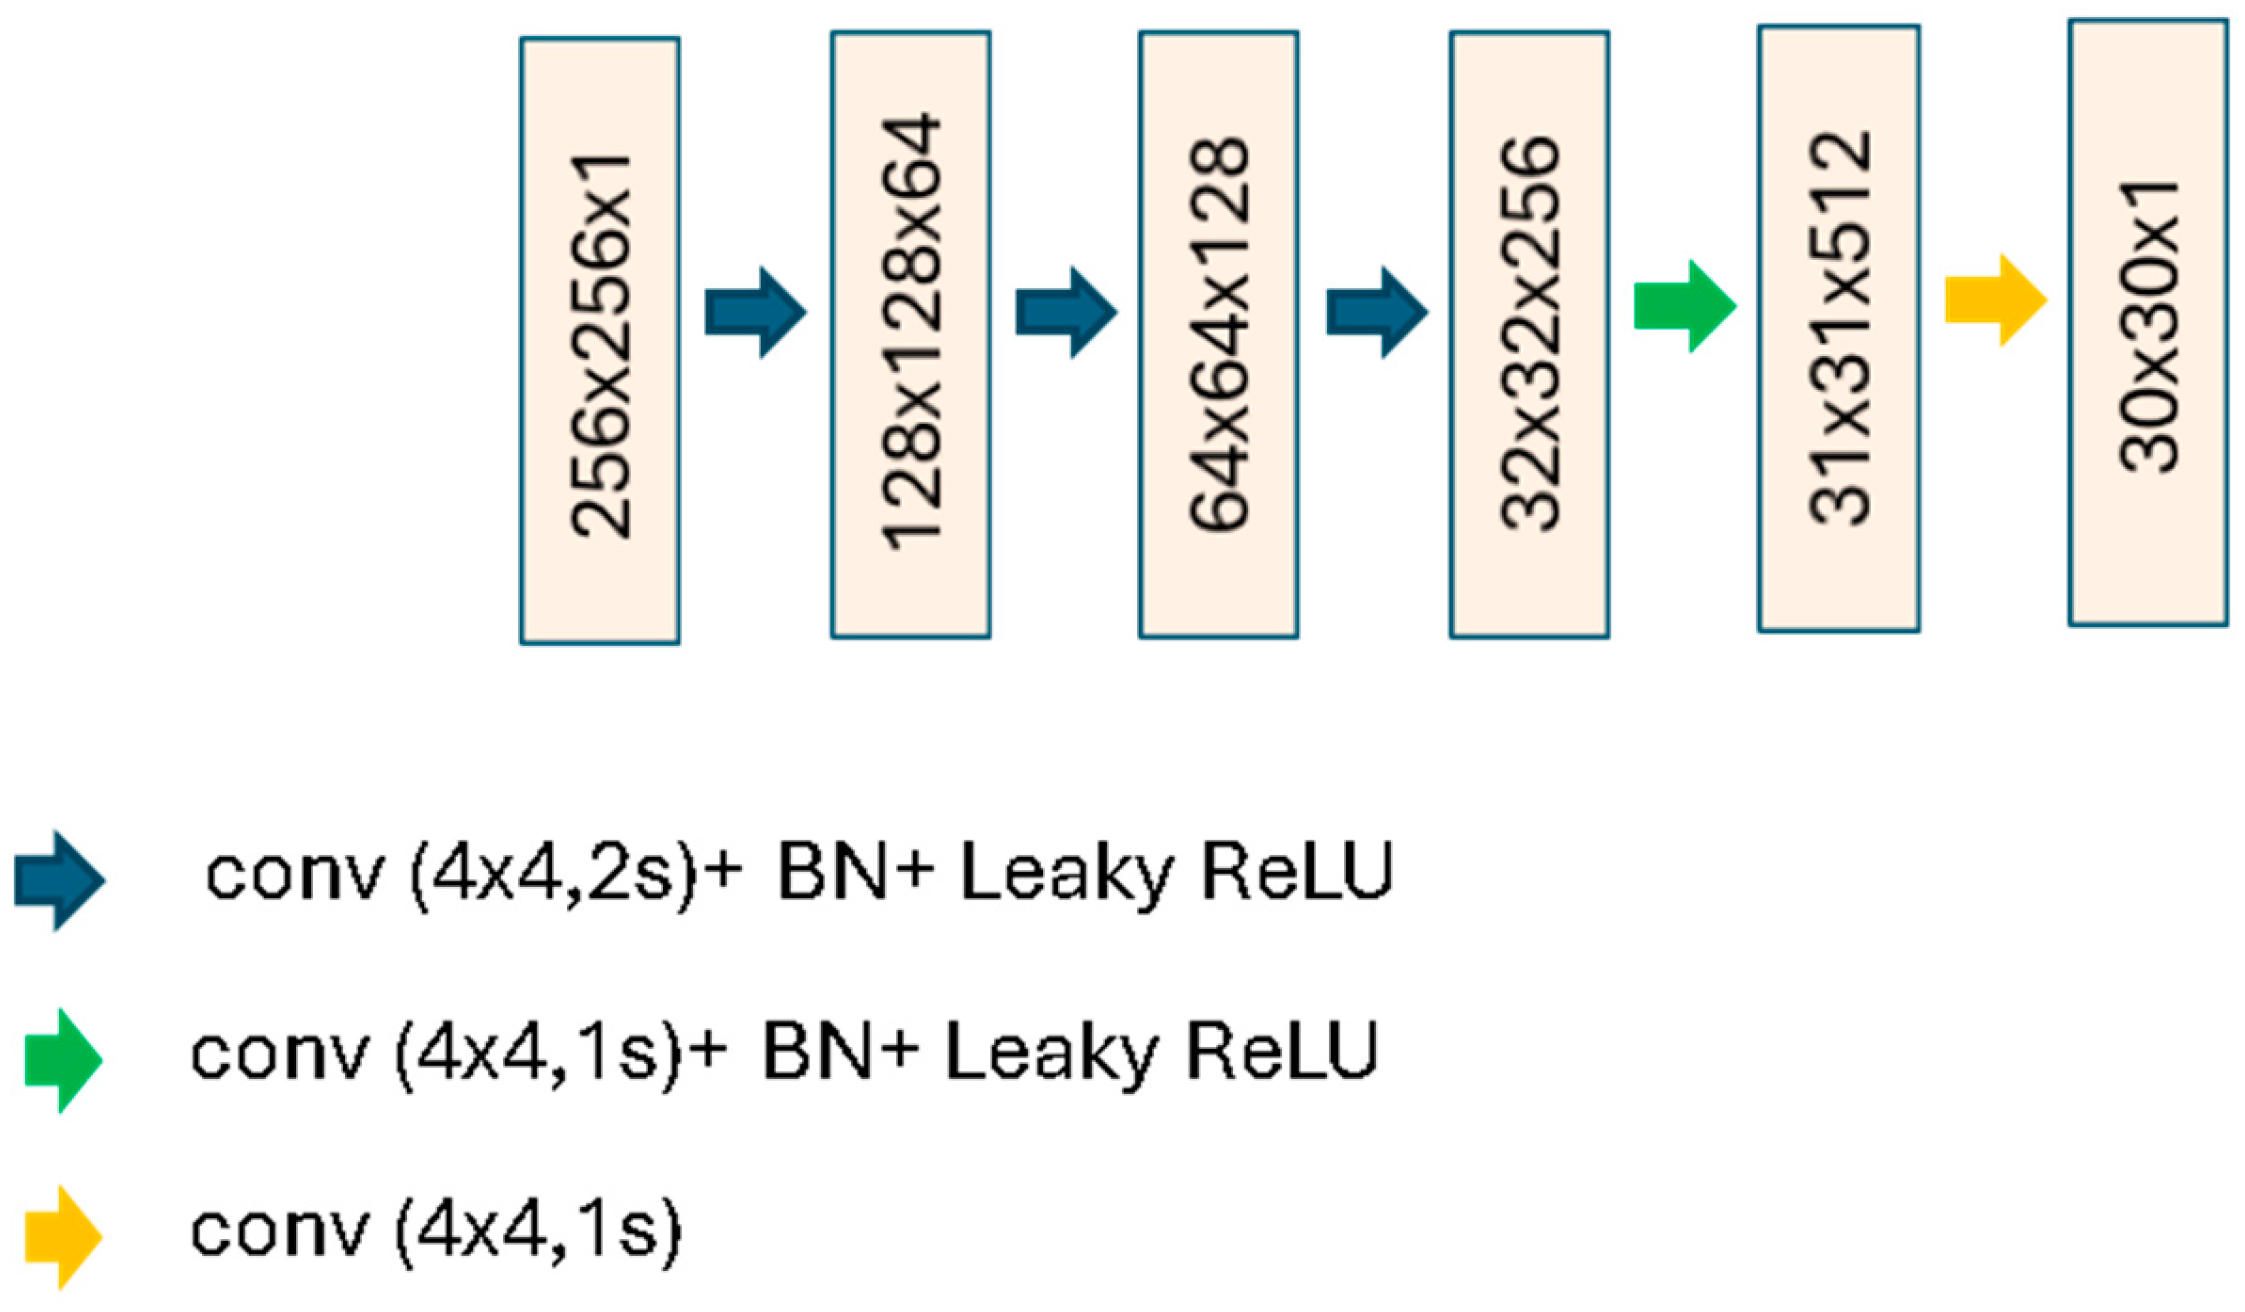
2.2.2. Conditional Generative Adversarial Network for sCT Generation

The conditional generative adversarial network (cGAN) introduced by Isola et al. [27] is adapted for the generation of sCT. cGAN is composed of a generator and a discriminator, which are ADR-Unet and PatchGAN (Figure 4), respectively. In the cGAN, the generator learns to map an input ZTE slice and random noise to the sCT slice. It aims to produce images that are indistinguishable from real ones. Meanwhile, the discriminator is trained to differentiate between real and generated images, improving the generator’s output over time. The discriminator DpCT is trained to minimize the mean square error between real and predicted images, with its total loss combining errors from both real and fake image classifications. The total loss DiL is
D i L = 1 2 D p C T p C T 1 2 + D p C T s C T 2 ,
where DpCT(pCT) and DpCT(sCT) are the output of the discriminator network (DpCT) when inputting pCT or sCT, respectively. The generator loss (GL) combines adversarial learning (MSE), pixel-wise reconstruction (MAE), and structural similarity constraints (SSIM), to ensure the generated sCT images are both realistic and structurally accurate compared to the original pCT images as follows:
G L = D p C T s C T 1 2 + λ s C T p C T + 1 S S I M s C T , p C T + 1 S S I M G p C T , p C T ,
where λ is a trade-off parameter between the MSE and the other measures and is fixed to 10. The first term is an adversarial loss that encourages the generator to produce sCT images that the discriminator classifies as real. The second term is an L1 reconstruction loss that minimizes pixel-wise differences between the generated sCT and real pCT images, reducing blurring. The third term is an SSIM loss that ensures the generated sCT image maintains structural similarity to the real pCT. The fourth term is a consistency loss that enforces structural consistency when the generator processes a real pCT image [28].

2.3. Comparison Networks

2.3.1. Unet++

ADR-Unet was compared with Unet++, as illustrated in Figure 5. Unet++ employs an encoder-decoder architecture [24]. The encoder, having a ResNet50 backbone, extracts five feature representations denoted as xi,0 across different depths. The encoder and decoder are connected through nested and dense skip connections that create intermediate convolutional layers at each resolution level, allowing multiscale feature aggregation. Within the skip pathways, convolutional blocks are used to refine the features before they are merged with the decoder. For instance, if x0,2 represents the feature map at depth i = 0 and stage j = 2 in the Unet++ architecture. x0,2 is obtained from the concatenation of x0,0, x0,1, and x1,1 along the channel dimension (Figure 5). x1,1 feature map, which has a smaller dimension than x0,1 due to downsampling in the encoder, is upsampled to match the spatial resolution of x0,2. In this study, the same loss as ADR-Unet was used.

2.3.2. U-Net

ADR-Unet and its adversarial version were also compared with U-Net [23], which was adapted for the task of image generation. U-Net employs an encoder-decoder architecture. The encoder had a ResNet50 backbone, and hence, was initialized with ResNet50 weights that were obtained from training on ImageNet. The network consists of five levels, including four downsampling levels and one bottom level. Each downsampling level contains two convolutional layers, while each upsampling level has one convolutional layer following concatenation. The architecture utilizes Gaussian Error Linear Unit (GELU) activation, Softmax for output activation, and batch normalization. Downsampling is achieved through max pooling, whereas upsampling is performed using reflective padding.

2.4. Implementation Details

The implemented networks were evaluated using leave-one-out cross-validation; for each patient in the database, sCT was generated from the remaining database patients. The algorithms were coded in Python using Keras 2.7.0 and TensorFlow-gpu 2.7.0 and trained on a cluster having the graphic card Tesla V100-PCIE-16 GB. ADR-Unet was trained from scratch with the convolution initialized randomly from a normal distribution. The backbone of Unet++ and U-Net was initialized using ResNet50 weights obtained for ImageNet training whereas the other network parameters were randomly initialized from a normal distribution. The loss function weights α0, α1, and α2 were fixed experimentally to 0.8, 0.1, and 0.1, respectively (Equation (2)). The ADAM optimizer, which is a stochastic gradient descent method that is based on adaptive estimation of first-order and second-order moments of the gradients, was used [29]. It has the advantage of being computationally efficient, having little memory requirements, being invariant to diagonal rescaling of the gradients, and being well suited for problems that are large in terms of data and/or parameters [29]. Warmup cosine decay was used to initialize the learning rate γ(t) of the optimizer. It is a learning rate schedule that combines a warmup phase with a cosine decay phase to adjust the learning rate during training:
γ t = γ 0 × t T w a r m u p ,       t < T w a r m u p   w a r m u p   p h a s e γ t = γ 0 × 0.5 1 + c o s π t T w a r m u p T T w a r m u p × t T w a r m u p ,       t T w a r m u p   d e c a y   p h a s e ,
where the initial learning rate γ0 = 0.001, the warmup step Twarmup = 1000, and the decay step T = 5000.
For ADR-Unet, Unet++, and U-Net, the batch size was set to 8, as permitted by the GPU used in this study, whereas a batch size of 1 gave good results for cGAN. The total number of epochs was 20. The total numbers of network trainable parameters were 11.4 M, 9.04 M, and 5.98 M, for ADR-Unet, Unet++, and U-Net, respectively. The generator of cGAN was ADR-Unet with the same number of parameters, whereas the discriminator had 2.76 M trainable parameters. For all training cases, data augmentations such as random flips, rotations with random angles in [−10°, 10°], and intensity scaling with random scale in [0.9, 1.1], were performed to increase data diversity. Training times were 0.41 h, 0.82 h, 1.16 h, and 4.1 h for U-Net, Unet++, ADR-Unet, and cGAN, respectively. All models maintained quick prediction times per patient, staying under 30 s.

2.5. Quantitative Evaluation of Synthetic CT and DRRs

The synthetic CTs were assessed in comparison to pCT for all patients in the database, focusing on the accuracy of voxel intensity estimation, preservation of structural information, and tissue classification accuracy. Error indices were computed for each patient, with averages and standard deviations calculated to provide an overall assessment of DL approaches. Statistical significance was determined using a paired one-tailed Wilcoxon signed-rank test at a 5% significance level. Four measurements, which are MAE (Equation (2)), mean error ME, SSIM (Equation (2)), and peak signal-to-noise ratio PSNR, were computed within the body contour B:
M E s C T ,   p C T = 1 N i   B s C T i p C T ( i ) P S N R s C T ,   p C T = 10   l o g M a x ( p C T ) 2 1 N i   B s C T i p C T ( i ) 2 ,
While MAE gives the average magnitude of errors between sCT and pCT intensity values, without considering the direction of the errors, ME explains the bias in MAE values towards overestimation or underestimation of pCT intensities. SSIM, with values in [0, 1], describes the structural similarity between sCT and pCT, with better preservation when values are close to 1. PSNR quantifies the level of distortion or loss introduced during generation in comparison to pCT, with higher values indicating better quality. Additionally, the range of CT intensities was divided into 20 HU bins, and MAEs were calculated for each bin. Computing MAEs across segmented intervals of the HU scale provides insight into how errors vary based on tissue types. The bone, soft tissues, and airways were segmented in sCT and pCT using the following thresholds: >200 HU, <−400, [−400, 200] for bones, airways, and soft tissues, respectively. The airways were separated from the lung voxels (<−400 HU) by postprocessing. The segmented structures in sCT were compared to those segmented on pCT using ME, DIce (DI), SEnsitivity (SE), and SPecificity (SP) indices for each class c of {bones, airways, soft tissues} [12].
The quality of the sCT-based digitally reconstructed radiographs (DRR) was compared to the pCT one using contrast-to-noise ratio (CNR), as the contrast is a key feature for structure identification in an image, and hence, for accurate image matching. CNR was computed from N ROI (7 × 7 pixels, mean intensity µi, maximum intensity maxi, and minimum intensity mini) delineated in the body region within DRR, as follows:
C N R = 20   log 10 c n ,
where the contrast c was defined based on the root mean square contrast measure [30],
c = 1 N μ i μ μ i μ with   μ = 1 N μ i ,
and the noise was estimated as:
n = 1 N m a x i m i n i ,

2.6. Dosimetric Evaluation Approach

For the dosimetric evaluation, the treatment planning system (TPS) EclipseTM v18.1 (Varian Medical Systems, Palo Alto, CA, USA) was used. pCT and sCT were rigidly registered to reference CT. Targets, organs at risk (OARs), and treatment plans were copied from reference CT to pCT and sCT. The contours were revised and corrected by an experienced clinician. Clinical targets are heterogeneous structures containing bone, soft tissues, and air cavity voxels (such as in Figure 6).
The OARs include right and left lenses (RL, LL), eyes (RE, LE), optic nerves (RON, LON), parotids (RP, LP), the brain stem (BS), the spinal cord (SC), and the larynx (Figure 6). The Clinical Planning OAR Volumes (PRVs) of optic nerves were created by adding a margin around the LON and RON according to our departmental guidelines (RON PRV, LON PRV). The same VMAT treatment plan was applied to both sCT and pCT. Clinical plans were with a dose prescription of 60 Gy in 30 fractions to the planning target volume (PTV) utilizing the 6 MV volumetric modulated arc (VMAT) technique. The dose distributions, over a grid of 2.5 × 2.5 × 2.5 mm3, were calculated in each scan using the Acuros dose calculation algorithm (version 18.1.0) [31] and compared based on dose–volume histogram (DVH) metrics and Gamma analysis. PTV coverages and OAR doses were compared between pCT and sCT using standard DVH metrics following ICRU Report No. 83 [32] and the QUANTEC guidelines [33]. The DVH metrics within sCT were benchmarked against the pCT metrics. The percentage of DVH metric deviation (PDMD) was calculated using absorbed doses for PTVs and OARs. PDMD of maximal dose (Dmax) was computed for BS, SC, RL, and LL, RE and LE, RON and LON, RON PRV, and LON PRV. PDMD of mean dose (Dmean) was computed for RP, LP, and larynx. PDMD of doses received by 95% of the volume (D95%) was computed for PTVs. Furthermore, the Gamma pass rates were calculated between the pCT and sCT dose distributions using the criteria of 2%/2 mm with global normalization.

3. Results

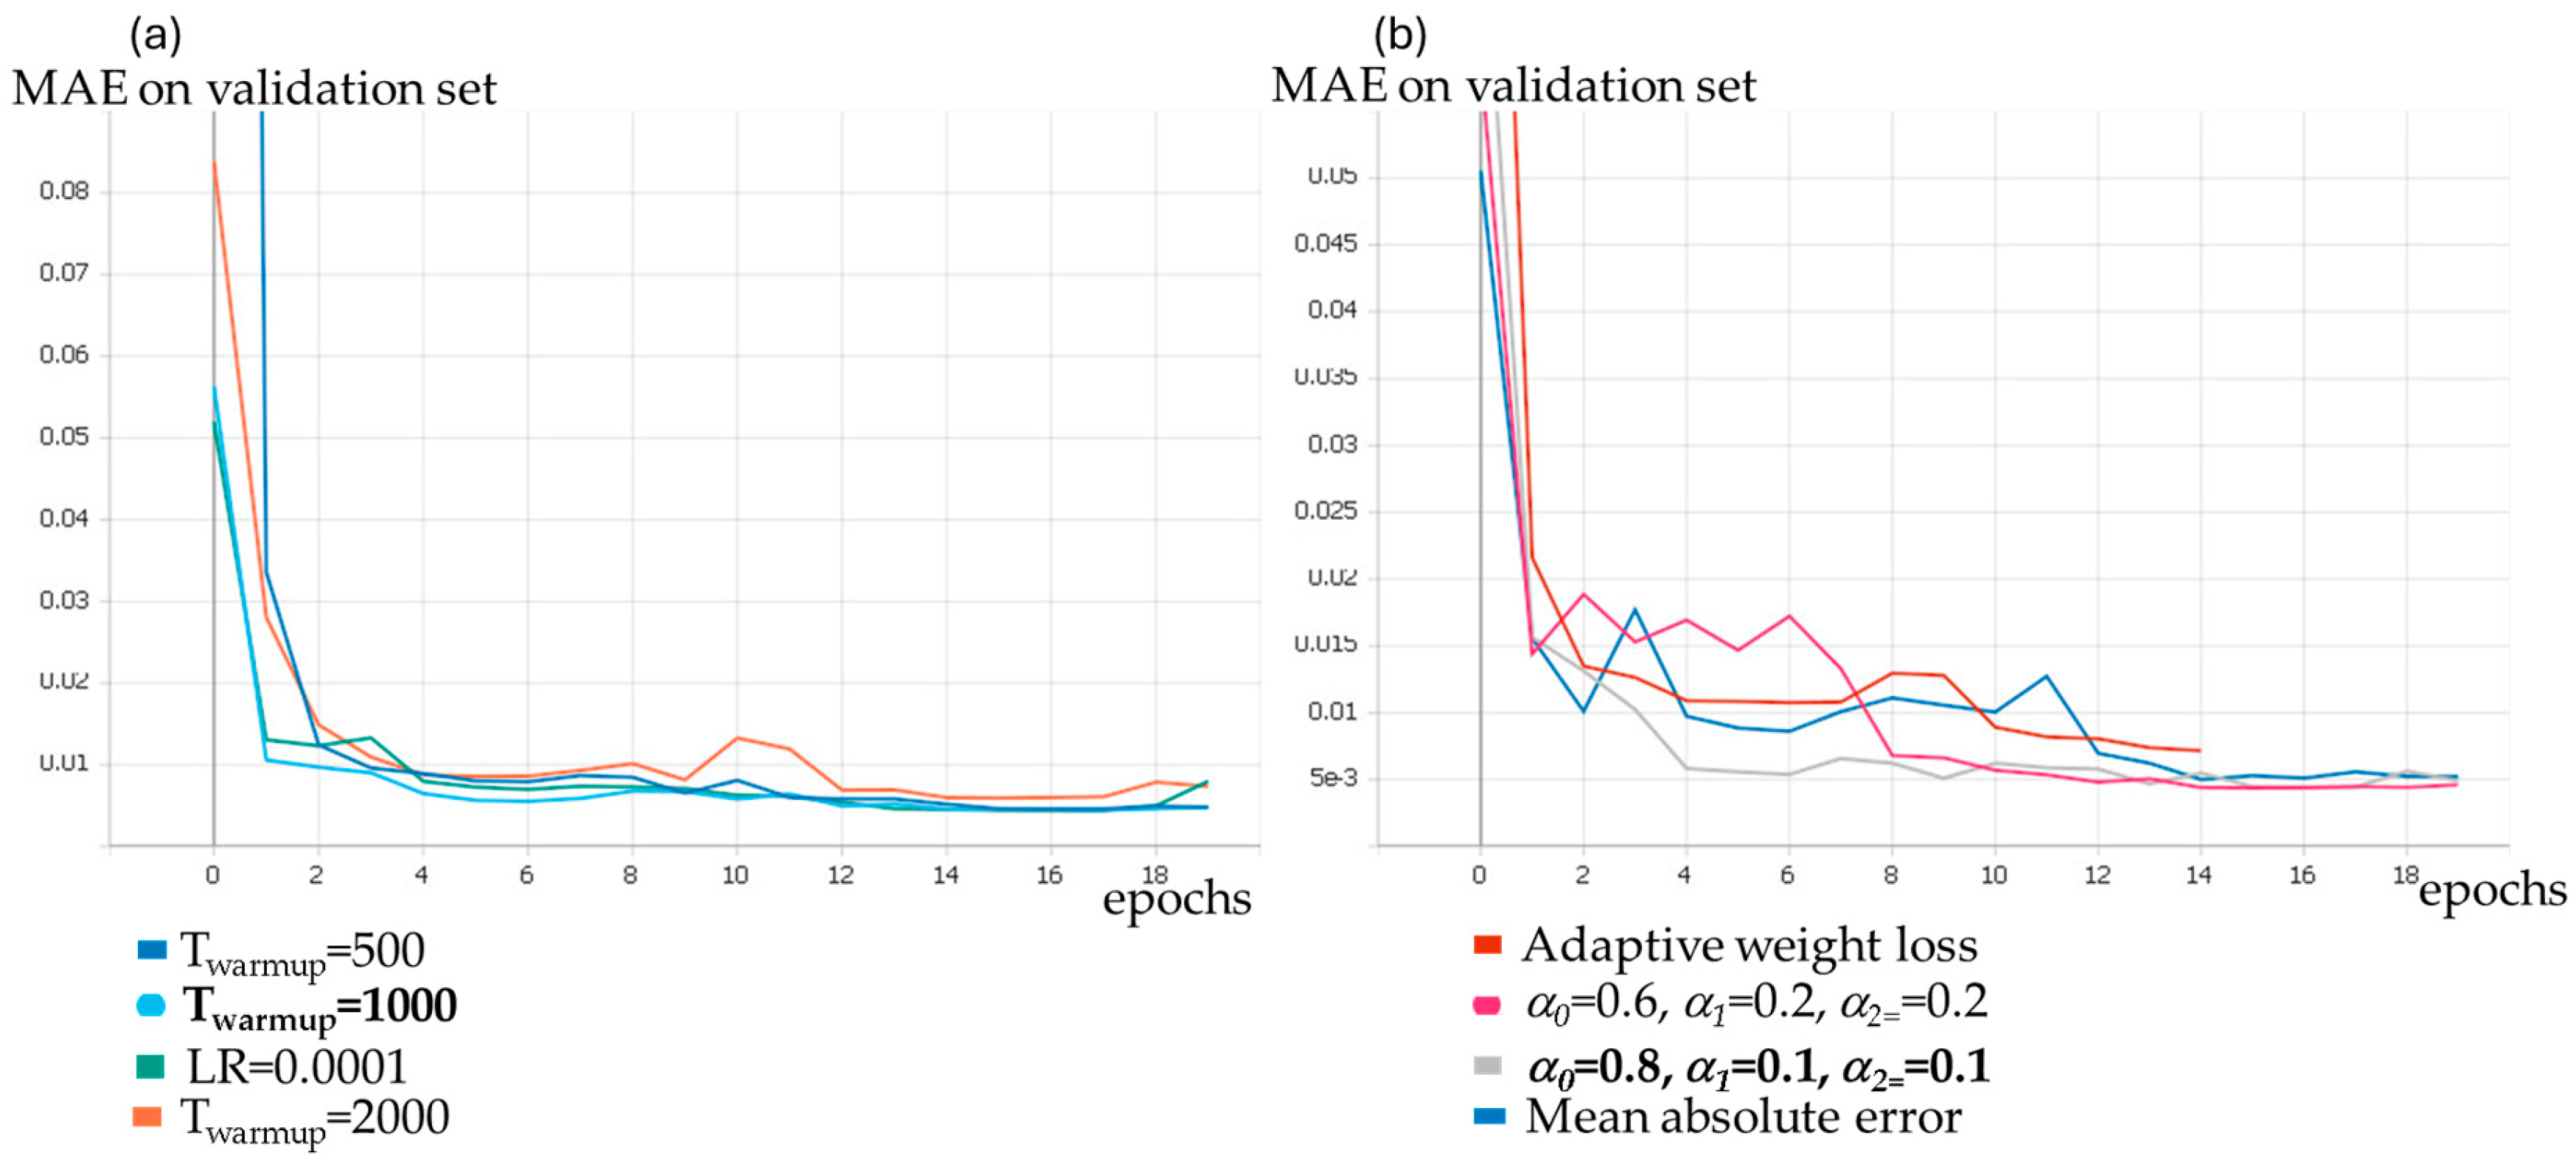
3.1. Parameters Selection

The impact of alternative weight combinations and learning rate schedules was investigated for the ADR-Unet. Figure 7 illustrates how the mean absolute error (MAE) evolves over training epochs for randomly selected validation patients under various configurations. Figure 7a shows the results for different warmup steps, Twarmup = 500, 1000, 2000, and fixed learning rate, LR = 0.0001, while the loss function weights α0 = 0.8, α1 = 0.1, and α2 = 0.1 were used. Among these, Twarmup = 1000 achieved the most favorable MAE reduction trend. Figure 7b shows the results for different losses: two losses with weights α0 = 0.8, α1 = 0.1, α2 = 0.1, and α0 = 0.6, α1 = 0.2, α2 = 0.2, respectively, the standalone MAE loss, and the adaptive weighted loss proposed in [34]. The loss function in Equation (2) with weights α0 = 0.8, α1 = 0.1, and α2 = 0.1 led to the most effective MAE reduction, with MAE = 54.55 HU, whereas the adaptive loss plateaued at MAE = 68.12 HU. Overall, the curves converged to similar MAE values, except for adaptive weighted loss, which yielded consistently higher errors. In this study, the results are generated using warmup cosine decay with Twarmup = 1000 and loss as in Equation (2), with α0 = 0.8, α1 = 0.1, and α2 = 0.1.

3.2. Validation of Image Registration

Rigid and deformable registration were visually validated by transforming the organs at risk (OARs) and the planning target volume (PTV) from planning CT to the ZTE. Figure 8 shows the superposition of the OARs and PTV to the ZTE, for a typical patient, demonstrating good anatomical detail preservation.
Table 1 presents a quantitative evaluation of deformable registration accuracy using two key metrics—warp magnitude and Jacobian determinant—computed for OARs and PTV using Velocity software [35]. Warp magnitude characterizes the magnitude of voxel displacements resulting from the deformation within a given structure. Jacobian determinant measures local volume change induced by the deformation field. A mean warp magnitude below 1.5 mm and mean Jacobian determinant ~1 across all evaluated structures was obtained indicating high-quality deformable registration, with minimal geometric deformation and good anatomical fidelity. Furthermore, the impact of using rigid + deformable registration over rigid-only alignment was quantitatively assessed based on MAE and Gamma index. Rigid + deformable registration reduced the MAE by approximately 21 HU and increased the Gamma (2%/2 mm) pass rate by 4.4%, demonstrating the benefit of more accurate spatial correspondence.

3.3. Image Quality Assessment of Attention Deep Residual U-Net

The sCT generation approaches were evaluated qualitatively and quantitatively. Figure 9 shows a visual comparison between the four approaches ADR-Unet, U-Net, Unet++, and cGAN based on the generation of image difference maps with pCT (pCT-sCTADR-Unet, pCT-sCTU-Net, pCT-sCTUnet++, pCT-sCTcGAN) for typical HN image slices. The four methods gave satisfying visualizations. These figures also show higher intensity differences in air- tissue and bone-tissue boundaries, indicating that the models struggle primarily with sharp intensity transitions—especially at cortical bone interfaces—rather than with errors within the trabecular bone. Table 2 gives MAE, ME, PSNR, and SSIM measurements obtained for the four sCT generation approaches. ADR-Unet outperformed U-Net and Unet++ (statistical significance was obtained for MAE and ME). The ADR-Unet and cGAN results were close. ME, for both approaches, presented standard deviations higher than mean values, indicating the absence of a consistent pattern in the errors. The four approaches had SSIM close to 1, showing that sCTs preserve anatomical details and maintain the intensity relationships between different tissues similarly to pCT. PSNR, which focuses on pixel-wise intensity accuracy, was >40 db for all approaches, demonstrating that sCTs closely match the real CT, with minimal noise and artifacts. ADR-Unet gave the highest PSNR, followed by cGAN, U-Net, and Unet++, in this order.
The calculation of MAE per bin of 20 HU is shown in Figure 10 for all approaches. Higher errors were obtained for air cavities and lung (HU < −400) and bones (HU > 200), compared to soft tissues. ADR-Unet and cGAN outperformed U-Net and Unet++ for low (HU < −400) and high intensities (HU > 200). The error-bin analysis is consistent with the difference map displayed in Figure 9, comparing sCTs to pCT. Table 3 shows that Dice and sensitivity similarity coefficients for bones, airways, and soft tissue segmentations were higher using ADR-Unet prediction compared to U-Net (p < 0.05 for the bone Dice index DIbone), and Unet++ (p < 0.05 for DIbone and the bone sensitivity index SEbone) and cGAN.
Figure 11 gives a visual assessment of lateral right and anterior-posterior DRRs generated from different sCT approaches in comparison to DRRs from pCT. A thresholding of CT values was used to render mainly bone structures (>200 HU). The percentage of intensity relative difference maps (DRRpCT − DRRsCT)/DRRpCT × 100 show similar patterns for the four approaches. Table 4 gives the average CNR for DRRs generated from pCT, sCTADR-Unet, sCTcGAN, sCTU-Net, and sCTUnet++. Overall, CNR measurements were closer to pCT, with ADR-Unet offering slightly better CNR compared to the three other approaches.

3.4. Dosimetric Evaluation

Figure 12 shows the average dosimetric errors and standard deviations obtained for HN OARs and PTVs using the four DL approaches. The highest percentage of dose metrics deviation (PDMD) was obtained for LON PRV Dmax = 0.64 ± 1.54, RL Dmax = 0.59 ± 1.2, RON Dmax = 0.86 ± 1.69, and LE Dmax= 1.13 ± 1.08 using ADR-Unet, cGAN, U-Net, and Unet++, respectively. cGAN demonstrated a lower overall PDMD compared to the three other approaches. cGAN had the lowest PDMD for BS, SC, LL, LE, LON, and RP, whereas U-Net had the lowest PDMD for RL, RE, LON PRV, and larynx. PTV D95% presented the lowest PDMD using ADR-Unet (0.003 ± 0.15). Although ADR-Unet presented better image quality, this enhancement was not uniformly reflected in the dose comparison.
The average Gamma pass rate for all DL approaches was above 99.4% for 2%/2 mm criteria, as shown in Table 2. Figure 13 shows the spatial distribution of pass/fail regions within the 3D gamma index map. For planning target volumes (PTVs) located in heterogeneous regions comprising both soft tissue and bone, a limited number of hotspots were observed at the bone–tissue interfaces within high-dose areas. These regions coincide with known challenges in HU prediction. Importantly, these discrepancies were confined to areas where high-dose delivery is necessary, while sparing adjacent healthy tissues. Notably, ADR-Unet gave the fewest number of hotspots, reflecting improved dosimetric agreement with the planning CT.

4. Discussion

In this study, deep learning methods (ADR-Unet, cGAN, U-Net, and Unet++) were employed to generate sCT from a database of deformably aligned ZTE/pCT pairs in HN patients. The ZTE/CT dataset was prospectively collected from 17 HN patients. This research holds clinical significance as it showcases the feasibility of an MR-only radiotherapy workflow using specialized ZTE sequences and deep learning, evaluated through both image quality and dosimetry assessments. To mitigate overfitting due to dataset size, cross-validation, 2D implementation, and data augmentation strategies were used. A leave-one-out cross-validation (LOOCV) procedure was performed to evaluate the four techniques. LOOCV maximizes data usage by training on 16 patients while testing on 1, ensuring all samples contribute to model learning. It provides a more reliable performance estimate by reducing bias from a fixed train/test split. Furthermore, it avoids the random partitioning variability seen in k-fold cross-validation, leading to more stable results for small datasets. sCTs were assessed qualitatively and quantitatively. Based on MAE values, the ranking of the different approaches was as follows: ADR-Unet, cGAN, Unet++, and U-Net. The largest MAE difference was observed between ADR-Unet and U-Net, which was originally designed for segmentation and later adapted for intensity prediction. This highlights the advantages of incorporating attention gates and deep residual blocks into U-Net. The multiscale feature aggregation in Unet++ provided a slight improvement over U-Net. However, cGAN, which utilized ADR-Unet as the generator and PatchGAN as the discriminator, did not enhance the performance beyond that of ADR-Unet alone. This aligns with the findings of Isola et al. [27], who stated that when the target output is less complex than the input (as in this case, where CT is less complex than ZTE, which includes soft tissue information), adding a cGAN discriminator does not necessarily improve results. The superposition of the curves of MAE in bins of 20 HU showed that the ADR-Unet and cGAN methods improved the estimation of bones and airways compared to Unet++ and U-Net. The values of the segmentation indices were higher for ADR-Unet compared to U-Net, Unet++, and cGAN, demonstrating the improvement of sCT generation. The image quality of DRRs generated from ADR-Unet was slightly better than the other three approaches with CNR > 42.2 db and closer to pCT’s CNR.
Table 5 shows a comparison between our implemented approaches and state-of-the-art approaches developed in the last five years. The median MAE was around 75.7 HU for head and neck, which is higher than the performance obtained from the four investigated approaches. To the best of our knowledge, only one recent approach used ZTE as input [36] in the last five years, which emphasizes the novelty of our approach to implement MR-only EBRT. As shown in Table 5, only Li et al. [37] had a performance close to ADR-Unet using a combination of 2D deep convolutional neural networks and transformers. With a comparable database size (20 patients), Klages et al. [38] obtained MAE = 92.4 ± 13.5 HU when using Dixon T1 MRI and pix2pix algorithm (cGAN with U-Net generator and PatchGAN discriminator). In contrast, our implementation of cGAN based on the attention deep residual U-Net trained on ZTE MRI achieved a significantly lower MAE of 57.66 ± 10.44 HU. These findings suggest that ZTE enhances anatomical fidelity in sCT prediction, particularly in bone-dominated areas where conventional MRI sequences often lack sufficient contrast.
VMAT radiotherapy treatment plans using the sCTADR-Unet, sCTcGAN, sCTU-Net, sCTUnet++ and Acuros dose calculation algorithm were assessed for HN OARs and PTVs. The PDMD computed between each sCT type and pCT was compared, as shown in Figure 12. The PDMDs of the OARs and the PTVs were within 2.56% and 1.22%, respectively, and hence, within the range of photon dose calculation uncertainties (2–3%) reported in the AAPM REPORT NO. 85 of Task Group No. 65 [39]. The Gamma pass rate under 2%/2 mm was also high (>99.4%) for the four approaches, demonstrating that DL techniques for sCT generation could be promising for the implementation of MR-only radiotherapy. cGAN demonstrated lower dosimetric errors in comparison to the other DL techniques. Hence, the slight enhancement in sCTARD-Unet does not translate into dosimetric improvement. Potential reasons for the dosimetric deviations could include registration errors, underestimation of bone HU values, and overestimation of the fat region.
This study employed 2D deep learning methods due to the limited dataset size, acknowledging the loss of inter-slice context. However, dosimetric analysis showed that the spinal cord’s dose deviations were minimal (<0.7%), likely due to its size, location in low-dose gradient areas, and strict clinical dosimetric constraints. In contrast, higher deviations were observed for the eyes (2.56%), indicating greater sensitivity to per-slice intensity accuracy compared to inter-slice uncertainties. Overall, the 2D approaches achieved clinically acceptable dosimetric performance within the 2–3% range, supporting their suitability for MRI-only radiotherapy. We are currently investigating 2.5D patch-based models [40] that preserve cross-slice continuity while being robust to small-size databases.
Table 5. Overview of the state-of-the-art studies for the generation of sCT from MRI of the HN using deep learning compared to our implemented approaches (ADR-Unet, cGAN, U-Net, Unet++).
Authors and YearNumber of PatientsMRI Sequence TypeMethodMAE (HU)
Current study, 202517ZTE/1.5 T GE
MR450w/
ADR-Unet55.49 ± 7.79
cGAN57.66 ± 10.44
U-Net60.06 ± 10.94
Unet++59.32 ± 7.09
Lauwers et al., 2025 [36]127ZTE/1.5 T GE
MR450w/
multi-task 2D U-Net94 ± 11
Ang et al., 2022 [41]51T2 Dixon2D cGAN with hybrid loss68.22 ± 35.63
Dinkla et al., 2019 [42]34T2 Dixon/3 T PhilipsU-Net/DR/3D75 ± 9
Palmér et al., 2021 [43]44T1 Dixon Vibe/1.5 T Siemens DCNN/RR + DR/2D67 ± 14
Klages et al., 2019 [38]20T1 Dixon Fast Field Echo (FFE)/3 T Philips cGAN (Pix2Pix)/DR/2D92.4 ± 13.5
cycle-GAN/DR/2D100.7 ± 14.6
Largent et al., 2020 [44]83D T2/1.5 T GEGAN/RR and DR/2D82.8 ± 48.6
Wang et al., 2019 [45]33T2 TSE/1.5 T Siemens U-Net/RR and DR/2D131 ± 24
Li et al., 2023 [37]78T1/3 T Philips2D DCNN + transformers53.88± 3.33
Peng et al., 2020 [46]173T1/3 T PhilipscGAN/DR/2D69.7 ± 9.3
cycle-GAN (unregistered pairs)/-/2D100.6 ± 7.7
Thummerer et al., 2020 [47]273D spoiled gradient recalled echo/3 T Siemens DCNN/DR/2.5D65.4 ± 3.6
Tie et al., 2020 [48]32T1,T1c, T2/1.5 T Siemens cGAN (Pix2Pix)/RR/2D75.7 ± 14.6
Qi et al., 2020 [21]45T1, T2, T1c, T1DixonccGAN/RR/2DT1 = 75.2 ± 11.5
T2 = 87.0 ± 10.8
T1C = 80.0 ± 10.9
T1Dixonc = 86.3 ± 10.8
Multiseq. = 70.0 ± 12.0
U-Net/RR/2D71.3 ± 12.4
Abbreviations: GAN: generative adversarial network, MAE: mean absolute error; RR: rigid registration; DR: deformable registration; DCNN = deep convolutional neural network. T1c: Contrast-enhanced T1, T1Dixonc: Contrast-enhanced T1 with Dixon reconstruction.
All the implemented models achieved full-volume sCT generation in under 30 s on a Tesla V100 GPU, supporting their suitability for adaptive radiotherapy workflows, particularly in offline or near real-time settings. Although developed on high-end hardware, the use of 2D architecture facilitates deployment on more widely available GPUs, enhancing accessibility and integration into clinical environments. For now, this is a standalone solution that takes the ZTE MR sequence (in DICOM format) exported from the MR console as input and generates a synthetic CT image, also in DICOM format, which can be imported directly into the treatment planning system for clinical use. ZTE and CT acquisitions were performed on the same day, ensuring anatomical consistency and minimizing registration errors. Nonetheless, we acknowledge potential failure modes in cases involving dental artifacts or post-surgical anatomy that may not be well represented in the training data. Future work will explore artifact-aware training strategies to improve model robustness and generalizability. Importantly, clinical implementation should continue to include quality assurance procedures—such as dose recalculation or physician review—especially for high-risk anatomical regions.
This study has certain limitations. The HN region is susceptible to both inter- and intra-scan motion, even when patients are scanned using an immobilization mask during planning CT and MRI. This makes it difficult to accurately register sCT and pCT and may cause dose differences that are not linked to sCT intensity accuracy but to residual misregistration and anatomical mismatch. However, the validation process described in Section 3.2 demonstrated the good quality of the registration performed using Velocity for the purpose of this study and the benefit of combining both rigid and deformable registration over rigid-only alignment. Fortunati et al. [49] quantified MRI-CT deformable registration errors in the head and neck regions to 1.7 mm and stated that even small minor segmentation variations (Dice > 0.8) can lead to clinically significant dose discrepancies, up to 11 Gy. In this work, dosimetric agreement, due to both registration and DL model performance, was acceptable (within 2 to 3%). In future work, a phantom-based study, where the doses are compared to real doses measured using detectors, is planned to assess model performance independently from registration errors due to comparison with reference CT. Secondly, the database is trained and tested on patients from the same center. Multi-center validation is essential to assess robustness, especially given the variability in head and neck anatomy that may be due to dental implants or surgical alterations. Thirdly, the zTE sequence, although it is silent, requires additional time to T1 and/or T2 MRI that are still acquired for tumor and OAR delineations. According to Lauwers [36], this time could be reduced to 56 s but testing on more patients is needed. Previous work [50] has reported time savings of approximately 15 min with MR-only simulation compared to combined CT-MR workflows, and depending on institutional logistics, this can extend to several hours [51]. Importantly, the ZTE sequence is silent and eliminates the need for patient transport between modalities, further enhancing comfort. Finally, the impact of the size of the training database on sCT should be further evaluated. As part of future work, we plan to expand the dataset by enrolling additional patients and to systematically investigate the effect of training set size on model performance. Specifically, models will be trained using 100% of the data as a reference, followed by reduced subsets (50% and 25%) to assess generalizability and data efficiency.

5. Conclusions

In this prospective study, we proposed a novel attention deep residual U-Net method for the prediction of sCT from ZTE that was implemented in adversarial (cGAN) and non-adversarial (ADR-Unet) architecture. cGAN consists of ADR-Unet as the generator and PatchGan as the discriminator. ADR-Unet enhances the U-Net architecture by additional attention gates and deep residual units. The inclusion of additional attention gates enhances the model’s ability to focus on relevant anatomical features by suppressing irrelevant or noisy regions in the input images. Deep residual units address the vanishing gradient problem by using skip connections that allow gradients to flow directly through the network, ensuring the effective training of deeper architectures. ADR-Unet and cGAN were compared to U-Net and Unet++ and several approaches found in the literature. They demonstrated significant improvement in sCT intensities based on several quantitative measurements. Dosimetric findings showed that the four types of synthetic CT (sCTADR-Unet, sCTcGAN, sCTU-Net, sCTUnet++) may be investigated for MRI-only treatment planning using VMAT, with the best performance obtained with cGAN. These findings highlight the potential of ZTE-based sCT generation using deep learning for MRI-only workflows. Future work will focus on expanding the dataset and evaluating generalizability across centers.

Author Contributions

Conceptualization, S.A., T.T., P.C. and M.R.; methodology, S.A.; software, S.A.; validation, S.A., M.B. and A.A.-S.; formal analysis, S.A., P.C. and M.R.; investigation, S.A., T.T., S.P., P.C. and M.R.; resources, R.H. and N.A.-H.; data curation, S.A., M.B. and A.A.-S.; writing—original draft preparation, S.A.; writing—review and editing, S.A., M.B., A.A.-S., T.T., S.P., P.C. and M.R.; visualization, S.A.; supervision, S.A., R.H. and N.A.-H.; project administration, S.A.; funding acquisition, S.A., R.H. and N.A.-H. All authors have read and agreed to the published version of the manuscript.

Funding

This research was funded by the Medical Research Center at Hamad Medical Corporation, Doha, Qatar, grant number IRGC-02-SI-010.

Institutional Review Board Statement

This study was conducted in accordance with the Declaration of Helsinki and approved by the Institutional Review Board (or Ethics Committee) of Hamad Medical Corporation (protocol code IRGC-02-SI-010 and date of approval 29 September 2024).

Informed Consent Statement

Informed consent was obtained from all the subjects involved in this study.

Data Availability Statement

The data cannot be made publicly available upon publication because they are owned by a third party and the terms of use prevent public distribution. The data that support the findings of this study are available upon reasonable requests from the authors.

Acknowledgments

The authors are grateful to the pretreatment team and the oncologists of the Department of Radiation Oncology for their assistance in patient recruitment and ZTE acquisitions.

Conflicts of Interest

All authors were employed by Hamad Medical Corporation. Authors declare that the research was conducted in the absence of any commercial or financial relationships that could be construed as a potential conflict of interest.

Abbreviations

The following abbreviations are used in this manuscript:
ADR-UnetAttention deep residual U-Net
AGSelf-attention gate
cGANConditional generative adversarial network
DLDeep learning
DRRDigitally reconstructed radiograph
DRUDeep residual unit
DVHDose–volume histogram
EBRTExternal beam radiotherapy
GELUGaussian error linear unit
HNHead and neck
LOOCVLeave-one-out cross-validation
OAROrgan at risk
PDMDPercentage of dose metric deviation
PTVPlanning target volume
PRVPlanning organ at risk volume
ReLURectified linear unit
sCTSynthetic CT
TPSTreatment planning system
UTEUltrashort time echo
VMATVolumetric modulated arc therapy
ZTEZero time echo

References

  1. Ingle, M.; Lalondrelle, S. Current Status of Anatomical Magnetic Resonance Imaging in Brachytherapy and External Beam Radiotherapy Planning and Delivery. Clin. Oncol. 2020, 32, 817–827. [Google Scholar] [CrossRef] [PubMed]
  2. Chandarana, H.; Wang, H.; Tijssen, R.H.N.; Das, I.J. Emerging Role of MRI in Radiation Therapy. J. Magn. Reson. Imaging 2018, 48, 1468–1478. [Google Scholar] [CrossRef]
  3. Daisne, J.-F.; Sibomana, M.; Bol, A.; Cosnard, G.; Lonneux, M.; Grégoire, V. Evaluation of a Multimodality Image (CT, MRI and PET) Coregistration Procedure on Phantom and Head and Neck Cancer Patients: Accuracy, Reproducibility and Consistency. Radiother. Oncol. 2003, 69, 237–245. [Google Scholar] [CrossRef]
  4. Kim, J.; Glide-Hurst, C.; Doemer, A.; Wen, N.; Movsas, B.; Chetty, I.J. Implementation of a Novel Algorithm For Generating Synthetic CT Images from Magnetic Resonance Imaging Data Sets for Prostate Cancer Radiation Therapy. Int. J. Radiat. Oncol. 2015, 91, 39–47. [Google Scholar] [CrossRef]
  5. Korhonen, J.; Kapanen, M.; Keyriläinen, J.; Seppälä, T.; Tenhunen, M. A Dual Model HU Conversion from MRI Intensity Values within and Outside of Bone Segment for MRI-Based Radiotherapy Treatment Planning of Prostate Cancer. Med. Phys. 2013, 41, 011704. [Google Scholar] [CrossRef] [PubMed]
  6. Yu, H.; Caldwell, C.; Balogh, J.; Mah, K. Toward Magnetic Resonance-Only Simulation: Segmentation of Bone in MR for Radiation Therapy Verification of the Head. Int. J. Radiat. Oncol. Biol. Phys. 2014, 89, 649–657. [Google Scholar] [CrossRef]
  7. Holmes, J.E.; Bydder, G.M. MR Imaging with Ultrashort TE (UTE) Pulse Sequences: Basic Principles. Radiography 2005, 11, 163–174. [Google Scholar] [CrossRef]
  8. Berker, Y.; Franke, J.; Salomon, A.; Palmowski, M.; Donker, H.C.W.; Temur, Y.; Mottaghy, F.M.; Kuhl, C.; Izquierdo-Garcia, D.; Fayad, Z.A.; et al. MRI-Based Attenuation Correction for Hybrid PET/MRI Systems: A 4-Class Tissue Segmentation Technique Using a Combined Ultrashort-Echo-Time/Dixon MRI Sequence. J. Nucl. Med. 2012, 53, 796–804. [Google Scholar] [CrossRef] [PubMed]
  9. Kapanen, M.; Tenhunen, M. T1/T2*-Weighted MRI Provides Clinically Relevant Pseudo-CT Density Data for the Pelvic Bones in MRI-Only Based Radiotherapy Treatment Planning. Acta Oncol. 2013, 52, 612–618. [Google Scholar] [CrossRef]
  10. Sjölund, J.; Forsberg, D.; Andersson, M.; Knutsson, H. Generating Patient Specific Pseudo-CT of the Head from MR Using Atlas-Based Regression. Phys. Med. Biol. 2015, 60, 825–839. [Google Scholar] [CrossRef]
  11. Uh, J.; Merchant, T.E.; Li, Y.; Li, X.; Hua, C. MRI-Based Treatment Planning with Pseudo CT Generated through Atlas Registration. Med. Phys. 2014, 41, 051711. [Google Scholar] [CrossRef]
  12. Aouadi, S.; Vasic, A.; Paloor, S.; Torfeh, T.; McGarry, M.; Petric, P.; Riyas, M.; Hammoud, R.; Al-Hammadi, N. Generation of Synthetic CT Using Multi-Scale and Dual-Contrast Patches for Brain MRI-Only External Beam Radiotherapy. Phys. Medica 2017, 42, 174–184. [Google Scholar] [CrossRef] [PubMed]
  13. Boulanger, M.; Nunes, J.-C.; Chourak, H.; Largent, A.; Tahri, S.; Acosta, O.; De Crevoisier, R.; Lafond, C.; Barateau, A. Deep Learning Methods to Generate Synthetic CT from MRI in Radiotherapy: A Literature Review. Phys. Medica 2021, 89, 265–281. [Google Scholar] [CrossRef] [PubMed]
  14. Aouadi, S.; Torfeh, T.; Bouhali, O.; Yoganathan, S.; Paloor, S.; Chandramouli, S.; Hammoud, R.; Al-Hammadi, N. Prediction of Cervix Cancer Stage and Grade from Diffusion Weighted Imaging Using EfficientNet. Biomed. Phys. Eng. Express 2024, 10, 045042. [Google Scholar] [CrossRef]
  15. Aouadi, S.; Torfeh, T.; Yoganathan, S.; Paloor, S.; Riyas, M.; Hammoud, R.; Al-Hammadi, N. Investigation of Radiomics and Deep Convolutional Neural Networks Approaches for Glioma Grading. Biomed. Phys. Eng. Express 2023, 9, 35020. [Google Scholar] [CrossRef]
  16. Sahiner, B.; Pezeshk, A.; Hadjiiski, L.M.; Wang, X.; Drukker, K.; Cha, K.H.; Summers, R.M.; Giger, M.L. Deep Learning in Medical Imaging and Radiation Therapy. Med. Phys. 2019, 46, e1–e36. [Google Scholar] [CrossRef]
  17. Sherwani, M.K.; Gopalakrishnan, S. A Systematic Literature Review: Deep Learning Techniques for Synthetic Medical Image Generation and Their Applications in Radiotherapy. Front. Radiol. 2024, 4, 1385742. [Google Scholar] [CrossRef] [PubMed]
  18. Lastrucci, A.; Wandael, Y.; Ricci, R.; Maccioni, G.; Giansanti, D. The Integration of Deep Learning in Radiotherapy: Exploring Challenges, Opportunities, and Future Directions through an Umbrella Review. Diagnostics 2024, 14, 939. [Google Scholar] [CrossRef]
  19. Aouadi, S.; Mohamed, N.; Aloudeh, J.; Zeid, M.; Bouhali, O.; Hammoud, R.; Al-Hammadi, N.; Torfeh, T. Review of Cervix Cancer Classification Using Radiomics on Diffusion-Weighted Imaging. In IntechOpen Bioinformatics and Medical Informatics; IntechOpen: London, UK, 2022; p. 13. [Google Scholar]
  20. Lauritzen, A.D.; Papademetris, X.; Turovets, S.; Onofrey, J.A. Evaluation of CT Image Synthesis Methods:From Atlas-Based Registration to Deep Learning. arXiv 2019, arXiv:1906.04467. [Google Scholar]
  21. Qi, M.; Li, Y.; Wu, A.; Jia, Q.; Li, B.; Sun, W.; Dai, Z.; Lu, X.; Zhou, L.; Deng, X.; et al. Multi-sequence MR Image-based Synthetic CT Generation Using a Generative Adversarial Network for Head and Neck MRI-only Radiotherapy. Med. Phys. 2020, 47, 1880–1894. [Google Scholar] [CrossRef]
  22. Wiesinger, F.; Ho, M.L. Zero-TE MRI: Principles and Applications in the Head and Neck. Br. J. Radiol. 2022, 95, 1–16. [Google Scholar] [CrossRef] [PubMed]
  23. Ronneberger, O.; Fischer, P.; Brox, T. U-Net: Convolutional Networks for Biomedical Image Segmentation. In Proceedings of the International Conference on Medical Image Computing and Computer-Assisted Intervention, Munich, Germany, 5–9 October 2015; pp. 234–241. [Google Scholar]
  24. Zhou, Z.; Rahman Siddiquee, M.M.; Tajbakhsh, N.; Liang, J. Unet++: A Nested U-Net Architecture for Medical Image Segmentation. In Deep Learning in Medical Image Analysis and Multimodal Learning for Clinical Decision Support; Lecture Notes in Computer Science; Springer: Cham, Switzerland, 2018; Volume 11045, pp. 3–11. [Google Scholar] [CrossRef]
  25. Lawson, J.D.; Schreibmann, E.; Jani, A.B.; Fox, T. Quantitative Evaluation of a Cone-beam Computed Tomography–Planning Computed Tomography Deformable Image Registration Method for Adaptive Radiation Therapy. J. Appl. Clin. Med. Phys. 2007, 8, 96–113. [Google Scholar] [CrossRef]
  26. Oktay, O.; Schlemper, J.; Folgoc, L.L.; Lee, M.; Heinrich, M.; Misawa, K.; Mori, K.; McDonagh, S.; Hammerla, N.Y.; Kainz, B.; et al. Attention U-Net: Learning Where to Look for the Pancreas. arXiv 2018, arXiv:1804.03999. [Google Scholar] [CrossRef]
  27. Isola, P.; Zhu, J.-Y.; Zhou, T.; Efros, A.A. Image-to-Image Translation with Conditional Adversarial Networks. In Proceedings of the 2017 IEEE Conference on Computer Vision and Pattern Recognition (CVPR), Honolulu, HI, USA, 21–26 July 2017; pp. 5967–5976. [Google Scholar]
  28. Taigman, Y.; Polyak, A.; Wolf, L. Unsupervised Cross-Domain Image Generation. arXiv 2016, arXiv:1611.02200. [Google Scholar]
  29. Kingma, D.P.; Ba, J. Adam: A Method for Stochastic Optimization. In Proceedings of the 3rd International Conference for Learning Representations, Banff, AB, Canada, 22 December 2014; pp. 1–13. [Google Scholar]
  30. Peli, E. Contrast in Complex Images. J. Opt. Soc. Am. A 1990, 7, 2032–2040. [Google Scholar] [CrossRef] [PubMed]
  31. Vassiliev, O.N.; Wareing, T.A.; McGhee, J.; Failla, G.; Salehpour, M.R.; Mourtada, F. Validation of a New Grid-Based Boltzmann Equation Solver for Dose Calculation in Radiotherapy with Photon Beams. Phys. Med. Biol. 2010, 55, 581–598. [Google Scholar] [CrossRef]
  32. Grégoire, V.; Mackie, T.R. State of the Art on Dose Prescription, Reporting and Recording in Intensity-Modulated Radiation Therapy (ICRU Report No. 83). Cancer Radiother. 2011, 15, 555–559. [Google Scholar] [CrossRef]
  33. Bentzen, S.M.; Constine, L.S.; Deasy, J.O.; Eisbruch, A.; Jackson, A.; Marks, L.B.; Ten Haken, R.K.; Yorke, E.D. Quantitative Analyses of Normal Tissue Effects in the Clinic (QUANTEC): An Introduction to the Scientific Issues. Int. J. Radiat. Oncol. 2010, 76, S3–S9. [Google Scholar] [CrossRef]
  34. Huq, A.; Pervin, M.T. Adaptive Weight Assignment Scheme for Multi-Task Learning. IAES Int. J. Artif. Intell. 2022, 11, 173. [Google Scholar] [CrossRef]
  35. Varadhan, R.; Karangelis, G.; Krishnan, K.; Hui, S. A Framework for Deformable Image Registration Validation in Radiotherapy Clinical Applications. J. Appl. Clin. Med. Phys. 2013, 14, 192–213. [Google Scholar] [CrossRef]
  36. Lauwers, I.; Capala, M.; Kaushik, S.; Ruskó, L.; Cozzini, C.; Kleijnen, J.P.; Wyatt, J.; McCallum, H.; Verduijn, G.; Wiesinger, F.; et al. Synthetic CT Generation Using Zero TE MR for Head-and-Neck Radiotherapy. Radiother. Oncol. 2025, 205, 110762. [Google Scholar] [CrossRef] [PubMed]
  37. Li, Y.; Xu, S.; Lu, Y.; Qi, Z. CT Synthesis from MRI with an Improved Multi-Scale Learning Network. Front. Phys. 2023, 11, 1–11. [Google Scholar] [CrossRef]
  38. Klages, P.; Benslimane, I.; Riyahi, S.; Jiang, J.; Hunt, M.; Deasy, J.; Veeraraghavan, H.; Tyagi, N. Comparison of Patch-Based Conditional Generative Adversarial Neural Net Models with Emphasis on Model Robustness for Use in Head and Neck Cases for MR-Only Planning. arXiv 2019, arXiv:1902.00536. [Google Scholar]
  39. Papanikolaou, N.; Battista, J.J.; Boyer, A.L.; Kappas, C.; Klein, E.; Mackie, T.R.; Sharpe, M.; Dyk, J. Van Tissue Inhomogeneity Corrections for Megavoltage Photon Beams; American Association of Physicists in Medicine: College Park, MD, USA, 2004. [Google Scholar]
  40. Kondo, S.; Kasai, S.; Hirasawa, K. Synthesizing 3D Computed Tomography from MRI or CBCT Using 2.5D Deep Neural Networks. arXiv 2023, arXiv:2308.13553. [Google Scholar]
  41. Ang, S.P.; Lam Phung, S.; Field, M.; Schira, M.M. An Improved Deep Learning Framework for MR-to-CT Image Synthesis with a New Hybrid Objective Function. In Proceedings of the IEEE International Symposium on Biomedical Imaging (ISBI) 2022, Kolkata, India, 28–31 March 2022; pp. 1–5. [Google Scholar] [CrossRef]
  42. Dinkla, A.M.; Florkow, M.C.; Maspero, M.; Savenije, M.H.F.; Zijlstra, F.; Doornaert, P.A.H.; van Stralen, M.; Philippens, M.E.P.; van den Berg, C.A.T.; Seevinck, P.R. Dosimetric Evaluation of Synthetic CT for Head and Neck Radiotherapy Generated by a Patch-based Three-dimensional Convolutional Neural Network. Med. Phys. 2019, 46, 4095–4104. [Google Scholar] [CrossRef]
  43. Palmér, E.; Karlsson, A.; Nordström, F.; Petruson, K.; Siversson, C.; Ljungberg, M.; Sohlin, M. Synthetic Computed Tomography Data Allows for Accurate Absorbed Dose Calculations in a Magnetic Resonance Imaging Only Workflow for Head and Neck Radiotherapy. Phys. Imaging Radiat. Oncol. 2021, 17, 36–42. [Google Scholar] [CrossRef]
  44. Largent, A.; Marage, L.; Gicquiau, I.; Nunes, J.-C.; Reynaert, N.; Castelli, J.; Chajon, E.; Acosta, O.; Gambarota, G.; de Crevoisier, R.; et al. Head-and-Neck MRI-Only Radiotherapy Treatment Planning: From Acquisition in Treatment Position to Pseudo-CT Generation. Cancer/Radiothérapie 2020, 24, 288–297. [Google Scholar] [CrossRef]
  45. Wang, Y.; Liu, C.; Zhang, X.; Deng, W. Synthetic CT Generation Based on T2 Weighted MRI of Nasopharyngeal Carcinoma (NPC) Using a Deep Convolutional Neural Network (DCNN). Front. Oncol. 2019, 9, 1333. [Google Scholar] [CrossRef]
  46. Peng, Y.; Chen, S.; Qin, A.; Chen, M.; Gao, X.; Liu, Y.; Miao, J.; Gu, H.; Zhao, C.; Deng, X.; et al. Magnetic Resonance-Based Synthetic Computed Tomography Images Generated Using Generative Adversarial Networks for Nasopharyngeal Carcinoma Radiotherapy Treatment Planning. Radiother. Oncol. 2020, 150, 217–224. [Google Scholar] [CrossRef]
  47. Thummerer, A.; de Jong, B.A.; Zaffino, P.; Meijers, A.; Marmitt, G.G.; Seco, J.; Steenbakkers, R.J.H.M.; Langendijk, J.A.; Both, S.; Spadea, M.F.; et al. Comparison of the Suitability of CBCT- and MR-Based Synthetic CTs for Daily Adaptive Proton Therapy in Head and Neck Patients. Phys. Med. Biol. 2020, 65, 235036. [Google Scholar] [CrossRef]
  48. Tie, X.; Lam, S.; Zhang, Y.; Lee, K.; Au, K.; Cai, J. Pseudo-CT Generation from Multi-parametric MRI Using a Novel Multi-channel Multi-path Conditional Generative Adversarial Network for Nasopharyngeal Carcinoma Patients. Med. Phys. 2020, 47, 1750–1762. [Google Scholar] [CrossRef] [PubMed]
  49. Fortunati, V.; Verhaart, R.F.; Angeloni, F.; van der Lugt, A.; Niessen, W.J.; Veenland, J.F.; Paulides, M.M.; van Walsum, T. Feasibility of Multimodal Deformable Registration for Head and Neck Tumor Treatment Planning. Int. J. Radiat. Oncol. 2014, 90, 85–93. [Google Scholar] [CrossRef] [PubMed]
  50. Tyagi, N.; Fontenla, S.; Zelefsky, M.; Chong-Ton, M.; Ostergren, K.; Shah, N.; Warner, L.; Kadbi, M.; Mechalakos, J.; Hunt, M. Clinical Workflow for MR-Only Simulation and Planning in Prostate. Radiat. Oncol. 2017, 12, 119. [Google Scholar] [CrossRef]
  51. Karlsson, M.; Karlsson, M.G.; Nyholm, T.; Amies, C.; Zackrisson, B. Dedicated Magnetic Resonance Imaging in the Radiotherapy Clinic. Int. J. Radiat. Oncol. 2009, 74, 644–651. [Google Scholar] [CrossRef] [PubMed]
Figure 1. An example of a ZTE sequence that corresponds to the logarithmic inverted grayscale of the true ZTE. Bones, airways, and background are enhanced. The field of view is displayed.
Information 16 00477 g001
Figure 2. Architecture of the attention deep residual U-Net. The size and number of feature maps are displayed in the rectangle. The input and output slice sizes are both 256 × 256 × 1. Residual and attention block architectures are shown in Figure 3. Abbreviations: Conv—convolution layer, IN—instance normalization layer, ReLU—rectified linear unit, Transpose Conv—transposed convolution layer. Conv (1 × 1, 2 × 2, or 3 × 3) and Conv (1 s or 2 s) indicate filter size and stride, respectively.
Information 16 00477 g002
Figure 3. (a) Schema of deep residual unit, (b) schema of self-attention gate. Abbreviations: Conv—convolution layer, IN—instance normalization layer, ReLU—rectified linear unit. Conv (1 × 1 or 3 × 3) and Conv (1 s) indicate filter size and stride, respectively.
Information 16 00477 g003
Figure 4. Architecture of the discriminator used by cGAN. The size and number of feature maps are displayed in the rectangle. Abbreviations: Conv—convolution layer, BN—batch normalization layer, Leaky ReLU—leaky rectified linear unit. Conv (4 × 4) and Conv (2 s or 1 s) indicate filter size and stride, respectively.
Information 16 00477 g004
Figure 5. Network architecture of Unet++ deep learning model. The black components represent the original U-Net architecture, while the green and blue elements illustrate the dense convolutional blocks within the skip pathways. The red components indicate deep supervision. These red, green, and blue additions differentiate Unet++ from the original U-Net.
Information 16 00477 g005
Figure 6. Contours for a planning target volume (PTV) (blue) and organs at risk (OARs) on CT transverse slices of head and neck patient.
Information 16 00477 g006
Figure 7. (a) Mean absolute error (MAE) versus epochs curve for different calculations of learning rate (LR). (b) MAE versus epochs curve for different calculations of the optimized loss function.
Information 16 00477 g007
Figure 8. Visualization of patient contours and deformation vector field.
Information 16 00477 g008
Figure 9. From top to bottom: real planning CT slices, sCT slices generated by ADR-Unet (sCTADR-Unet), U-Net (sCTU-Net), Unet++ (sCTUnet++), cGAN (sCTcGAN), and difference maps between sCTADR-Unet, sCTU-Net, sCTUnet++, sCTcGAN and real CT.
Information 16 00477 g009
Figure 10. Average mean absolute error in bins of 20 HU for the evaluated methods: ADR-Unet, U-Net, Unet++, and cGAN.
Information 16 00477 g010
Figure 11. Lateral right (LR) and anterior-posterior (AP) digitally reconstructed radiographs (DRRs) generated from planning CT (pCT), sCTADR-Unet, sCTU-Net, sCTUnet++, and sCTcGAN. Percentage of intensity relative difference (PIRD) between pCT and sCT-based DRRs ((DRRpCT − DRRsCT)/DRRpCT × 100).
Information 16 00477 g011
Figure 12. Dose metric deviations, obtained for OARs and PTVs, when planning with sCT generated using ADR-Unet (blue), cGAN (red), U-Net (green), or Unet++ (purple). Acuros dose calculation is performed. OARs are in the following order: brain stem (BS Dmax), spinal cord (SC Dmax), left lens (LL Dmax), right lens (RL Dmax), left eye (LE Dmax), right eye (RE Dmax), left optic nerve and PRV (LON Dmax, LON PRV Dmax), and right optic nerve and PRV (RON Dmax, RON PRV Dmax), left parotid (LP Dmean), right parotid (RP Dmean), larynx (Dmean), and PTV (D95%). Means and standard deviation intervals are shown.
Information 16 00477 g012
Figure 13. (Top) CT slice with superposed OARs and PTV (blue), Gamma dose maps with superposed isodose lines from pCT and each DL approach, including ADR-Unet, U-Net, Unet++, and cGAN. Hot spots are in red. (Bottom) Dose maps of reference CT, and the four DL approaches corresponding to the anatomy displayed on the top left corner.
Information 16 00477 g013
Table 1. Quantitative validation of deformable registration using warp magnitude and Jacobian determinant statistics for selected anatomical structures.
StructureMean Warp Magnitude (mm)Max Warp Magnitude (mm)Mean Jacobian DeterminantMin JacobianMax Jacobian
Spinal cord1.242.691.020.961.14
Parotid L0.761.591.070.991.16
Parotid R1.091.520.980.91.06
Larynx1.662.510.970.91.04
Brainstem0.761.070.980.941.02
Eye R0.511.071.030.971.07
Eye L0.821.11.020.991.05
Lens R0.380.521.041.021.05
Lens L0.860.961.031.031.04
PTV1.052.561.010.881.18
Abbreviations L and R stand for left and right, respectively.
Table 2. Mean and standard deviation values of mean absolute error (MAE), mean error (ME), peak signal-to-noise ratio (PSNR), and structural similarity index (SSIM) for intensities from attention deep residual U-Net (ADR-Unet), cGAN with ADR-Unet as generator, U-Net, and Unet++. Gamma pass rate (2%, 2 mm) was also computed for the four approaches.
Error TypeADR-UnetcGANUnetUnet++
MAE [HU]55.49 ± 7.7957.66 ± 10.4460.06 ± 10.9459.32 ± 7.09
ME [HU]−1.75 ± 7.62−4.57 ± 17.592.77 ± 13.310.25 ± 10.40
PSNR [dB]56.07 ± 0.8755.95 ± 1.5155.77 ± 1.4555.89 ± 0.72
SSIM0.99 ± 0.000.99 ± 0.000.99 ± 0.000.99± 0.00
Gamma pass rate [%]99.4 ± 0.2699.6 ± 0.1899.5 ± 1.8599.4± 1.63
Note: data are means ± standard deviations over HN patients.
Table 3. The segmentation indices for classified bones, airways, and soft tissues on sCT compared to pCT are given for ARD-Unet, cGAN, U-Net, and Unet++. The segmentation indices included DIce (DI), SEnsitivity (SE), and SPecificity (SP) for each structure type.
MethodStructuresDISESP
ADR-UnetBONE0.86 ± 0.020.85 ± 0.030.99 ± 0.0
AIR0.78 ± 0.060.74 ± 0.070.99 ± 0.0
SOFT0.97 ± 0.000.97 ± 0.000.99 ± 0.00
cGANBONE0.84 ± 0.020.81 ± 0.020.99 ± 0.00
AIR0.77 ± 0.100.74 ± 0.150.99 ± 0.00
SOFT0.97 ± 0.000.97 ± 0.000.99 ± 0.00
U-NetBONE0.84 ± 0.030.82 ± 0.030.99 ± 0.00
AIR0.76 ± 0.120.69 ± 0.130.99 ± 0.00
SOFT0.97 ± 0.000.97 ± 0.000.99 ± 0.00
Unet++BONE0.84 ± 0.010.84 ± 0.010.99 ± 0.00
AIR0.78 ± 0.090.72 ± 0.110.99 ± 0.00
SOFT0.97 ± 0.000.97 ± 0.000.99 ± 0.00
Note: data are means ± standard deviations over HN patients.
Table 4. Mean and standard deviation values of the contrast-to-noise ratio (CNR) for DRRs generated from pCT (DRRpCT), ADR-Unet (DRRADR-Unet), cGAN (DRRcGAN), U-Net (DRRU-Net), and Unet++ (DRRUnet++). LaR and AP designate measurements on lateral right and anterior-posterior DRR, respectively.
TypeDRRpCTDRRADR-UnetDRRcGANDRRU-NetDRRUnet++
LaR [db]45.09 ± 1.6442.2 ± 1.9242.15 ± 1.3441.48 ±1.5441.68 ± 2.53
AP [db]46.44 ± 1.9145.31 ± 0.7345.04 ± 1.345.17 ± 0.5644.97± 1.34
Note: data are means ± standard deviations over HN patients.
Disclaimer/Publisher’s Note: The statements, opinions and data contained in all publications are solely those of the individual author(s) and contributor(s) and not of MDPI and/or the editor(s). MDPI and/or the editor(s) disclaim responsibility for any injury to people or property resulting from any ideas, methods, instructions or products referred to in the content.

