Abstract
Automatic passenger counting (APC) systems are an important asset for public transport operators, allowing them to optimise networks by monitoring lines’ utilisation. However, the cost of these systems is high and the development of alternative devices, cheaper than the most widely used optical systems, seems promising. This paper aims at understanding the influence of local factors on the accuracy of a Wi-Fi APC system by analysing error patterns in a real-world scenario. The APC system was installed on a bus operating regularly within the public transport network and, in the meantime, ground truth data were collected through manual counting. The collected data were then analysed to calculate accuracy and, finally, multilevel modelling was used to identify error patterns due to local factors. This study challenges traditional assumptions, revealing that factors like high pedestrian traffic or intense vehicular movement around the bus have minimal impact on accuracy, if effective received signal strength indicator filters are used. Instead, the number of passengers within the bus affects Wi-Fi systems significantly, especially when the bus is carrying more than 10 passengers, which leads to undercounting due to signal obstruction. This research lays the foundation for strategic error correction to improve accuracy in real-world scenarios.
1. Introduction
Mobility pattern analysis can provide a better understanding of flows of people in both urban and rural areas, leading to more effective planning of public transport networks and associated infrastructures [1]. Automatic passenger counting (APC) systems are a valuable resource when analysing the use and the utility of public transport (PT) systems. There are various technological solutions for automatically counting passengers on a PT vehicle, ranging from traditional treadle mats to modern video camera-based systems [2]. Since these solutions are often expensive, in recent years, there has also been significant interest in cheaper alternatives making use of information and communication technology (ICT) [3].
Automatic passenger counting systems draw upon a wide variety of technologies that can be used to count passengers. Older, more traditional APC systems used passive infrared sensors [4,5], or sometimes platform sensors, to calculate the number of passengers entering and leaving a bus. More recent systems have attempted to leverage ICT for more cost-effective alternatives [2,6]. Literature points to a wide body of research using ICT, especially since the advent of the Internet of Things (IoT) [2,7,8].
The proliferation of smartphones and the widespread availability of Wi-Fi access points (in and outside the home) have meant that more and more people now carry a smartphone with continuous Wi-Fi connectivity. According to Cisco’s projections [9], the number of Wi-Fi hotspots was set to rise steeply from 169 million in 2018 to a previously unimaginable 628 million in 2023. Smartphone use continues its upward trend worldwide, with a predicted 7.7 billion active smartphone subscriptions by 2027 [10]. As a consequence, a previously unavailable way of counting passengers has been gaining prominence, namely using Wi-Fi sensing as a proxy for vehicle load [2,11]. Because of the increasing ubiquity of Wi-Fi-enabled devices, there is now a closer correlation than in the past between the number of detected Wi-Fi devices and the number of actual passengers. The strength of this correlation varies depending on the detection methodology and the tracked parameters, with reported values ranging from 0.41 to 0.93 [12,13].
The growing interest in using Wi-Fi sensing for passenger counting is due not only to the increased use of Wi-Fi but also to the potential cost-effectiveness of Wi-Fi sensing systems. Oransirikul et al. [14] explored Wi-Fi sensing as a means of counting the number of devices at a bus stop. Their counting algorithm relied on unique MAC addresses (12-digit hexadecimal numbers assigned to each device connected to the network, thus being a unique identifier of the device) and incorporated the time of arrival and departure to determine the duration of stay. Other studies have used different approaches. Schauer et al. [13] counted unique MAC addresses, used time information from unique devices, applied a received signal strength indication (RSSI) threshold, and combined the time and RSSI criteria. All this enabled them to achieve an average Pearson correlation coefficient of 0.75 between Wi-Fi-sensing-based counting and ground truth, showing the potential for using Wi-Fi for passenger counting.
Further studies have led to the fine-tuning of the used techniques, helping to identify the best thresholds for parameters, together with the best testing locations and mechanisms. Mikkelsen et al. [15] adopted a time interval-based approach and an RSSI threshold-based approach, similarly to Schauer et al. [13], with a focus on determining the optimal RSSI threshold and time interval for counting. Their experiments in the Danish city of Aalborg established that an RSSI threshold of −65 dB and a time interval threshold of 6 min produced the most accurate results. A study by Reichl et al. [16] employed Wi-Fi probes to count passengers and monitor their flow within a railway station in Melbourne. The accuracy of passenger count data was validated using information from a survey and from the ticketing system.
Unfortunately, for the purposes of device counting, considerations of user privacy have led device manufacturers to start randomising devices’ MAC addresses, which makes counting them more difficult [17]. To address some of the challenges posed by MAC address randomisation, Nitti et al. [18] developed a de-randomisation algorithm that could potentially be of help in counting unique devices, but testing was limited to a moving car. This algorithm considers tag parameters that remain constant for a family of devices across multiple probe requests, along with the time of arrival and sequence number of a probe request, to identify unique devices. However, recent developments, such as Apple’s randomisation of sequence numbers [19], have posed new, additional challenges.
In a comprehensive study, Mccarthy et al. [2] compared various IoT-based automatic passenger counting (APC) solutions, including a Wi-Fi-sensing-based APC system. Notably, they disregarded MAC address randomisation based on their observations and claimed that MAC address randomisation had a negligible impact on accuracy. Their methodology incorporated thresholds for time intervals and travelled distances, in addition to RSSI-based filtering. Ground truth data were collected through manual counting on two buses over a one-week period, which showed the accuracy of their technique to be 16% during weekdays and 61% on weekends.
Wi-Fi-based passenger counting systems reported in the last few years [2,12,18,20] have shown varying levels of accuracy. To the best of our knowledge, most of the validation of such Wi-Fi-based counting systems has been performed either in controlled environments or in real-world scenarios over short time periods [14,18]. This type of validation can give general insights into the accuracy of a system but may fail to reveal possible patterns in the counting error. Understanding the accuracy of Wi-Fi-based systems in a real environment over a sustained period of time is essential for identifying any underlying patterns that cause systematic errors or result in reduced accuracy. Knowledge of these patterns can help to produce strategies for error correction that can improve the accuracy of a Wi-Fi-sensing-based APC.
The state of the art of the development of Wi-Fi-based systems, independently of the limitations mentioned above in relation to their validation, points to levels of accuracy below what is deemed necessary. It is unsurprising that transport operators and transport authorities seek levels of accuracy of at least 95%, when they see companies marketing more expensive optical systems boasting accuracies between 98% and 99% [21,22,23,24,25,26]. However, when we undertook in-field manual counting to explore the reliability of these claims, we found much lower accuracies than those reported by the companies [27]. This prompted us to carry out an in-depth comparison of performance and reliability as a way of determining whether new developments based on Wi-Fi can constitute a credible alternative to optical-based systems.
This paper analyses error patterns in APC systems using Wi-Fi sensing in a real-world scenario. Wi-Fi-sensing-based APC data and ground truth data were collected over a period long enough for patterns to be observed in the data and in the error with respect to ground truth data caused by local factors. Our results provide insights into how far it may be possible to increase the accuracy of Wi-Fi-based systems with a view to offering transport companies a cheaper alternative to some of the well-established products currently being sold.
This paper is organised as follows: The Section 2 presents the methodology used to collect, evaluate, and analyse the data using statistical methods. The Section 3 presents the results of the manual count, the collected datasets, and our statistical analysis that was performed to reveal potential error patterns. The Section 4 and Section 5 discuss the potential for improving the accuracy of Wi-Fi systems, relates our findings to the existing literature, and presents our conclusions.
2. Materials and Methods
This research was conducted in the metropolitan area of Asti (Figure 1), located in the Piedmont Region, in the northwest of Italy, 40 Km from Turin (capital of region), in collaboration with the local public transport company Asti Servizi Pubblici (ASP) (Asti, Italy). The goal was to understand error patterns that affect the accuracy of a Wi-Fi APC system. To this end, a Wi-Fi APC system was tested in one bus with help from the start-up Mobyforall (MFA), which has developed a system that listens to Wi-Fi probe request packets transmitted by smartphones. The system ensures complete anonymity by hashing MAC addresses on the IoT device using SHA-256, transmitting them securely via MQTT over TLS, and further securing them on the server with PBKDF2-HMAC-SHA256 using dynamic daily salting and high iteration counts, following OWASP recommendations. This design ensures that the system cannot track users, let alone a random third party, reflecting a strong ethical commitment to privacy and security by design. Furthermore, this hashing operation is no longer strictly necessary due to recent MAC address randomisation by device manufacturers, which has made user tracking extremely difficult but has also reduced sensing and counting accuracy—a challenge the proposed method seeks to address.
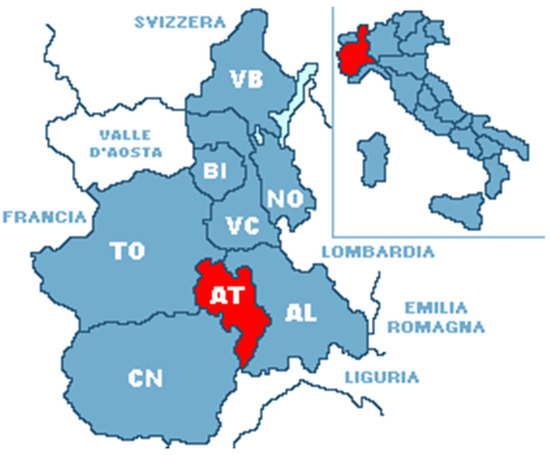
Figure 1.
Localisation of the province of Asti (left), in the Piedmont Region (top right).
The company agreed to make the collected data available to the authors for the purposes of this study. Within this framework, our research involved investigating the APC system to determine possible ways of improving the performance of Wi-Fi-based methods. The three-step methodology comprised (1) an experimental protocol for data collection; (2) accuracy calculation; (3) statistical analysis using multilevel modelling to identify error patterns due to local factors.
2.1. Experimental Protocol for Data Collection
The public transport company of Asti, ASP, permitted us to carry out tests using a Wi-Fi-based system developed by MFA. An APC system including two sensors was installed on one of the buses operating regularly within Asti’s public transport network on different lines, with one sensor at the front of the bus and the other at the rear. The bus is 12 metres long and has three doors—one at the front, a central door halfway along its length, and one at the back. The experimental protocol involved six manual human counters working in rotation (recruited by MFA), with at least two counters being present in the bus during the counting exercise. The passengers boarding and alighting, together with the vehicle load between stops, were manually counted over 19 days (between 18 October 2021 and 12 November 2021) during which no malfunctioning of the doors ever occurred. They used a form to record the data, which was then digitised at the end of the day. The data were then checked and cleaned to address any manual errors or device malfunctions arising from issues aboard the bus. Table 1 shows the data sources and the variables collected as part of the counting.

Table 1.
Description of passenger count (APC and manual count) fields received from MFA.
The variable apc_count represents the number of passengers on the bus, as estimated by the APC system, between two successive stops. It corresponds to the mean of vehicle load assessed at various time instances using MFA’s proprietary algorithm. MFA employs a variety of data processing algorithms to estimate passenger count from Wi-Fi data. However, for this study, apc_count is the passenger count obtained from the company’s simplest data processing algorithm. The rationale behind this choice was to analyse underlying error patterns that might be found in data from Wi-Fi-based APC systems, particularly focusing on aspects relating to the data collection setup and to factors affecting accuracy during the data collection stage rather than during the subsequent data processing stage. The specifics of the algorithm used by MFA for estimating passenger count from Wi-Fi data used cannot be disclosed, although we are able to state that RSSI (received signal strength indication) filters were used to eliminate potential signals from outside the bus.
The Identification of Local Factors
We looked at local factors that might potentially influence the accuracy of the APC system. These factors include traffic conditions around the bus and the specific location of the bus stop within the city, distinguishing between urban and suburban areas. To investigate these potential associations, a supplementary dataset was created, covering all the stops in the city of Asti serviced by the bus lines equipped with MFA’s APC system—a total of 261 stops. These stops were classified based on their relative location and traffic intensity.
The supplementary dataset was generated by combining a quantitative and a qualitative analysis of each stop’s characteristics and location. Regarding the categorisation of stops according to their relative location, a qualitative approach was employed. This involved dividing the stops into four categories, informed by the considerations mentioned above and by relevant literature [28,29]:
- Centre (1): the centre is characterised by high commercial and moderate residential building density, accompanied by very high pedestrian traffic.
- Urban (2): urban areas have moderate commercial and high residential building density, with moderate pedestrian traffic.
- Suburban (3): suburban areas feature low commercial and moderate residential building density, along with moderate pedestrian traffic.
- Extra-urban (4): extra-urban areas have low commercial and residential building density, with low pedestrian traffic.
A mixed approach was employed to assess traffic intensity. Initially, typical traffic speeds near the stops were identified for each day of the week and across different time windows. This was achieved by consulting data available on Google Maps [30] regarding typical traffic levels around the stop at different times of the day. We divided the day into eight time windows, determined through discussions with ASP as well as an analysis of local data such as school hours, opening hours for shops, and office hours. The eight time windows or time-sections (TSs) are as follows:
- TS1—00:00 AM to 06:59 AM;
- TS2—07:00 AM to 08:59 AM;
- TS3—09:00 AM to 10:59 AM;
- TS4—11:00 AM to 12:59 AM;
- TS5—01:00 PM to 02:59 PM;
- TS6—03:00 PM to 04:59 PM;
- TS7—05:00 PM to 06:59 PM;
- TS8—07:00 PM to 11:59 PM.
After traffic flow information was obtained from Google Maps for each of these time windows, manual validation and adjustment of the values were performed based on local knowledge to finalise the traffic intensity values for each stop during the specified time periods.
2.2. Accuracy Calculation
The accuracy of the system was calculated using SMAPE—symmetric mean absolute percentage error [31,32]. SMAPE was chosen for two reasons:
- It is an error expressed as a percentage.
- It has a clear upper and lower bound, and with the specific version of SMAPE used, the bounds are 100% and 0%, respectively.
SMAPE can be represented as in the following equation (Equation (1)):
where:
- At is the actual value—in this case, manual count values at each stop;
- Ft is the forecast value or estimate—in this case, the estimate by the APC system.
Accuracy is obtained using the following relation (Equation (2)):
where:
Percentage accuracy = 100% − SMAPE
- SMAPE is the error calculated from Equation (1).
The accuracy of the estimated vehicle load was calculated after each stop. Initially, the estimated vehicle load was compared directly with the manual count, but, for further analysis, a variable, occupants_count, indicating the actual number of passengers in the bus at each stop, was obtained by adding 3 (corresponding to the driver and the two persons counting manually) to the number of manually counted passengers.
where:
Oc = TPPR + 3
- Oc is the vehicle load that can be compared with the APC estimated count;
- TPPR is the Totale_pass_porte_richiuse (number of passengers inside the bus when the doors close) as reported by the manual counters.
The variable of interest, delta (∂), was then calculated as the difference between the average number of passengers counted by the APC system between two stops (apc_count) and the number of people actually in the bus after each stop (occupants_count), as shown in Equation (4):
where:
∂ = apc_count-O_c
- Delta (∂) is the difference between apc_count and the occupancy count;
- apc_count is the average of the apc_count values between stops;
- Oc is the vehicle load (Equation (3))
This variable ∂ was used for the numerator component of the SMAPE formula reported in Equation (1) to calculate the accuracy of the APC system as shown in Equation (2).
2.3. Multilevel Modelling
After accuracy verification, descriptive statistics were used for an initial investigation of the data. As a first step, to understand the general trend of the crowding level in the bus, passenger counts were segmented into discrete intervals (0–3, 4–5, 6–10, etc.) and the frequency of occurrences within each interval was converted into a percentage and plotted. Subsequently, the frequency of occurrence of stops in different relative locations was plotted as percentages. Similarly, the distribution of traffic intensity classifications for the recorded time and stop locations was also represented as percentages. In addition to the accuracy calculated using SMAPE, the frequencies of different ∂ values were also plotted to give a better understanding of the range of errors.
Multilevel analysis models [33,34]—which are very useful in identifying recurring patterns—were used to investigate a possible association between the observed differences (∂) in the count and the number of people actually on board the bus. An estimate of the average delta (∂) between apc_count and Oc with a confidence interval of 95% was calculated. The supplementary dataset was used to check for correlations between delta values and the location of stops or traffic flow intensity, to determine whether these local factors have an impact on the accuracy of the APC system. After this initial analysis, an analysis of sub-groups was done to identify any patterns in the data. In order to investigate whether the presence of possible patterns in the data could have influenced the results of the initial statistical analysis, the 210 vehicle trips analysed were separated into four sub-groups as follows.
- Negligible differences (Pattern 1): vehicle trips with all ∂ values between −5 and +5;
- Significant differences (Pattern 2): vehicle trips not belonging to the Pattern 1 sub-group and where all ∂ values are between −10 and +10;
- Significant and predominantly positive differences (Pattern 3): vehicle trips with a minimum ∂ value greater than −10 and a maximum ∂ value greater than +10;
- Significant and predominantly negative differences (Pattern 4): vehicle trips with a minimum ∂ value less than −10 and a maximum ∂ value less than +10.
The use of a fifth sub-group where the minimum delta value is <−10 and the maximum delta value is >+10 was also explored, but there were no trips belong to this sub-group in the dataset. A statistical analysis identical to the initial analysis was performed on each pattern, to ascertain potential differences and thus possible influences on the results of the initial analysis.
Data from vehicle trips with large differences in counts, whether positive or negative, were investigated visually, using graphs, to check whether these differences may have been due to device malfunctioning or manual counting or data entry errors. After excluding the runs identified as being outliers from the data, the statistical analyses were repeated to see if the presence of those runs could have influenced the results of the statistical analyses.
3. Results
The results are first presented with some information about the experimental protocol process, and then the accuracy of the system is reported, before we move on to the statistical analysis to look for error patterns.
3.1. Data Collected Through the Experimental Protocol
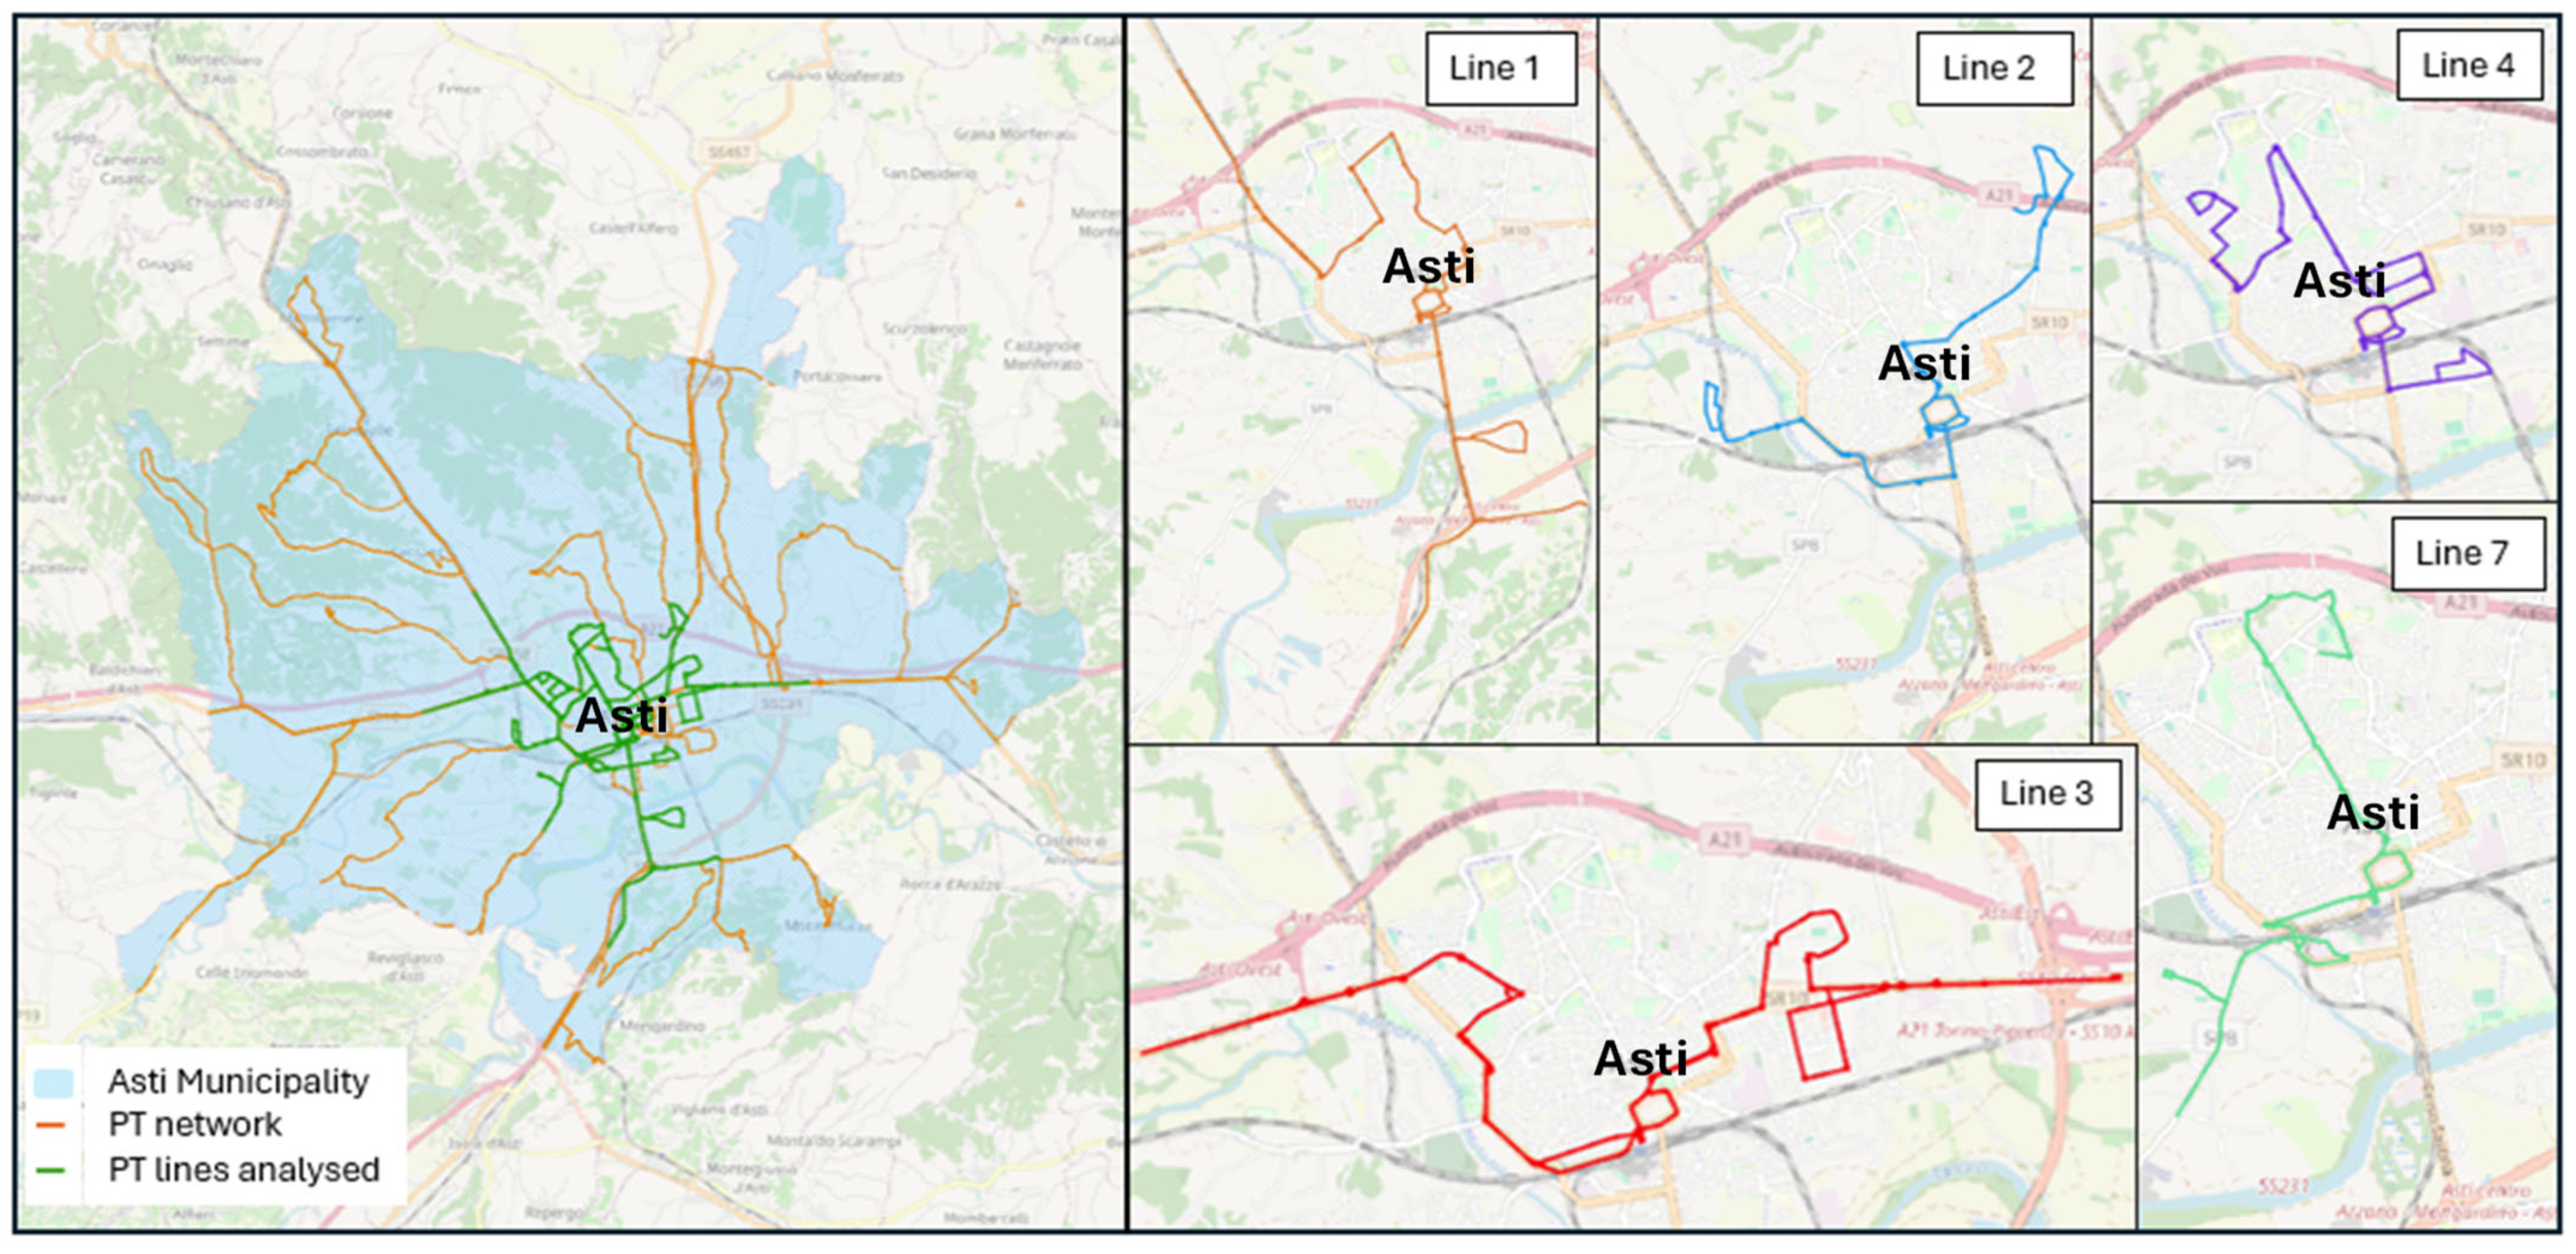
After cleaning and removing data errors and other issues relating to occasional device malfunctions, there were a total of 210 journeys with data for 4926 stops. During this period, the bus operated on five different lines within the urban network (lines n° 1, 2, 3, 4, 7) (Figure 2). On the left side, all the public transport network is depicted in orange, showing in green only the analysed five lines. These lines are then presented in detail in the right part of the figure with different colours for a better visualisation.
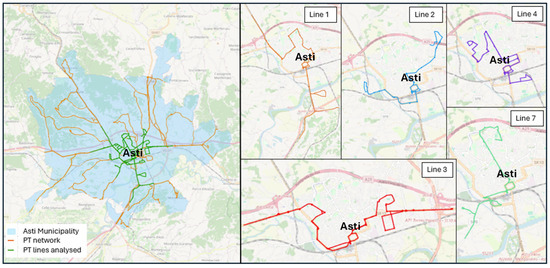
Figure 2.
Map of the analysed public transport lines in Asti.
A supplementary dataset with bus stop categorisation in terms of relative location and traffic flow speed during different time periods of the day was prepared for a total of 261 stops. The stop categories range from 1 to 4, where 1 denotes the historic and commercial centre of the city, and 4 denotes extra-urban locations. Regarding traffic flow, 1 corresponds to slow-moving traffic, 2 to medium traffic, and 3 to fast-moving traffic. A sample extract from the dataset can be seen in Table 2.
Table 2.
Extract of bus stop categorisation data from supplementary dataset.
3.2. APC Accuracy
Based on the data provided by MFA for the entire period of 19 days, the accuracy of vehicle load estimation by the Wi-Fi-based APC system was measured at 65.87% using the formula described in Equation (2). The accuracy of the system for each weekday and the overall accuracy is shown in Table 3. The different number of records depends on the use of the equipped bus on the different lines along the week, according to the exploitation of the service.
Table 3.
Accuracy of Wi-Fi-based APC system with simple data processing algorithm.
3.3. Statistical Analysis and Multilevel Modelling
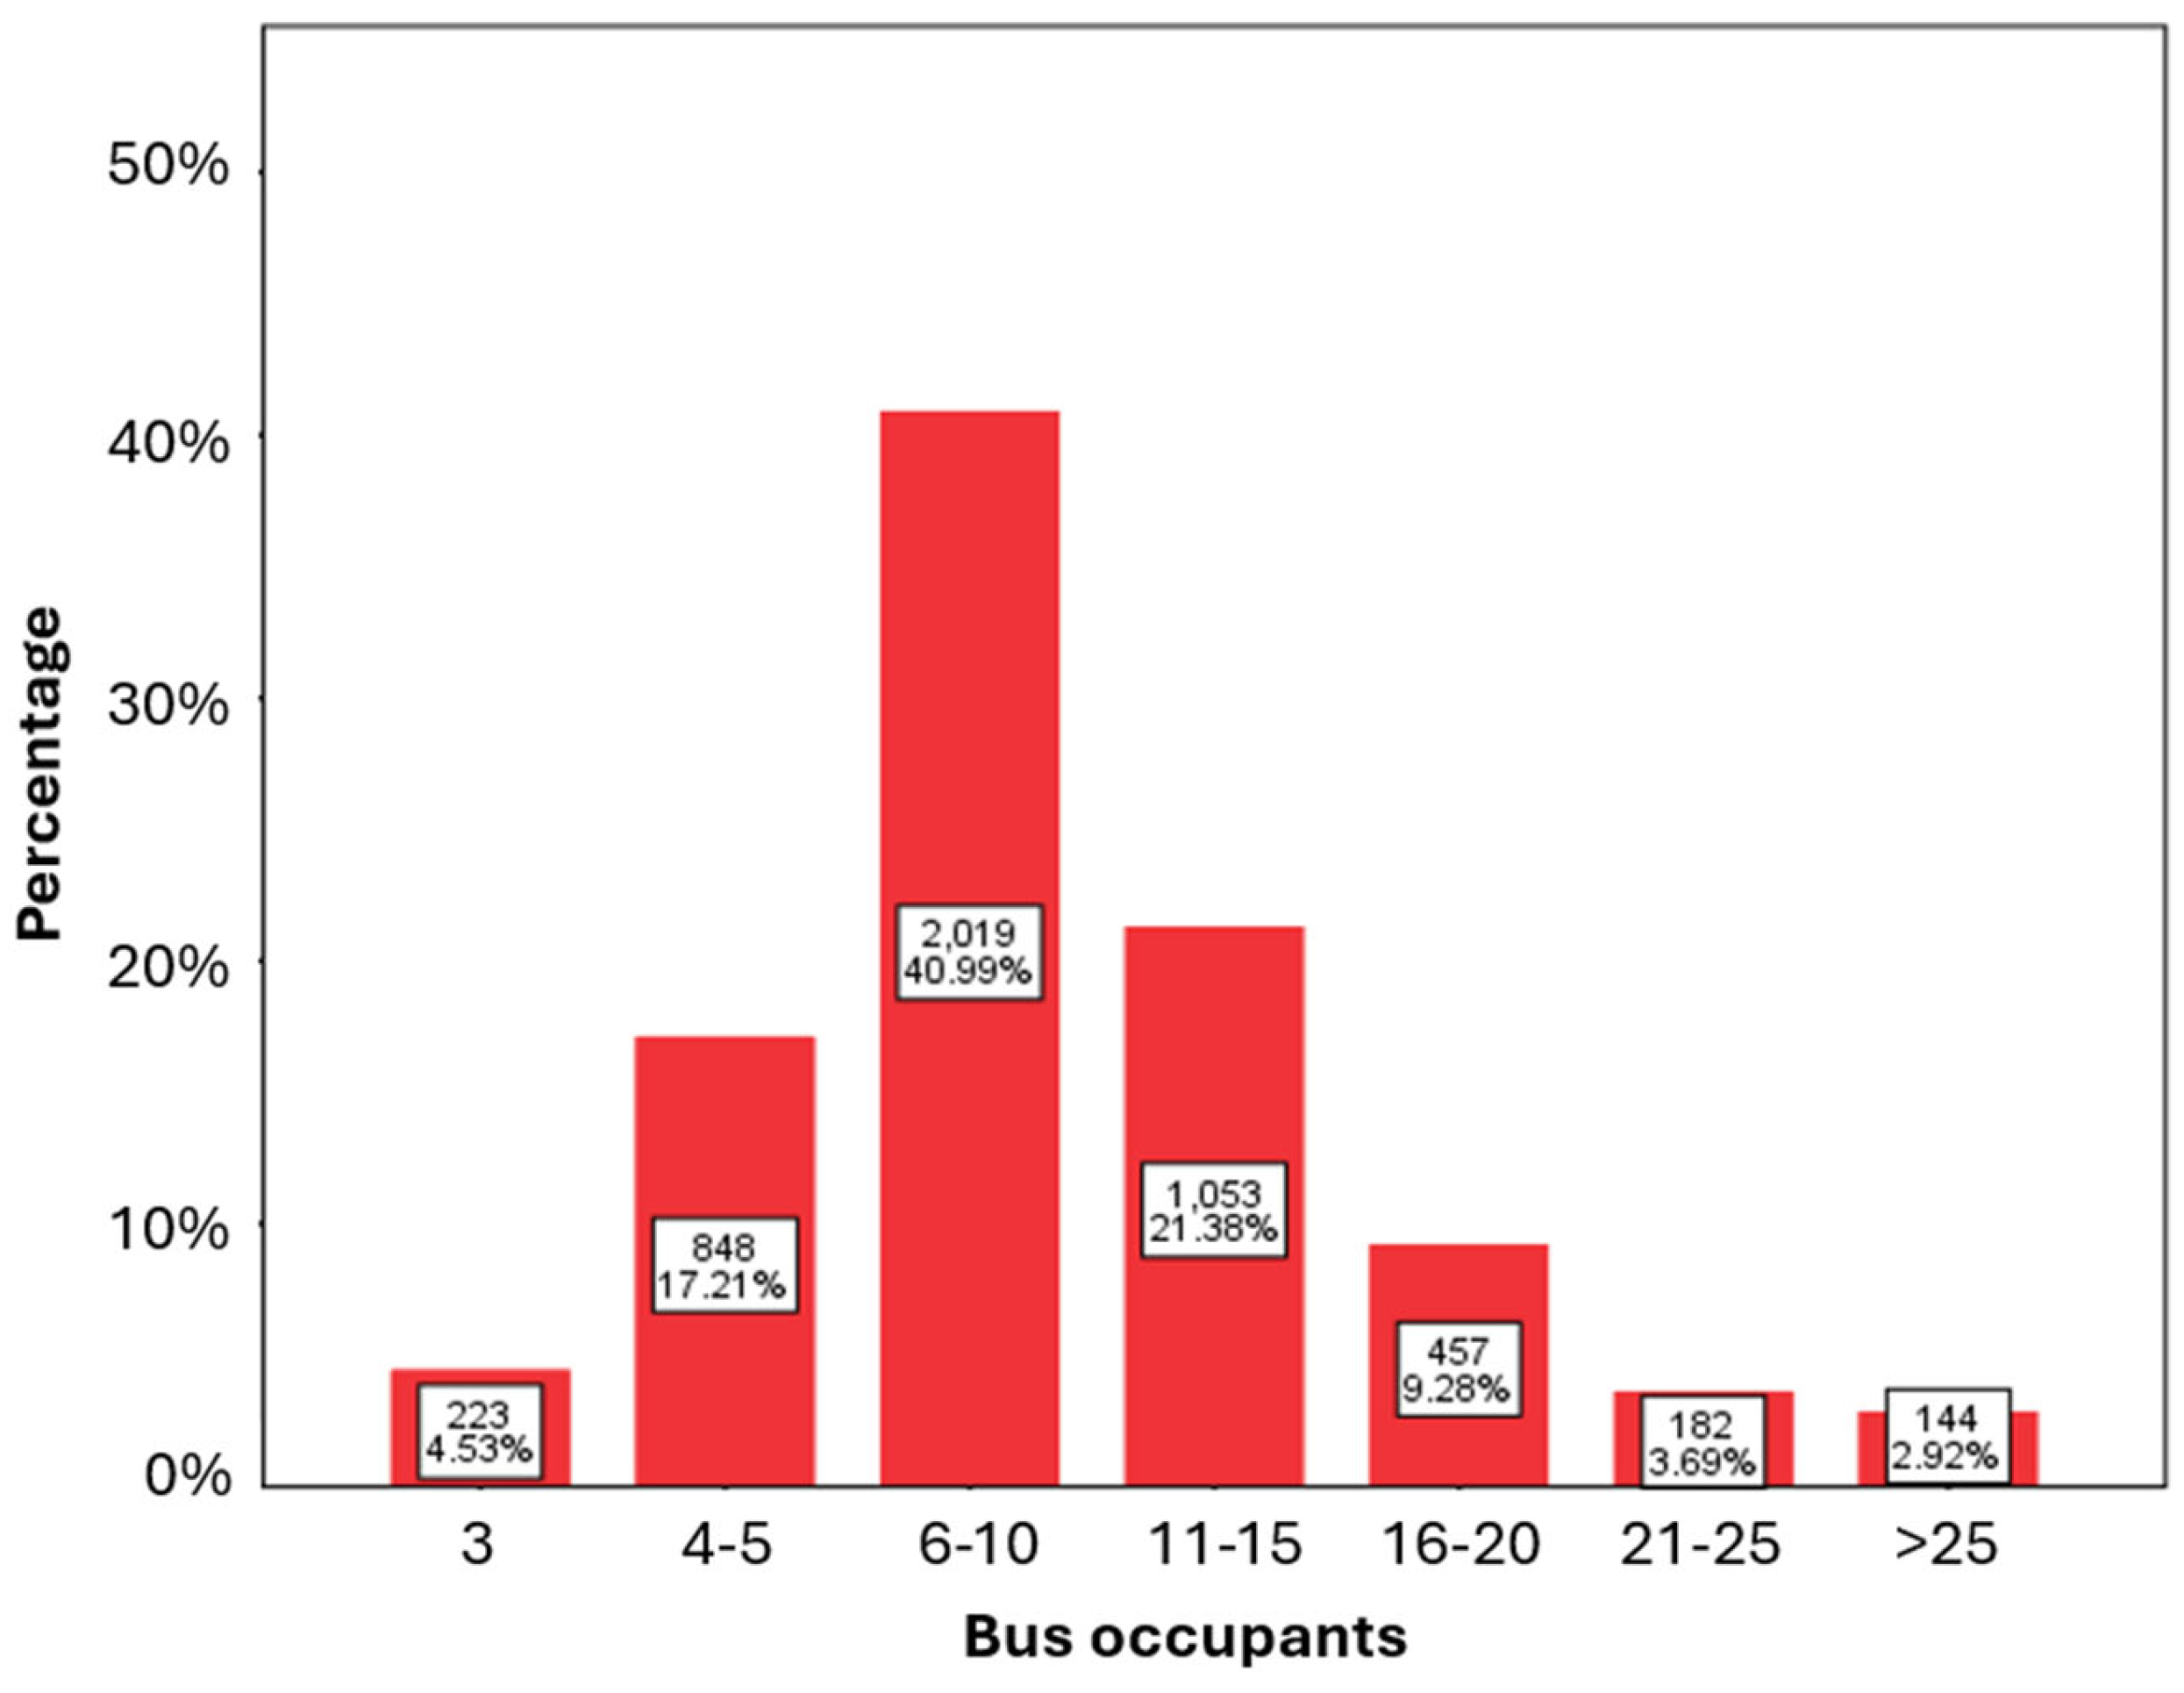
First, the results of the descriptive analysis of the manual count are presented. Bus occupancies (Oc) are plotted as percentages (Figure 3), showing that vehicle load is between 4 and 15 for about 80% of the records in the database, with the most common range being 6–10.

Figure 3.
Frequency of occurrence of bus occupancies (manual count).
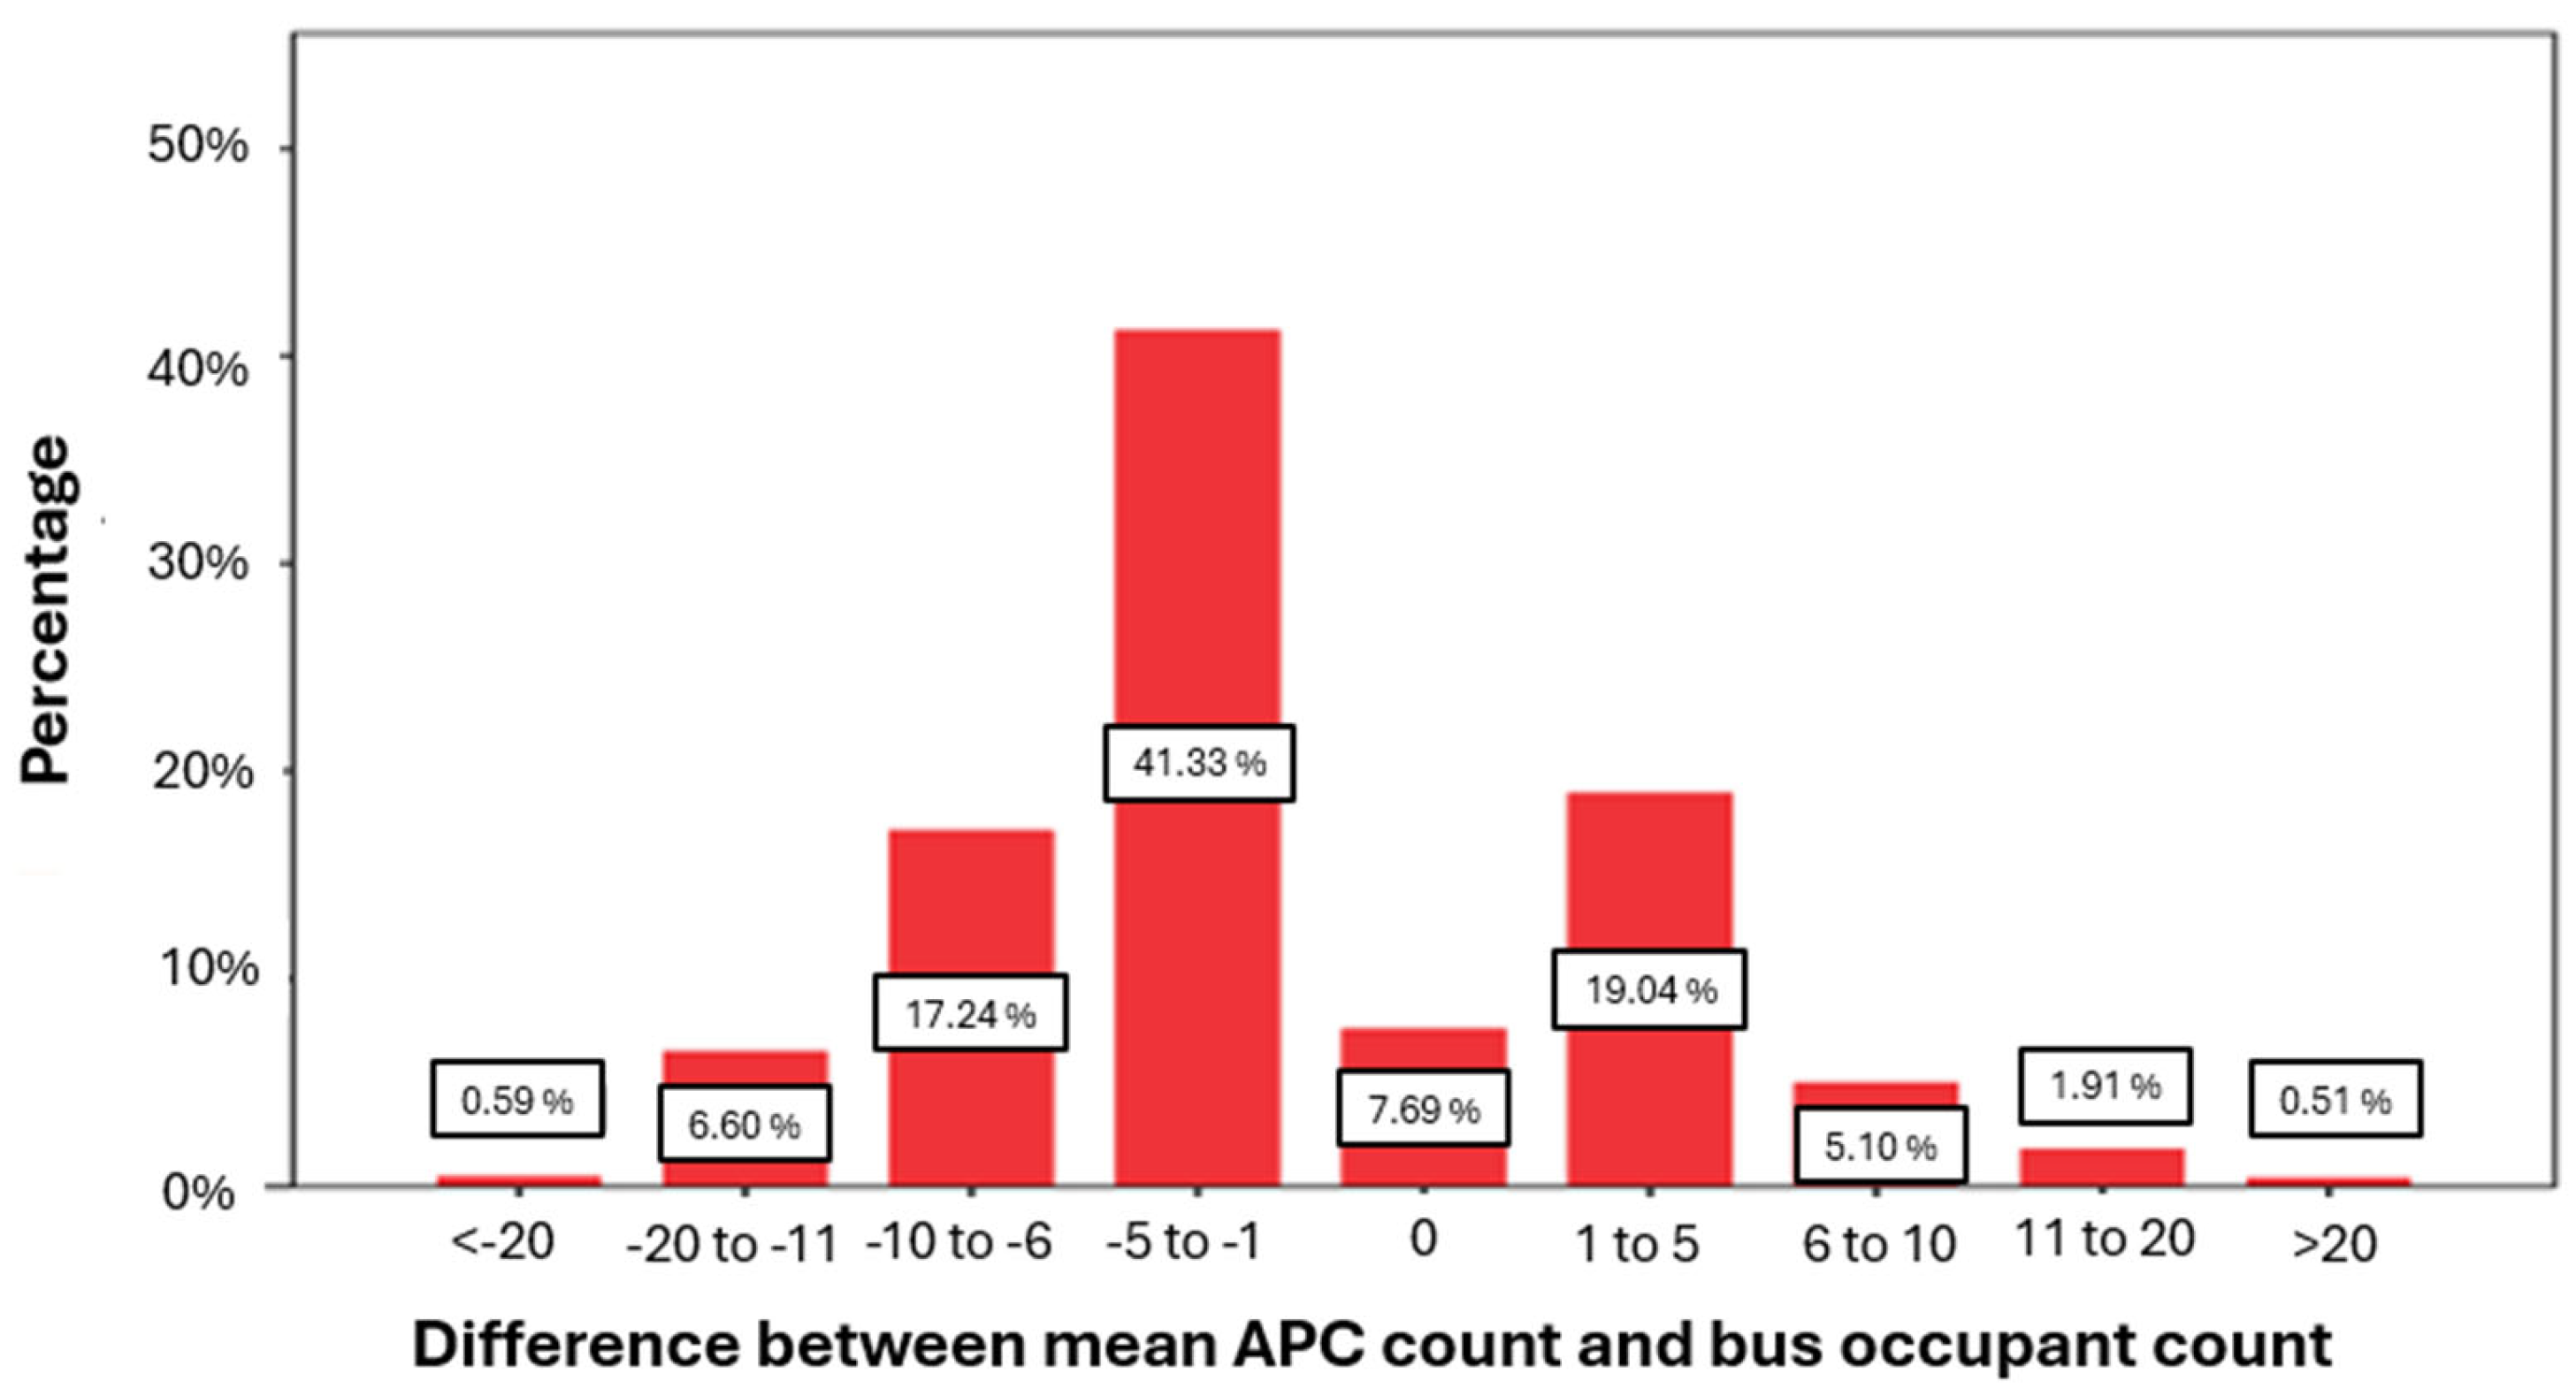
As regards the comparison of manual count with the Wi-Fi-based APC data, the two datasets were merged based on time, and then delta (∂) was calculated as shown in Equation (4). The frequencies of occurrence of the delta values are plotted as percentages in Figure 4. Negative values correspond to undercounting by the APC system, and positive values correspond to overcounting.

Figure 4.
Distribution of divergence between APC count and actual bus occupancy.
From the graph, it can be seen that 68.06% of the counts estimated by the Wi-Fi-based APC system fall within the range of negligible error (−5 to +5). It can also be noted that there are more ∂ values that are negative, 65.76% of the records having delta < 0, and 24.33% with delta < −5. This implies that the APC system tends to undercount the actual number of passengers more often than it overcounts.
In terms of the distribution of locations of stops of the five lines, the most common category of stops traversed was ‘urban’ (40.15%), as shown in Figure 5. However, it can also be seen that the overall distribution of stops across the different categories is relatively balanced, with the least common location category, ‘extra-urban’, accounting for 14.27%.
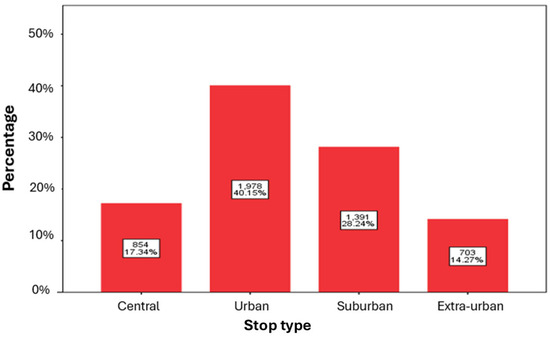
Figure 5.
Distribution of stop types.
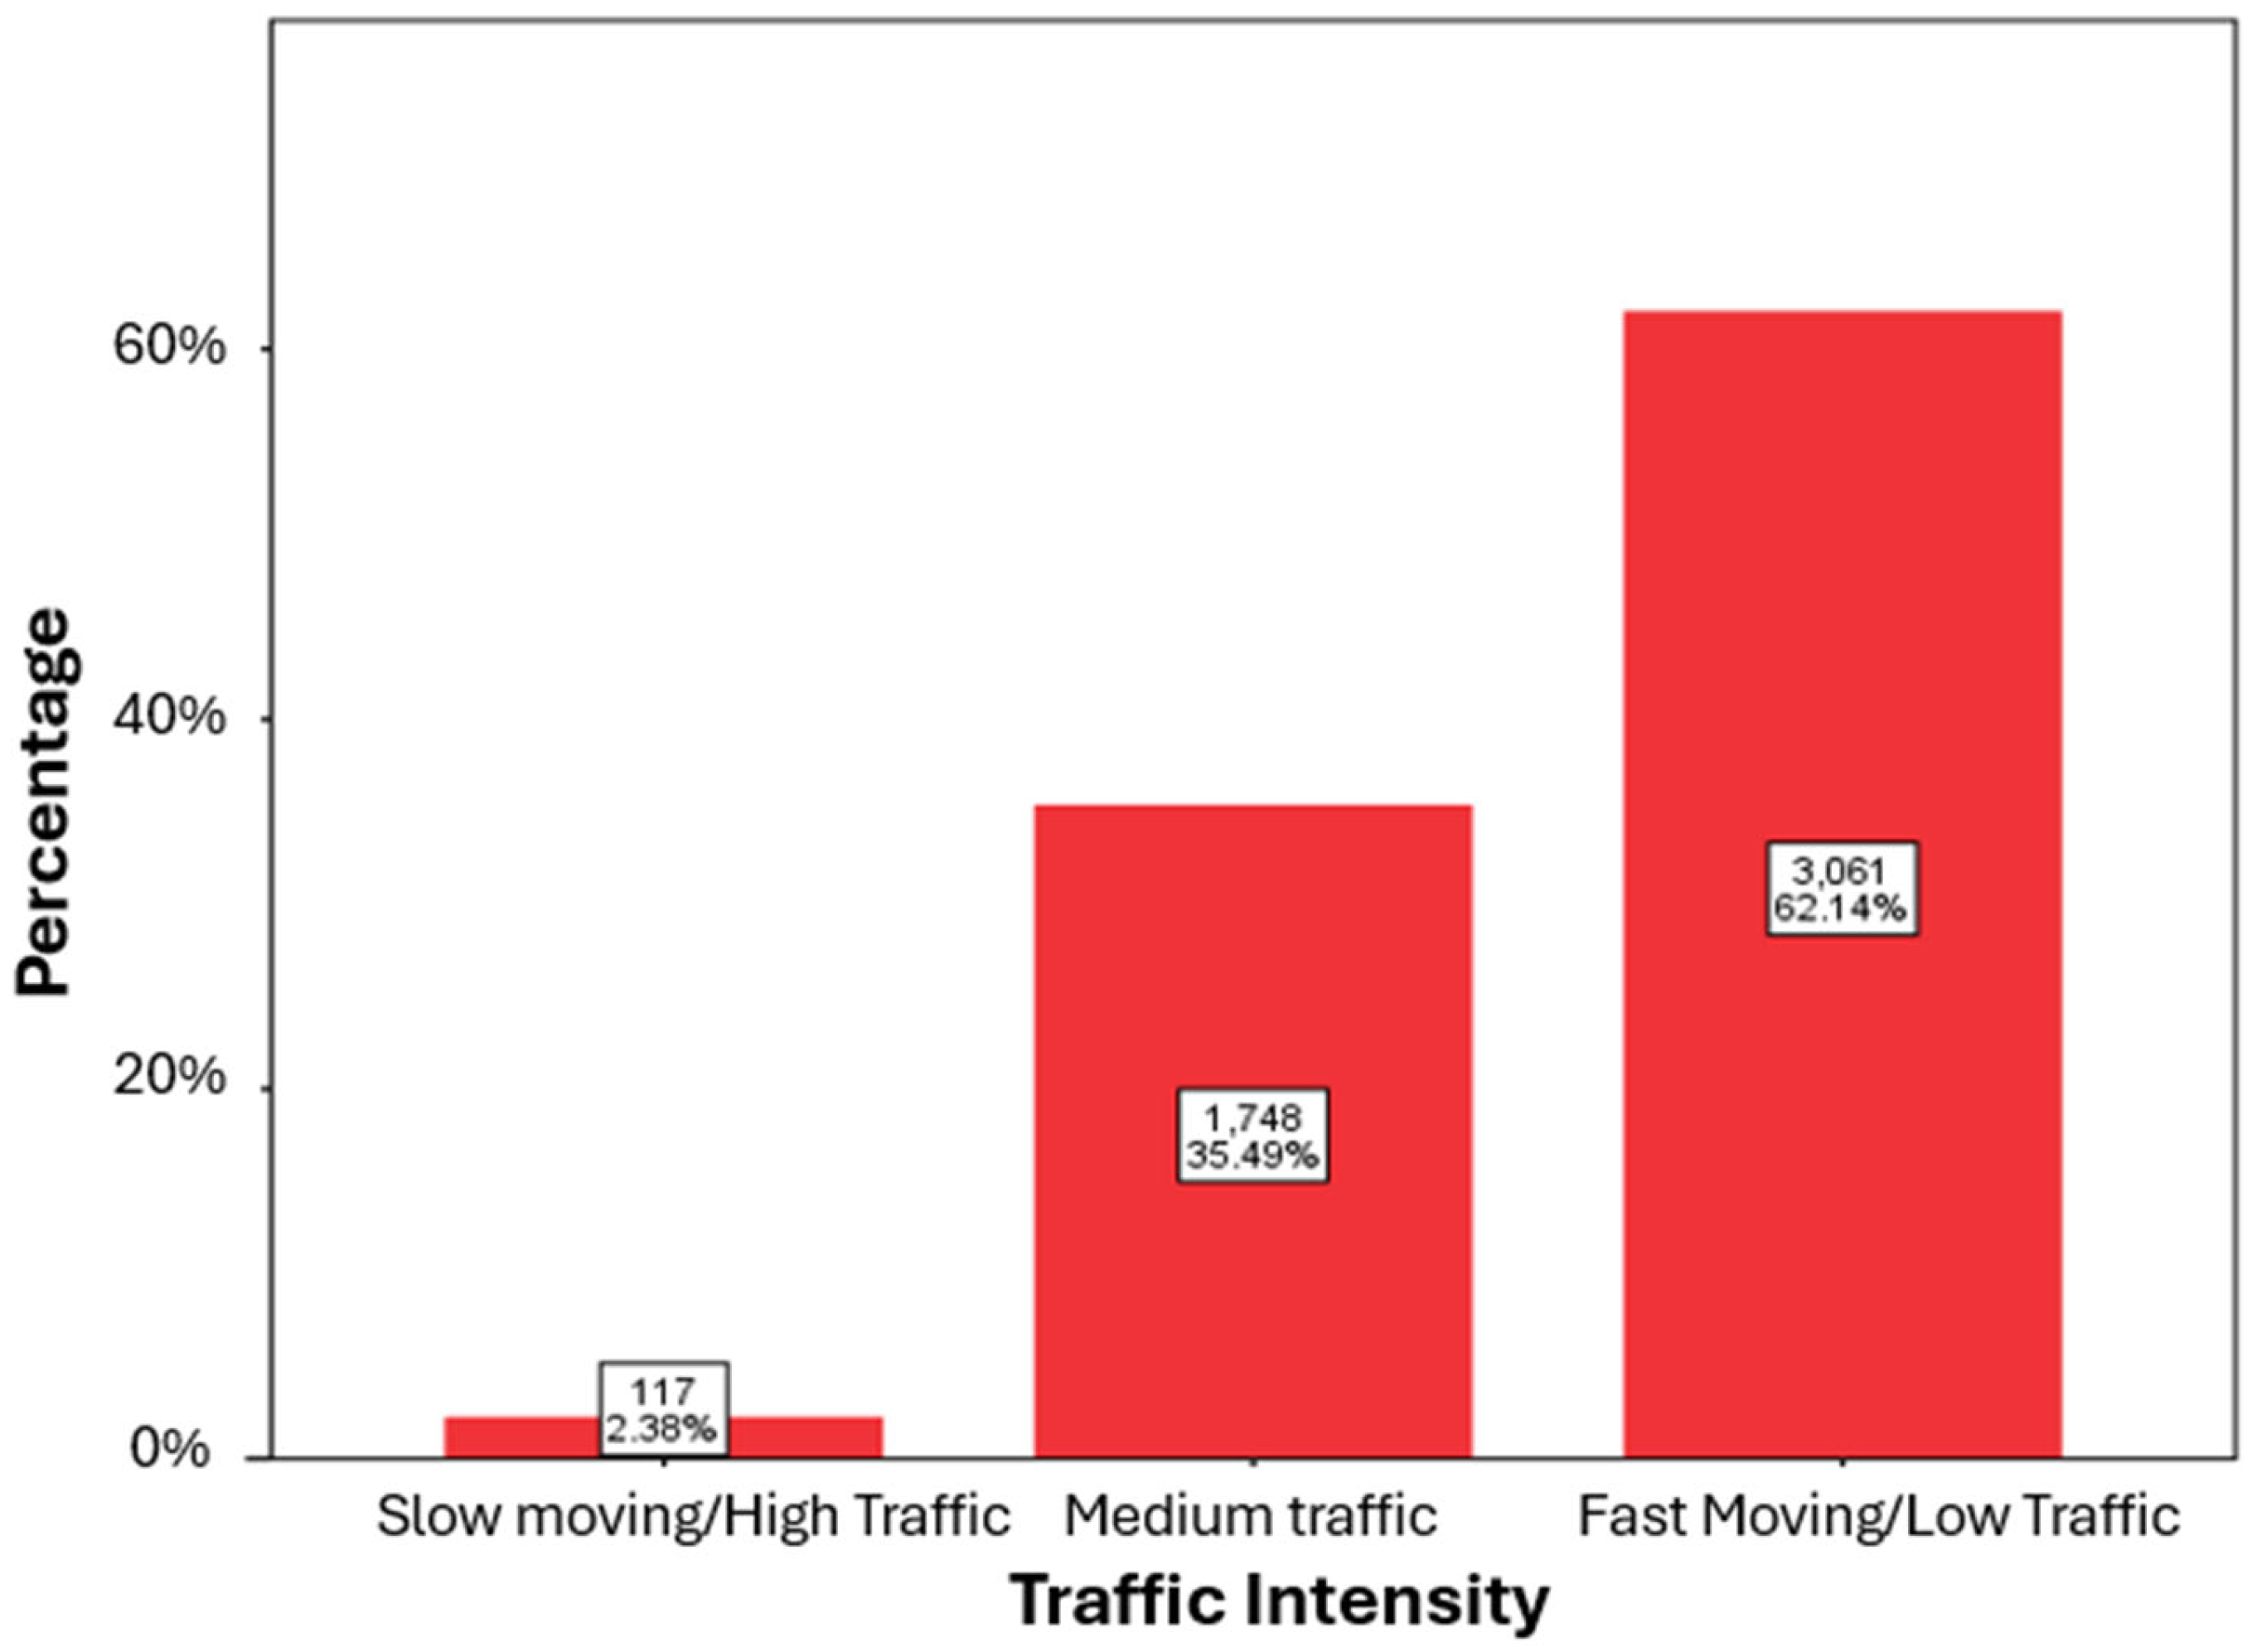
Similarly, the distribution of the intensity of traffic or speed of movement of traffic around the bus when the data were recorded can be seen in Figure 6.

Figure 6.
Distribution of traffic intensity as percentage.
In most cases (and across different locations), traffic is categorised as ‘fast-moving’. Only a marginal 2.38% of the recorded instances indicate conditions of ‘slow-moving’ traffic around the bus. This may be because Asti is not a major city, and it is possible that traffic intensity patterns would be different if the data were collected in a major urban conurbation.
However, we note that the data contain enough records in each category to allow a comprehensive analysis to determine the potential impact of these factors on the accuracy of Wi-Fi-based APC systems.
This study’s multilevel statistical analysis provides important insights into factors affecting the delta value. There was no discernible connection between the delta value and the type of stop or traffic intensity, implying that these variables do not significantly impact the accuracy of Wi-Fi-based APC systems.
Interestingly, the analysis shows the number of passengers to be the sole analysed variable significantly linked to the delta value. This unexpected finding suggests that vehicle occupancy might exert a more substantial impact on the accuracy of the Wi-Fi-based APC system than previously assumed.
As shown in Table 4, when the vehicle contains only the driver and the two manual counters, the Wi-Fi-based APC system (with the chosen filters) reported on average 1.25 more people than the actual number of people in the bus, with a 95% confidence of counting between 0.54 and 1.95 more people if this study is repeated.
Table 4.
Estimate of the average delta between the count performed by APCs (95% CI) and the bus occupants.
When there are 4–5 people in the vehicle, there was no significant divergence between the APC count and the actual number of people. This conclusion is drawn from the fact that the confidence interval includes zero, meaning that there is a 95% probability that, when 4 or 5 people are present in the vehicle, the difference between the APC count and the actual count will be zero if the study is repeated. The divergence tended to increase as the number of people increased. For example, where there were between 6 and 10, the APC counted, on average, 1.17 fewer people (95% CI: −1.61; −0.73), and where there were more than 25, the APC counted, on average, 14.83 fewer people (95% CI: −15.82; −13.84).
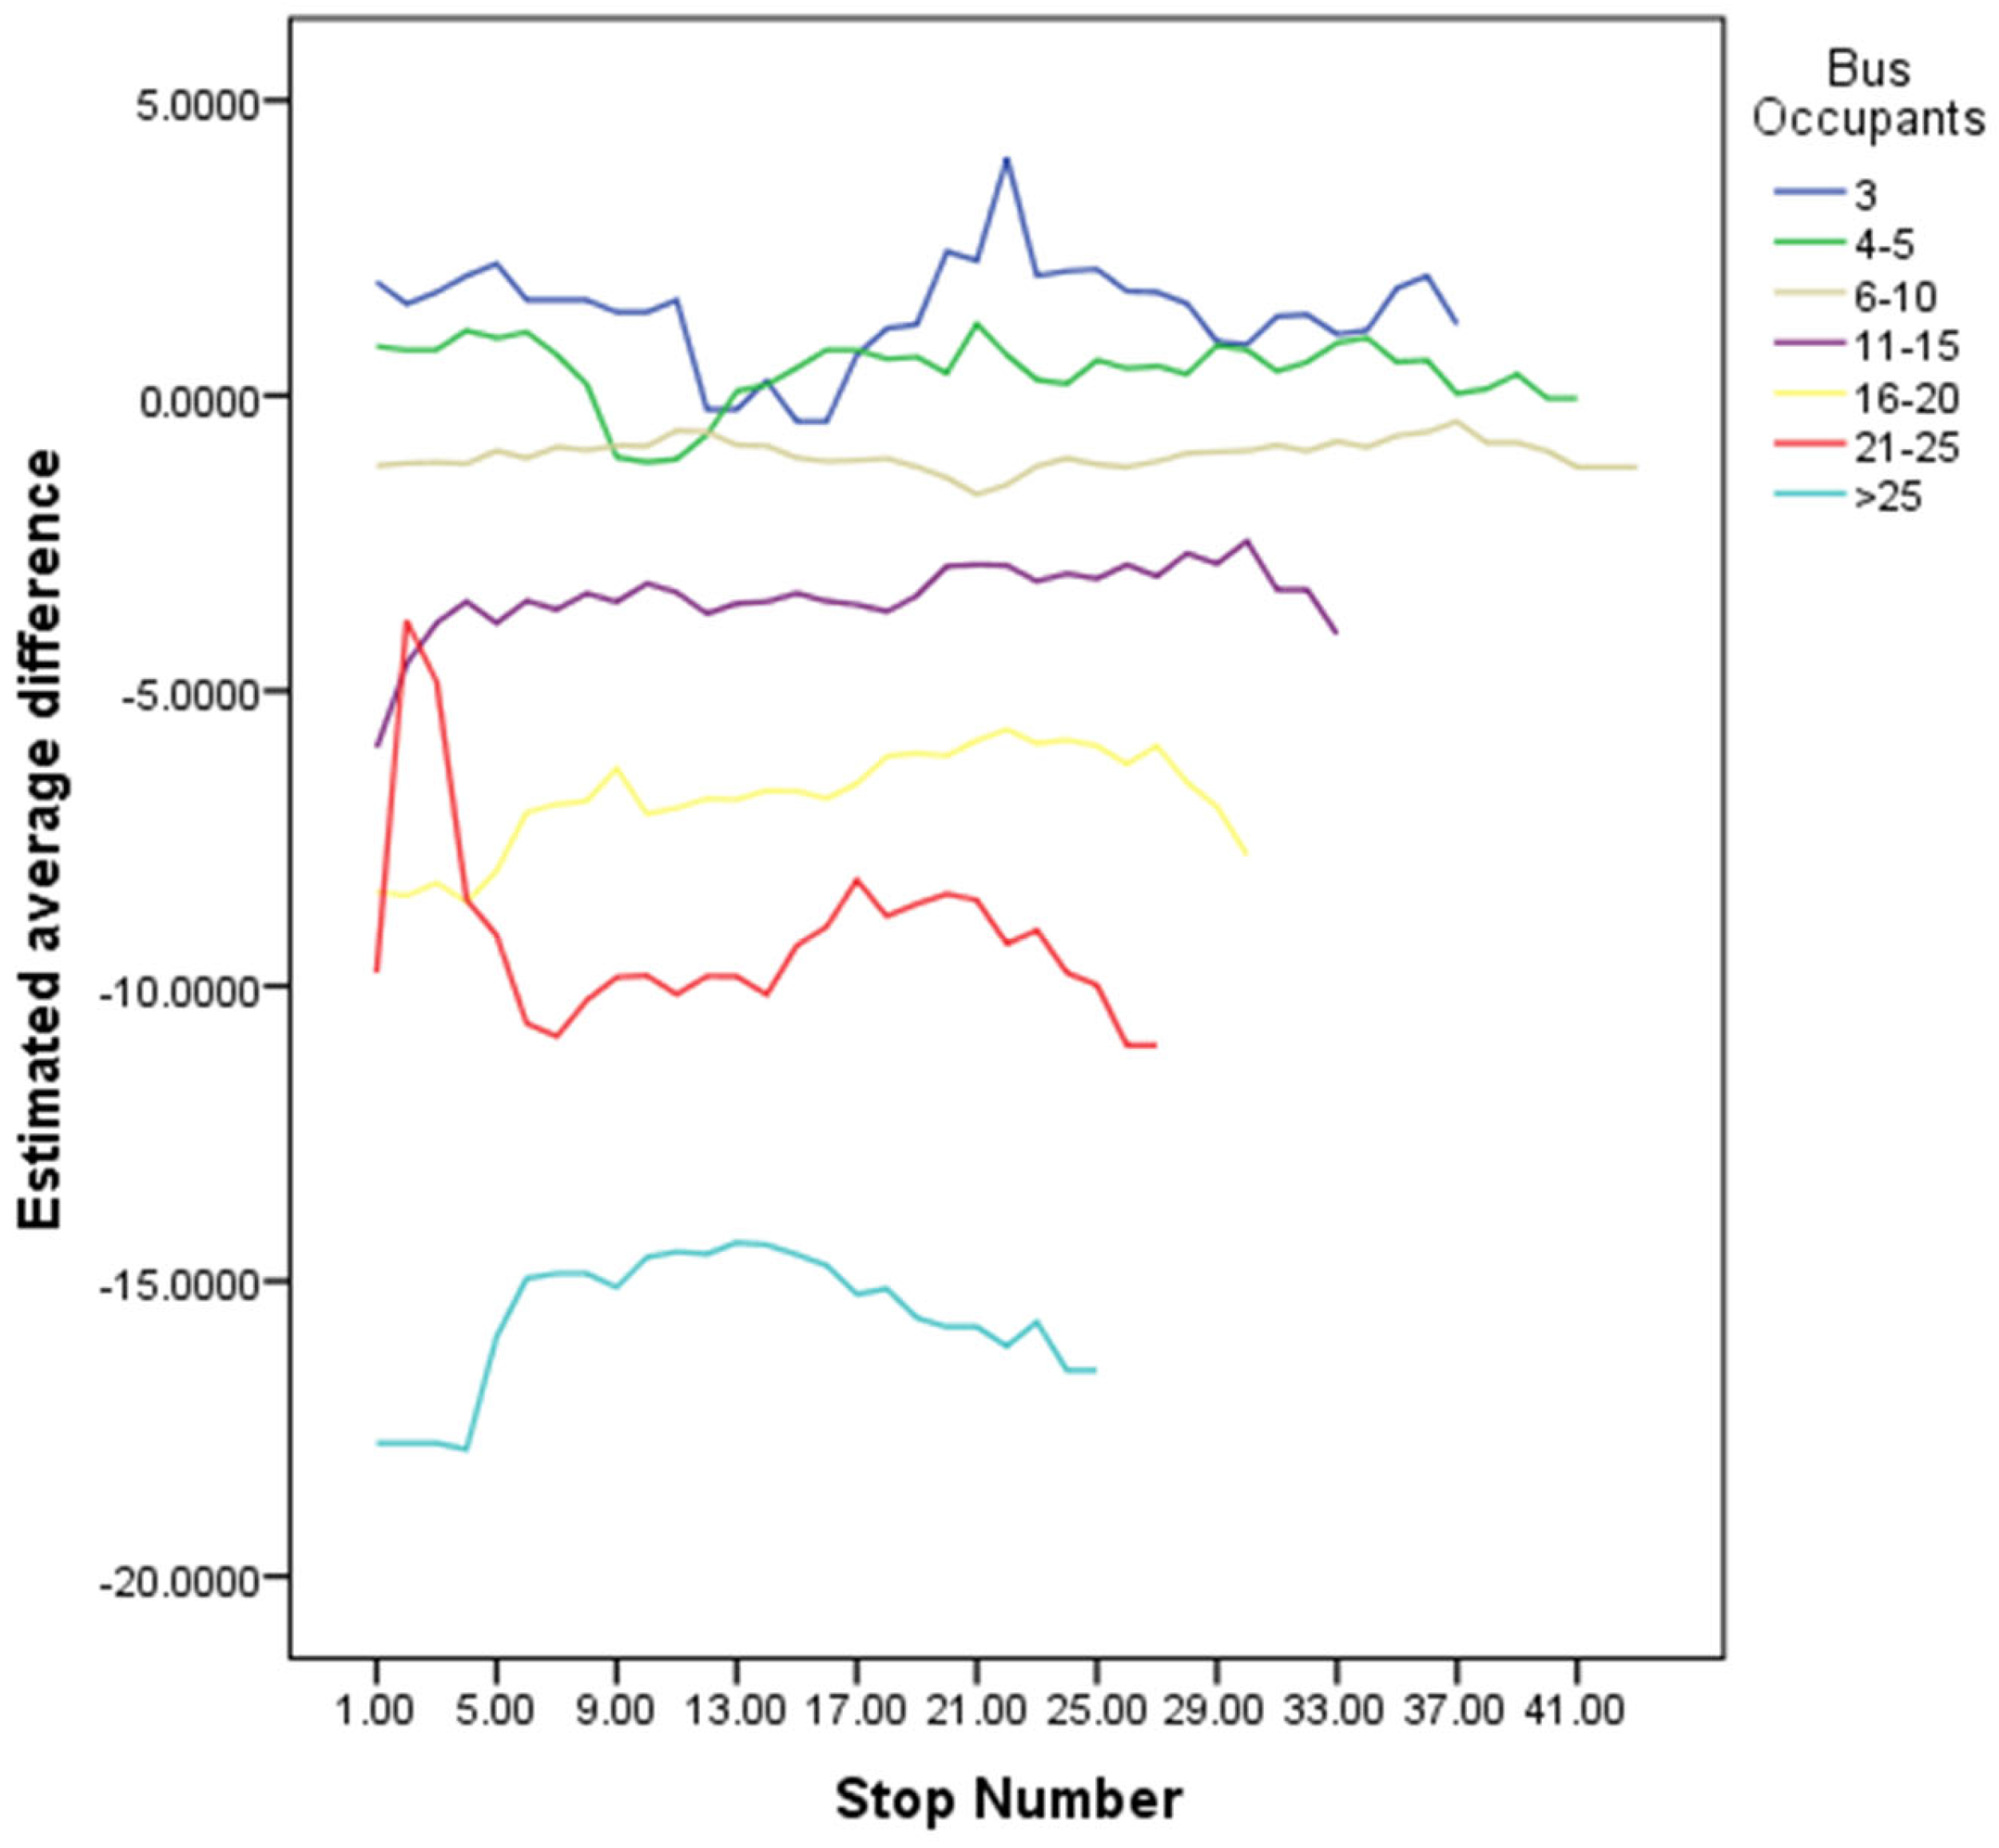
Figure 7 shows the average delta across the entire dataset, by successive stop numbers in a trip (horizontal axis) and by bus occupancy (the coloured lines represent vehicle trips with different occupancy levels). The delta between the various stops is minimal when the vehicle is carrying from 3 to 10 passengers (blue, green, and brown lines), while the divergence increases with the number of passengers.
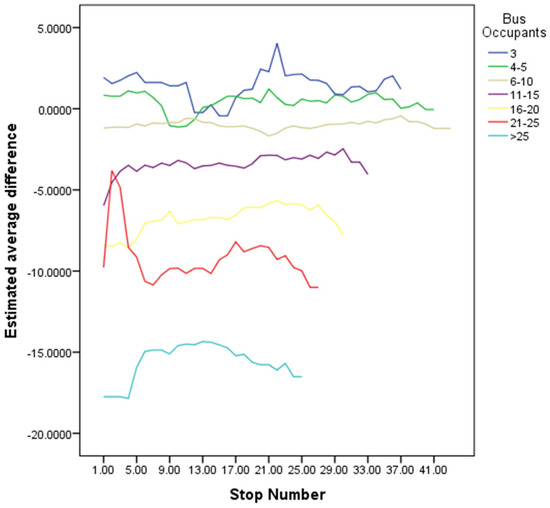
Figure 7.
Estimate of the average delta, by consecutive number of stops and number of people in means of transport.
The data were divided into four sub-groups or patterns, each representing a different pattern as described in the Methodology section above. Figure 8 shows the percentage of trips in the different sub-groups.
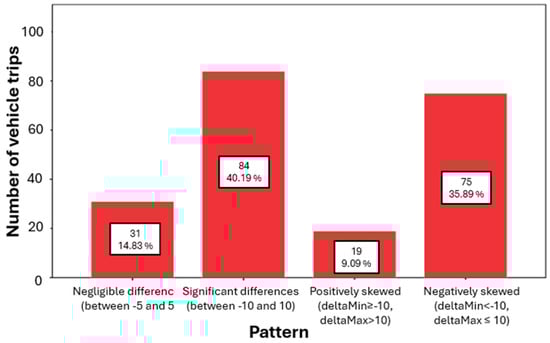
Figure 8.
Distribution of the vehicle trips based on patterns derived from delta values.
The highest percentages of trips are those with significant (40.2%) or significant and mainly negative (35.9%) delta values; in 14.8% of the vehicle trips, the delta values are negligible, and only in 9% of trips are they significant and mainly positive. This means that in 76.1% of the vehicle trips the APC device overcounted by 10 or fewer while undercounting by more than 10, indicating a clear bias towards undercounting.
The statistical analysis performed on the four sub-groups confirms the results found with the initial analysis of the data. In particular, the results for Patterns 1, 2, and 4 confirm that with 3 people, the APC device tended to count accurately; with 4–5 people, it overcounted by approximately 1; with 6–10 people, it undercounted by approximately 1; and with more than 10 people, undercounting continued to increase with the number of passengers.
Regarding Pattern 3, which corresponds to the 9% of journeys in which the APC tended to count more people than the actual number, the divergence tended to decrease as the number of passengers increased, and where there were more than 20, the APC also counted, on average, fewer people than the actual number (Table 5).
Table 5.
Estimation of the average difference between the count performed by the APC system (95% CI) and the number of people in buses, for each pattern.
Outliers in Data
Some vehicle trips had very large discrepancies, whether positive or negative. A visual investigation was therefore performed to identify outliers and to determine whether eliminating them would affect the observed patterns.
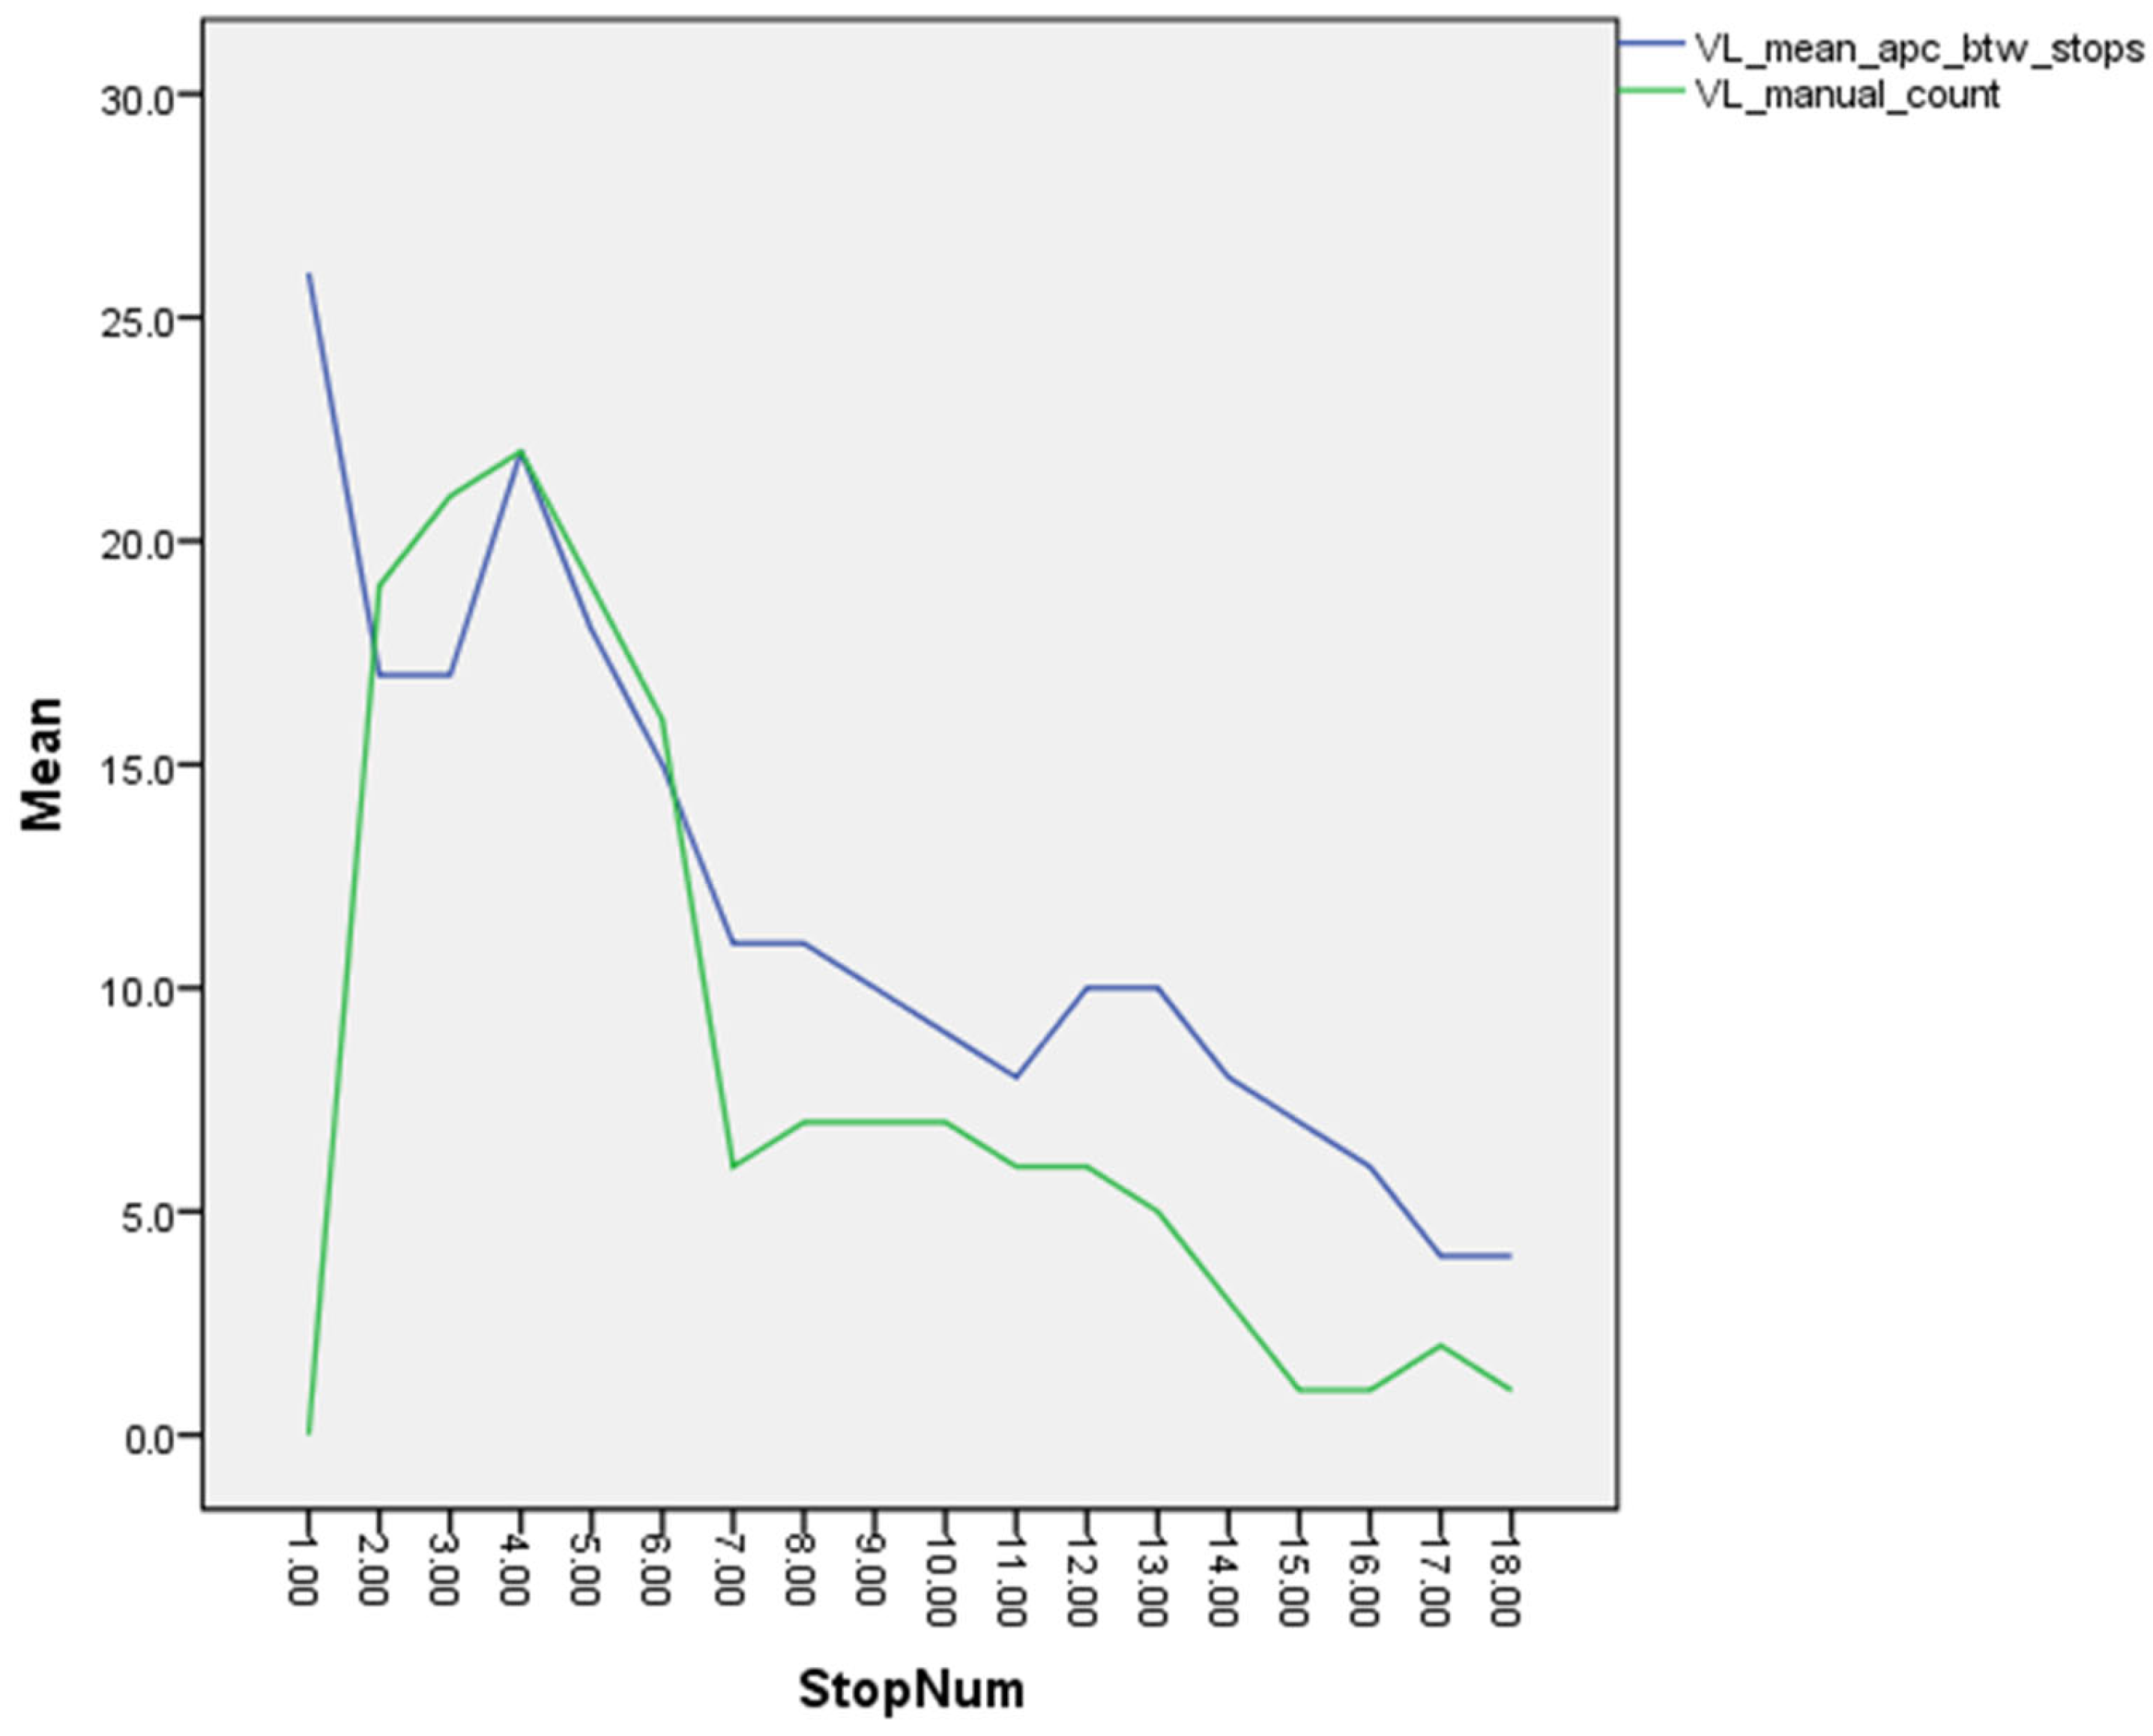
An example of a negative difference is shown in Figure 9, relating to Line 22, vehicle trip 2.
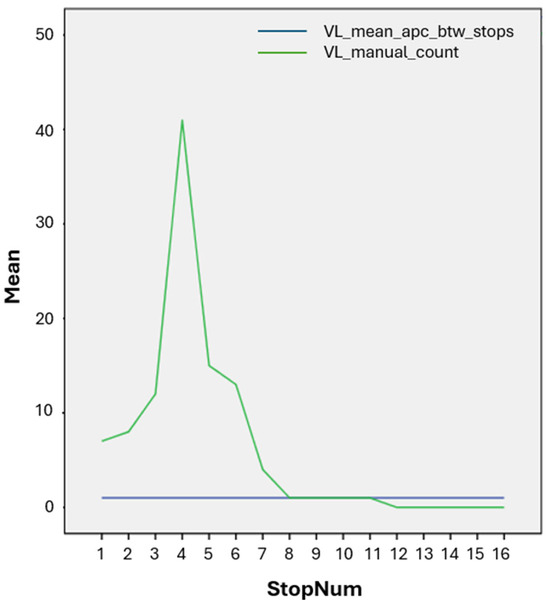
Figure 9.
Example of large differences, which could be due to malfunctioning of the device (Line 22, vehicle trip 2).
For Line 22, during vehicle trips 1 through 4, while the manual count reported a number of passengers that changed from stop to stop, the APC system appears to have always counted 1 passenger, except a couple of times during trips 2 and 3, where it counted 2 passengers. These data may be indicative of a malfunction in the APC system for those vehicle trips.
An example of a positive difference is shown in Figure 10, relating to Line 7, vehicle trip 13.

Figure 10.
Example of extreme differences, which could be due to data entry error (Line 7, vehicle trip 13).
Manual counting starts with zero passengers, while the APC count starts with 25 passengers, and manual counting increases to 20 passengers at the next stop. There may have been a data entry error during manual counting, resulting in the discrepancy at the first stop.
After excluding vehicle trips with large differences (possibly due to device malfunction or to manual counting or data entry errors) the statistical analyses were repeated in order to check for a possible influence on the results of the statistical analyses. Table 6 shows the results of the analyses.
Table 6.
Estimation of the average delta between the count performed by the APC system (95% CI) and bus occupancy Oc, after excluding trips with large differences.
It can be seen that after excluding vehicle trips with large differences the results of the statistical analyses remain almost unchanged.
4. Discussion
Wi-Fi-sensing-based automatic passenger counting systems have gained significant interest in the past few years, given their potential for providing reasonable accuracy at a low cost. But the accuracy demonstrated so far by different studies has been low or inconsistent. Wi-Fi-based passenger counting systems rarely enjoy the benefit of extensive testing in real-world scenarios where local factors may impair passenger counting accuracy. Earlier research on automatic people counting assessed systems on the basis of restricted numbers of individuals, often no more than 10 [20,35], or as few as 5 within indoor settings [36]. Moreover, most studies have focused on improving the accuracy of the APC system by addressing problems that are internal to the system, while very little focus is given to local factors and error patterns.
This study analyses potential error patterns contributing to low accuracy in Wi-Fi-sensing-based APC systems, with a primary emphasis on local factors, as distinct from Wi-Fi-system-specific challenges such as MAC address randomisation or probe request frequency. The aim is to gain a deeper comprehension of the factors impacting accuracy during the data collection stage. It provides insights into the nature of these factors and their respective degrees of influence on accuracy, and it aids in the identification of strategies to mitigate their effects during the design and testing of data collection systems for Wi-Fi-based passenger counting.
The methodology included a field trial for a period of 19 days in the city of Asti (Italy) on board a bus in normal scheduled use with passengers. In contrast to previous studies, such as Oransirikul et al. [14], who collected data for 70 min, of which 60 min were spent counting people at the bus stop, the current study significantly extends the duration of ground truth data collection to provide a more comprehensive validation.
From this study, local factors such as the type of stop, distinguished by its location (centre, urban, suburban, or extra-urban), and the traffic intensity surrounding the bus were found to have no substantial impact on the accuracy of Wi-Fi-based APC systems. This unexpected finding challenges the assumption that high pedestrian traffic or intense vehicle movement around the bus might cause discrepancies in passenger counting, especially for Wi-Fi-based systems. It is important to note that RSSI filters were used to eliminate signals potentially from outside the bus, so the claim only holds true when effective RSSI filters are used. Concerns are often voiced that systems might mistakenly count individuals or devices outside the bus as being inside, even in cases where RSSI filters are used [15]. These concerns arise because of the many factors that can affect the RSSI returned by a Wi-Fi device, including the antenna design, hardware design, drivers and the environment [37]. However, the findings of the present study may be seen to refute these concerns. We found that these local factors do not significantly affect the precision of Wi-Fi-based APC systems, as long as effective RSSI filters are used.
At the same time, our study identified a crucial factor affecting accuracy, which was the number of occupants within the bus. Our statistical evidence points to a clear pattern of error when it comes to bus occupancy. While errors are minimal where the vehicle contains between 3 and 10 people, in situations where there are over 10 people, an APC device can have a tendency to count fewer passengers than are actually present, with increasing divergence as bus occupancy increases. We assume (as other researchers have assumed in previous studies) that this increase in error is caused by passengers huddling together and causing the Wi-Fi signals to be blocked by their bodies [2]. This pattern was checked and confirmed by re-performing the tests with the data categorised into four sub-groups. Even in the minority of cases where the APC system tended to count more people than the actual number (Pattern 3), counting differences decreased as the number of passengers increased.
One way of addressing this undercounting is to introduce more sensors or device detectors close to the areas in buses where crowding occurs. In the case of urban buses in Asti, the most crowded area is usually close to the central door, where there is more standing space, although the areas where passengers are likely to congregate will depend on the model of the bus and on other local factors, such as whether boarding and alighting are directed through specific doors, and the extent to which rules and guidelines are actually observed. Analysing these aspects and increasing the number of Wi-Fi sensors close to crowded areas depending on the bus model and the geographical location could help improve accuracy, irrespective of the data processing algorithm used. The proposed solutions are applicable also to other case studies as they are not case-specific.
5. Conclusions and Way Forward
This research has allowed us to find a path for improving the accuracy of Wi-Fi sensing for passenger counting; however, our analysis is not without its limitations. One of its shortcomings lies in the qualitative nature of estimating pedestrian traffic around the bus by classifying the relative location of stops. Qualitative assessments based on observations made by those doing the counting, while providing some insights, lack the precision of quantitative data, potentially introducing subjective biases into the analysis. The method that we employed to gauge vehicular traffic relies heavily on traffic flow speed and fails to take into account information about the proximity to the bus of other vehicles. This lack of granularity in the categorisation of traffic conditions is problematic, since the proximity of other vehicles could potentially influence Wi-Fi signal strength and consequently passenger counting accuracy. However, our findings concerning the effectiveness of RSSI filters may also indicate that this limitation is less problematic than might be feared. Further research is being carried out using the collected data to look for other error patterns and to determine ways of correcting such errors with a view to increasing the accuracy of Wi-Fi-sensing-based APCs. At the telecommunication level, different sensors using different non-overlapping channels for listening to Wi-Fi probe requests could be deployed to increase the chances of picking up more probe request packets. Another research direction concerns Wi-Fi probe request-based device fingerprinting, which can be used to identify single devices without compromising the privacy of passengers. This may be useful in tracking devices present on board the bus and potentially improving accuracy.
To further investigate the influence of local factors on these systems and address some of this study’s limitations, potential improvements to the ground truth data collection method could be considered. This could include incorporating manual counting, between stops, of vehicles and pedestrians in proximity to the bus, which would be a more direct means of measuring pedestrian and vehicular traffic. An alternative approach would involve leveraging datasets containing points of interest (POIs) and their classifications to estimate traffic around the bus. This is an avenue that the authors are currently in the process of exploring. Another possibility is to factor in street width along with other data, as a way of estimating pedestrian and vehicular traffic around the bus, since narrower streets may result in vehicles and pedestrians coming closer to the bus than they would in wider streets. These analyses could then lead the way to a more accurate data collection setup for Wi-Fi-based passenger counting systems, allowing transport operators to obtain several benefits: determining and providing accurate load data to transport authorities, key for obtaining subsidies and rewards; better planning and scheduling of the service as well as forecasting of demand; providing an efficient and quality service, knowing the crowding of their lines, and, thus, improving performance (e.g., pax*km), line utilisation, and maximisation of the effectiveness of each line with consequent cost reduction.
Author Contributions
Conceptualisation, C.P.; methodology, C.P.; validation, C.P., D.A., and A.B.M.; formal analysis, C.P. and D.A.; investigation, C.P. and D.A.; resources, C.P.; data curation, C.P. and D.A.; writing—original draft preparation, D.A.; writing—review and editing, C.P. and A.B.M.; visualisation, C.P. and D.A.; supervision, C.P.; project administration, C.P.; funding acquisition, C.P. All authors have read and agreed to the published version of the manuscript.
Funding
This research received no external funding.
Institutional Review Board Statement
Not applicable.
Informed Consent Statement
Not applicable.
Data Availability Statement
The datasets generated during and analysed during the current study are not publicly available due to sensitive business information belonging to ASP and MOBYFORALL that is not intended for public dissemination.
Acknowledgments
This research study was made possible through the collaboration and support of ASP and Mobyforall (www.mobyforall.com). We gratefully acknowledge ASP in providing access to their buses and Mobyforall in providing the data collected by their device and the manual counting by their team.
Conflicts of Interest
Author Cristina Pronello is the CEO of the company Mobyforall. The remaining authors declare that the research was conducted in the absence of any commercial or financial relationships that could be construed as a potential conflict of interest.
References
- Xu, Z.; Chopra, S.S.; Lee, H. Resilient Urban Public Transportation Infrastructure: A Comparison of Five Flow-Weighted Metro Networks in Terms of the Resilience Cycle Framework. IEEE Trans. Intell. Transp. Syst. 2021, 23, 12688–12699. [Google Scholar] [CrossRef]
- Mccarthy, C.; Moser, I.; Jayaraman, P.P.; Ghaderi, H.; Tan, A.M.; Yavari, A.; Mehmood, U.; Simmons, M.; Weizman, Y.; Georgakopoulos, D.; et al. A Field Study of Internet of Things-Based Solutions for Automatic Passenger Counting. IEEE Open J. Intell. Transp. Syst. 2021, 2, 384–401. [Google Scholar] [CrossRef]
- Leviakangas, P. Digitalisation of Finland’s transport sector. Technol. Soc. 2016, 47, 1–15. [Google Scholar] [CrossRef]
- Fihn, J.; Finndahl, J. A Framework for How to Make Use of an Automatic Passenger Counting System. 2011. Independent Thesis Advanced Level. Available online: https://urn.kb.se/resolve?urn=urn:nbn:se:uu:diva-158139 (accessed on 3 December 2024).
- Gerland, H.E.; Sutter, K. Automatic Passenger Counting (APC): Infra-Red Motion Analyzer for accurate counts in stations and rail, light-rail and bus operations. In Proceedings of the 1999 APTA Bus Conference; American Public Transportation Association: Washington, DC, USA, 2013. [Google Scholar]
- Vieira, D.F.; Júnior, H.G. Public Transportation Passengers Accounting at University by IoT Device. In Proceedings of the 2022 Symposium on Internet of Things (SIoT), Sao Paulo, Brazil, 24–28 October 2022. [Google Scholar] [CrossRef]
- Hepner, E.; Zhao, C.; Seipel, K.; Hoyer, R. Optimisation of the traffic flow in public transport through C-ITS. In Proceedings of the 7th International Conference on Models and Technologies for Intelligent Transportation Systems (MT-ITS), Heraklion, Greece, 16–17 June 2021; pp. 1–5. [Google Scholar] [CrossRef]
- Zhou, C.; Dai, P.; Wang, F.; Zhang, Z. Predicting the passenger demand on bus services for mobile users. Pervasive Mob. Comput. 2016, 25, 48–66. [Google Scholar] [CrossRef]
- Cisco. Cisco Annual Internet Report (2018–2023) White Paper; Cisco: San Jose, CA, USA, 2020; Volume 10, pp. 1–35. Available online: https://www.cisco.com/c/en/us/solutions/collateral/executive-perspectives/annual-internet-report/white-paper-c11-741490.html (accessed on 22 November 2024).
- Statista. Number of Smartphone Subscriptions Worldwide from 2016 to 2027. Available online: https://www.statista.com/statistics/330695/number-of-smartphone-users-worldwide/ (accessed on 15 November 2024).
- Abedi, N.; Bhaskar, A.; Chung, E. Bluetooth and Wi-Fi MAC address based crowd collection and monitoring: Benefits, challenges and enhancement. In Proceedings of the Australasian Transport Research Forum 2013, Brisbane, Australia, 2–4 October 2013; pp. 1–17. [Google Scholar]
- Hidayat, A.; Terabe, S.; Yaginuma, H. WiFi Scanner Technologies for Obtaining Travel Data about Circulator Bus Passengers: Case Study in Obuse, Nagano Prefecture, Japan. Transp. Res. Rec. 2018, 2672, 45–54. [Google Scholar] [CrossRef]
- Schauer, L.; Werner, M.; Marcus, P. Estimating crowd densities and pedestrian flows using Wi-Fi and bluetooth. In Proceedings of the 11th International Conference on Mobile and Ubiquitous Systems: Computing, Networking and Services, London, UK, 2–5 December 2014; pp. 171–177. [Google Scholar] [CrossRef]
- Oransirikul, T.; Nishide, R.; Piumarta, I.; Takada, H. Measuring Bus Passenger Load by Monitoring Wi-Fi Transmissions from Mobile Devices. Procedia Technol. 2014, 18, 120–125. [Google Scholar] [CrossRef]
- Mikkelsen, L.; Buchakchiev, R.; Madsen, T.; Schwefel, H.P. Public transport occupancy estimation using WLAN probing. In Proceedings of the 8th International Workshop on Resilient Networks Design and Modeling, RNDM, Halmstad, Sweden, 13–15 September 2016; Institute of Electrical and Electronics Engineers Inc.: Piscataway, NJ, USA, 2016; pp. 302–308. [Google Scholar] [CrossRef]
- Reichl, P.; Oh, B.; Ravitharan, R.; Stafford, M. Using Wifi Technologies to Count Passengers in Real-time around Rail Infrastructure. In Proceedings of the 2018 International Conference on Intelligent Rail Transportation (ICIRT), Singapore, 12–14 December 2018; pp. 1–5. [Google Scholar] [CrossRef]
- Fenske, E.; Brown, D.; Martin, J.; Mayberry, T.; Ryan, P.; Rye, E. Three Years Later: A Study of MAC Address Randomization in Mobile Devices and When It Succeeds. Proc. Priv. Enhancing Technol. 2021, 164–181. [Google Scholar] [CrossRef]
- Nitti, M.; Pinna, F.; Pintor, L.; Pilloni, V.; Barabino, B. Iabacus: A Wi-Fi-based automatic bus passenger counting system. Energies 2020, 13, 1446. [Google Scholar] [CrossRef]
- APPLE Inc. Wi-Fi Privacy. Apple Support. 2021. Available online: https://support.apple.com/guide/security/wi-fi-privacy-secb9cb3140c/web (accessed on 19 August 2022).
- Choi, H.; Fujimoto, M.; Matsui, T.; Misaki, S.; Yasumoto, K. Wi-CaL: WiFi Sensing and Machine Learning Based Device-Free Crowd Counting and Localization. IEEE Access 2022, 10, 24395–24410. [Google Scholar] [CrossRef]
- Aesys. Video Surveillance System, CCTV and Passenger Counting. 2023. Available online: https://www.aesys.com/products-solutions/bus/on-board-systems/video-surveillance-system-cctv-and-passenger-counting.html (accessed on 19 August 2022).
- Dilax. Automatic Passenger Counting (APC): Sensors & Systems. 2023. Available online: https://www.dilax.com/en/products/automatic-passenger-counting (accessed on 15 November 2024).
- Eurotech. DynaPCN 10-20|Automatic Passenger Counter Ethernet or PoE. 2021. Available online: http://www.eurotech.com/en/products/intelligent-sensors/people-counters/dynapcn-10-20 (accessed on 15 November 2024).
- Eurotech. PCN-1001—Automatic Passenger Counter—RS-485 Interface. 2023. Available online: https://www.eurotech.com/attachment/datasheet?id=69&format=A4 (accessed on 15 November 2024).
- Xovis. People Sensing. Available online: https://www.xovis.com/technology/sensor/ (accessed on 10 April 2025).
- Iris Sensing. IRMA 6: A New Generation of Automatic Passenger Counting. Iris Intell. Sens. 2023. Available online: https://www.iris-sensing.com/us/products/irma-6/ (accessed on 10 April 2023).
- Pronello, C.; Garzón Ruiz, X.R. Evaluating the Performance of Video-Based Automated Passenger Counting Systems in Real-World Conditions: A Comparative Study. Sensors 2023, 23, 7719. [Google Scholar] [CrossRef] [PubMed]
- World Bank Blogs. How Do We Define Cities, Towns, and Rural Areas? Available online: https://blogs.worldbank.org/sustainablecities/how-do-we-define-cities-towns-and-rural-areas (accessed on 15 November 2024).
- Pew Res. Center’s Soc. Demogr. Trends Proj. What Unites and Divides Urban, Suburban and Rural Communities. Available online: https://www.pewresearch.org/social-trends/2018/05/22/what-unites-and-divides-urban-suburban-and-rural-communities/ (accessed on 10 January 2023).
- Google Maps. Plan Your Commute or Trip—Android—Google Maps Help—Typical Traffic. Available online: https://support.google.com/maps/answer/7565193?hl=en&co=GENIE.Platform%3DAndroid&sjid=12792780725296773485-EU&oco=0 (accessed on 10 January 2021).
- Flores, B.E. A pragmatic view of accuracy measurement in forecasting. Omega 1986, 14, 93–98. [Google Scholar] [CrossRef]
- Towardsdatascience. Choosing the Correct Error Metric: MAPE vs. sMAPE. Available online: https://towardsdatascience.com/choosing-the-correct-error-metric-mape-vs-smape-5328dec53fac (accessed on 15 November 2024).
- Buxton, R. Statistics: Multilevel modelling. In Mathematics Learning Support Centre-Technical Report; Taylor Francis: Abingdon, UK, 2008. [Google Scholar]
- Lara, J.D.; Guerra, E.; Cuadrado, J.S. When and How to Use Multilevel Modelling. ACM Trans. Softw. Eng. Methodol. 2014, 24, 1–46. [Google Scholar] [CrossRef]
- Ibrahim, O.T.; Gomaa, W.; Youssef, M. CrossCount: A Deep Learning System for Device-Free Human Counting Using WiFi. IEEE Sens. J. 2019, 19, 9921–9928. [Google Scholar] [CrossRef]
- Liu, S.; Zhao, Y.; Xue, F.; Chen, B.; Chen, X. DeepCount: Crowd Counting with WiFi via Deep Learning. arXiv 2019, arXiv:1903.05316. [Google Scholar] [CrossRef]
- Dong, Q.; Dargie, W. Evaluation of the Reliability of RSSI for Indoor Localization. In Proceedings of the International Conference on Wireless Communications in Underground and Confined Areas, Clermont-Ferrand, France, 28–30 August 2012; pp. 1–6. [Google Scholar] [CrossRef]


Disclaimer/Publisher’s Note: The statements, opinions and data contained in all publications are solely those of the individual author(s) and contributor(s) and not of MDPI and/or the editor(s). MDPI and/or the editor(s) disclaim responsibility for any injury to people or property resulting from any ideas, methods, instructions or products referred to in the content. |
© 2025 by the authors. Licensee MDPI, Basel, Switzerland. This article is an open access article distributed under the terms and conditions of the Creative Commons Attribution (CC BY) license (https://creativecommons.org/licenses/by/4.0/).