Article

Drunk Driver Detection Using Thermal Facial Images

by
Chin-Heng Chai
1,
Siti Fatimah Abdul Razak
1,2,*,
Sumendra Yogarayan
1,2 and
Ramesh Shanmugam
3
1
Faculty of Information Science and Technology, Multimedia University, Melaka 75450, Malaysia
2
Center for Intelligent Cloud Computing, COE for Advanced Cloud, Multimedia University, Melaka 75450, Malaysia
3
Department of Mechatronics Engineering, Rajalakshmi Engineering College, Thandalam 602105, India
*
Author to whom correspondence should be addressed.
Information 2025, 16(5), 413; https://doi.org/10.3390/info16050413
Submission received: 19 March 2025 / Revised: 13 May 2025 / Accepted: 13 May 2025 / Published: 18 May 2025

Abstract

:
This study aims to investigate and propose a machine learning approach that can accurately detect alcohol consumption by analyzing the thermal patterns of facial features. Thermal images from the Tufts Face Database and self-collected images were utilized to train the models in identifying temperature variations in specific facial regions. Convolutional Neural Networks (CNNs) and YOLO (You Only Look Once) algorithms were employed to extract facial features, while classifiers such as Support Vector Machines (SVMs), Multi-Layer Perceptron (MLP), and K-Nearest Neighbors (KNN), as well as Random Forest and linear regression, classify individuals as sober or intoxicated based on their thermal images. The models’ effectiveness in analyzing thermal images to determine alcohol intoxication is expected to provide a foundation for the development of a realistic drunk driver detection system based on thermal images. In this study, MLP obtained 90% accuracy and outperformed the other models in classifying the thermal images, either as sober or showing signs of alcohol consumption. The trained models may be embedded in advanced drunk detection systems as part of an in-vehicle safety application.

1. Introduction

In many countries, drunk driving accidents constitute a considerable risk to public safety since they frequently result in serious injuries, fatalities, and high medical expenditures. The likelihood that young people may be involved in an accident caused by alcohol increases the urgency of finding workable remedies. However, conventional methods like breath tests have proven inadequate in addressing the issue. The conventional methods rely on manual inspection and sampling, which are time-consuming and have limited coverage. Authorities have frequently missed cases of drunk driving and, as a result, endangered the safety of road users. Furthermore, because breathalyzer tests primarily detect alcohol levels in the breath, the degree of intoxication may be impacted by variations in metabolism and physiological parameters. To reliably detect drivers who are under the influence of alcohol while also being accessible, user-friendly, and accurate, new models must be developed [1]. Hence, alternative or complementary approaches like machine learning are necessary. For example, Omar (2023) [2] investigated the use of artificial intelligence algorithms to prevent drunk driving. The authors employed a facial image dataset known as drunkImagesWebp and concluded that both linear regression and decision trees can accurately detect drunk drivers with an accuracy of 90% compared to human-administered tests. In [3], transfer learning was proposed to detect drunk driving. The authors applied transfer learning from the Convolutional Neural Network (CNN) features to the Random Forest (RF) features with an accuracy of up to 93%.
In addition to conventional procedures, including breath tests, urine tests, and blood tests, facial features have been proposed as a method for detecting drunk drivers. However, recent research highlighted the difficulty of feature extraction from specific areas of the face, which is usually based on the manual identification of Regions of Interest (ROIs). This process requires researchers to manually recognize and label facial features, which are subjective, labor-intensive, have limited scalability, and depend on human judgment. The process is not practical for real-time applications such as detecting drunk driving [4]. Furthermore, since changes in facial surface temperature due to alcohol consumption can affect facial features, there is a need to develop reliable algorithms for detecting intoxication, particularly given the potential consequences of driving under the influence [3].
Hence, this study aims to investigate and propose a machine learning approach that can accurately detect alcohol by analyzing thermal patterns on facial features. Temperature variations in specific facial regions will be used as indicators for alcohol consumption. To train, test, and validate the model, images of sober and drunk states, focusing on facial features, are collected. Furthermore, to extract facial features from thermal images, the detection method was developed by employing facial recognition algorithms, specifically CNN and YOLO (You Only Look Once) approaches. These algorithms were customized to work with thermal data and capture the unique thermal patterns indicative of alcohol. In terms of drunk detection, various machine learning algorithms, including Support Vector Machine (SVM), Multi-Layer Perceptron (MLP), RF, Logistic Regression (LR), and K-Nearest Neighbors (KNN), were employed to analyze the extracted facial features from thermal images and to classify each individual as either sober or drunk based on predefined criteria. These criteria were specified by analyzing patterns and thresholds in the thermal data, such as significant temperature variations in certain facial regions or specific ranges of temperature values associated with alcohol-related changes.
Section 2, as follows, presents previous research on different approaches for drunk detection. Section 3 presents the dataset and methodology applied to this study, followed by Section 4, which is the Results and Discussion. Section 5 concludes this study.

2. Literature Review

Conventional drunk detection using blood tests, breath analyzers, and urine tests requires the use of consumables and certified instruments. The inspection procedure conducted by the authorities is ineffective, time- and resource-consuming, and may be biased or have incorrect conclusions [5]. Hence, to address these limitations, many researchers have implemented new methods and algorithms in drunk detection technology [6]. This section describes approaches and technologies that have been proposed for drunk detection, especially sensor-based and facial recognition technologies.

2.1. Sensor-Based Technologies

Previous researchers proposed the implementation of sensors in modern vehicles to curb drunk driving. They highlighted that direct contactless detection should be made possible for drivers and road users. For instance, sensors that measure a driver’s heart rate and analyze the breath of a driver for traces of alcohol were proposed to be placed on the steering wheel [7]. Earlier, a passive and continuous system for detecting drunk driving called DetectDUI was also proposed. The system employed a self-attention Convolutional Neural Network called C-Attention, and the authors reported an accuracy rate of 96.6% in identifying drunk drivers [8]. In a different study, a compact in-vehicle alcohol detection system was created using a machine learning method called Optimizable Shallow Neural Network (O-SNN). A five-fold cross-validation approach was used to ensure proper validation. The system performed exceptionally well in the experimental test, reaching a detection accuracy of 99.8% and an inferencing latency of 2.22 s [9]. Likewise, alcohol detection with engine lockout systems was developed for automobiles. An ultrasonic sensor and Arduino UNO as the Master Control Unit were used for continuous monitoring and detection. In addition, the system is equipped with a SIM900A module that enables sending messages to notify the authorities about vehicles that may potentially be operated by an alcohol-intoxicated driver [10]. Similarly, an integrated GPS and GSM system with an engine lockout module is developed to detect ethanol in the air and ensure the safety of riders in both four-wheelers and two-wheelers. The vehicle’s location can be detected, and relevant information can be transmitted to the appropriate authorities. Once the engine is locked out, a One-Time Password (OTP) is required to disable the engine lockout system [11]. Lu et al. used an array of sensors, i.e., one central sensor and six auxiliary sensors, to accurately identify drunk driving, which was defined when a driver consumed more than 50 mL of alcohol. The vehicle also auto-locked, and a voice prompt was audible [12]. Wang et al. investigated 21 sensors before finalizing 9 sensors consisting of TGS2620, TGS2611, TGS2600, TGS2602, MP-4, MP135, TGS2610, GSBT11, and MP-7 for detecting drunk driving in shared vehicles [13].

2.2. Facial Feature Recognition

Nevertheless, to further improve the reliability of the drunk detection system, previous researchers have proposed combining facial features. The authors in [14] reviewed facial feature recognition approaches for detecting drunk drivers. The process was carried out using the CNN, a deep learning algorithm, and was followed by the drunk classification stage [15]. For example, an alcohol-intoxicated person’s nose and eye sockets experience lower temperatures than those of a sober individual. In [16], Fisher’s linear discriminant is used to decrease the feature dimensionality, and a Gaussian mixture model-based classifier is used to categorize the characteristics for each individual. Since the accuracy and reliability of a conventional facial feature recognition approach can be impacted by various factors, including the illumination problem, the use of thermal cameras in drunk detection techniques is proposed. Illumination issues can arise in situations where lighting conditions are excessively bright, dim, or uneven, leading to the presence of shadows and highlights that can obscure crucial facial features used for identification by the system. The various heat patterns of an individual caused by alcohol intoxication can be detected from thermal images.
In [17], a CNN algorithm was utilized in thermal-based facial recognition. The authors set a resolution of 128 × 160 pixels for the images captured using the infrared camera Vision Micron/A10 Model (18 mm, f/1.6). The study involves two stages, i.e., face recognition and drunk classification. The face recognition stage was reported to achieve a recognition accuracy of 97%. On the other hand, the drunk classification stage achieved 87% accuracy. Twenty-two precise places on the face were utilized to construct a feature vector. Fisher’s linear discriminant was applied for dimensionality reduction, and the Gaussian mixture model was used for classification. In [18], the authors compared four deep learning models to classify thermal images into four categories, i.e., normal (sober), one glass, two glasses, and three glasses. The thermal images were obtained using thermal cameras for smartphones, FLIR ONE, with a resolution of 160 × 120 pixels. NasnetMobile outperformed EfficientNet-B1, MobileNetV2, and Inception V4 with an 85.10% accuracy.
Furthermore, three Deep Convolutional Neural Network (DCNN) architectures were utilized, i.e., a 15-layer structure with 3 × 3 convolutional filters, a simpler structure with fewer layers and 5 × 5 convolutions, and GoogLeNet, a CNN network inspired by LeNet with an Inception module for intoxication diagnosis based on an infrared dataset of 25 subjects in sober and intoxicated states. All architectures achieved accuracy rates above 90% [19].
Moreover, Hermosila et al. [16] conducted a study using the Pontificia Universidad Católica de Valparaíso Drunk Thermal Face (PUCV-DTF) database, which consists of 46 subjects from whom we extracted thermal facial images and determined whether the person was drunk. Weber Local Descriptor (WLD) and Local Binary Pattern (LBP) were used for face recognition. To minimize feature dimensionality during the classification step, the researcher used Fisher’s linear discriminant. The features were then classified using a Gaussian mixture model-based classifier, resulting in the creation of a “DrunkSpace Classifier” that established a classification space for everyone with 86.96% accuracy. However, this study focused on classifying groups of people, which may not be appropriate for making individualized classifications.
In [20], the authors do not only focus on facial images. Instead, the dataset includes images of the eyes, face, hands, and ears, in both sober and drunk conditions. The Non-Sub-sampled Contourlet Transform (NSCT) was used by the researchers to extract texture characteristics from the thermal pictures. This technique employs multi-resolution approaches to efficiently capture texture features by utilizing fewer coefficients across various scales, directions, and resolutions. The authors combined NSCT, feature selection, and SVM classification to achieve an accuracy of 93% for the eyes, 94.1% for the face, 95.1% for the hands, and 100% for the ears. Prior to that, Bhuyan et al. [21] focused on classifying alcohol-intoxicated individuals using thermal images and the walking patterns of drunk individuals. The images were acquired from 30 males and 10 females who consumed 62.4 mL of alcohol within one hour. The facial edges were detected using Curvelet Transform, and the motion trajectories between drunk and sober states were analyzed using Speeded Up Robust Features (SURFs). In addition, SVM and RF classifiers were utilized for drunk detection. Furthermore, Koukiou [22] utilized multi-frame thermal images of 41 individuals’ faces to identify signs of intoxication based on specific regions of the face that exhibited consistent temperatures in both sober and drunk individuals. Based on a total of 4100 thermal images, the SVM achieved a success rate of over 86% in identifying intoxication.
In general, Table 1 presents a summary of various papers, including their performances, datasets, methodologies, proposed methods, and limitations that have been reviewed. Among the publications, the PUCV-DTF database emerged as the most used dataset, while CNNs and SVMs are commonly used for drunk detection from thermal images with an image resolution of 128 × 160.

3. Materials and Methods

This section describes the data collection process, followed by the facial recognition and classification method.

3.1. Data Collection

The dataset used for this study is self-collected under a controlled environment by Seong et al. [14]. The participants were recruited from volunteers between 21 and 25 years old who gave their consent. They declared that they have no dietary restrictions related to religion or health and consume alcohol casually. Appointments were made with the participants during the daytime, and they were requested to allocate about 120 min for the data collection process. Once the participants arrived at the predetermined venue, they were given 20 min to create a baseline state (sober state) and avoid the influence of recent activities or external factors on the quality of the thermal images. Once ready, thermal images were captured from various angles, including frontal (0°), side (90°), semi-frontal (45°), and three irregular or random angles using the FLIR T530 Professional Thermal Camera (FLIR Systems, Inc., Wilsonville, OR, USA). The camera has a thermal sensitivity or Noise Equivalent Temperature Difference (NETD) of less than 40 mK to detect differences smaller than 0.03 °C with an accuracy of ±2 °C.
This camera offers two distinct image types, which are thermal and normal RGB images, both boasting high resolution, enriching the dataset with comprehensive visual information. The color of the hot regions can be configured, and the background lighting can be disregarded, which enhances the accuracy of facial feature extraction. The same participant is required to consume two cans of beer that contain 5% alcohol or above within a specific timeline. An observation period of 15 to 20 min was mandatory to allow thermal changes to be visible after alcohol intake. Afterwards, the images were captured with similar angles to the sober state. To ensure environmental temperature does not influence the body temperature and affect the thermal images, participants were placed in an air-conditioned room with a temperature ranging from 25 to 30 degrees Celsius. This eliminates any direct exposure to sunlight or other heat sources that may interfere with the thermal imaging process. In total, 240 images were captured from 20 participants. These collected images exhibited variations in facial thermal patterns associated with alcohol. Image segmentation was carried out using LabelImg version 1.8.6, which annotates facial regions and generates a text file in YOLO format. In this study, YOLOv8 was utilized.

3.2. Face Recognition

In this study, the self-collected dataset was augmented to create variations that simulate new data based on the initial 240 images. As a result, 570 images were used to train machine learning models for face recognition, which serves as the foundation for establishing a pre-trained model. In addition, 1315 face images wearing spectacles and without spectacles from the Tufts Face dataset in the Kaggle repository were included as a training dataset to increase the diversity of the training images. The pre-trained YOLO model, which leverages CNNs to classify images, allows for a comprehensive evaluation of the performance of the face recognition model. In this study, the model was trained for 20 epochs, with an image size of 320. The comprehensive feature of the Tufts Face dataset contributes to the YOLO model’s ability to effectively detect faces in grayscale thermal images, showcasing its adaptability to diverse datasets with varying participant characteristics.

3.3. Drunk Classification

For general processing, we used an Intel(R) Core i5-9300H CPU and an NVIDIA GeForce GTX 1650 GPU with 16 GB RAM. This study extracted a minimum of 22 grid points from facial landmarks such as the eyes, nose, mouth, and other distinctive features that are known to display higher temperatures when alcohol is consumed, as shown in Figure 1. It is imperative to consider different conditions, which include diverse facial expressions and individuals facing different directions or showing head movements, especially when heavily drunk. Hence, our self-collected data considered this aspect during the data collection process. This will allow the model to generalize well across different scenarios that may be encountered in real-world situations.
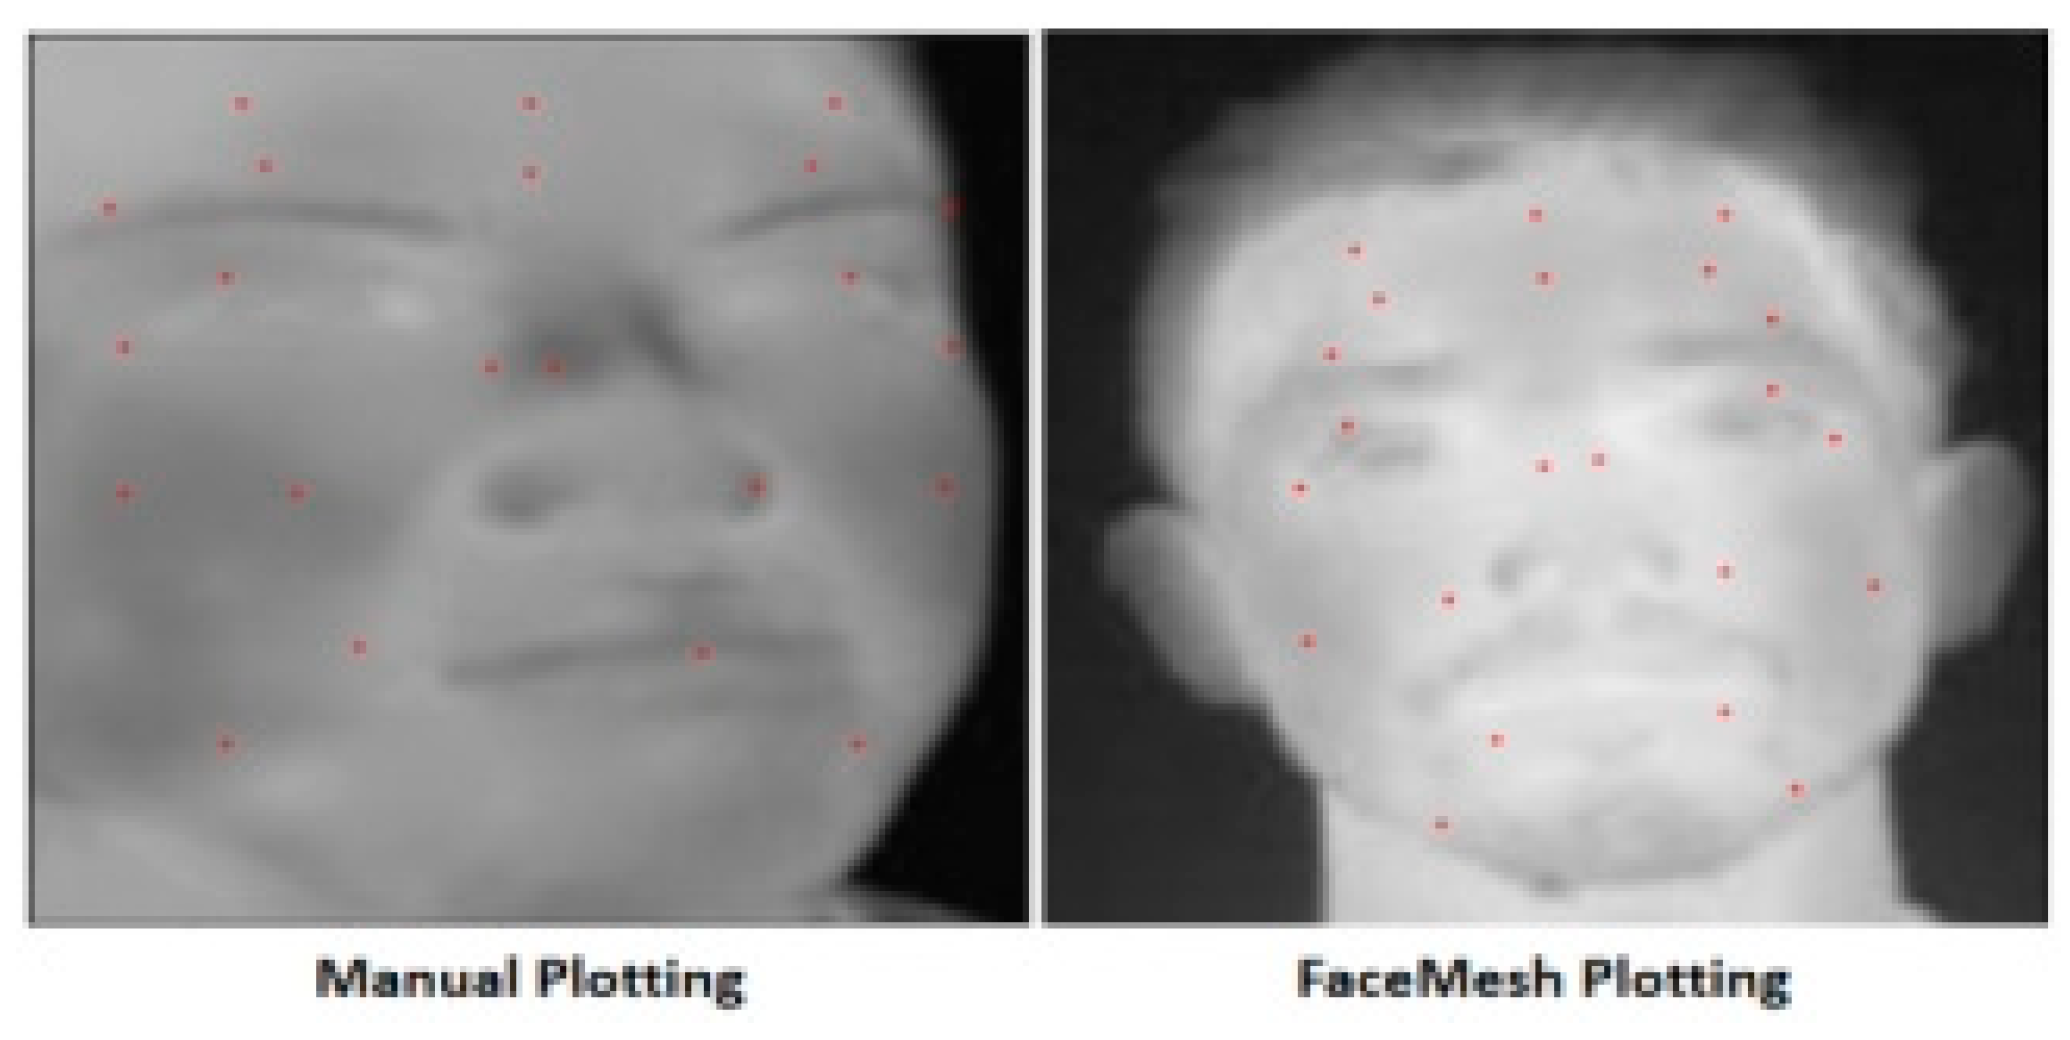
Two distinct methods were considered for feature extraction. The first method involves manual extraction by utilizing bounding boxes predicted by the facial recognition YOLO model. This is followed by resizing the image to 128 × 128 and manually locating the X and Y coordinates of facial landmarks from the resized thermal image. The second method utilizes FaceMesh version 0.4.1633559619, an advanced facial landmark detection model within the MediaPipe framework, which can precisely and directly identify 468 3D facial landmarks without the need for preprocessing like resizing or manual coordinate plotting. More recent deep learning architectures, such as transformer-based or hybrid architectures, while potentially offering higher accuracy, often demand significantly more computational resources, which may limit their applicability in practical, real-time deployment scenarios. The application of FaceMesh has proven to be more effective, particularly in accurately locating facial landmarks in grayscale images. Unlike many other approaches that are only suitable for RGB images, FaceMesh is more reliable in accurately locating facial landmarks from grayscale images, as shown in our study.
In Figure 2, two images are provided to illustrate the difference, showcasing the results of manual plotting and FaceMesh for feature extraction. The manual method achieved a lower accuracy when the person faces another direction, whereas FaceMesh accurately locates facial landmarks even when the person is facing different directions and rotating their head, which results in varying face poses.
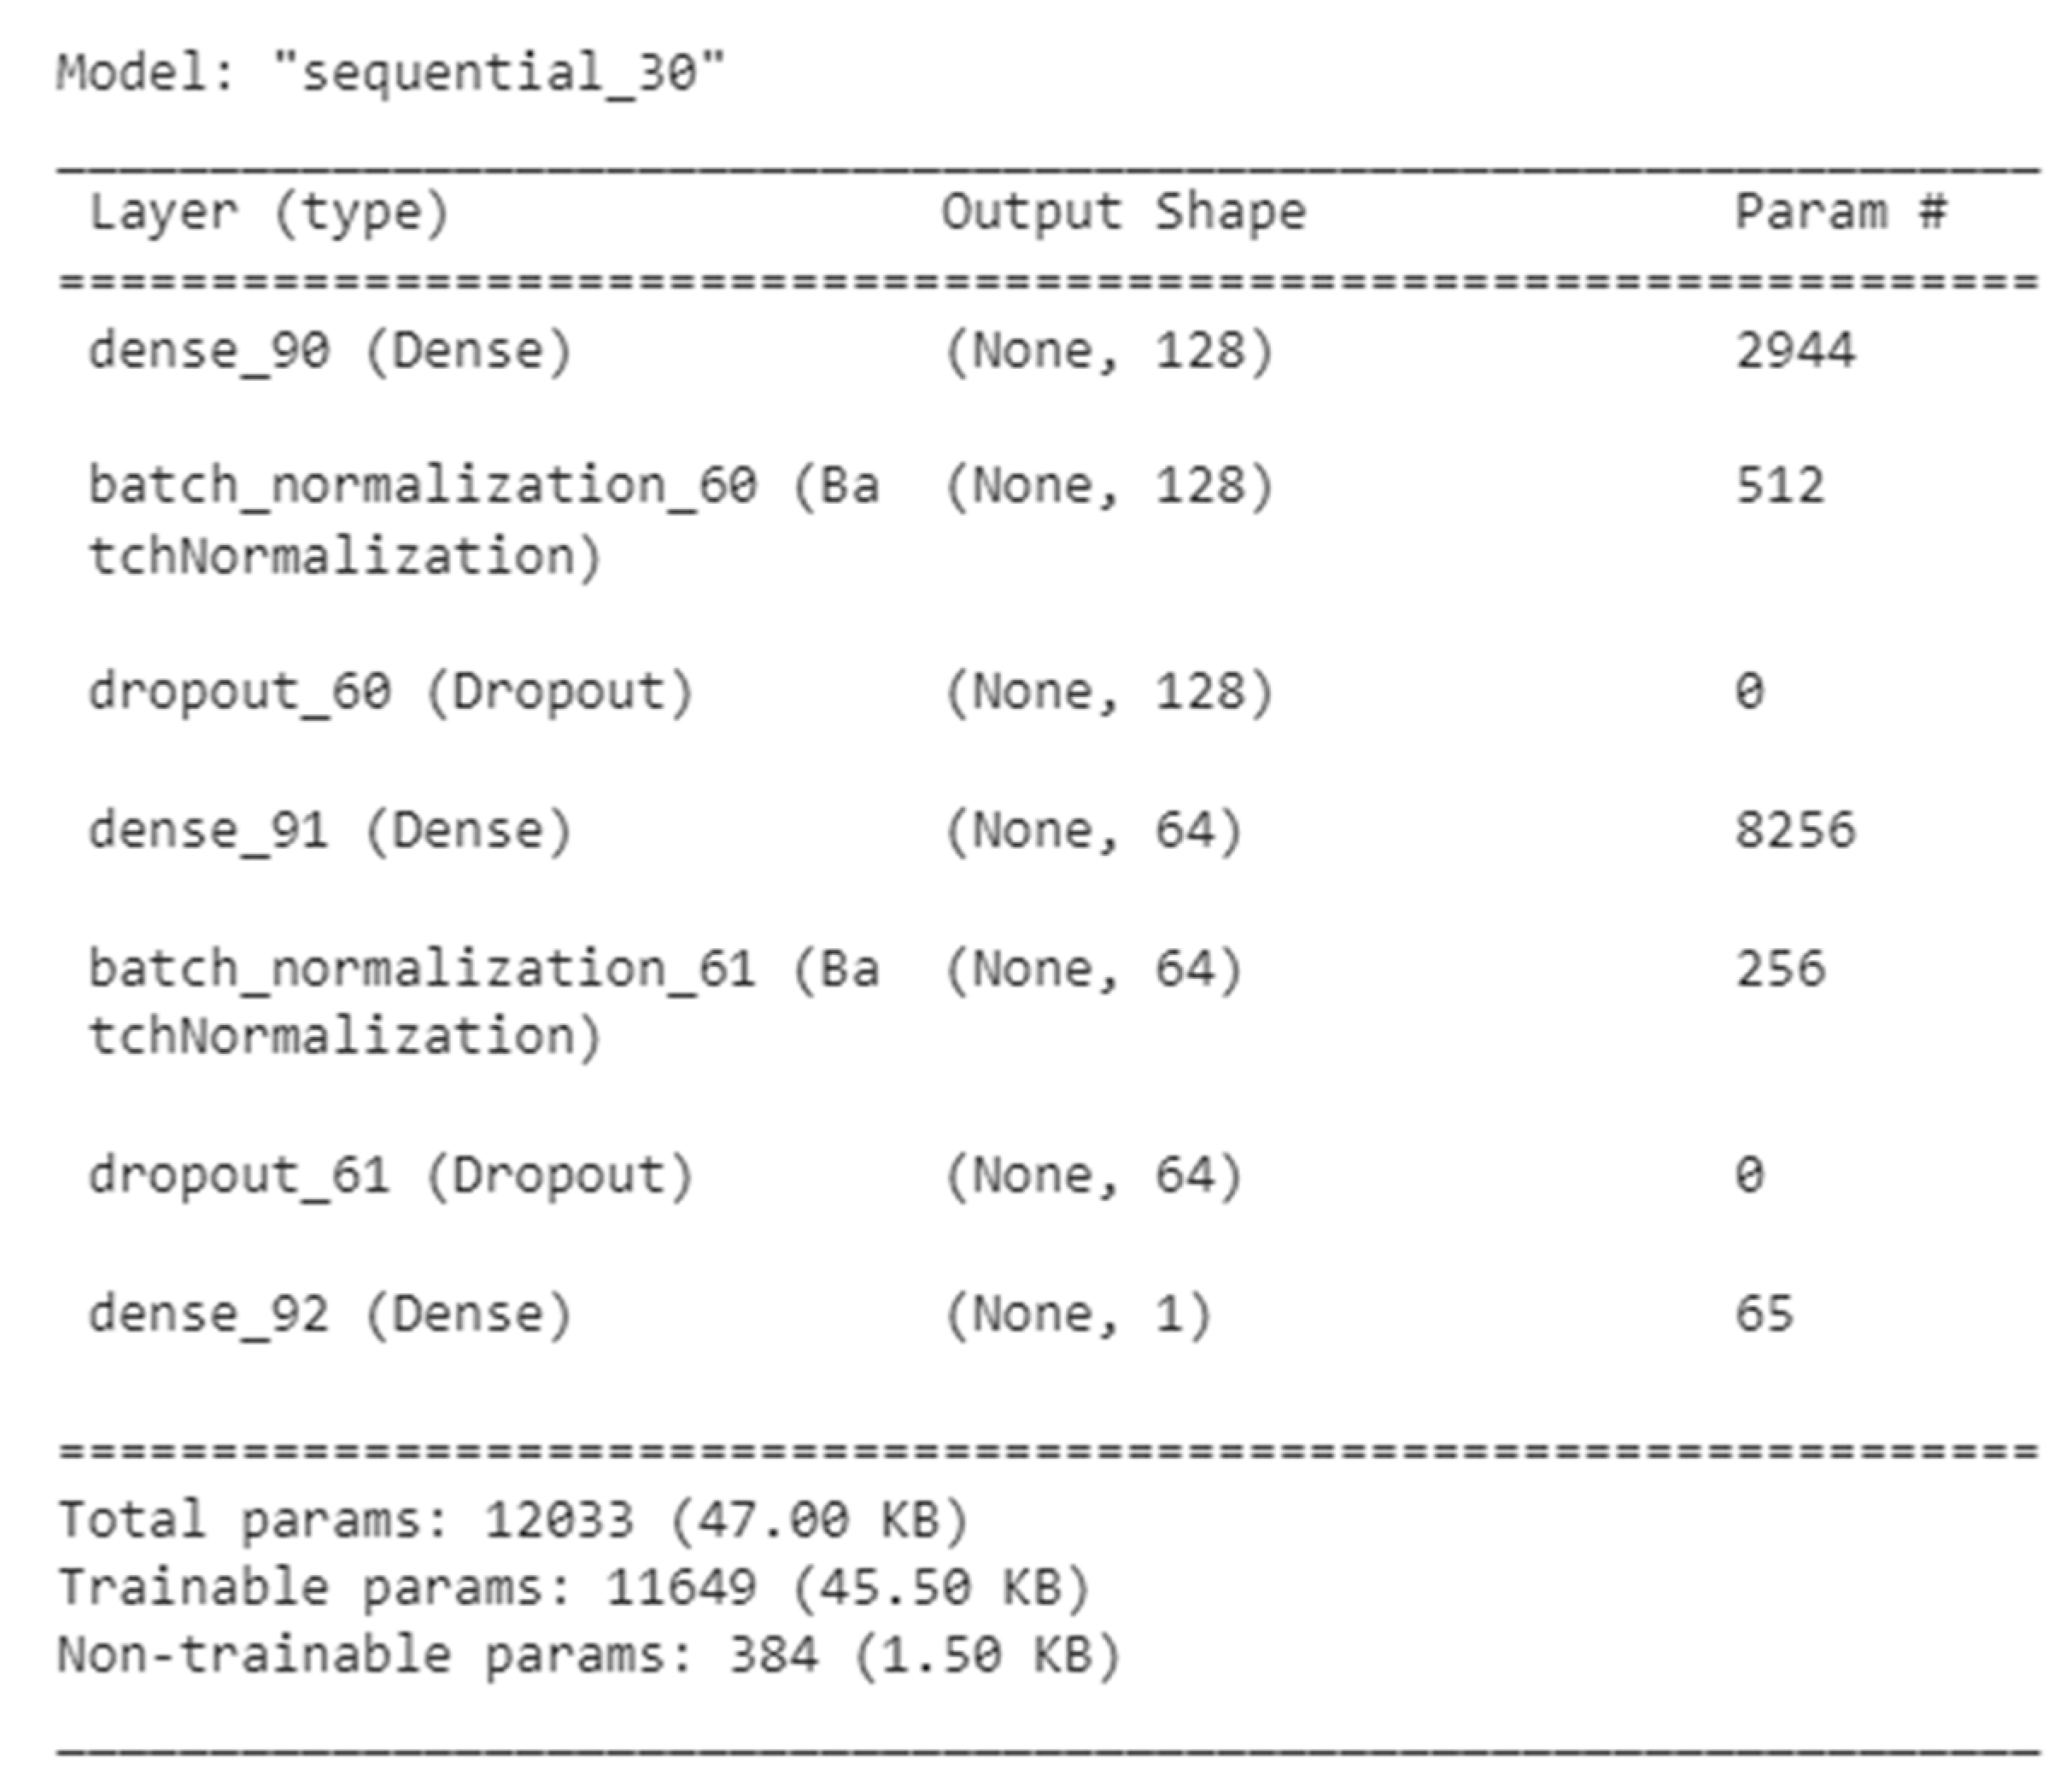
ML models are trained using KNN, MLP, LR, RF, and SVM architectures with a 75–25% split. Among these models, the MLP (Multi-Layer Perceptron), which is a deep learning model, was constructed using Keras’ Sequential API. The depth and complexity of the model are shown in Figure 3.
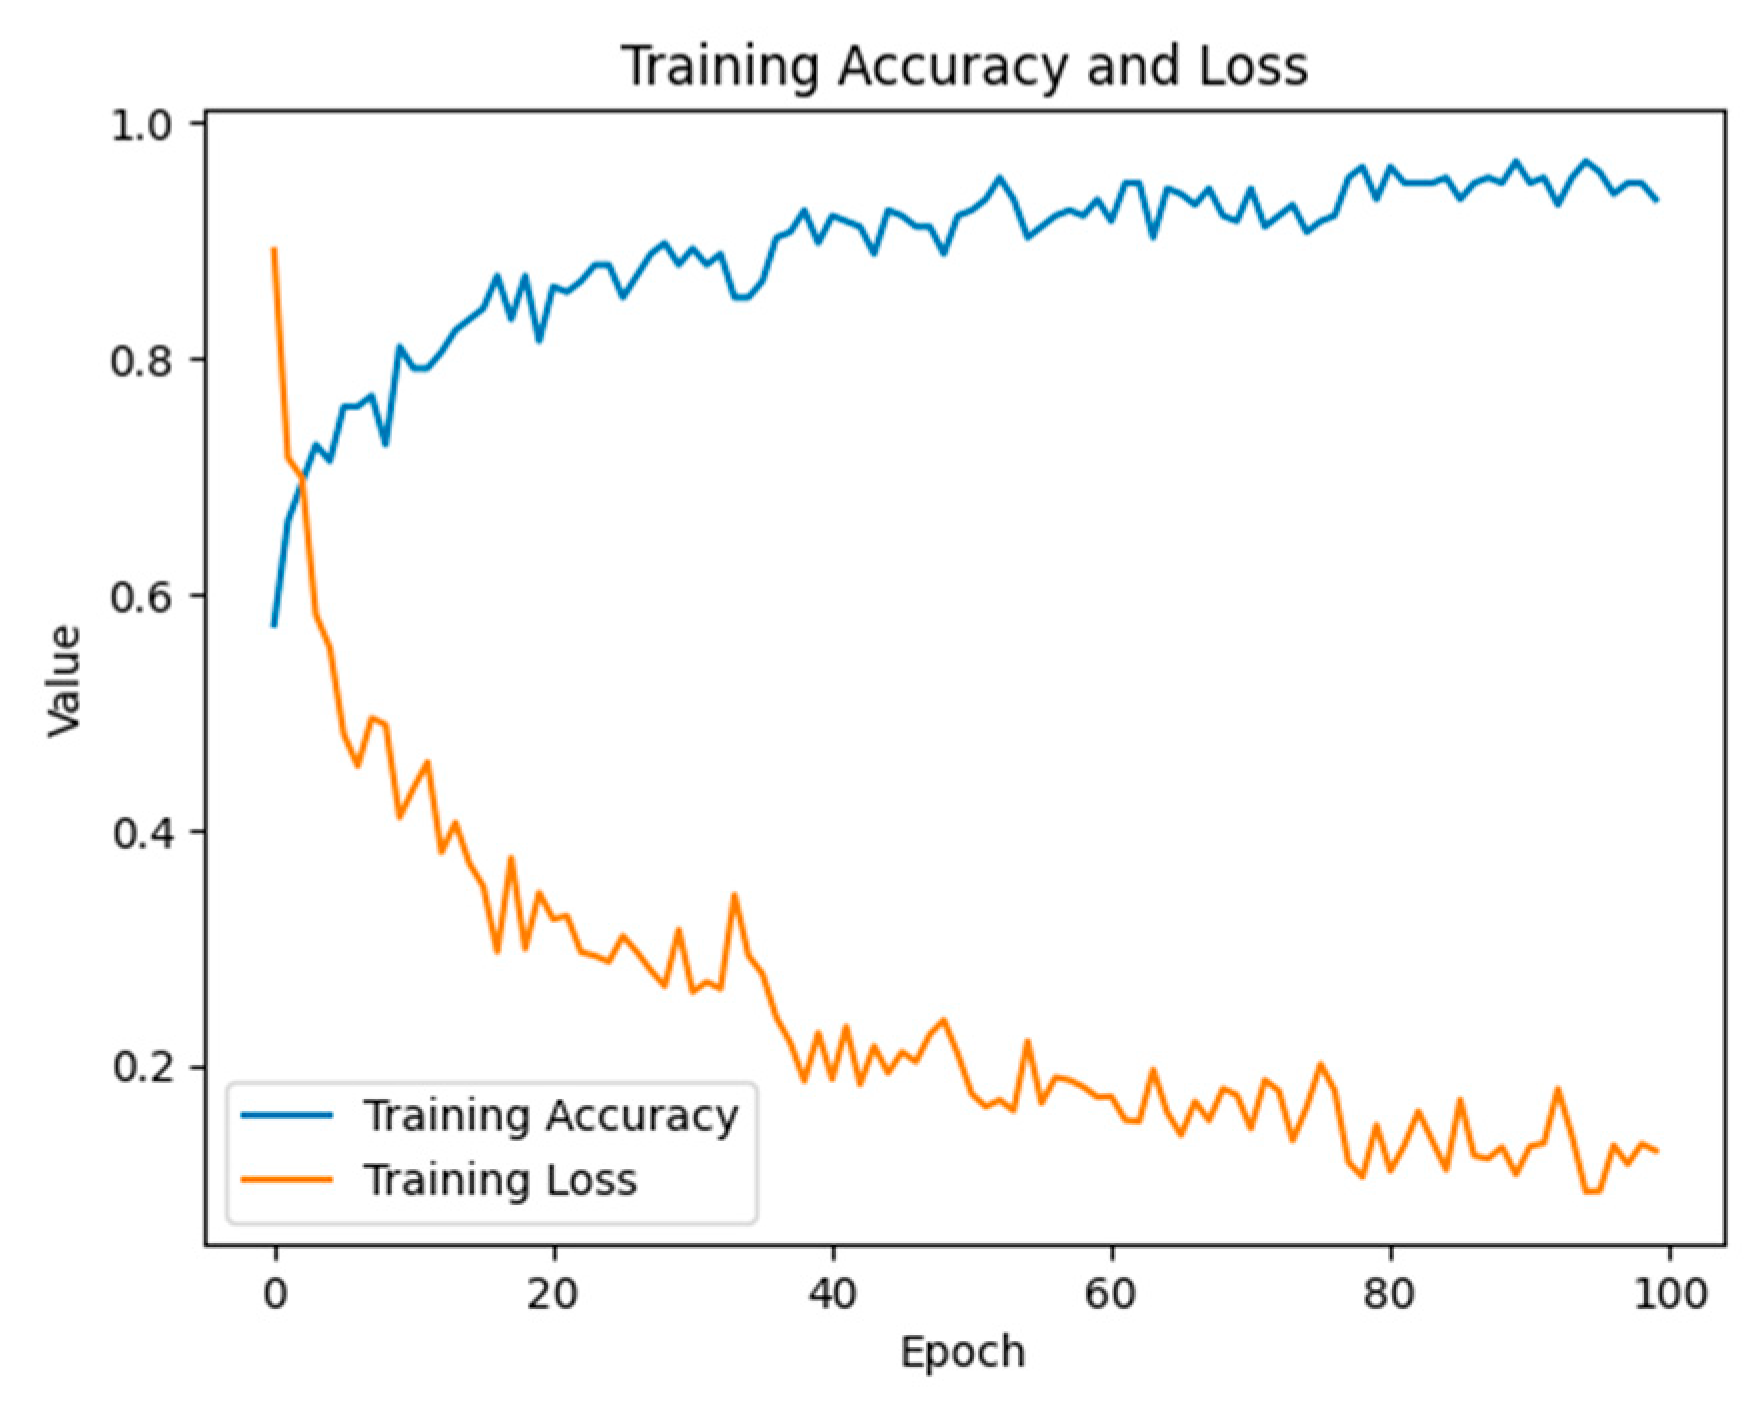
Three dense layers were incorporated, consisting of 128 units, 64 units, and 1 unit. The activation of hidden layers with Rectified Linear Unit (ReLU) functions introduced non-linearity, allowing the model to capture intricate relationships in the data. Furthermore, to address concerns of overfitting and enhance generalization, Batch Normalization layers and dropout layers were strategically introduced with a 0.5 dropout rate. Batch Normalization helps stabilize and accelerate the training process, while dropout layers prevent reliance on specific neurons, thus improving the model’s adaptability to various scenarios. Additionally, the Adam optimizer was applied with a learning rate of 0.001, while the appropriate loss function chosen was the binary cross-entropy (0.5 threshold). One hundred epochs with a batch size of 32 and a 0.1 validation split were applied to train the model. The training process was repeated 101 times using different random seeds to shuffle the data prior to splitting. The performance of the model was evaluated using accuracy, precision, recall, F1 score, and the confusion matrix.

4. Results and Discussion

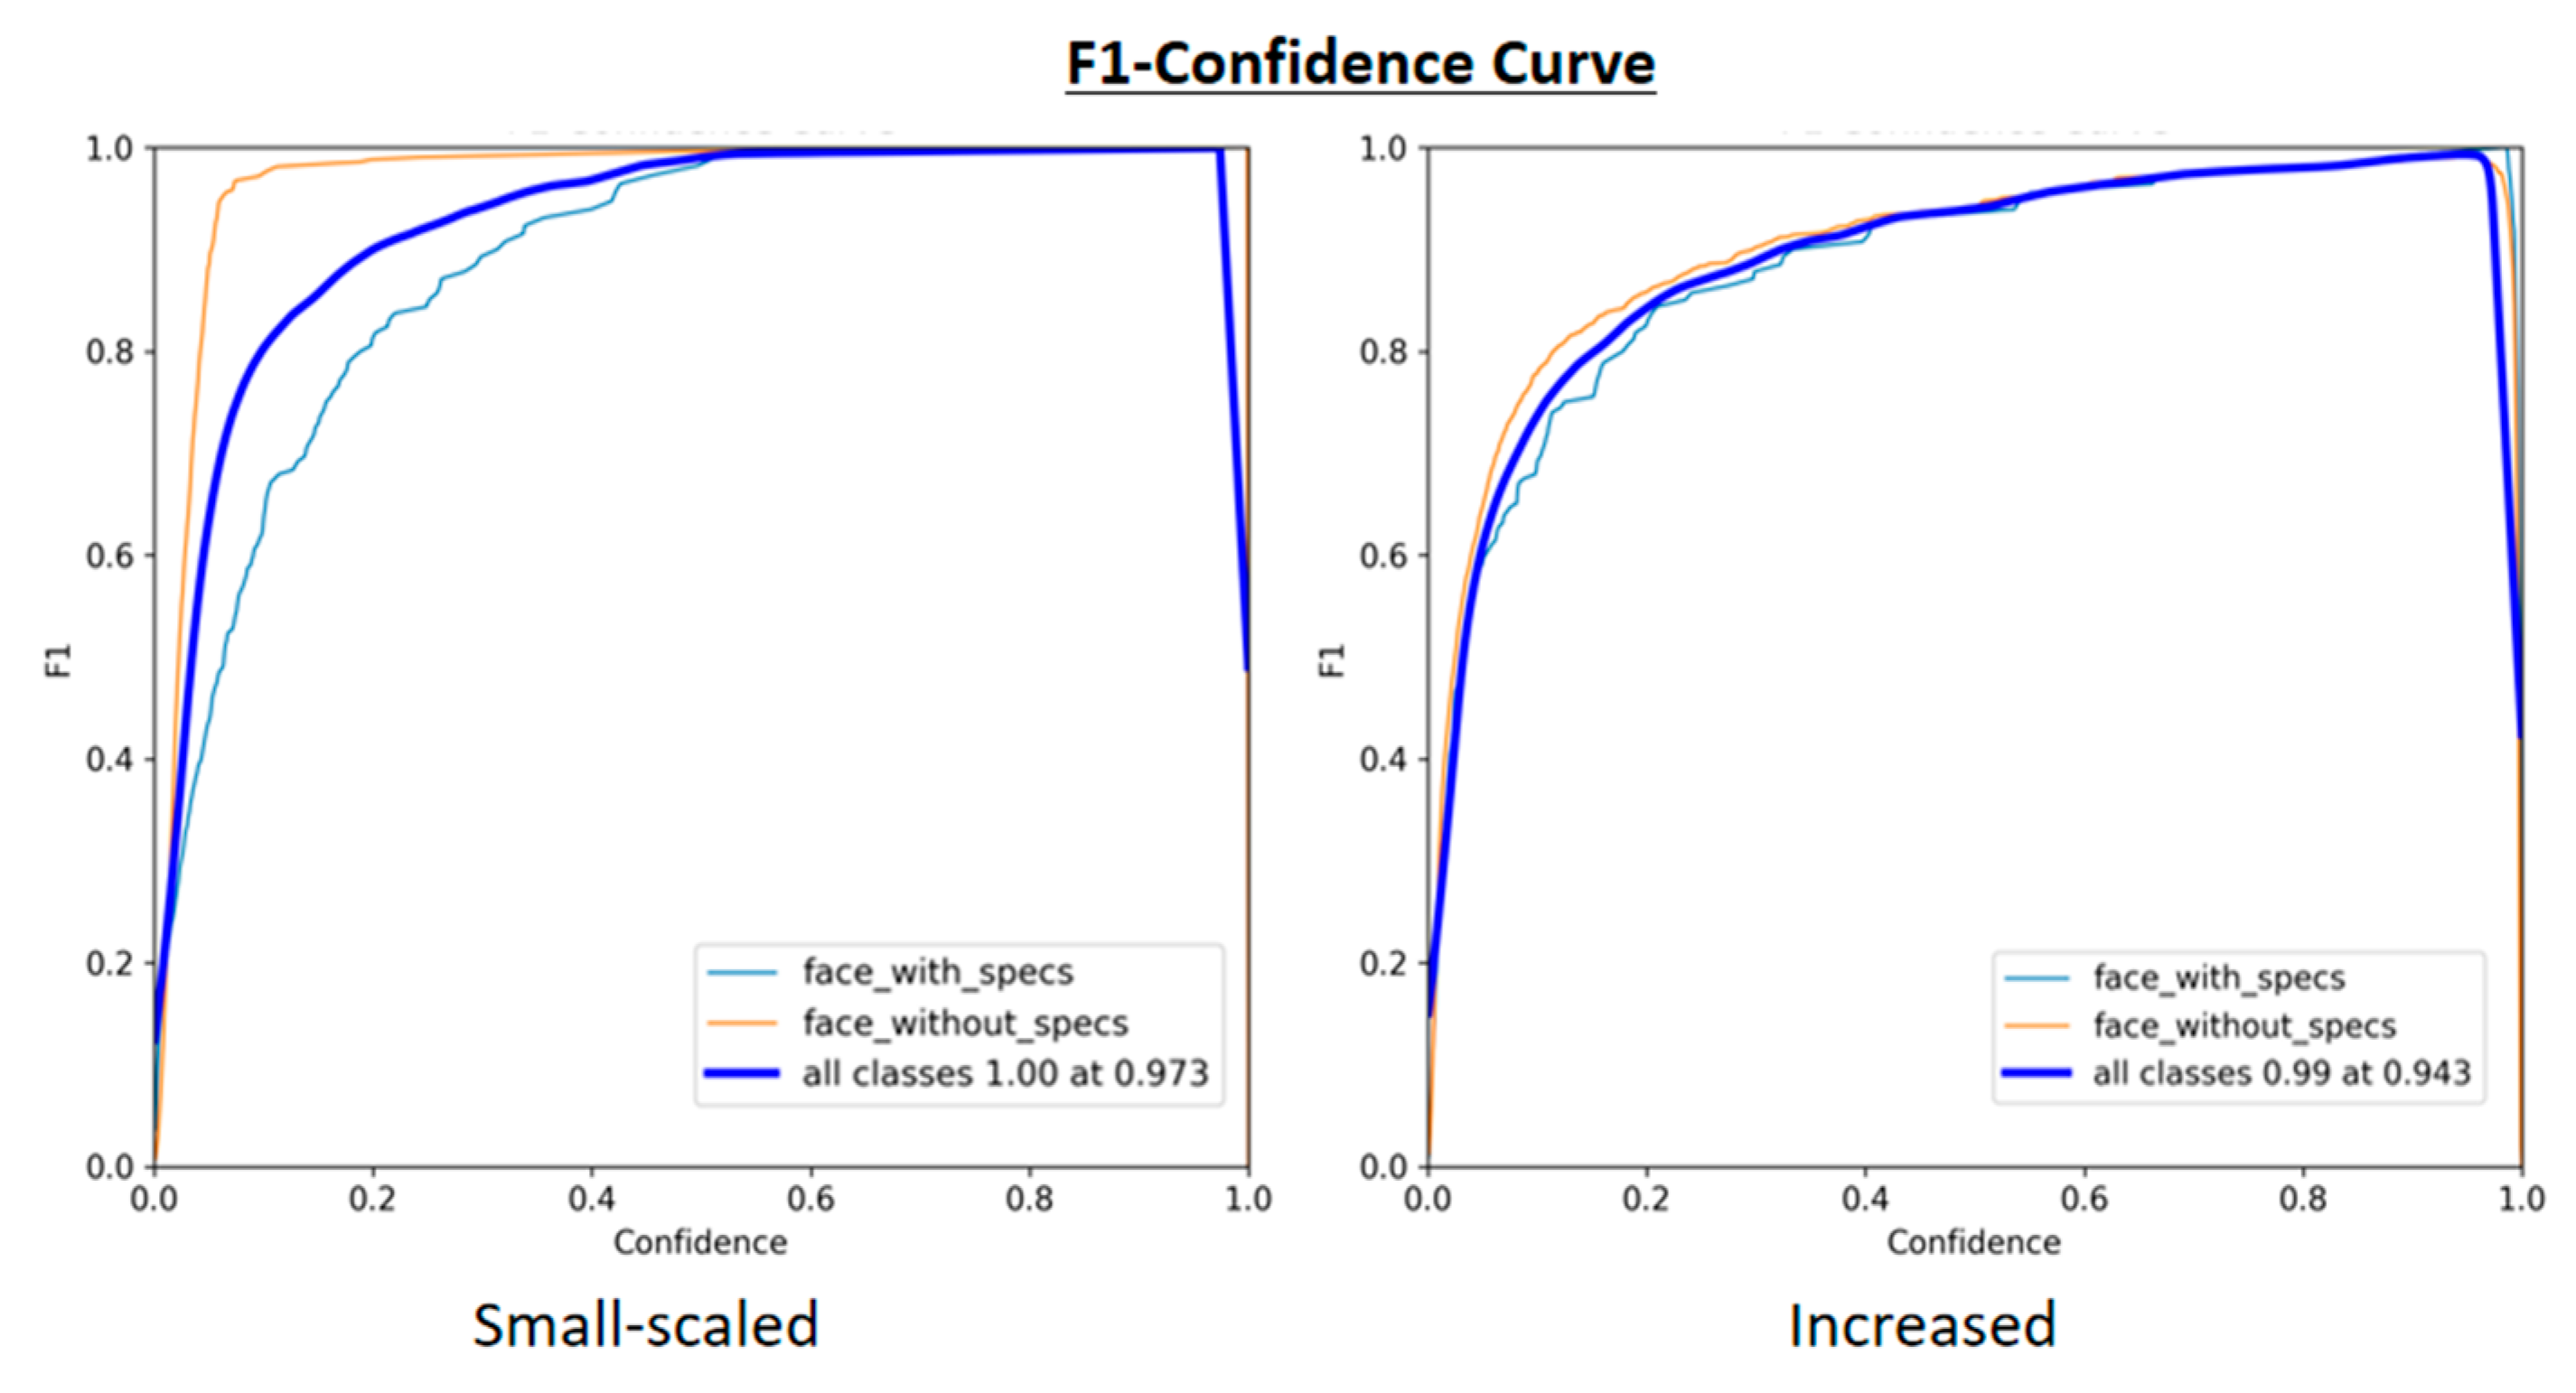
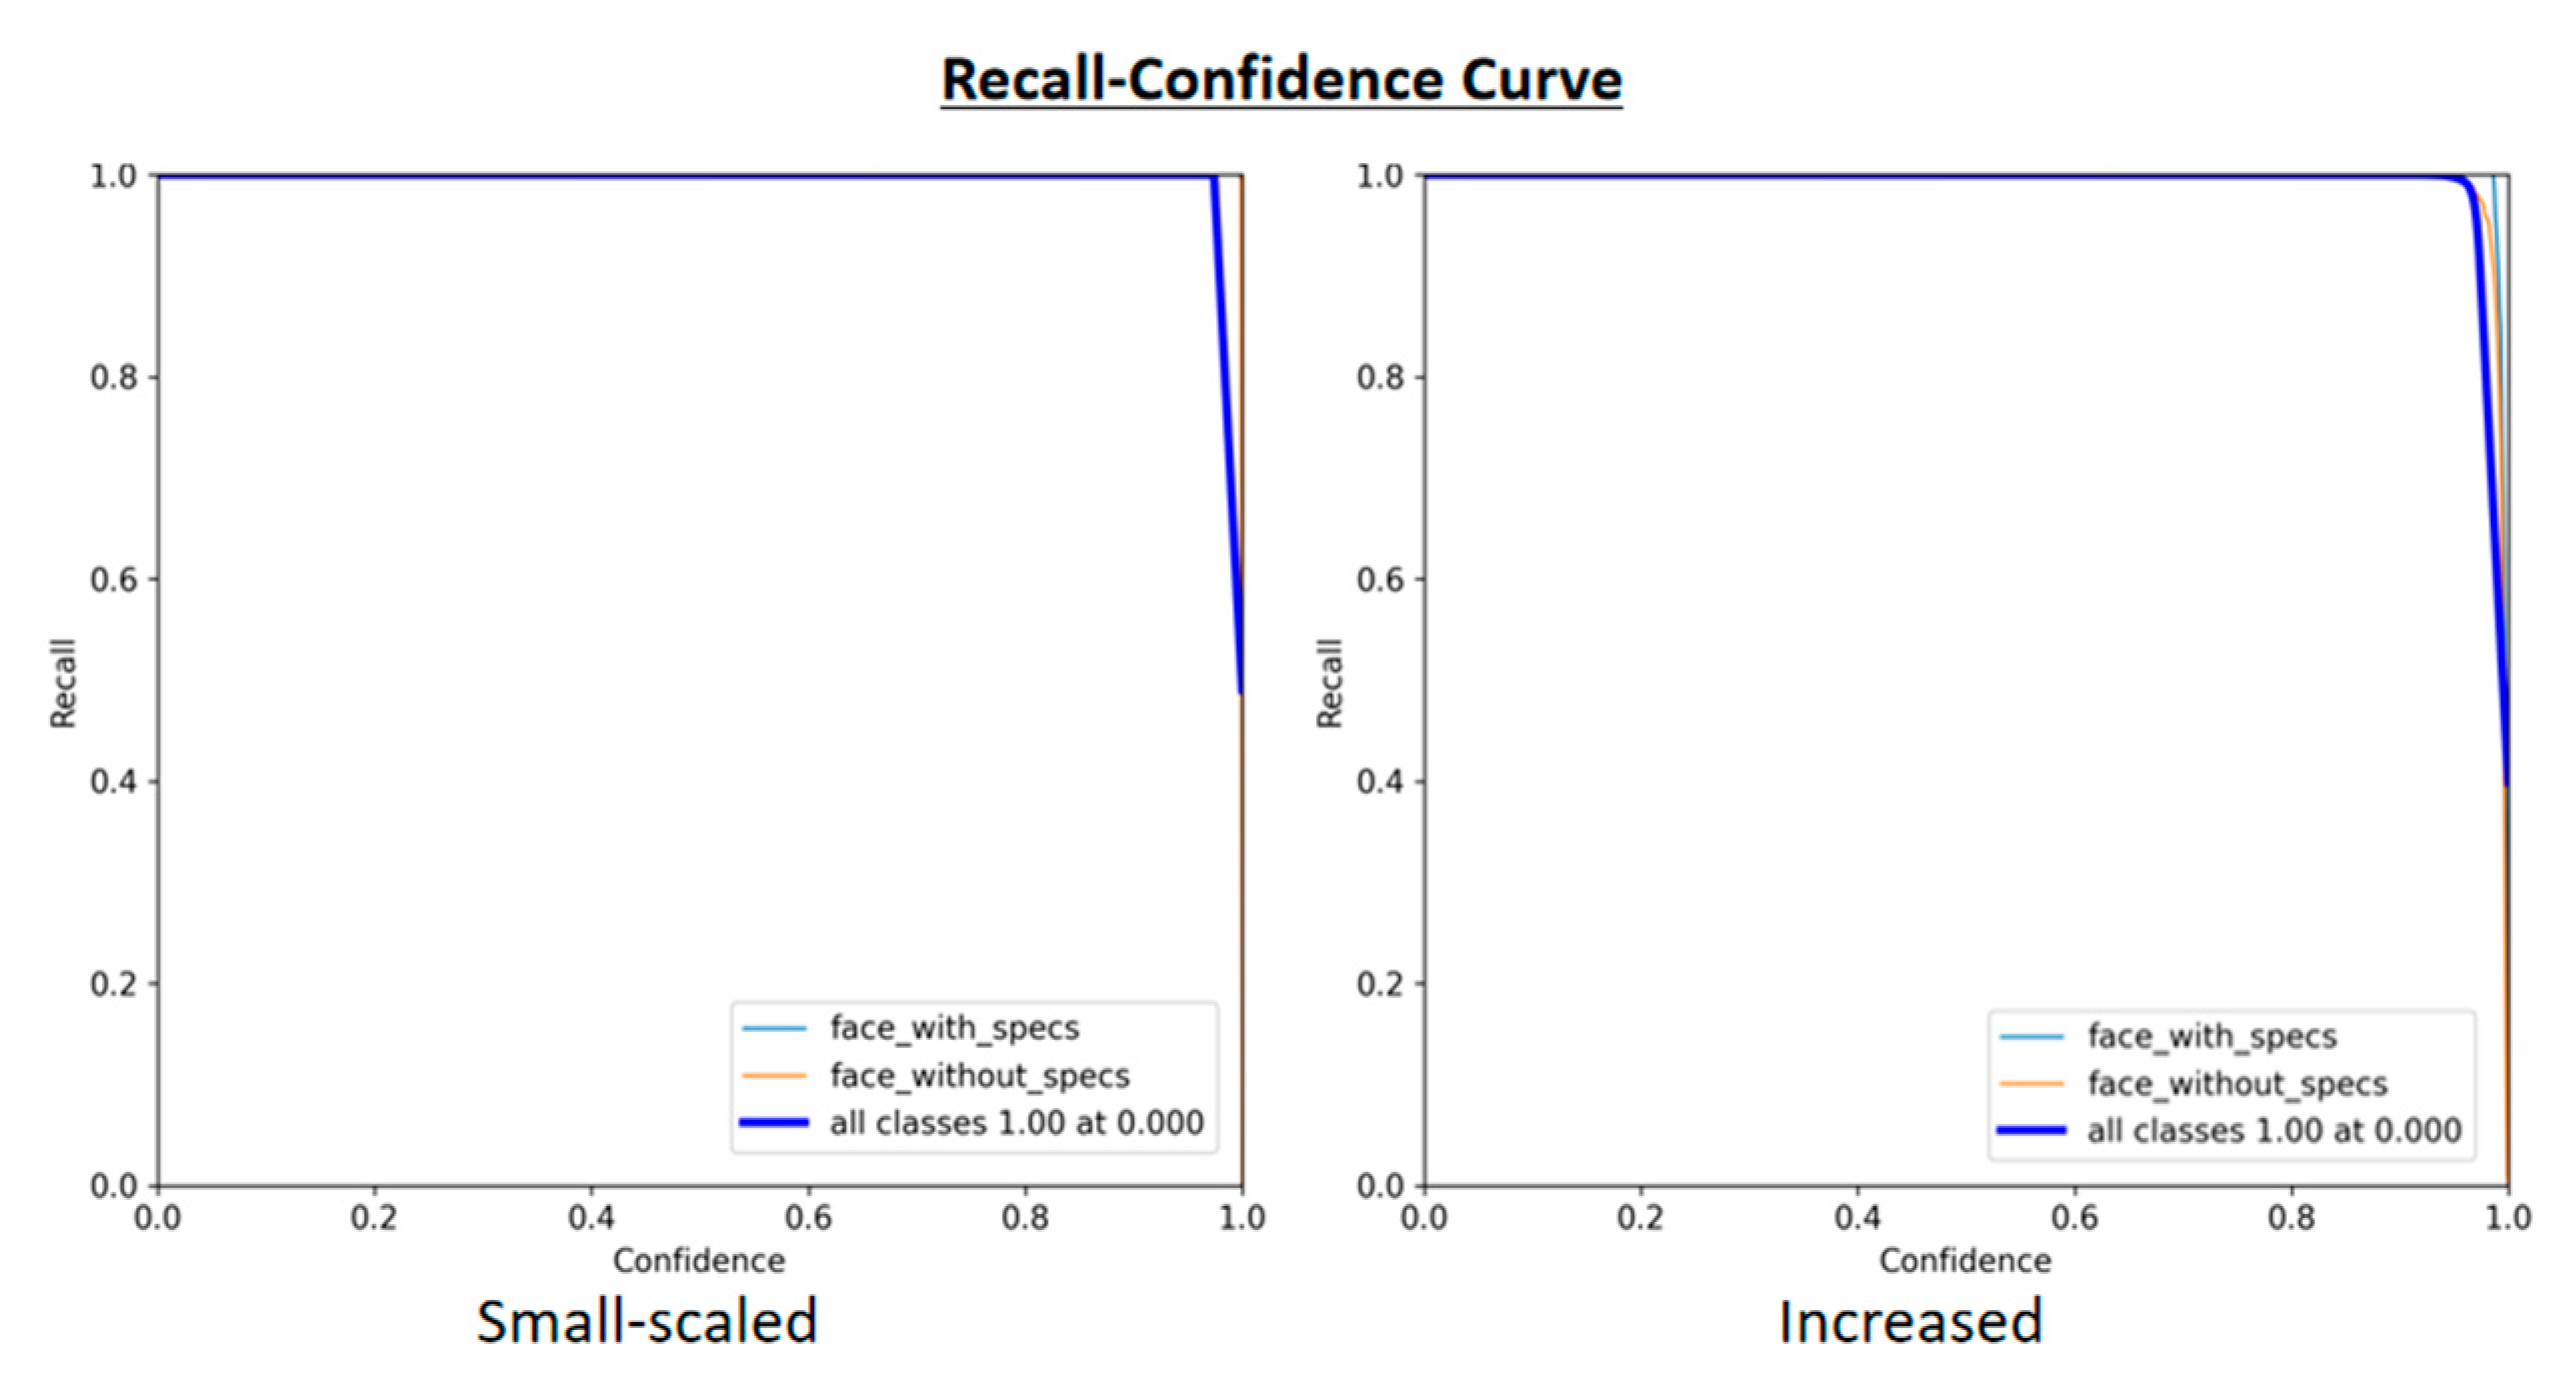
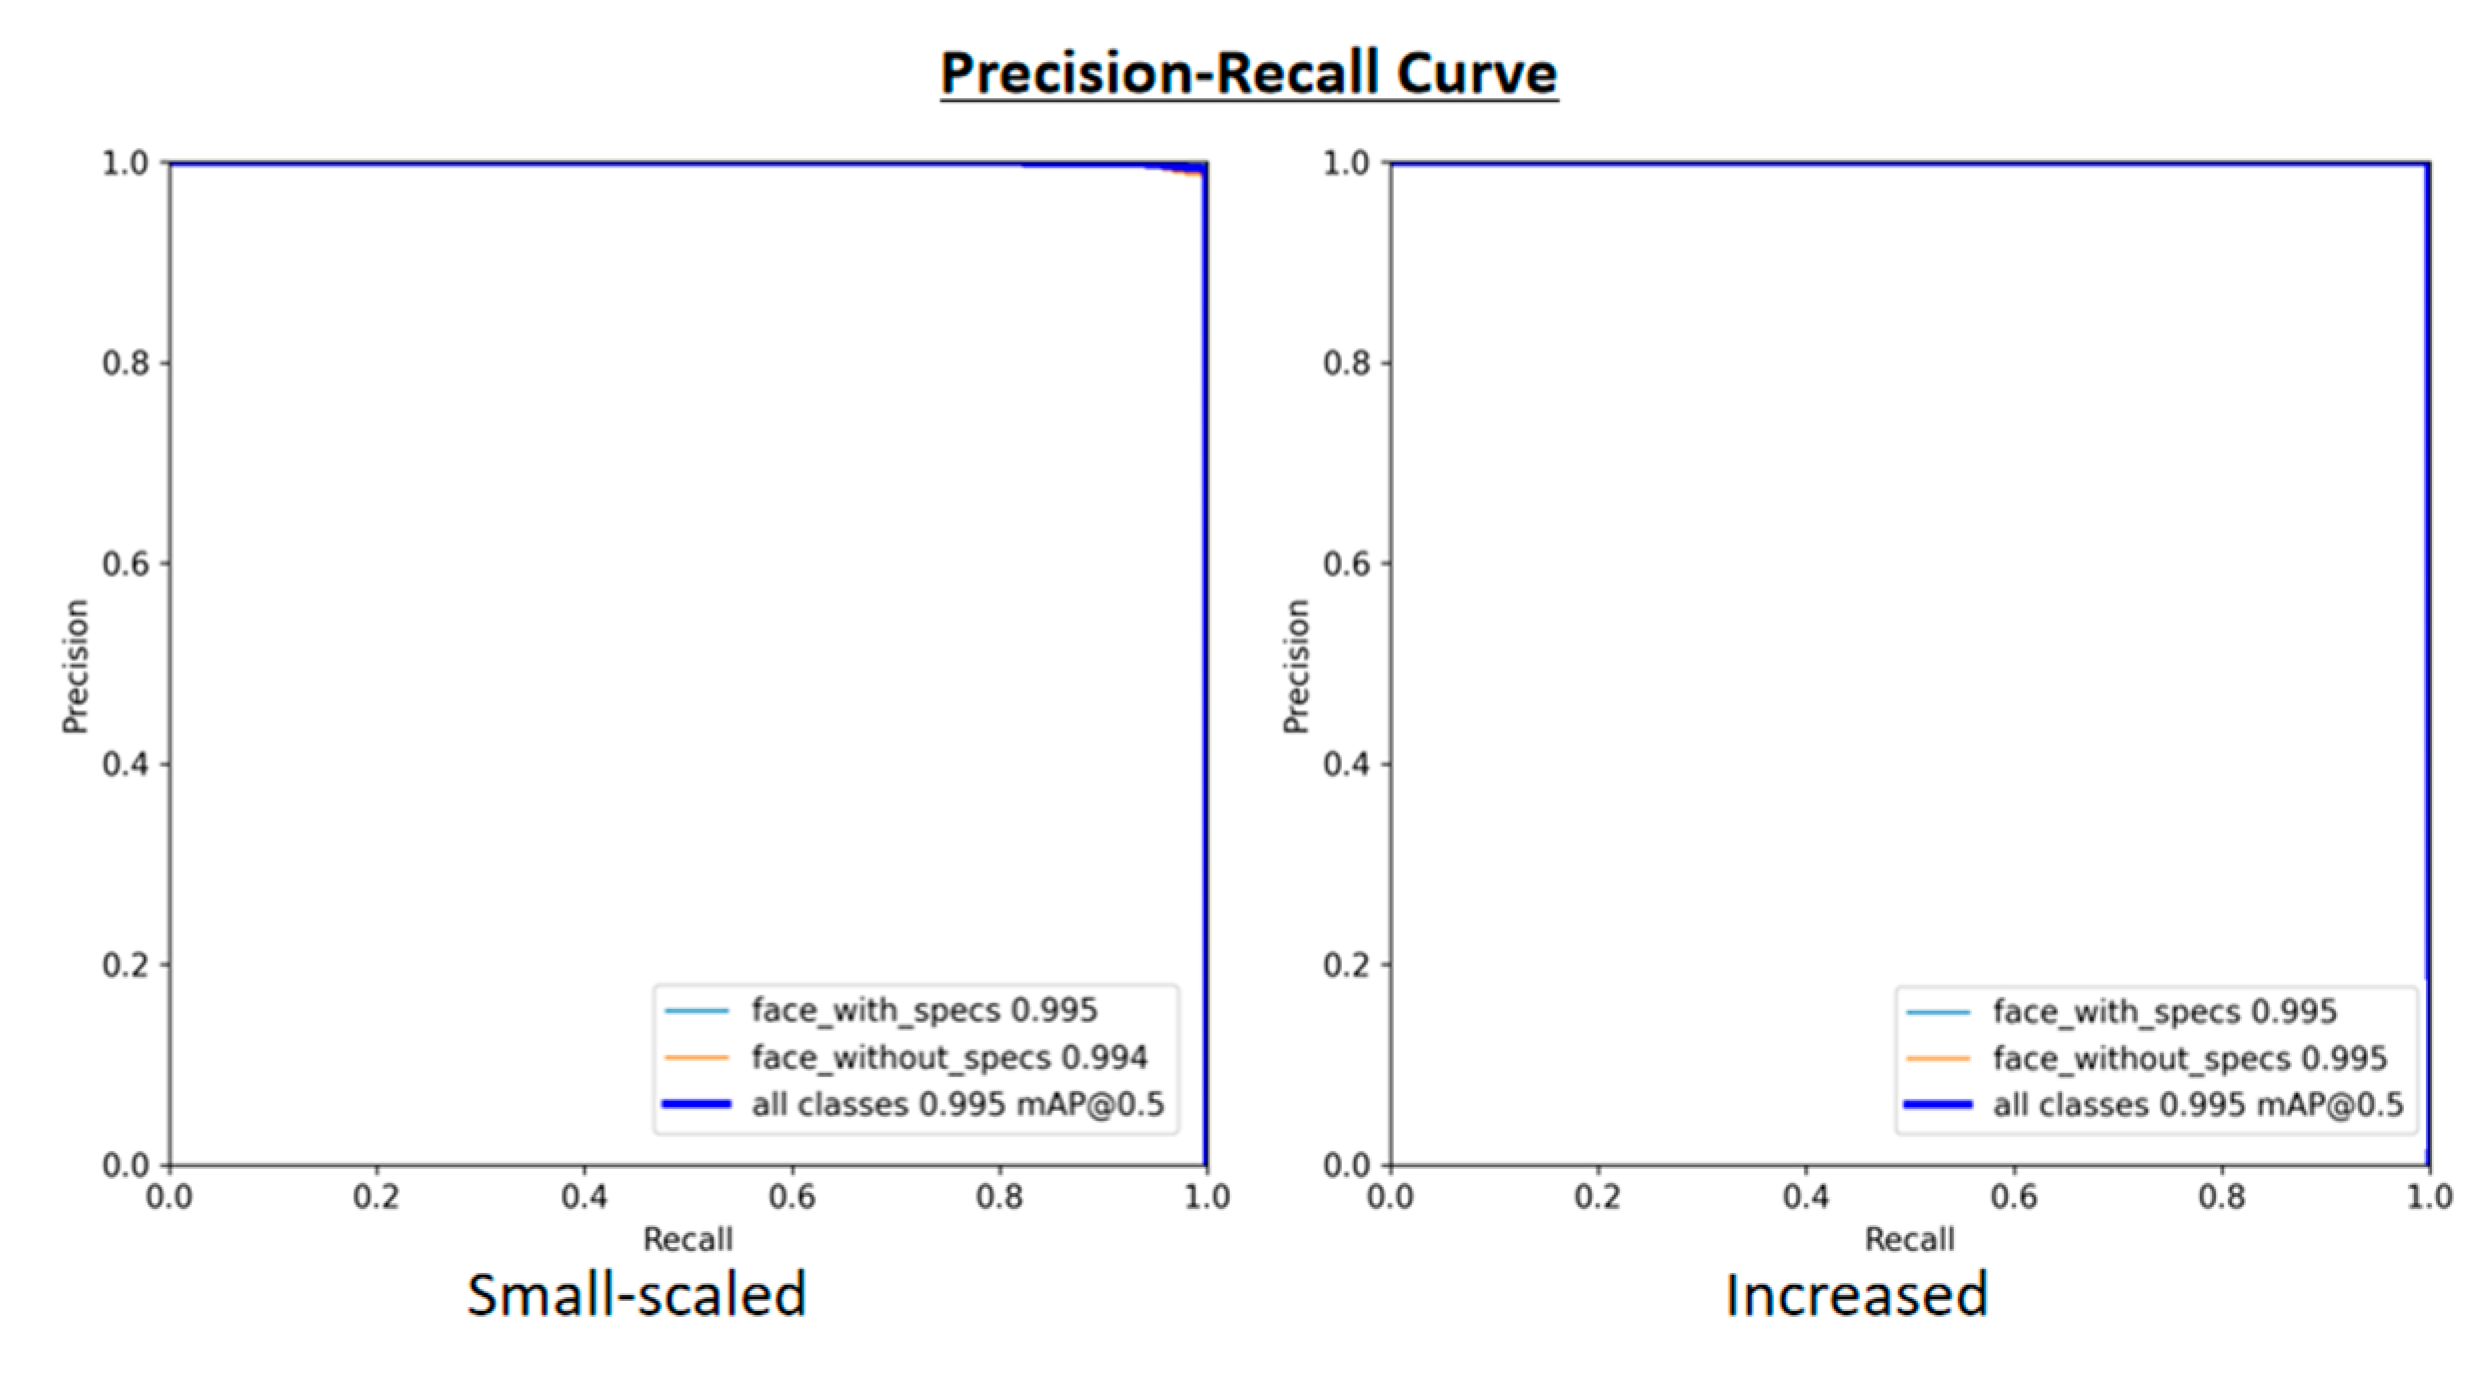
The performance of the YOLO model using the self-collected images (small scale, after this referred to as D1) was compared to the enhanced datasets where the training data included augmented data and selected images from the Tufts Face dataset (hereafter referred to as D2). Using D2, the model accuracy increased to 99.11%, which reflects the influence of the size of the dataset on the overall performance of the YOLO model. Using D1, the model was able to determine positive samples with high precision (1.00), as shown in Figure 4. Nonetheless, the precision might come at a trade-off with recall, as seen in the recall–confidence curve, showing a decrease with higher confidence thresholds. In contrast, the higher number of images in D2 maintains a high F1 score without sacrificing the overall performance. Refer Figure 5.
In Figure 6, the graphs show a lower recall at a higher confidence level, which suggests that the model attempted to minimize incorrect positive predictions, i.e., a person who is sober but labeled as drunk. A lower recall indicates that the model may have failed or missed to label a person who is actually drunk as “drunk”. Moreover, in classifying alcohol intoxication, where both false positives and false negatives have significant implications, it is important to consider a balance between precision and recall as shown in Figure 7. Using D1, the model achieved a perfect F1 score and precision at high confidence levels. This suggests that, even with a limited dataset, the model can perform well. Nevertheless, to avoid false positives in classifying alcohol intoxication from thermal images, D2, which consists of a higher number of images, is preferred compared to D1.
The pre-trained YOLO model was also validated using a cross-dataset technique to avoid overfitting and promote the generalization of the model to new data or scenarios. The model can identify non-facial features like spectacles. However, the model has constraints where other facial features, such as beards and mustaches, were not considered in this study. Hence, this study cannot conclude that the model will demonstrate the same performance with these additional facial features. Table 2 presents the performance of machine learning models, including KNN, SVM, LR, RF, and MLP architectures, to classify thermal images and detect alcohol intoxication.
In terms of accuracy, SVM achieved 75%, which is the lowest compared to other models. Besides that, MLP has the lowest number of false positives, which is indicated by its high precision values, i.e., 86% sober and 93% drunk. True positive cases indicate a balanced sensitivity of MLP in drunk detection. Comparatively, the KNN model demonstrates competitive performance with precision, recall, and F1-score values ranging from 0.80 to 0.93. Compared to other models, MLP achieved the highest accuracy, i.e., 90%. This suggests that the MLP model excels in distinguishing between sober and drunk states, outperforming the other models in terms of overall correctness. When MLP predicts that a person is sober or drunk, the prediction is reliable. Figure 8 illustrates the training accuracy and loss across epochs.
Figure 9 shows the successful outcome of the drunk detection process applied to a testing image for both sober and drunk conditions. Facial landmark identification is facilitated by the FaceMesh model from the MediaPipe library. The localization of facial landmarks based on 22 grid points is sufficient for the MLP to classify the thermal image accurately.

5. Conclusions

This study considers the challenge of identifying drunk drivers using conventional methods. The aim is to investigate and propose a machine learning approach that can accurately detect alcohol consumption by analyzing thermal patterns on facial features. The well-known Tufts Face dataset was used to train machine learning models, including SVM, MLP, RF, LR, and KNN. In addition, thermal facial images were also self-collected in a controlled environment to further train, test, and validate the models. The performance of the models was compared in terms of accuracy, precision, recall, and F1 score. Based on experimental results, MLP outperforms the other models with 90% accuracy, while SVM exhibits the lowest accuracy of 75%. Compared to manual plotting, the FaceMesh from the MediaPipe library is more reliable for capturing the details of facial features from grayscale thermal images. Data augmentation was performed to increase the number of images. The outcome of this study demonstrates the potential of ML models to detect signs of alcohol intoxication from thermal images, which could be integrated into advanced driver assistance systems.
However, the self-collected dataset may not represent thermal images derived from non-tropical climates in countries such as the UK, the US, Korea, and others. This may cause a deficiency related to the impact of temperature on various facial features. A broader range of images consisting of diverse backgrounds, cultures, environmental temperatures, etc., may produce different results. Furthermore, the thermal images depend on the equipment used to capture the images. In this study, the potential of the models is demonstrated under controlled laboratory conditions with a homogeneous sample group, allowing consistency and control to evaluate physiological responses to alcohol. Nonetheless, even though this approach does not fully capture a realistic moving-vehicle environment where there may be various influential variables that affect the accuracy of the models, it sets a foundation for future validation. We plan to enhance this foundational study to validate and test the models under different conditions like sunlight, facial obstructions, etc., and improve their generalizability and applicability in the real world.

Author Contributions

Conceptualization, S.F.A.R. and S.Y.; methodology, S.Y., C.-H.C., and R.S.; software, C.-H.C. and R.S.; resources, S.F.A.R. and S.Y.; writing—original draft preparation, C.-H.C. and S.F.A.R.; writing—review and editing, S.F.A.R. and S.Y.; visualization, R.S.; supervision, S.F.A.R. All authors have read and agreed to the published version of the manuscript.

Funding

The APC was funded by Multimedia University.

Institutional Review Board Statement

Ethical review and approval were waived for this study due to the data is sourced from previous research.

Informed Consent Statement

Informed consent was obtained from all subjects involved in the study.

Data Availability Statement

The original contributions presented in this study are included in the article. Further inquiries can be directed to the corresponding author.

Acknowledgments

During the preparation of this manuscript, the authors used Quillbot (free version) for the purposes of language refinement and paraphrasing. The authors have reviewed and edited the output and take full responsibility for the content of this publication.

Conflicts of Interest

The authors declare no conflicts of interest.

Abbreviations

The following abbreviations are used in this manuscript:
CNNConvolutional Neural Network
RFRandom Forest
SVMSupport Vector Machine
MLPMulti-Layer Perceptron
LRLogistic Regression
KNNK-Nearest Neighbors
ReLURectified Linear Unit
YOLOYou Only Look Once
NETDNoise Equivalent Temperature Difference
SURFSpeeded Up Robust Features
NSCTNon-Sub-sampled Contourlet Transform
ROIRegion of Interest
O-SNNOptimizable Shallow Neural Network
PUCV-DTFPontificia Universidad Católica de Valparaíso Drunk Thermal Face database
WLDWeber Local Descriptor
LBPLocal Binary Pattern

References

  1. Sanghvi, K.A. Drunk driving detection. Comput. Sci. Inf. Technol. 2018, 6, 24–30. [Google Scholar] [CrossRef]
  2. Omar, R. The Usage of Artificial Intelligence Algorithms in Preventing Drunk Driving. J. Stud. Res. 2023, 12, 1–5. [Google Scholar] [CrossRef]
  3. Kumar, A.; Kumar, A.; Singh, M.; Kumar, P.; Bijalwan, A. An Optimized Approach Using Transfer Learning to Detect Drunk Driving. Sci. Program. 2022, 2022, 8775607. [Google Scholar] [CrossRef]
  4. Jeoung, J.; Jung, S.; Hong, T.; Lee, M.; Koo, C. Thermal comfort prediction based on automated extraction of skin temperature of face component on thermal image. Energy Build. 2023, 298, 113495. [Google Scholar] [CrossRef]
  5. Farooq, H.; Altaf, A.; Iqbal, F.; Galán, J.C.; Aray, D.G.; Ashraf, I. DrunkChain: Blockchain-Based IoT System for Preventing Drunk Driving-Related Traffic Accidents. Sensors 2023, 23, 5388. [Google Scholar] [CrossRef] [PubMed]
  6. National Highway Traffic Safety Administration. Advanced Impaired Driving Prevention Technology [Internet]. 2023. Available online: https://www.regulations.gov (accessed on 18 March 2025).
  7. Razak, S.F.A.; Yogarayan, S.; Ullah, A. Preventing Impaired Driving Using IoT on Steering Wheels Approach. HighTech Innov. J. 2024, 5, 400–409. [Google Scholar] [CrossRef]
  8. Chen, Y.; Xue, M.; Zhang, J.; Ou, R.; Zhang, Q.; Kuang, P. DetectDUI: An in-car detection system for drink driving and BACs. IEEE/ACM Trans. Netw. 2021, 30, 896–910. [Google Scholar] [CrossRef]
  9. Abu Al-Haija, Q.; Krichen, M. A Lightweight In-Vehicle Alcohol Detection Using Smart Sensing and Supervised Learning. Computers 2022, 11, 121. [Google Scholar] [CrossRef]
  10. Shukla, P.; Srivastava, U.; Singh, S.; Tripathi, R.; Sharma, R.R. Automatic Engine Locking System Through Alcohol Detection. Int. J. Eng. Res. Technol. (IJERT) 2020, 9, 634–637. [Google Scholar]
  11. Rakshith, K.B.; Meghana, K.; Pranav, R.; Gagana, N.A.; Pavithra, G.S. Alcohol Detection System for the Safety of Automobile Users. Int. Res. J. Eng. Technol. 2020, 7, 3583–3586. [Google Scholar]
  12. Liu, J.; Luo, Y.; Ge, L.; Zeng, W.; Rao, Z.; Xiao, X. An Intelligent Online Drunk Driving Detection System Based on Multi-Sensor Fusion Technology. Sensors 2022, 22, 8460. [Google Scholar] [CrossRef] [PubMed]
  13. Wang, F.; Bai, D.; Liu, Z.; Yao, Z.; Weng, X.; Xu, C.; Fan, K.; Zhao, Z.; Chang, Z. A Two-Step E-Nose System for Vehicle Drunk Driving Rapid Detection. Appl. Sci. 2023, 13, 3478. [Google Scholar] [CrossRef]
  14. Seong, L.J.; Yogarayan, S.; Razak, S.F.A.; Mogan, J.N. Drunk Detection Using Thermal-Based Face Images. In Proceedings of the 2024 International Conference on Intelligent Cybernetics Technology & Applications (ICICyTA), Bali, Indonesia, 17–19 December 2024; pp. 1003–1007. [Google Scholar]
  15. Zhao, X.; Zhu, H.; Qian, X.; Ge, C. Design of intelligent drunk driving detection system based on Internet of Things. J. Internet Things 2019, 1, 55. [Google Scholar] [CrossRef]
  16. Hermosilla, G.; Verdugo, J.L.; Farias, G.; Vera, E.; Pizarro, F.; Machuca, M. Face recognition and drunk classification using infrared face images. J. Sens. 2018, 2018, 1–8. [Google Scholar] [CrossRef]
  17. Menon, S.; Swathi, J.; Anit, S.K.; Nair, A.P.; Sarath, S. Driver face recognition and sober drunk classification using thermal images. In Proceedings of the 2019 International Conference on Communication and Signal Processing (ICCSP), Chennai, India, 4–6 April 2019; pp. 400–404. [Google Scholar]
  18. Iamudomchai, P.; Seelaso, P.; Pattanasak, S.; Piyawattanametha, W. Deep learning technology for drunks detection with infrared camera. In Proceedings of the 2020 6th International Conference on Engineering, Applied Sciences and Technology (ICEAST), Chiang Mai, Thailand, 1–4 July 2020; pp. 1–4. [Google Scholar]
  19. Soltuz, A.I.; Neagoe, V.E. Facial thermal image analysis with deep convolutional neural network architectures for subject dependent drunkenness diagnosis. In Proceedings of the 2021 13th International Conference on Electronics, Computers and Artificial Intelligence (ECAI), Pitesti, Romania, 1–3 July 2021; pp. 1–4. [Google Scholar]
  20. Bhuyan, M.K.; Bora, K.; Koukiou, G. Detection of Intoxicated Person using Thermal Infrared Images. In Proceedings of the 2019 IEEE 6th Asian Conference on Defence Technology (ACDT), Bali, Indonesia, 13–15 November 2019; pp. 59–64. [Google Scholar]
  21. Bhuyan, M.K.; Dhawle, S.; Sasmal, P.; Koukiou, G. Intoxicated person identification using thermal infrared images and Gait. In Proceedings of the 2018 International Conference on Wireless Communications, Signal Processing and Networking (WiSPNET), Chennai, India, 22–24 March 2018; pp. 1–3. [Google Scholar]
  22. Koukiou, G. Thermal Biometric Features for Drunk Person Identification Using Multi-Frame Imagery. Electronics 2022, 11, 3924. [Google Scholar] [CrossRef]
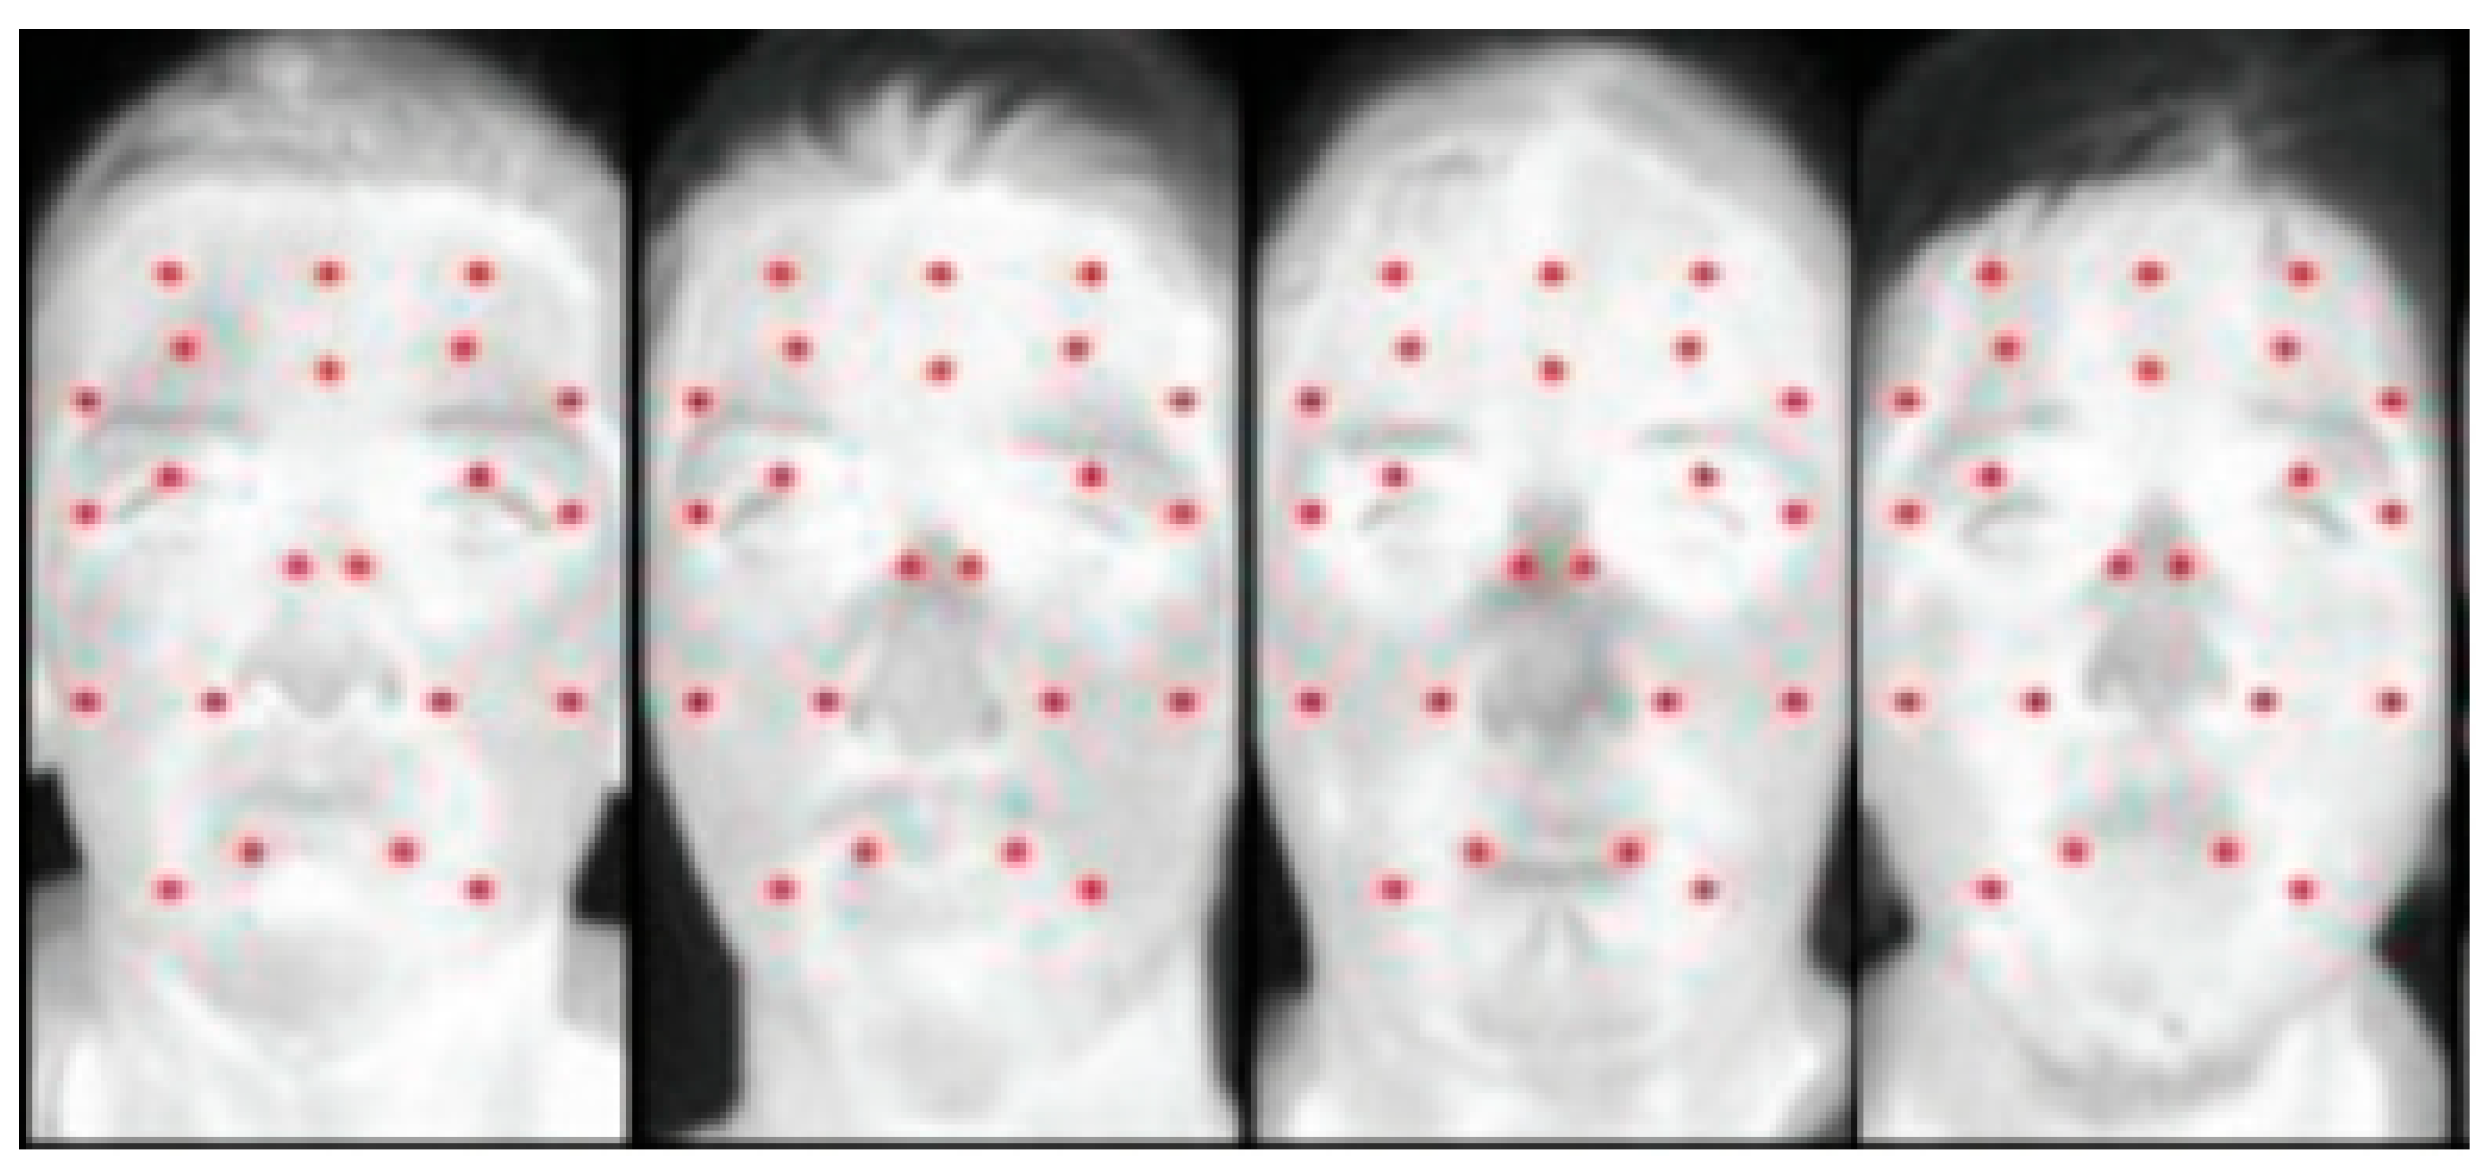
Figure 1. Regions with 22 grid points on self-collected grayscale thermal images.
Information 16 00413 g001
Figure 2. Comparison between manual and FaceMesh plotting, which shows FaceMesh plotting as more reliable for locating facial landmarks from a grayscale image.
Information 16 00413 g002
Figure 3. MLP depth and complexity.
Information 16 00413 g003
Figure 4. F1–confidence curve in YOLO model.
Information 16 00413 g004
Figure 5. Precision–confidence curve in YOLO model.
Information 16 00413 g005
Figure 6. Recall–confidence curve in YOLO model.
Information 16 00413 g006
Figure 7. Precision–recall curve in YOLO model.
Information 16 00413 g007
Figure 8. MLP training accuracy and loss.
Information 16 00413 g008
Figure 9. Results of drunk detection.
Information 16 00413 g009
Table 1. Summary of previous work on drunk detection system.
Ref.CameraImage Resolution (Pixels)DatasetFeature
Extraction
ClassificationAccuracy
Menon et al. [17]Thermo Vision Micron/A10 (FLIR Systems, Inc., Wilsonville, OR, USA)128 × 160 self-collectedFisher’s linear discriminant (FLD) for dimensionality reductionGaussian Mixture Model (GMM)87%
Hermosilla et al. [16]FLIR TAU 2 (FLIR Systems, Inc., Wilsonville, OR, USA)81 × 150 PUCV-DTFFisher’s linear discriminant (FLD) for dimensionality reductionGaussian Mixture Model (GMM)86.96%
Iamudomchai et al. [18]FLIR ONE (FLIR Systems, Inc. Wilsonville, OR, USA)160 × 120 Thai nationality (self-collected)Not mentionedCNN4 levels (normal, 1 glass, 2 glasses, and 3 glasses): 85.10%
Soltuz and Neagoe [19]Thermo Vision Micron/A10 128 × 160 Georgia Koukiou and Vassilis Anastassopoulos (University of Patras, Polytechnic of Crete)Not mentionedCNNDCNN
First: 93.17%
Second: 95.17%
GoogLeNet: 98.54%
Bhuyan et al. [20]Thermo Vision Micron/A10128 × 160 self-collectedNot mentionedSVMEye: 93%
Face: 94.1%
Hand: 95.1%
Ear: 100%
Bhuyan et al. [21]Thermo Vision Micron/A10128 × 160 self-collectedSpeeded up robust features (SURFs)RF and
SVM
Face: 89.23%
Gait and Ear: 100%
Koukiou [22]Thermo Vision Micron/A10128 × 160 Georgia Koukiou and Vassilis Anastassopoulos (University of Patras, Polytechnic of Crete)Morphological feature extractionSVM86%
Table 2. Summary of models’ classification results.
ModelClassPrecisionRecallF1 ScoreAccuracy
MLPSober86%91%89%90%
Drunk93%89%91%
KNNSober90%80%85%88%
Drunk86%93%89%
SVMSober71%71%71%75%
Drunk78%78%78%
RFSober88%86%87%89%
Drunk89%91%90%
LRSober73%77%75%78%
Drunk81%78%80%
Disclaimer/Publisher’s Note: The statements, opinions and data contained in all publications are solely those of the individual author(s) and contributor(s) and not of MDPI and/or the editor(s). MDPI and/or the editor(s) disclaim responsibility for any injury to people or property resulting from any ideas, methods, instructions or products referred to in the content.