Article

Internet of Things-Based Anomaly Detection Hybrid Framework Simulation Integration of Deep Learning and Blockchain

1
Department of Computer Science, Faculty of Computing & Information Technology, King Abdul-Aziz University, Jeddah 21442, Saudi Arabia
2
Department of Computer Science, College of Computer Science & Information System, Najran University, Najran P.O. Box 1988, Saudi Arabia
3
Department of Information Technology, Faculty of Computer and Information Systems, Islamic University of Madinah, Al-Madinah 42351, Saudi Arabia
4
Dr. Hussein ElSayyed Research Center, Department of Graduate Studies & Scientific Research, University of Prince Mugrin, Madinah 42241, Saudi Arabia
*
Authors to whom correspondence should be addressed.
Information 2025, 16(5), 406; https://doi.org/10.3390/info16050406
Submission received: 16 January 2025 / Revised: 4 May 2025 / Accepted: 9 May 2025 / Published: 15 May 2025
(This article belongs to the Special Issue Machine Learning for the Blockchain)

Abstract

:
IoT environments have introduced diverse logistic support services into our lives and communities, in areas such as education, medicine, transportation, and agriculture. However, with new technologies and services, the issue of privacy and data security has become more urgent. Moreover, the rapid changes in IoT and the capabilities of attacks have highlighted the need for an adaptive and reliable framework. In this study, we applied the proposed simulation to the proposed hybrid framework, making use of deep learning to continue monitoring IoT data; we also used the blockchain association in the framework to log, tackle, manage, and document all of the IoT sensor’s data points. Five sensors were run in a SimPy simulation environment to check and examine our framework’s capability in a real-time IoT environment; deep learning (ANN) and the blockchain technique were integrated to enhance the efficiency of detecting certain attacks (benign, part of a horizontal port scan, attack, C&C, Okiru, DDoS, and file download) and to continue logging all of the IoT sensor data, respectively. The comparison of different machine learning (ML) models showed that the DL outperformed all of them. Interestingly, the evaluation results showed a mature and moderate level of accuracy and precision and reached 97%. Moreover, the proposed framework confirmed superior performance under varied conditions like diverse attack types and network sizes comparing to other approaches. It can improve its performance over time and can detect anomalies in real-time IoT environments.

1. Introduction

In recent years, the use of the Internet of Things has become increasingly popular among most governments and countries that wish to transfer their city systems to a smart city system through various IoT services and applications, such as health, transportation, agriculture, energy power, and education. These services and applications rely on the data which are provided via IoT devices and sensors to create smart services that are compatible with smart life [1].
Moreover, collecting data via the IoT relies on Wireless Sensor Networks (WSNs) and radio frequency identification (RFID), which creates a unique identification for each object so that these objects can interact with each other; this makes them smart objects in communication and establishes them within smart services. Some examples of WSNs are speed sensors, temperature sensors, humidity sensors, underwater sensors, pressure sensors, pollution sensors, and others [2].
Due to the generation of significant big data by the IoT, we need to establish a secure path for data traffic from the perception layer to cloud computing, passing by the fog computing layer and the aggregated fog layer, to manage and log all the activities between these IoT perception appliances and cloud computing [3]; this is necessary for more rigorous management of the countless IoT activities and to ensure the safe passage of data traffic from the perception layer to the fog layer up to the cloud computing layer, without the occurrence of arbitrary malicious activities throughout its itinerary from the perception layer to the cloud computing layer [4].
In addition, it is also necessary to improve the sophistication of IoT real-time performance and to enhance the security and privacy of the IoT environment system [5].
Due to more and more novel techniques being used and discovered by IoT attackers against IoT devices using smart tools, it is necessary to establish an IoT environment system and to build a rigorous framework to ensure a secure and safe environment; this is particularly the case when the IoT appliances have low computation, as this makes them subject to easy attack due to their lack of high manipulation and processing units [6,7].
Contrary to what most people believe, security is not the same as privacy [8]. Security focuses on data confidentiality and data integrity to avoid arbitrary modification and to provide service availability, whereas privacy focuses on preventing rather than identifying user identification and allows specific profiling or tracking of a user’s locations over time [9].
Thus, privacy breaches are considered the greatest risk due to the collection of the personal data of users for use against them, whereby any malicious service providers can use these data to generate vulnerabilities, such as the recognition and eliciting of personal information, places, beliefs, and other sensitive information that most users prefer not to be revealed. These vulnerabilities increase the risk of the IoT environment system, and they create certain personal threats, whereby users’ personal lives can also be attacked [10].
The detection of these IoT attacks is a vital and important topic, as not detecting these IoT attacks leads to the leak of personal data or creates a dangerous risk for IoT users; thus, it is necessary to simulate these attacks and create a simulator to validate, test, and check these data, and to determine whether they are related to security data or privacy data. This is what we strive to perform and simulate in this study [11].
Therefore, our contributions are as follows:
  • Proposing a framework to adaptive protection of IoT environments based on deep leaning and blockchain.
  • Building and simulating data collection from IoT sensors;
  • Logging sensed data and model results using blockchain for secure and immutable records within our hybrid framework.
  • Applying a deep learning model to detect anomalies in real time.
  • Evaluating system robustness in handling sensor malfunctions.
This Section introduced the scope of the study, the IoT simulation, and the goals of anomaly detection using deep learning and blockchain together. It briefly mentions the motivation for the work and its applications in real-world IoT systems. Section 2 discusses a selection of related studies and then compares them. Section 3 introduces our hybrid framework and its mechanism with its four layers of architecture as well as the set-up of the experimental simulation. Section 4 shows the evaluation and validation metrics to prove the effectiveness of our hybrid framework mechanism against IoT attacks.

2. Related Studies

This section reviews some previous studies that emphasized the importance of integrating the three components (IoT, deep learning, and blockchain) to enhance the performance of various applications and improve security and privacy levels. The section also presents a comparison table to highlight the differences in the usage of combining blockchain and deep learning.
The authors of [12] surveyed various machine learning techniques used for IoT security, focusing on anomaly detection models and their application in IoT-based systems, while the authors of [13] explored how blockchain can be integrated with IoT systems to enhance security and privacy, particularly in smart home settings.
The authors of [14] provided an in-depth review of deep learning models applied for anomaly detection, which is directly relevant to this project. The authors of [15] proposed a framework for securing IoT data using blockchain, providing a highly relevant technical background for this project’s blockchain component.
The authors of [16] used a lightweight blockchain-based message authentication system and utilized k-means clustering and isolation forest machine learning to identify anomalies in the Industrial Internet of Things (IIoT). Moreover, they added a bitcoin transaction network (BTN) with isolation forest to achieve and enhance accuracy.
The authors of [17] used machine learning and blockchain to enhance and protect security and privacy within IoT devices. They used random forest to detect simulated IoT attacks, and they achieved a significant accuracy level with blockchain technology.
Additionally, the authors of [18] used a denoising autoencoder for IoT anomaly detection, achieving 97% accuracy. This work is lacking blockchain’s tamper-proof logging, unlike our framework. Table 1. presents comparison between the methodologies of the related studies.

3. Methodology Mechanism

This section presents the proposed framework and its layers. The framework explains the mechanism for collaboration or integration between deep learning and blockchain to improve data security and privacy in IoT environments and their applications. The section also discusses the basic assumptions required for the simulation process of anomaly detection and attacks.
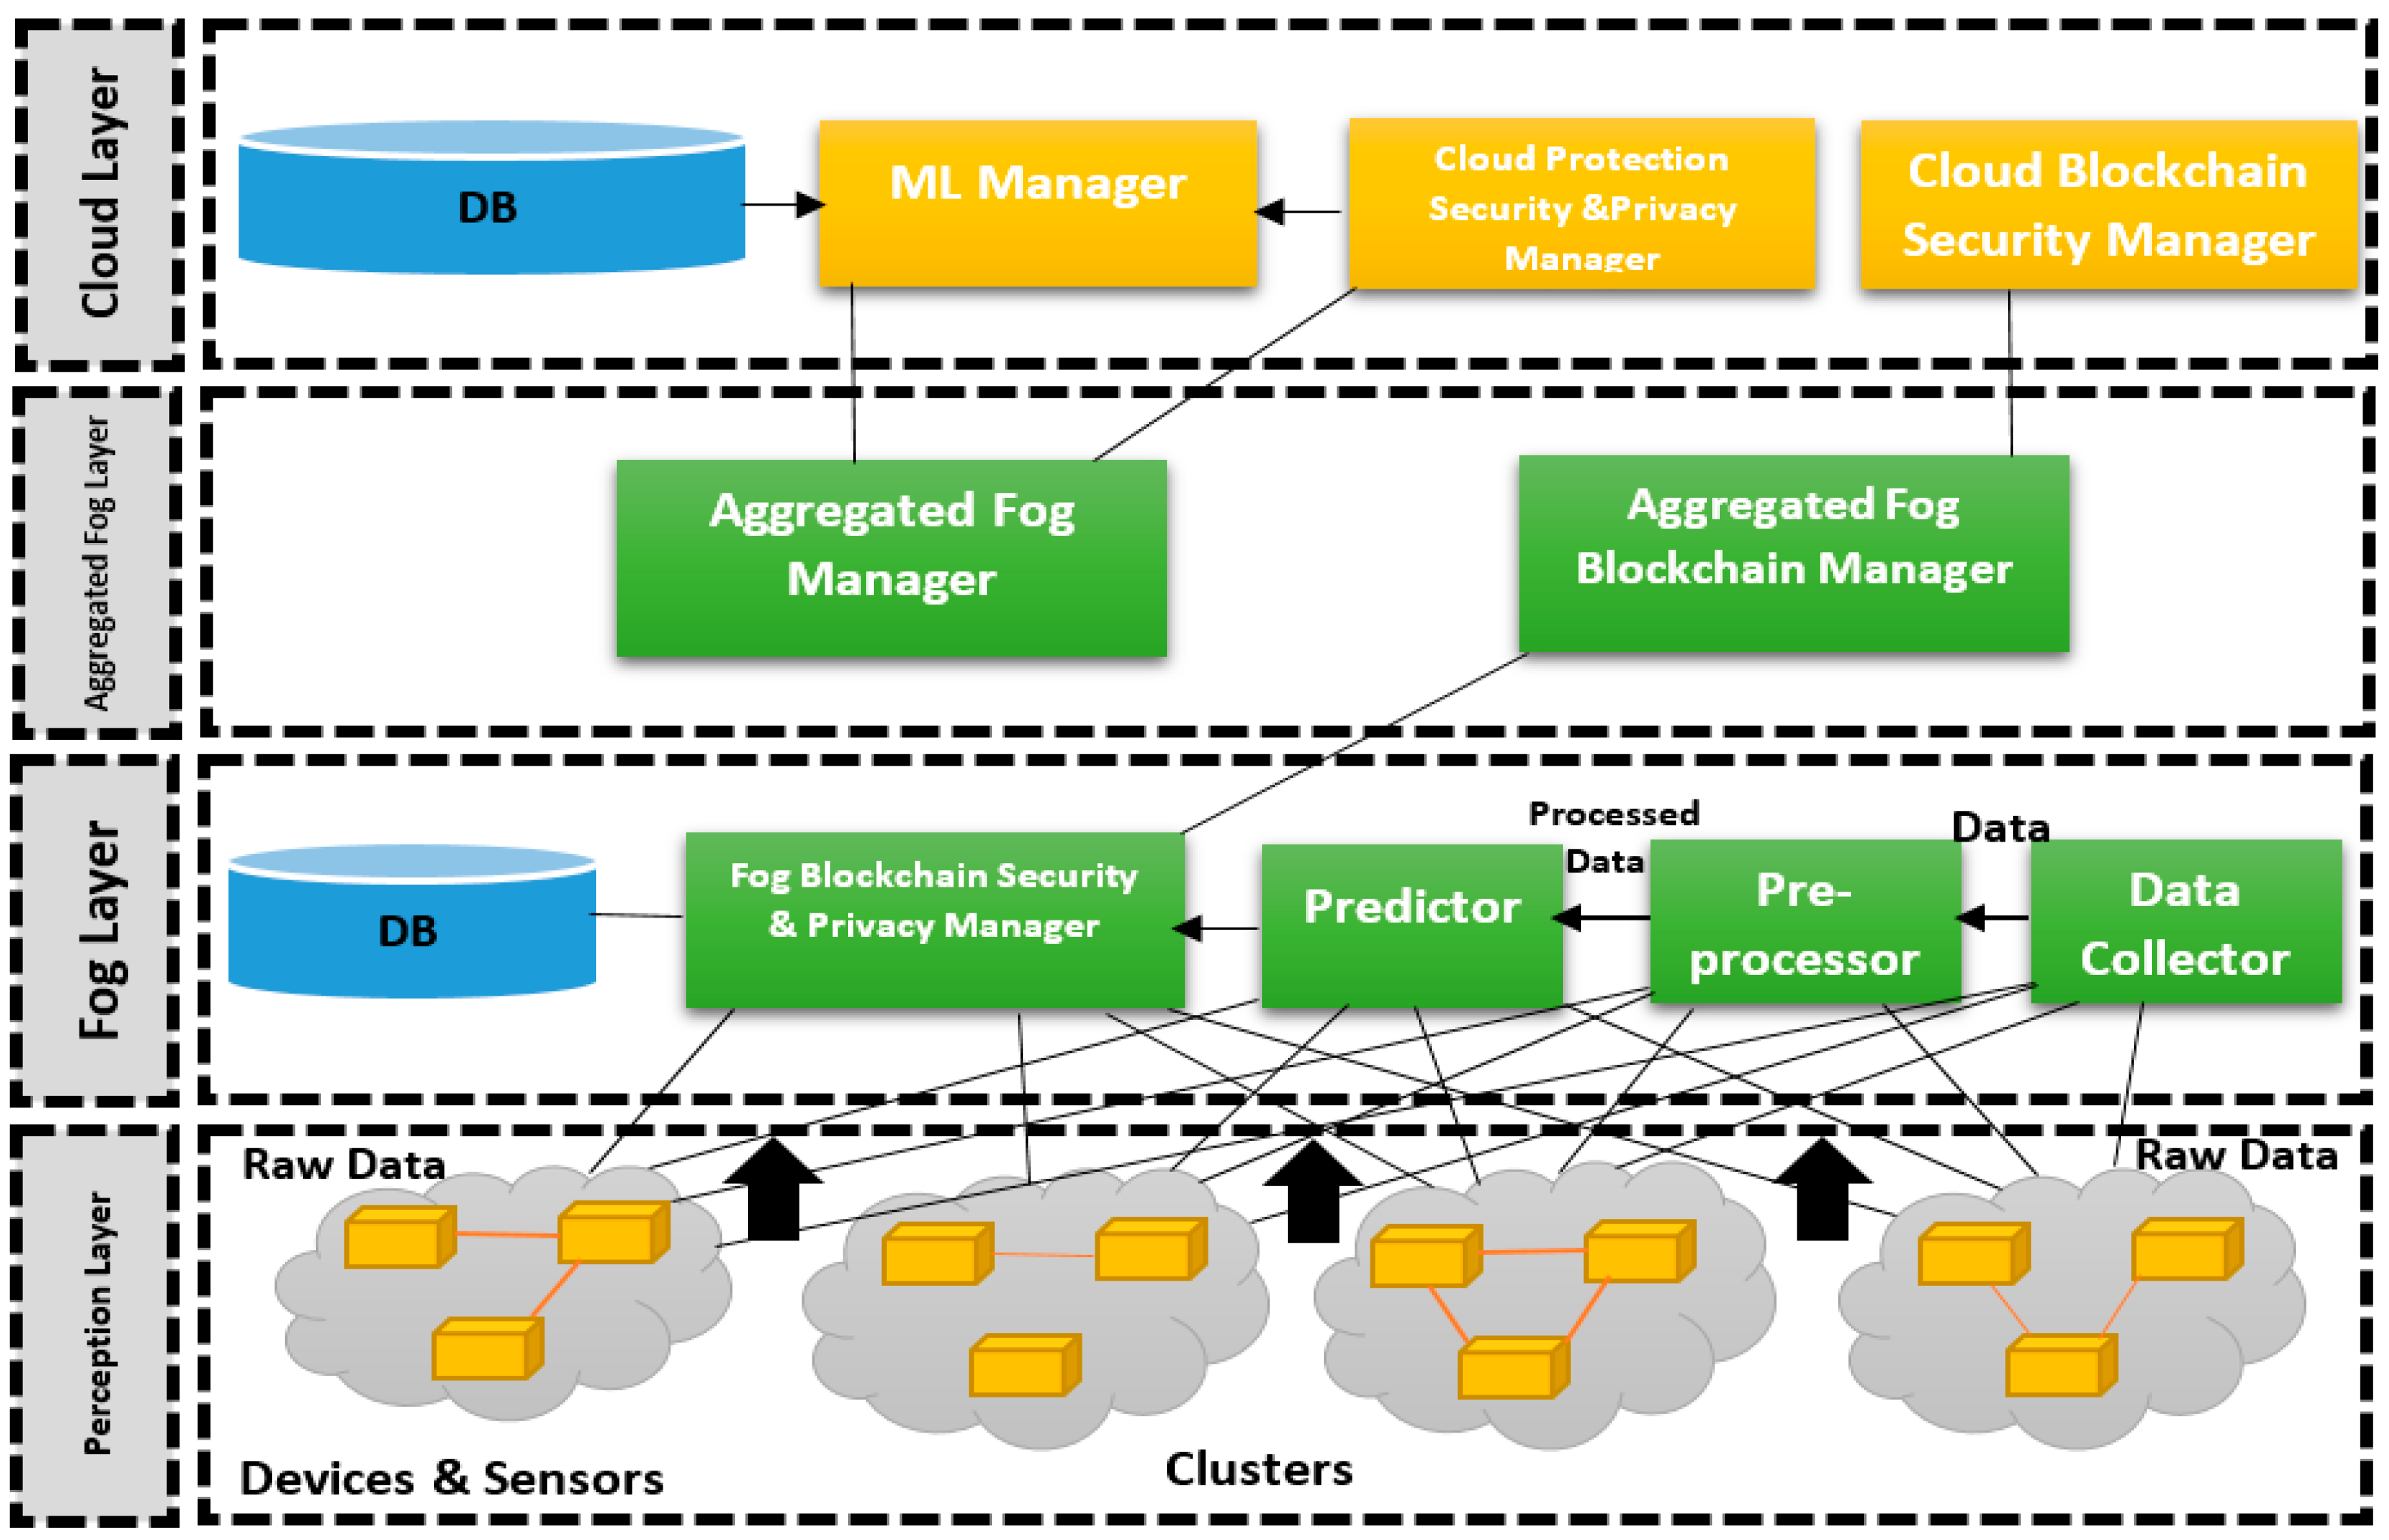
  • The Hybrid Framework Layers
The existing literature presents DL-based techniques for detecting cyberattacks on IoT devices, but these methods often need help in dynamic real-world situations. With the proposed method, we fuse the power of DL and blockchain to create a framework that adaptively adjusts to evolving threats.
Moreover, most researchers focus on binary classification; our approach goes further by classifying attacks into a precise type to permit more accurate identification and the development of targeted defense strategies. Our proposed framework is depicted in Figure 1, and it contains four main layers, which are as follows:
  • Low-level architecture’s perception layer;
  • Low-level architecture’s fog layer;
  • Low-level architecture’s aggregated fog layer;
  • Low-level architecture’s cloud layer.
The first layer represents the sensing layer, which is responsible for collecting data through IoT sensors and smart devices and continuously transmitting it to the fog layer, which represents edge computing close to the end user. The sensors are divided into groups.
All data are received in the fog layer within the data collector. The data then undergo initial processing, which cleans the data by removing outliers or missing values from incorrect measurements. It then summarizes the data for each group, calculates their average, and normalizes the values using normalization techniques.
The data are then input into the predictor, which contains a machine learning model generated based on historical data. The predictor classifies the data into a specific threat. The result is then sent to the fog-blockchain manager, which creates an initial block and sends it to the third layer, the aggregated fog layer.
This layer was added in the proposed framework as an intermediary layer between the fog and cloud layers to improve efficiency in terms of computing power and connection time, in addition to its role in organizing the structure between the cloud and fog nodes. Moreover, the aggregated fog nodes play an important role in blockchain, as each node represents a Validator or Master Node, which can verify the result coming from a specific fog node by testing it with other fog nodes. If the confirmation surpasses a certain threshold, the result is saved in a final, immutable, and tamper-proof blockchain.
In the cloud layer, blockchain is used to access accurate information confirmed by several fog nodes. This ensures high consistency in the data used for training and improving the proposed model. In the training process, deep learning is used to provide better results compared to traditional learning models. Once the model is trained and optimized, the new rules are sent to the fog nodes to be used in future classification processes.
The integration of the three components (IoT, blockchain, and deep learning) through the framework’s working technique ensures the use of highly consistent data, which means providing high-accuracy data for training. This leads to more accurate classifiers as well.
More details about the proposed steps in each layer are depicted in Figure 2.
Figure 2 illustrates the process of the proposed methodology throughout all the layers.
(1) Perception and sensing layer: This is responsible for data gathered from the IoT and smart devices, where millions of WSNs exist everywhere around the user; the data are collected and shared in real time. Sensors send the sensed data to the fog layer.
(2) Fog layer: Three crucial components make up the fog layer. The preprocessor first deals with the collected data; then, it removes the repeated data and collects some statistics. Then, the predictor recognizes and categorizes the IoT device’s behaviors, in addition to discriminating between typical and abnormal patterns based on the machine learning algorithms. The predictor acts as the malware preventer, which examines the outcomes of possible attacks on the IoT data. Then, the blockchain manager proactively limits some assaults before they reach the cloud layer, effectively reducing the processing load in the cloud. This manager effectively manages a large amount of IoT data by utilizing encryption and hashing methods.
(3) Aggregation fog layer: The fog manager is responsible for managing the fog nodes in the fog layer based on the knowledge created in the cloud. The aggregated fog blockchain manager represents the master nodes of the blockchain, which are responsible for validated data and consensus algorithms.
(4) Cloud layer: This layer plays a significant role in the integration of the blockchain and machine learning algorithms. Blockchain provides and supports a user’s trust data and a distributed storage capability. Additionally, blockchain offers reliable and secure data manipulation, and machine learning models that operate in the cloud layer and strive to make decisions based on analyzed data. However, the ML manager is trained on stored bid data to figure out certain rules and knowledge in the fog nodes in order to contribute automated consensus.
After completing the design of the proposed framework, work began on building the simulator to verify the importance of the proposed dynamics and test the impact of integration with blockchain as suggested. The goal was also to test several attacks and scenarios, in addition to comparing different learning models with the deep learning model.
First, the IoT environment and sensor layer were set up, and five sensors were proposed with scenarios to simulate sensor failures or breaches.
Next, the settings for deep learning and its layers were designed. The model was then tested before and after adding blockchain to simulate and test its impact.

4. Addressing IoT Security and Privacy Risks

Given the limited computing power of the Internet of Things and its communications, and the massive amounts of sensitive data it processes, it is often vulnerable to security and privacy-related attacks, requiring strict protection measures.

4.1. Specific Risk Scenarios

We will categorize IoT vulnerabilities into two main types: attack scenarios and data leakage.
1.
Attack scenarios:
Hacked IoT devices can be exploited to form botnets that flood networks with data traffic, known as distributed denial-of-service (DDoS) attacks, as in the 2016 Mirai attack, which disrupted major online services. The second type of attack is man-in-the-middle (MITM) attacks, where attackers can intercept or manipulate communications between IoT devices and servers, potentially compromising the smart grid. Finally, weak authentication in IoT devices can allow attackers to take control through an unauthorized access attack, where sensitive functions or data (such as unlocking a smart door) are accessed.
2.
Data leakage incidents:
Also, unsecured transmissions from IoT devices, such as health monitors or smart cameras, can be intercepted, compromising personal information such as medical records or live footage. Finally, aggregated IoT data can be exploited to create user profiles, revealing behavioral patterns or locations without consent, especially in the context of smart homes or wearable devices, which constitutes a privacy violation.

4.2. Mitigation Mechanism Through a Hybrid Framework

Our hybrid framework utilizes deep learning and blockchain technology to effectively address these risks. The deep learning component analyzes real-time IoT data to identify anomalies. For example, it can detect unusual traffic patterns that indicate DDoS or MITM attacks.
By training on historical data, the system adapts to recognize emerging threats, strengthening proactive defense. In addition, the blockchain ensures that all IoT data and system events are consistently recorded. This prevents tampering by attackers attempting to obscure evidences of unauthorized access or data breaches, while securing sensitive data from interception through encryption and decentralization.

4.3. Practical Effectiveness and Benefits

Let us assume that a smart city’s IoT network is facing a distributed denial of service (DDoS) attack. A deep learning model quickly identifies abnormal traffic spikes from compromised sensors and isolates them to prevent network overload. Meanwhile, blockchain technology securely records the event, providing an auditable record for post-incident analysis. This dual approach ensures rapid response and data integrity. Key benefits include real-time threat detection, whereby immediate detection of anomalies reduces damage. Furthermore, blockchain technology enhances trust and accountability. Finally, it is scalable and adaptable, as the framework automatically evolves with new threats, ensuring its long-term relevance. From this, it can be concluded that this concept has practical utility for our framework in protecting IoT systems from security and privacy threats.
In the next section, all the previous settings, testing processes, and the algorithm describing the used code are detailed.

5. Evaluation and Validation

A. Setup Phase
1.
Sensors Configuration
In this simulation, five sensors were set up to collect data from various sources. Each sensor transmitted real-time data, including attributes such as duration, packet size, and protocol type. These sensors were implemented using the SimPy environment.
2.
Sensor Malfunction Simulation
A sensor malfunction scenario was introduced by deactivating sensor 3 after a certain period to observe how the system responded. The goal was to evaluate the model’s ability to detect and handle unexpected sensor behavior.
3.
DL Model Architecture
The deep learning model used in this experiment is the feedforward neural network designed for multi-class classification. The architecture consists of the following:
  • Input layer: 24 features (sensor data attributes);
  • Hidden layers: Three hidden layers with ReLU activations (128, 64, and 32 neurons);
  • Output layer: A softmax layer for multi-class classification (7 classes).
4.
Model Training and Experiment Steps
The model was trained using the categorical cross-entropy loss function and Adam optimizer. The dataset was split into training and validation sets, and the model was trained for 10 epochs.
We ran 5 sensors to accumulate certain data, such as duration, packet size, protocol type, and others. The environment of these sensors was the SimPy environment. To assess and evaluate the model’s robustness and capacity against sensor failures, sensor 3 was intentionally deactivated after a specified duration of time. This scenario was designed to mimic a real-world sensor malfunction.
The steps of the IoT simulation experiment were as follows:
  • Import libraries;
  • Load and preprocess data;
  • Define the neural network model;
  • Compile the model;
  • Train the model;
  • Integrate the blockchain class;
  • Prepare the IoT device environment;
  • Run the simulation function in SimPy.
B. Validation Metric Results
Each sensor collected data points and transmitted them to the model. The table below summarizes a sample of the sensor data with their respective class predictions based on the model output. Figure 2 summarizes certain sensors that collected the sensed data using blockchain for logging and then used deep learning to predict the data classes.
1.
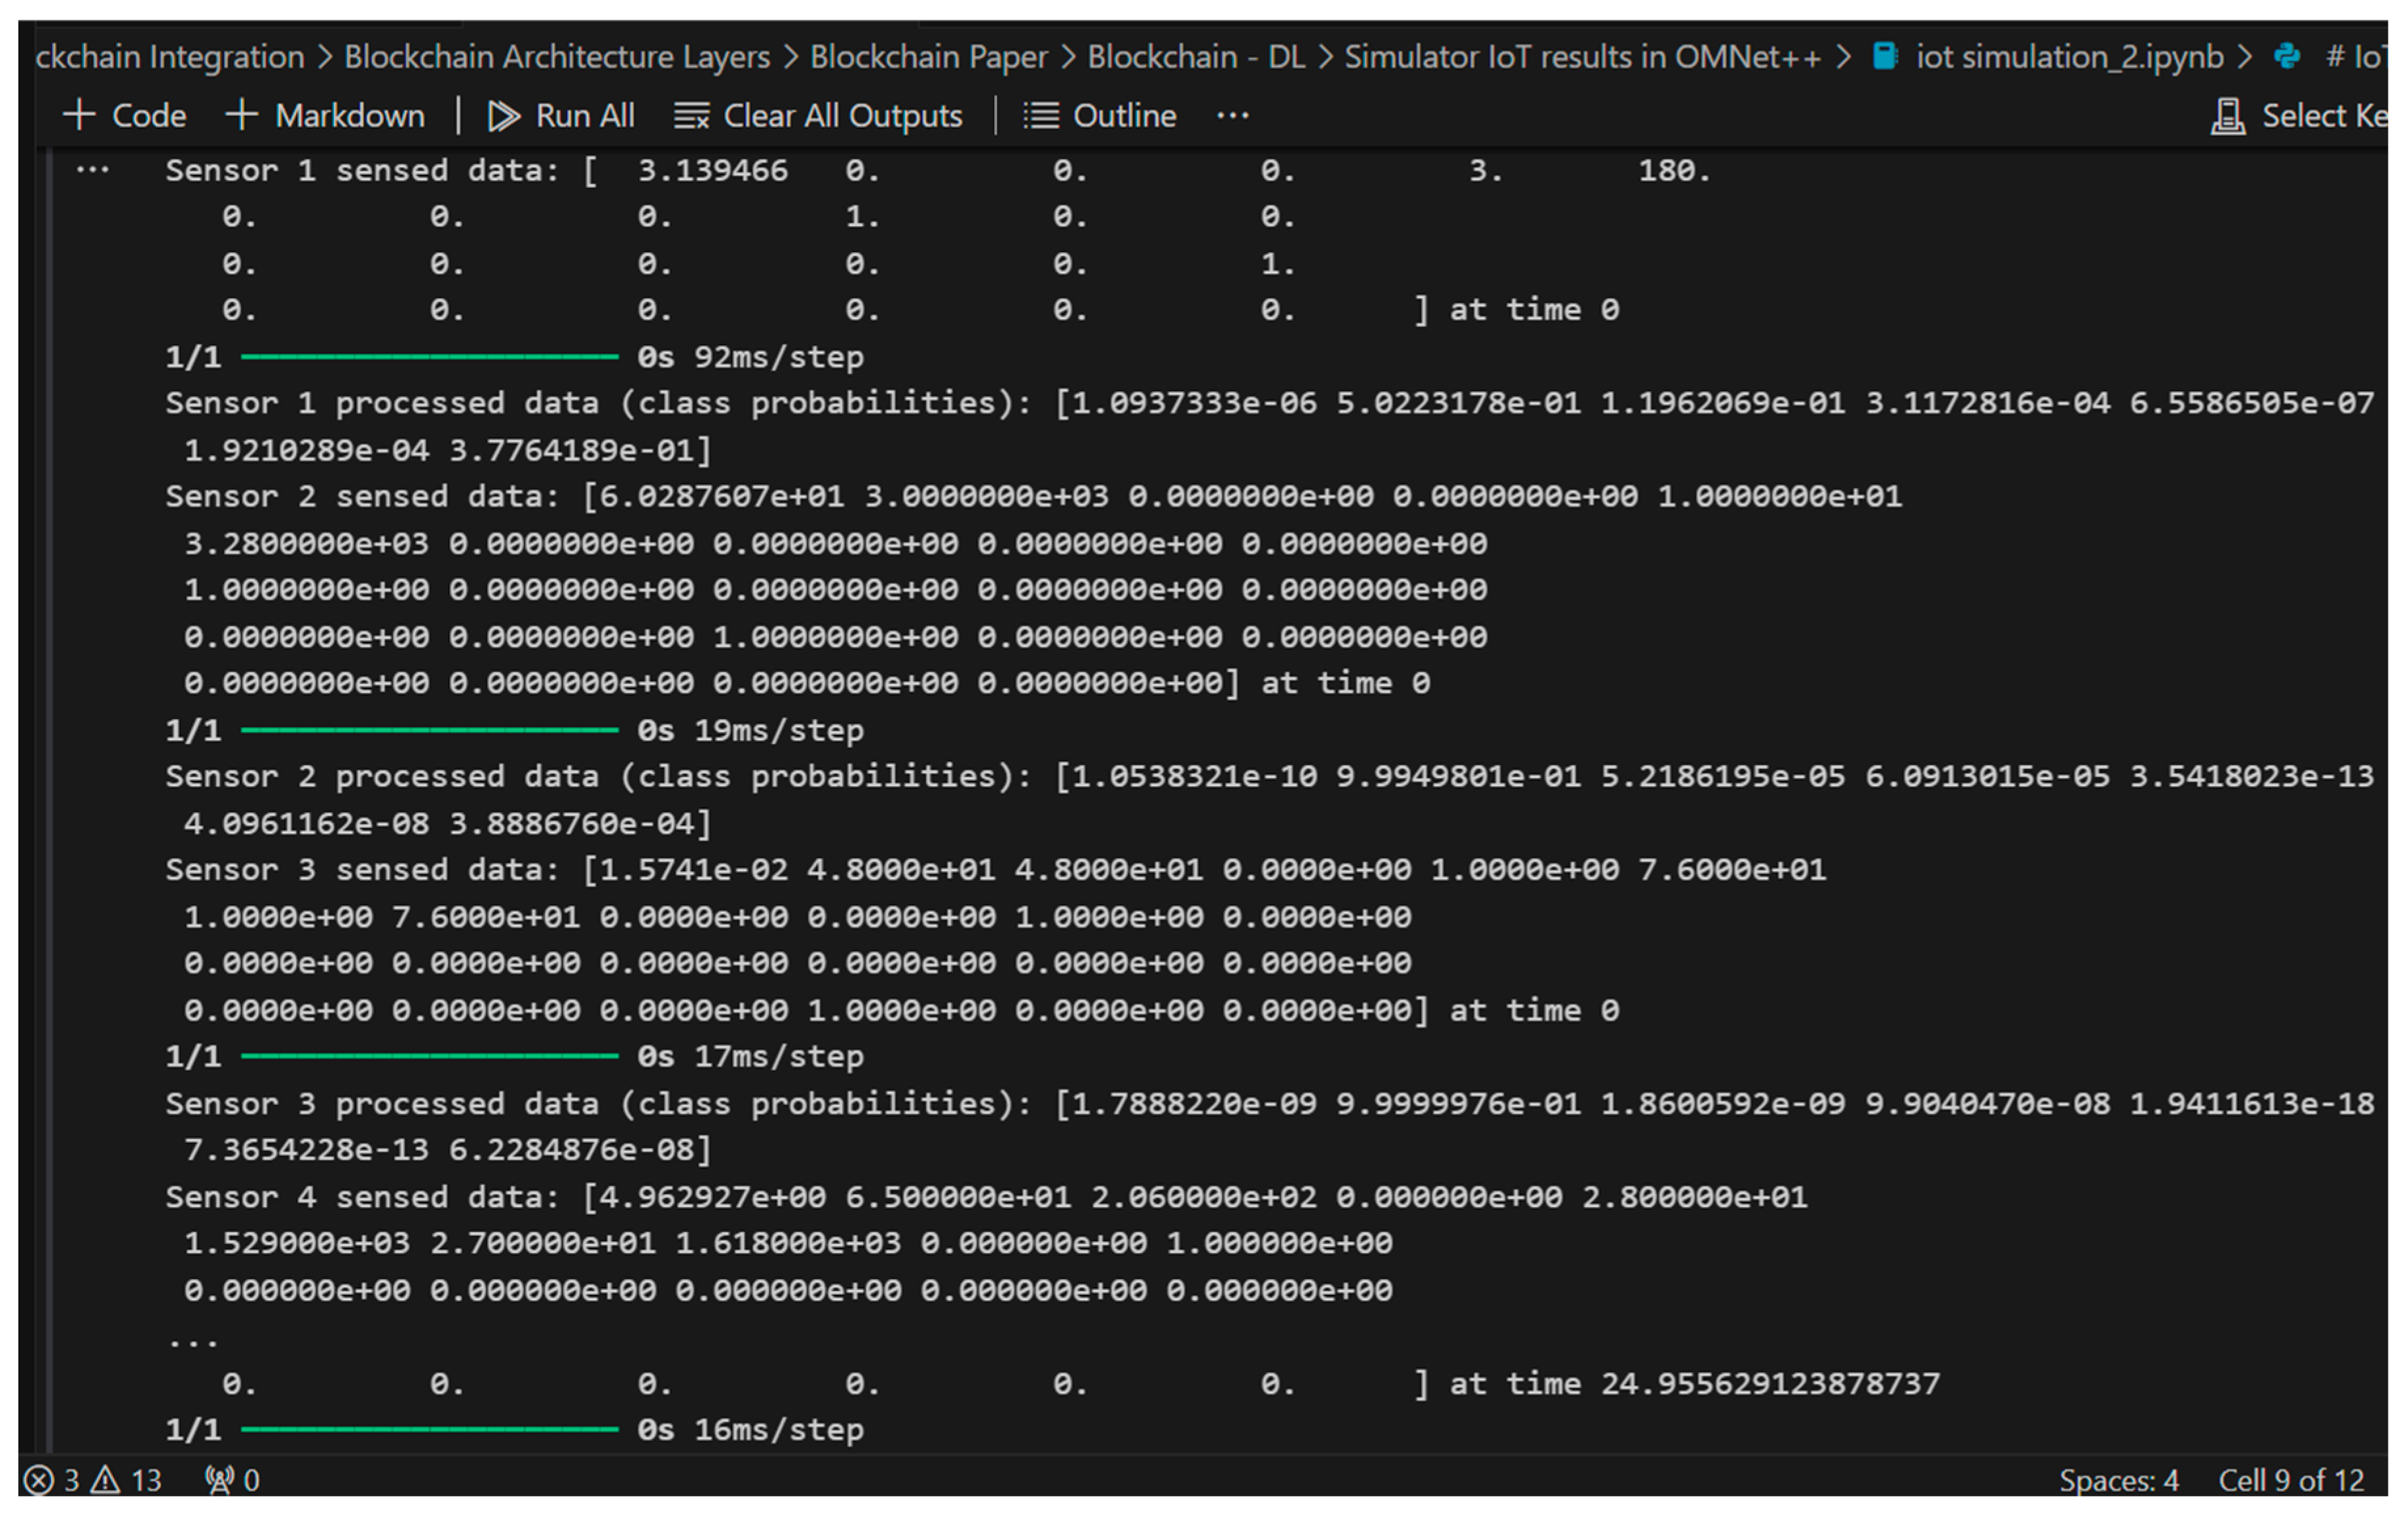
Sensor Sensed Data Sample
Figure 1 depicts sensor 1 sending around 3.35 e+00 data, and our deep learning model (DL) (particularly the feedforward neural network) detects three classes with a certain probability for each class. For example, it detects class 0 with a probability of 88%, whereas the DL model detects these data as class 1 with a probability of 2%, and the DL model detects class 6 with a probability of 9%; thus, the DL model picks up the class with the highest probability of detection, which is class 0.
2.
Sensor Malfunction Detection
After turning off sensor 3, the blockchain recorded data up until the malfunction event. The class predictions for sensor 3 before the malfunction indicated a high probability for class 1, but no further data were logged after the sensor was deactivated.
  • Sensor 3 before malfunction: class 1 (50.51% confidence);
  • Sensor 3 after malfunction: no data (logged as inactive in the blockchain).
3.
SENSOR 1 DATA Results
The sensed data from the sensor contain diverse values, such as packet size, duration, and other related metrics. In the case of sensor 1, the data look like a mix of continuous values, such as 3.139466 for the measurement, and the binary values, 0 and 1, depict the status of the system regarding the attack state: 0 or 1 for non-attack or attack status, respectively. The sensor processes these sensed data to distinguish arbitrary possibilities of attacks. These probabilities indicate the likelihood of the data and the class in which they belong.
For instance, the highest probability indicates that the most likely classification is the second class (index 1 since the index commences from 0). The values reveal how confident the sensor is in categorizing the data into each class, with values closer to 1 indicating higher confidence.
Overall, our output displays the sensor’s capability to not only gather data but also to analyze it to offer insights or classifications based on what it has sensed. Figure 3 shows certain data of sensor 1.
4.
SENSOR 2 DATA Results
In the sensed data of the second sensor, various values were recorded at time 0, such as the key measurements involving approximately 60.29 and 3000, with many zeros indicating no significant detection for certain parameters. Regarding the processing time, the data were processed quickly, in about 19 milliseconds, whereas the class probabilities of the second sensor assessed and estimated the likelihood of the data belonging to different categories as class 1, with a very high probability (~99.5%), indicating strong confidence that the data fit this class.
Other classes had very low probabilities, suggesting that they were unlikely matches. In general, sensor 2 efficiently captured and analyzed the data and confidently classified it primarily under class 1. Figure 4 reveals certain data from sensors 2 and 3, respectively.
5.
SENSOR 3 DATA Results
The sensed data of the third sensor reported various measurements at time 0, involving approximately 0.0157, 48 (twice), and 76 (twice), with multiple zeros indicating no significant detection for the other parameters. The data were processed quickly, in about 17 milliseconds. Sensor 3′s analysis rigorously showed a high probability of the data belonging to class 1, with an accuracy as high as ~ 99.99%, and effectively categorized it with high confidence. Overall, sensor 3 effectively gathered and analyzed the data, confidently classifying it primarily under class 1.
6.
SENSOR 4 DATA Results
The sensed data of the fourth sensor took approximately 24.96 s; the sensor recorded various values, involving approximately 4.96, 65, 206, 28, and 1529, with several zeros indicating no significant detection for the other parameters. The data were processed quickly, in about 16 milliseconds, whereas the class probabilities of the sensor determined a 50.2% probability for class 1 and a 37.8% probability for class 6, indicating that the data fit primarily into these categories.
The other classes had very low probabilities. Overall, sensor 4 effectively collected and analyzed data, indicating that they were most likely related to class 1 or class 6. Figure 5 depicts certain data of sensor 4.

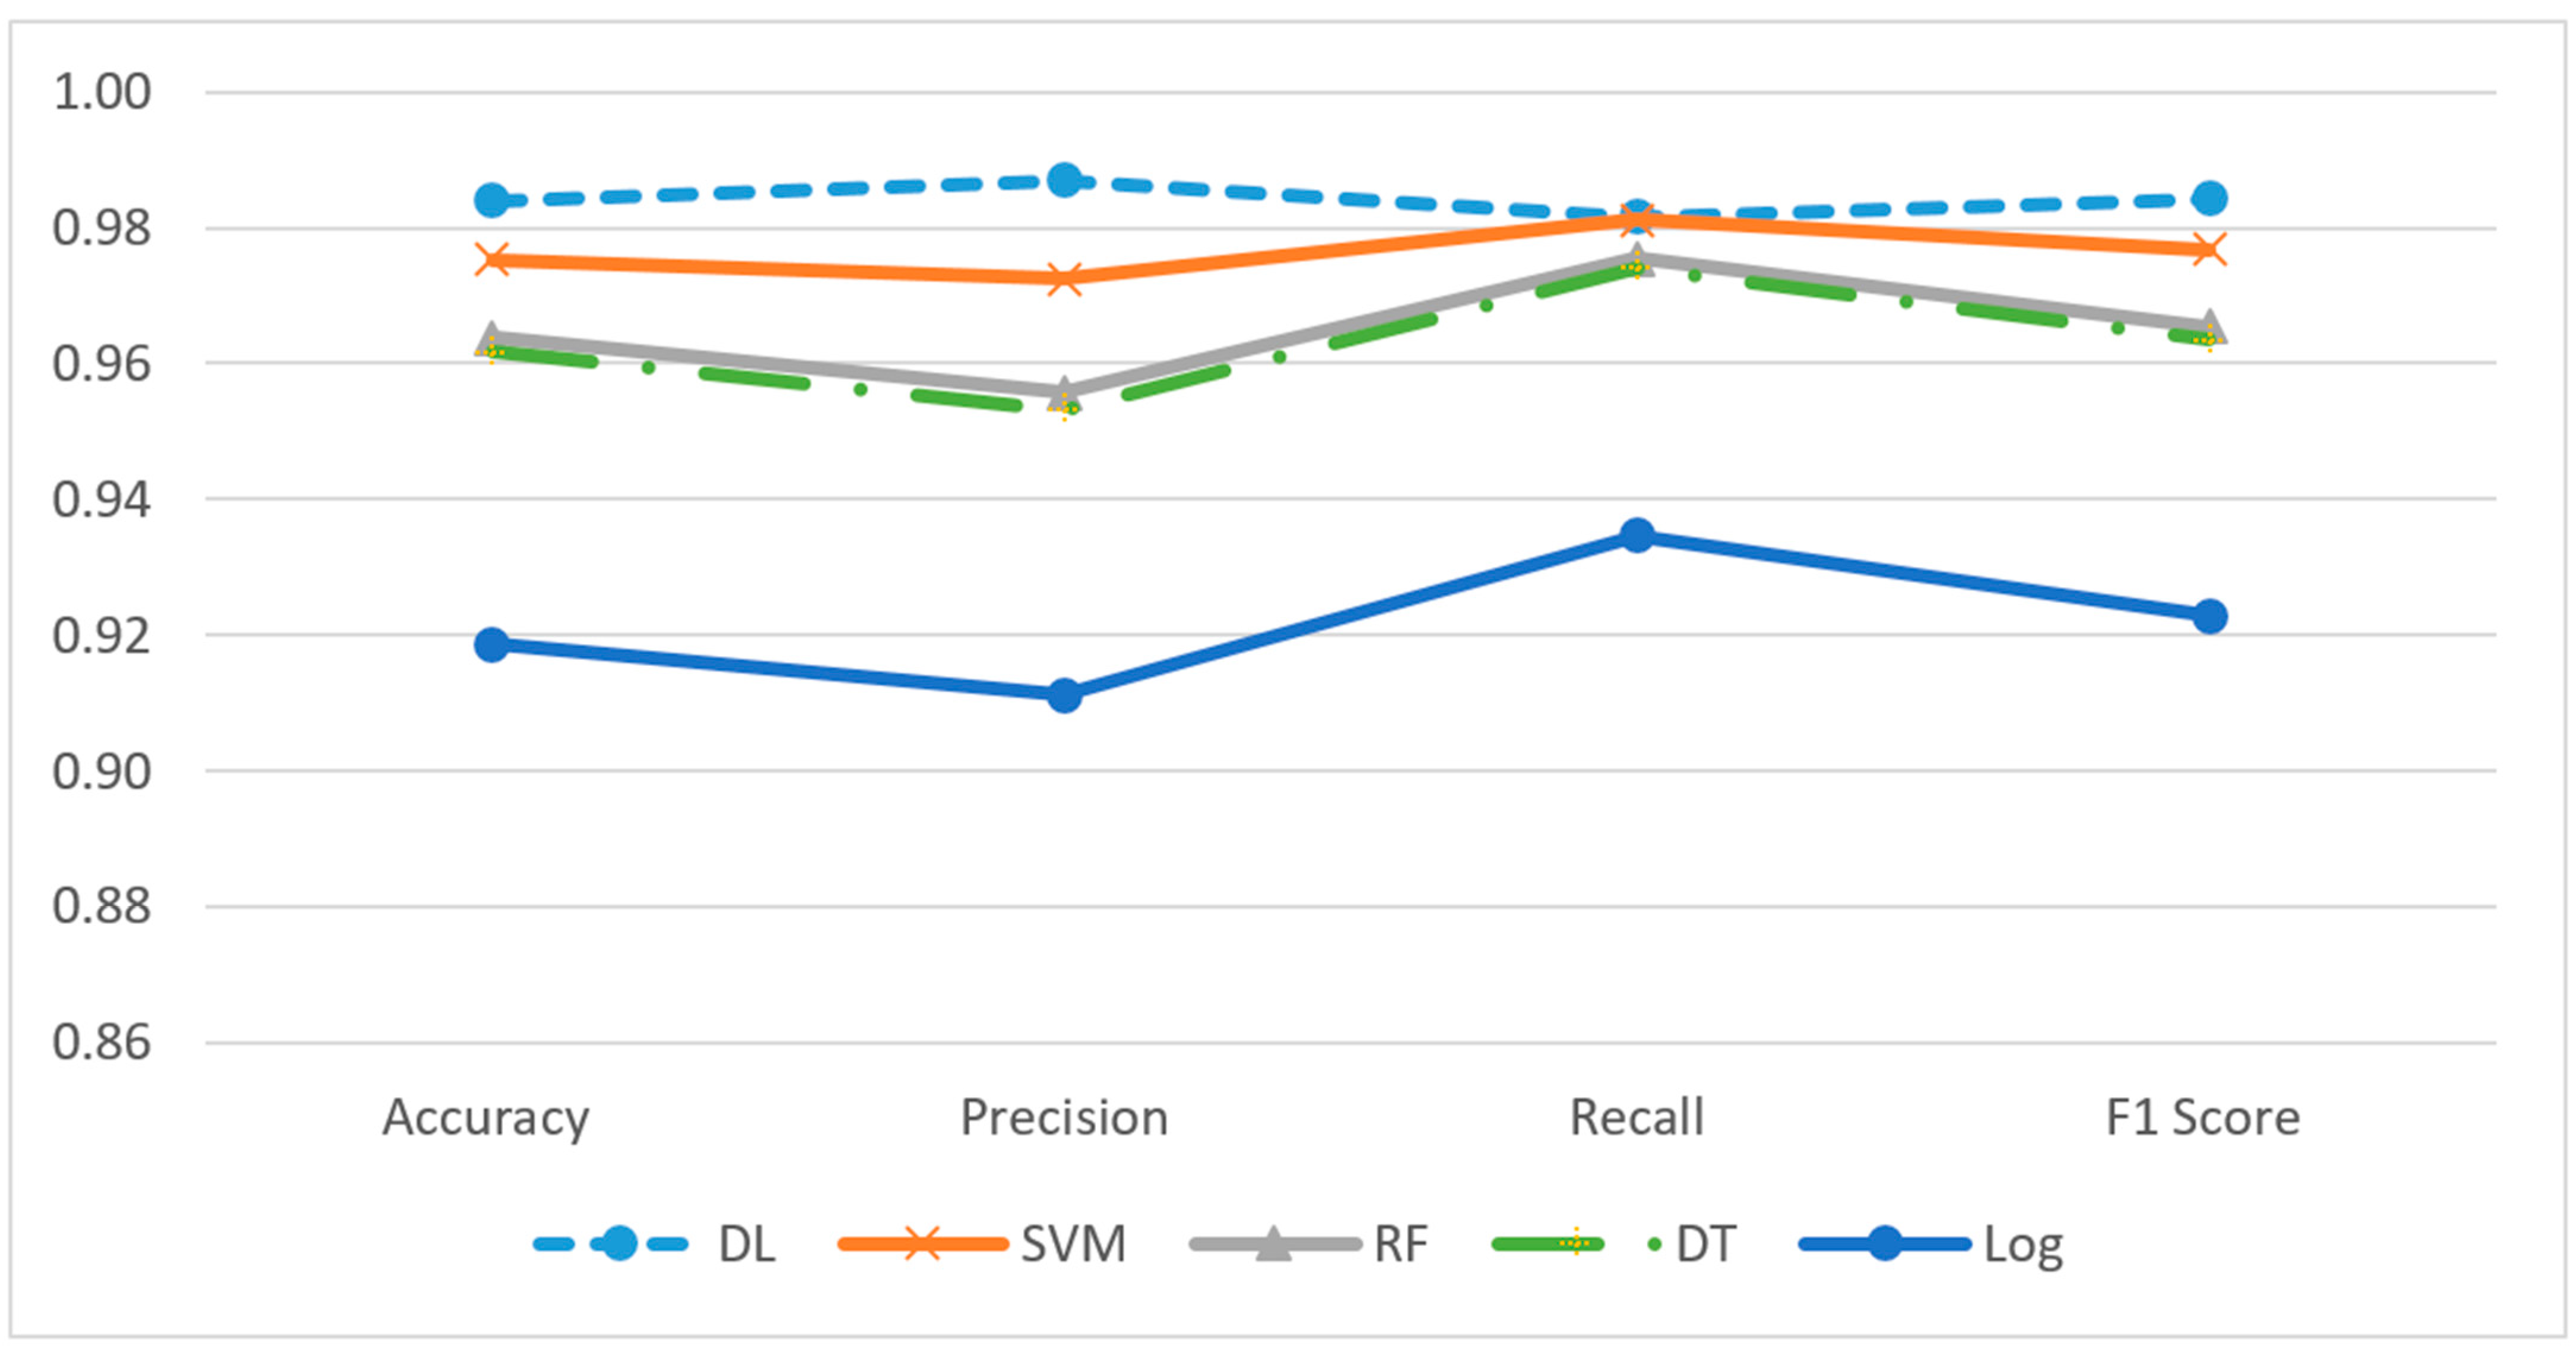
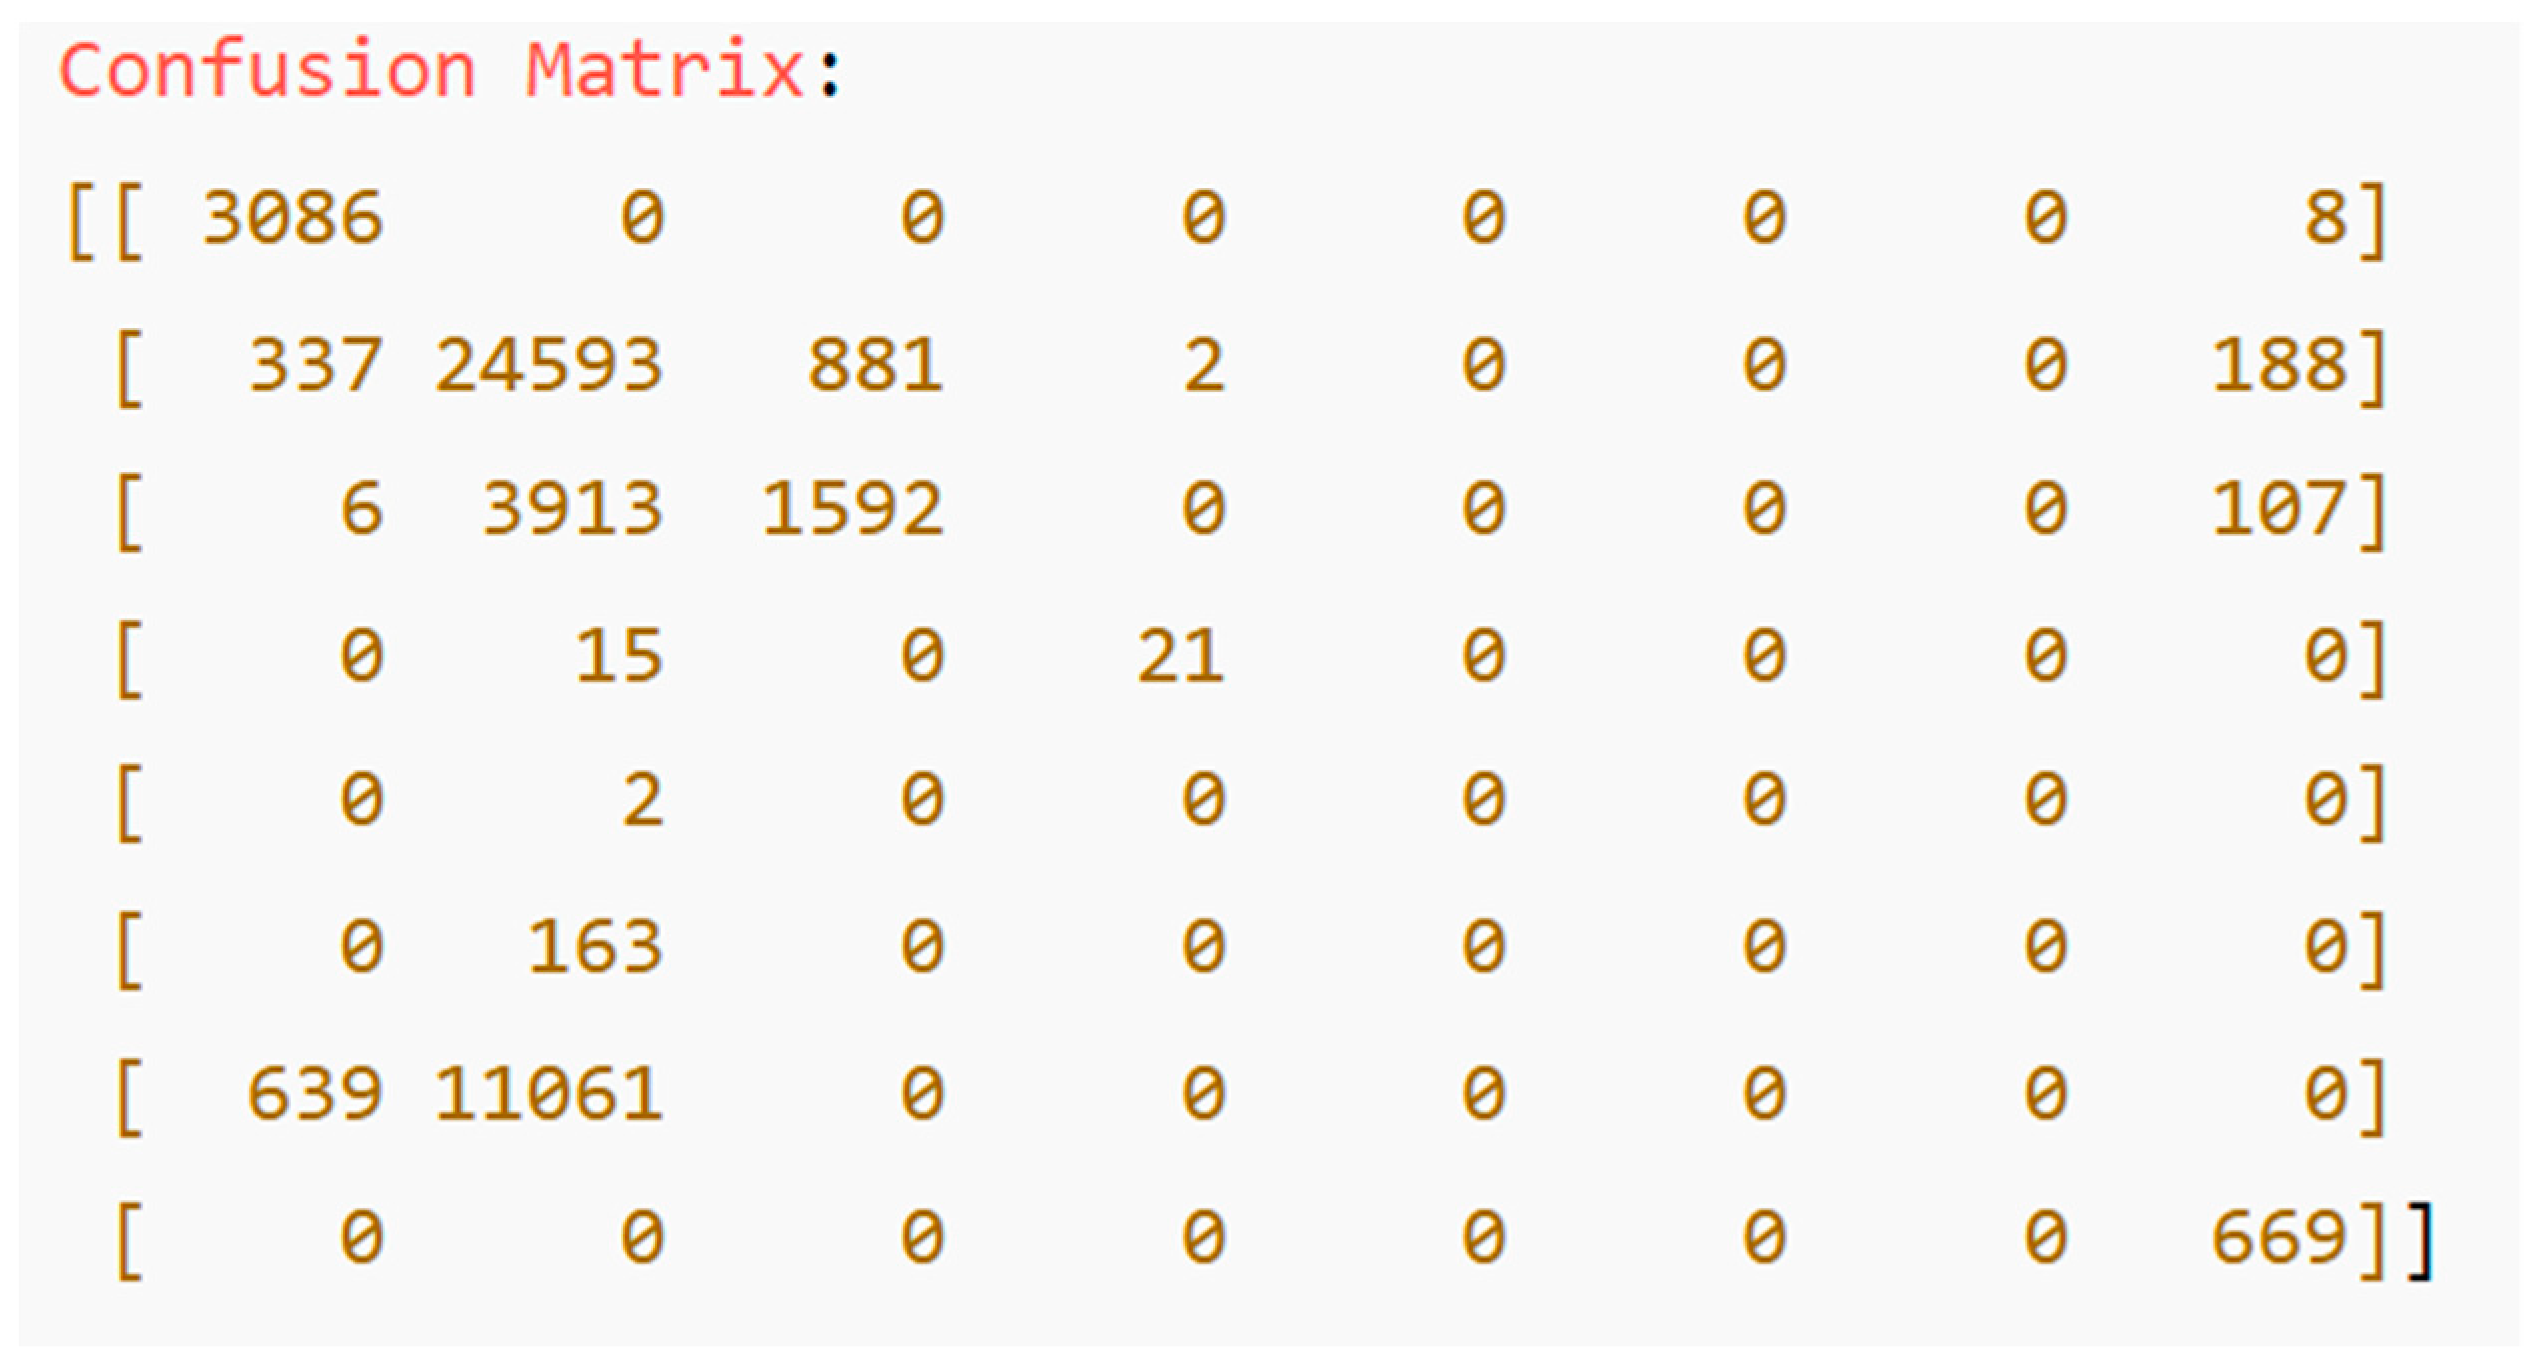
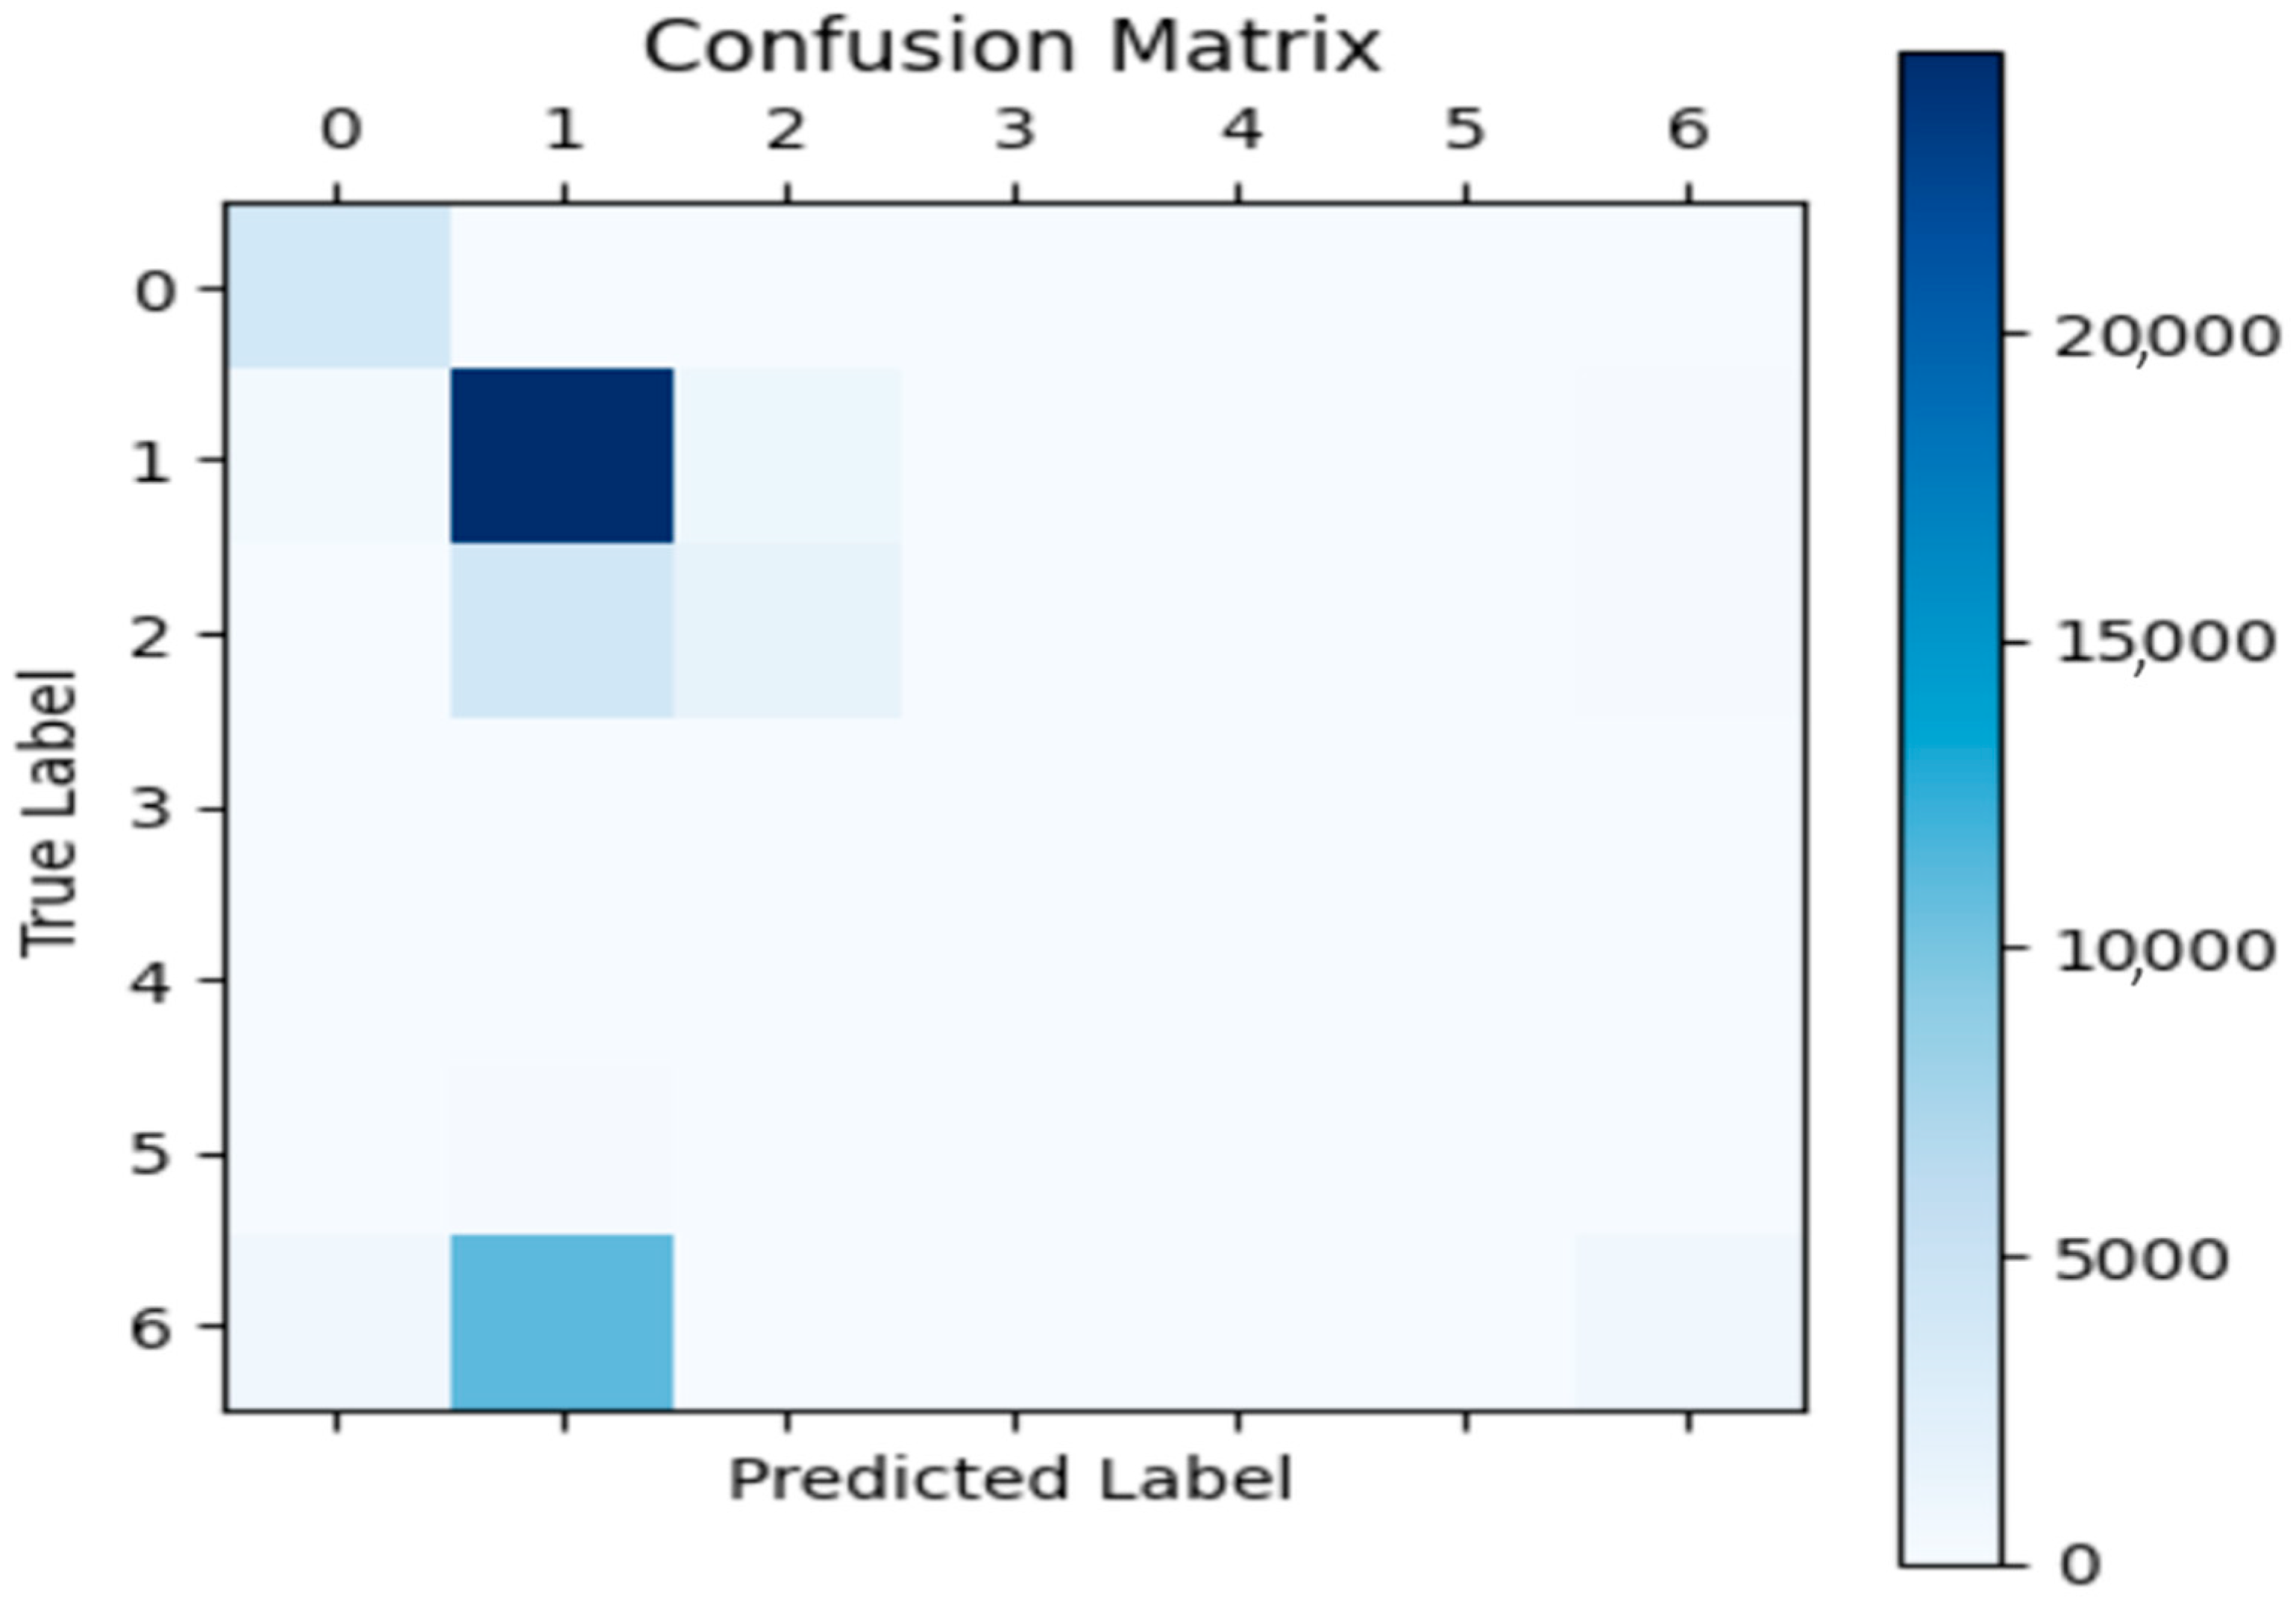
Evaluation Metrics Results and Comparison Results of DL(ANN), SVM, RF, DT, and Log R

1.
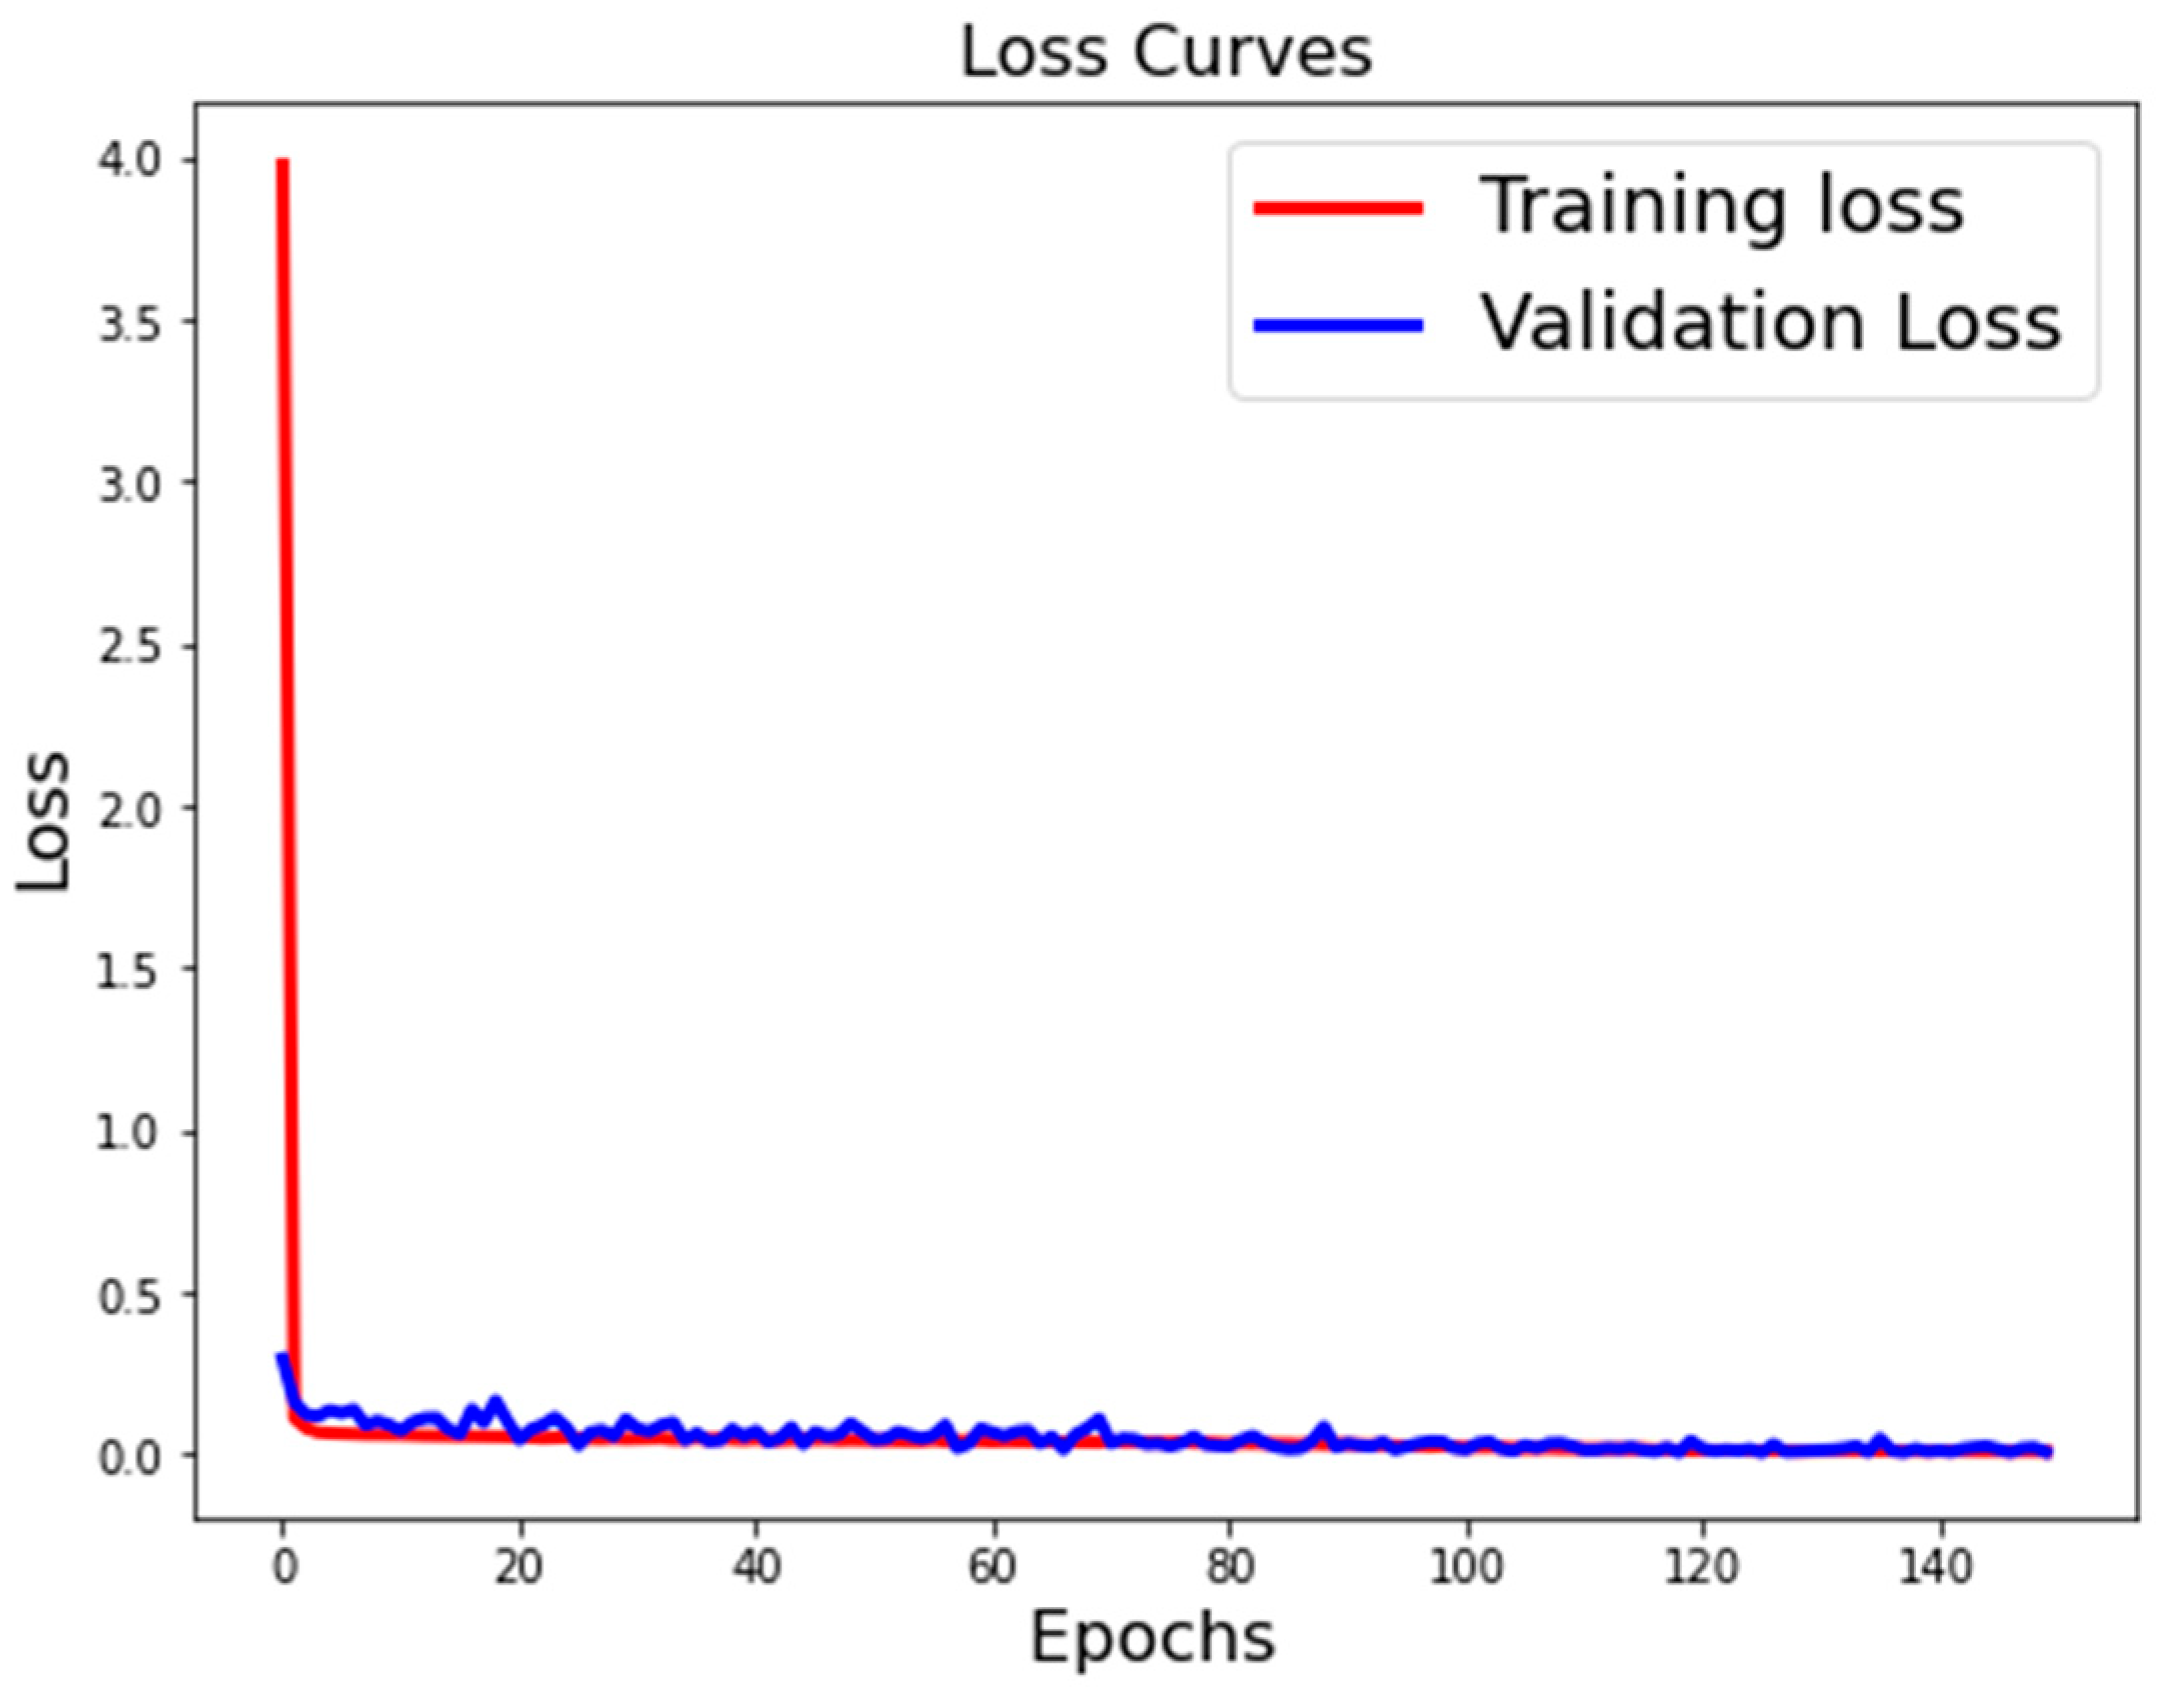
Model Accuracy and Loss Function Accuracy Metric
During training, the model’s accuracy became steadily more sophisticated over 1000 epochs, reaching a stable point at 98% with the DL (ANN) model. The final training accuracy was 98% with a corresponding loss value of 0.03. Figure 6 shows the accuracy progress of five different machine learning models and the relationship between them.
We ran five different machine learning models: deep learning (artificial neural network) DL (ANN), support vector machine (SVM), random forest (RF), decision tree (DT), and logistic regression (Log R). DL (ANN) achieved the highest performance with 98% accuracy, 99% precision, 98% recall, and 98% F1 score, making it the most effective model for this IoT anomaly detection task due to its ability to capture complex, non-linear patterns in the data. In addition, the SVM model performed very well, with 98% accuracy, 97% precision, 98% recall, and 98% F1 score, though it had slightly lower precision due to more false positives (22 vs. ANN’s 33). The RF and DT models had the same performance rate of 96% accuracy, with RF showing 96% precision, 98% recall, and 97% F1 score, and DT showing 95% precision, 97% recall, and 96% F1 score, each with one false positive and one false negative. The Log R model had the lowest performance among the five different models, with 92% accuracy, 91% precision, 93% recall, and 92% F1 score. In general, the DL (ANN) was the best-performing model, followed by SVM, RF, and DT, respectively, and the worst was the Log R model. While training times were not measured, DL (ANN) typically requires more computational resources than simpler models like DT or Log R. Figure 7 shows the details of the different machine learning models. Table 2 shows a comparison between all the models used, while Table 3 shows the accuracy, precision, recall, and F1 score for all the models used.
Figure 6 shows our comparison based on four key metrics: accuracy, precision, recall, and F1 score. Overall, the DL (ANN) model performed better than the other models. DL achieved the highest scores compared to all the other models for all four key metrics. In addition, the other models, SVM, RF, and DT, showed a similar level of performance, with RF slightly edging out the others in certain metrics. Logistic regression had the worst scores across all the metrics, indicating that it was the least suitable model for our task.
This reveals the progress of the model’s accuracy over the epochs. The graph visually demonstrates how the model’s accuracy progressed as it was trained on the entire training dataset multiple times. Overall, the graph illustrates a typical trend in machine learning: as the model was trained on more data, its accuracy generally improved. This shows the model’s increasing ability to recognize patterns and make accurate predictions.
2.
Loss Function Metric
Figure 7 depicts a line graph of model loss over the epochs to demonstrate how the loss of a deep learning model decreases as it is trained on more and more data. The key elements of this graph are the X-axis, which shows the epoch number, and the Y-axis, which shows the loss of the model. Loss is a measure of how well the model’s predictions match the actual target values. The lower loss value signifies better performance. The graph line displays the change in loss as the number of epochs increases. In general, the graph reveals that the model’s loss decreases as it is trained on more and more data. This is a typical trend in deep learning, as the model learns to better fit the training data and make increasingly accurate predictions.
3.
Precision Metric
The output performed and processed 1501 out of 1501 samples within 1 s, at 602 microseconds/step, using a deep learning model, specifically a classification model. The confusion matrix in Figure 8 shows the classification model’s performance and how many instances of each class were correctly or incorrectly classified or misclassified. Each row shows the actual class, and each column shows the predicted class. For instance, the element at row 0, column 0 (3886) refers to the fact that 3886 instances of class 0 were correctly classified as class 0, whereas the other elements display the number of misclassified instances.
Moreover, the precision metric shows and measures how many of the positive predictions made by the model were actually correct; the precision was around 0.99, indicating that 99% of the instances predicted as positive were indeed positive. Furthermore, the accuracy metric shows and measures the overall correctness of the model’s predictions with an accuracy of 98.00, indicating that 98% of all the instances were correctly classified.
In general, the model seems to have achieved a moderate level of accuracy and precision. However, the class distribution was balanced, and the accuracy and precision metrics achieved the most appropriate level.
Figure 9 displays a confusion matrix, which is a visualization tool to evaluate our model’s classification performance. In this case, the confusion matrix shows the results of a model that has been trained to classify data into seven classes (0 to 6). The rows reveal the true labels of the data points, whereas the columns reveal the predicted labels assigned by our model. Regarding the color scale, the color intensity in each cell refers to the data point numbers that were correctly or incorrectly classified. Darker colors represent larger numbers.
The diagonal cells (from top left to bottom right) display the data point numbers that were correctly classified, e.g., the cell at row 0, column 0 (top left corner) reveals the data point numbers that were correctly classified as class 0.
In contrast, the off-diagonal cells show the numbers of data points that were misclassified, e.g., the cell at row 1, column 2 represents the data point numbers that were actually class 1 but were incorrectly predicted as class 2.
It also shows the performance of a classification model that predicts one of the seven classes (0 to 6). While the model shows rigorous performance in successfully recognizing class 6, it has difficulty distinguishing between class 1 and class 0. For the remaining classes, the model shows moderate performance, with tiny instances of misclassification.
4.
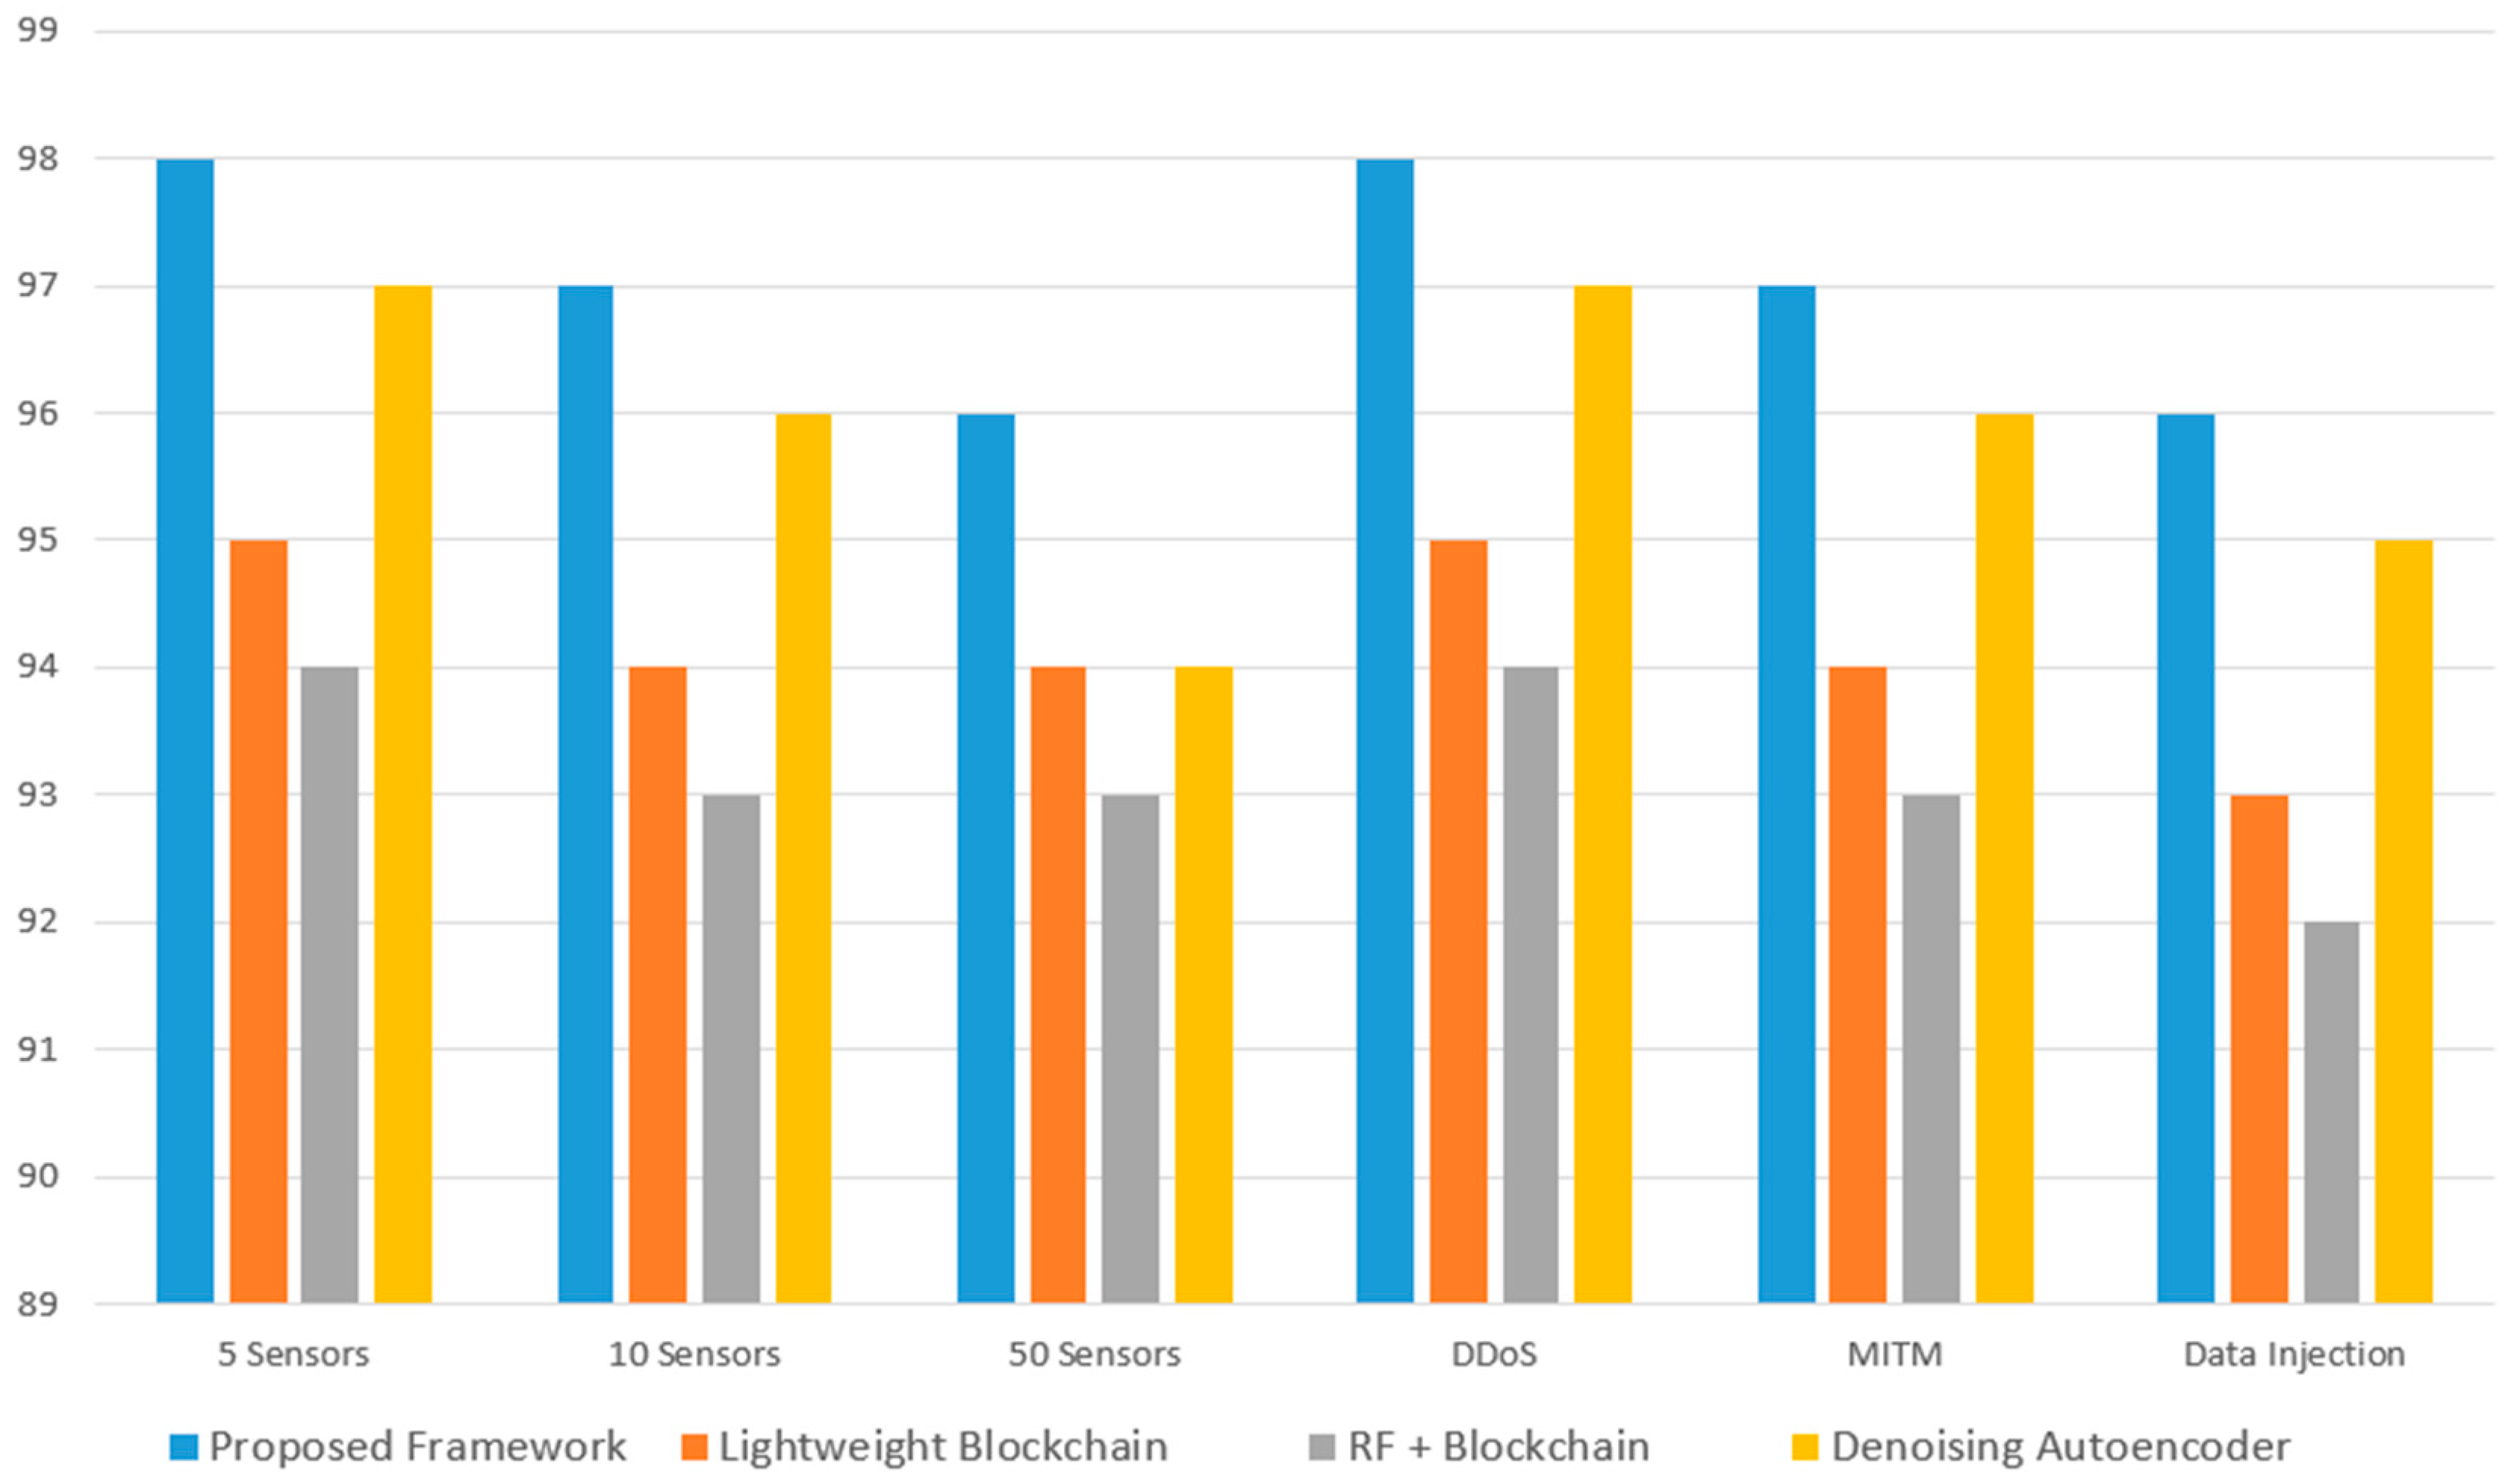
COMPARATIVE EVALUATION WITH STATE-OF-THE-ART METHODS
Compared to recent methods like the denoising autoencoder [18], which achieves 97% accuracy, our framework’s 98% accuracy with blockchain integration highlights its superiority. Table 4 summarizes the performance under baseline conditions. This superior performance is from our combination of deep learning for real-time anomaly detection and blockchain for tamper-resistant logging, unlike the deep learning-only approach in [18] or the less adaptive machine learning methods in [16,17].
To assess the robustness of our proposal under various conditions, we simulated different security attack scenarios (mentioned earlier) and different network sizes (5, 10, and 50 sensors). Figure 10 illustrates the accuracy, showing that our framework maintains an accuracy of ≥ 96% under all conditions, compared to [18]’s drop to 94% with 50 sensors and [16]’s drop to 93% under data injection attacks. Blockchain technology ensures consistent data integrity across scales, unlike [16,17], which lack our layered architecture. These results demonstrate the scalability and adaptability of our framework to diverse IoT environments.
5.
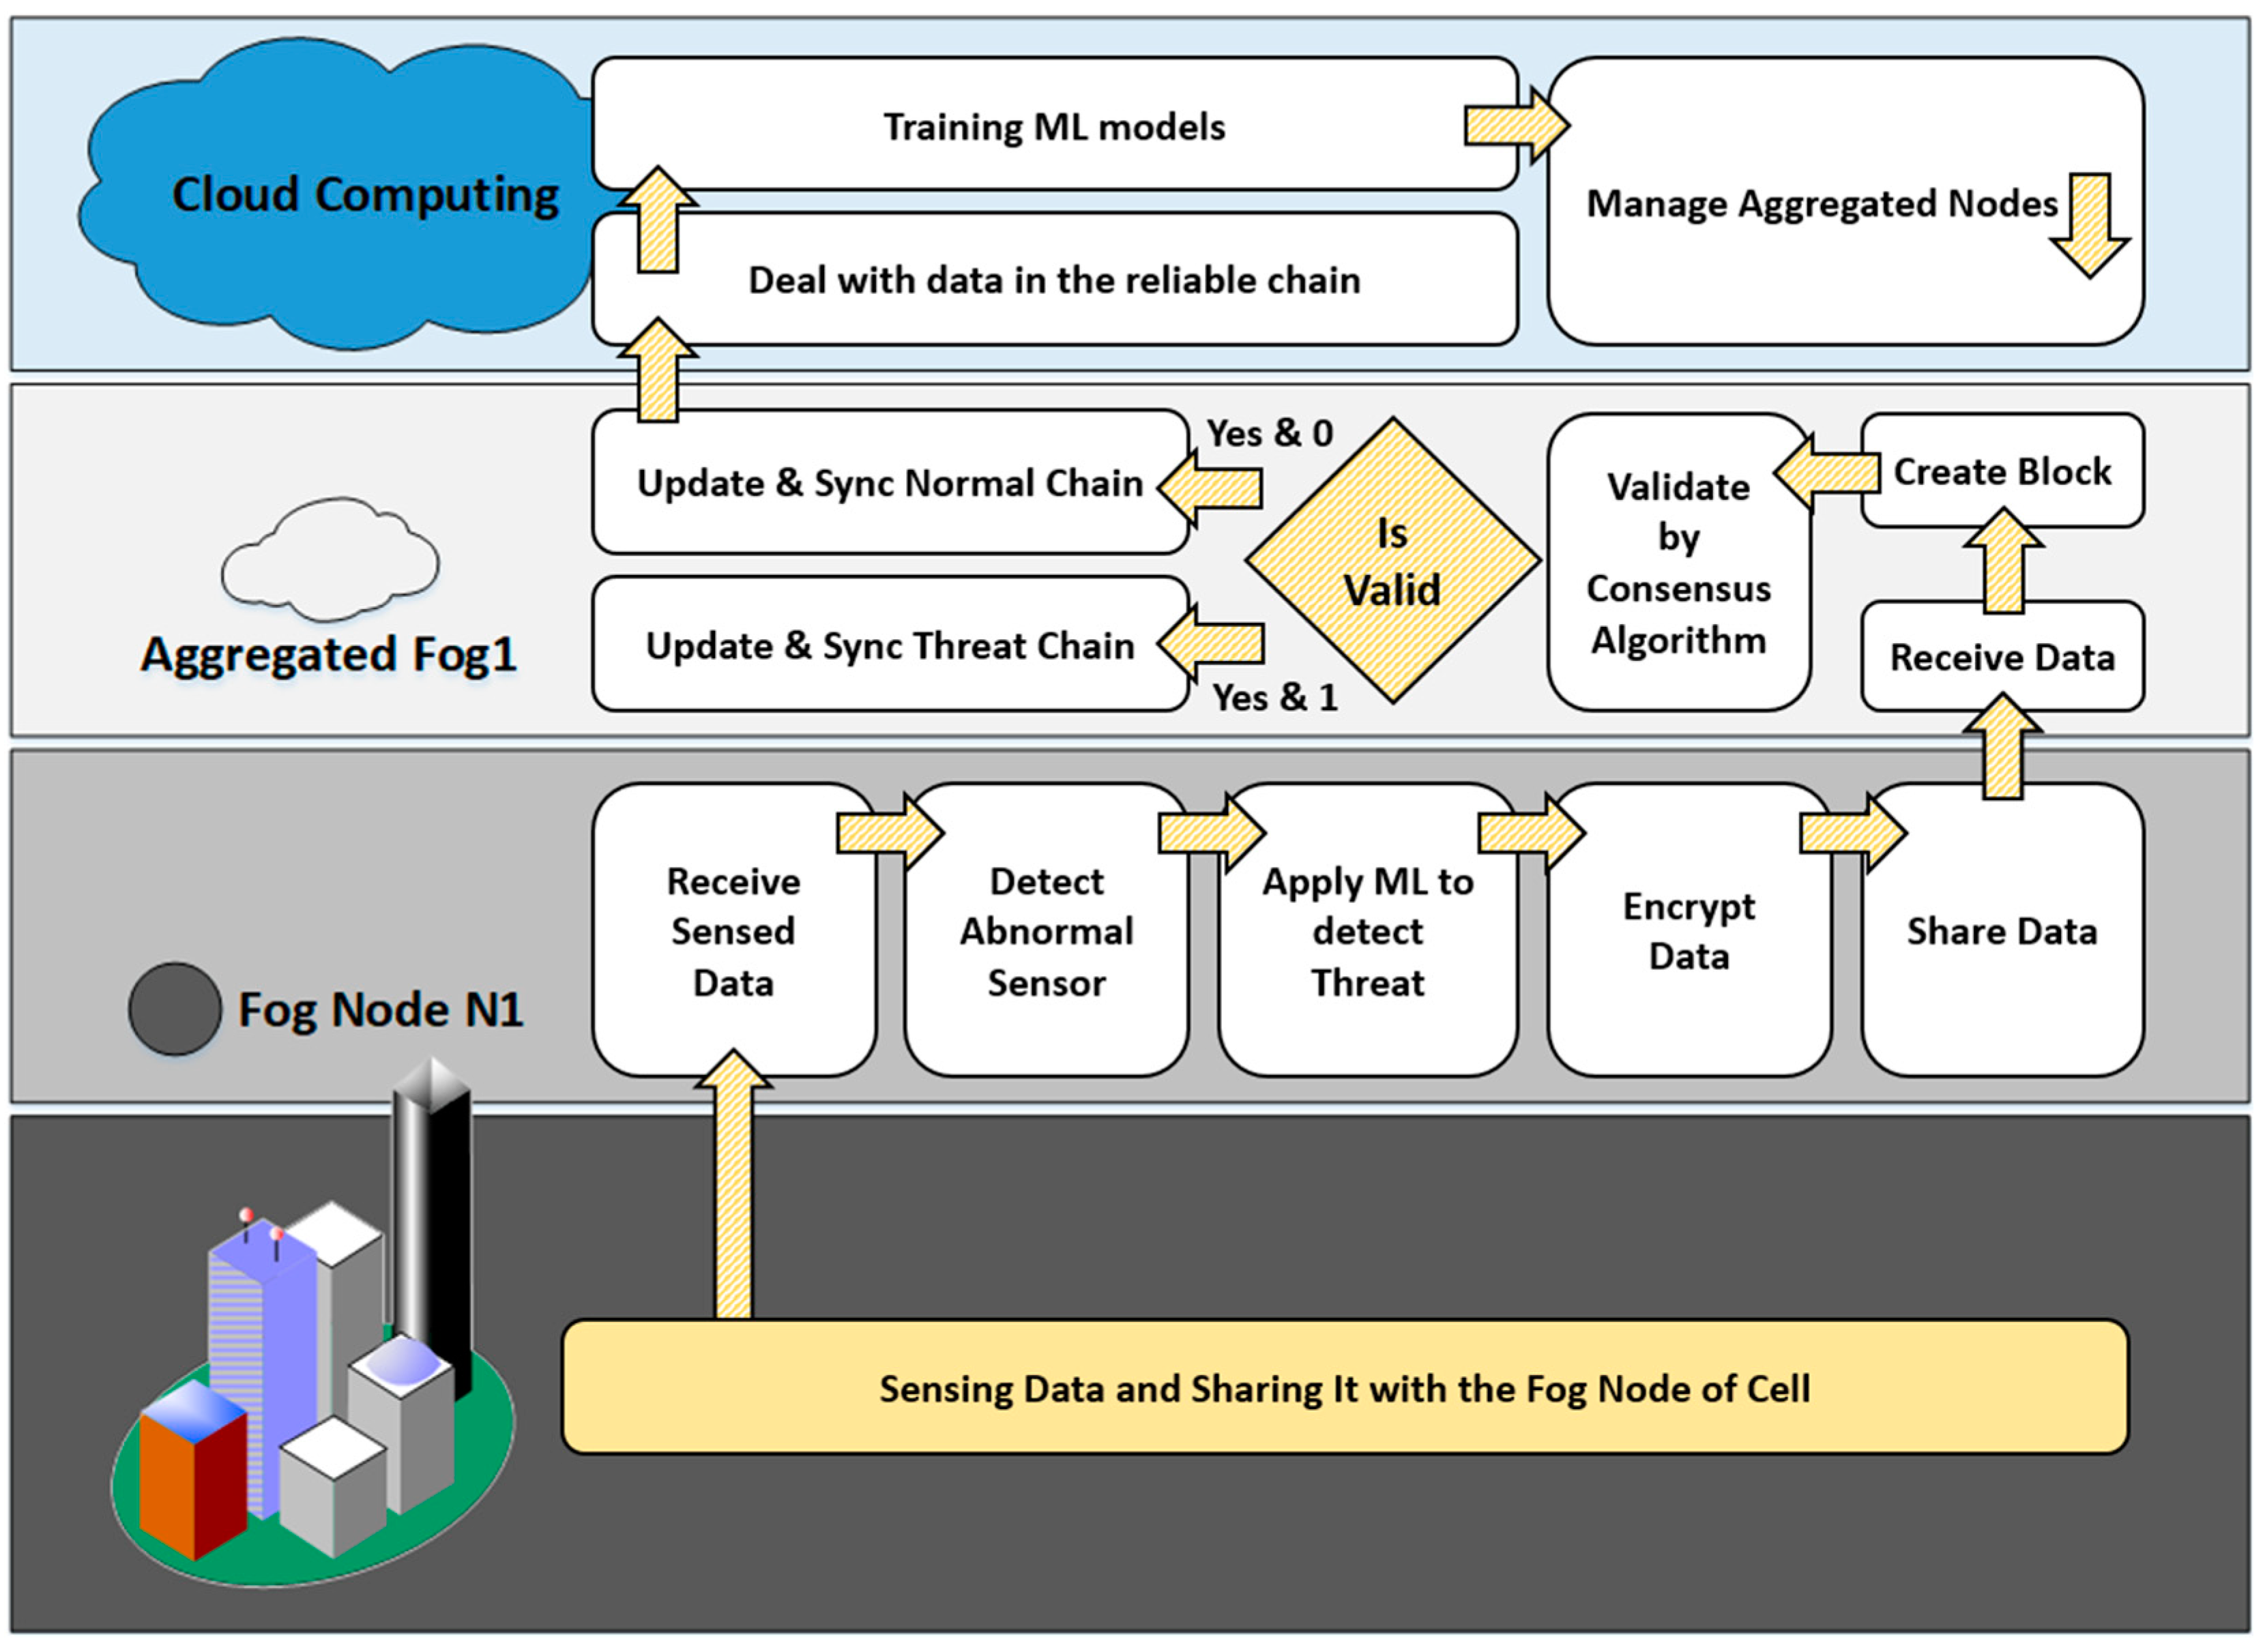
DYNAMIC INTERACTION and RESPONSE MECHANISM
1. Blockchain Logs
The blockchain successfully logged the sensed data and class predictions for all the sensors, providing an immutable record of the processed data. When sensor 3 malfunctioned, the blockchain detected the lack of activity and logged it as an event.
2. Threats identification
The system automatically initiates a response protocol upon threat identification. The attack response and notification component alerts all layers and triggers immediate mitigation actions. Additionally, the system dispatches feedback to the ML manager to enable continuous progress in the detection of threats via the model.
In addition, this architecture involves four layers, as follows: the IoT perception layer, fog layer, aggregated fog layer, and cloud computing layer, to build a comprehensive, secure, and scalable system so that the system effectively monitors and responds to cyber threats in the IoT environment.
Figure 11 reveals that certain actions take place once the threats have been detected, and it shows how the system responds as soon as the attack is detected.
3. Dynamic Methodology Discussion
The enhanced model for data protection and the increased reliability of IoT applications is based on ML and blockchain. ML relies on data to create trained models and, thus, more intelligent services and new applications. However, to ensure the accuracy of the data and, therefore, the accuracy of the trained models, the reliability and validity of the training data must be ensured, in addition to the necessity of protecting the roles resulting from the training.
To achieve this, we proposed an enhanced protection model based on ML and blockchain, in a new way that is suitable for general IoT applications and is specifically for applications involving WSNs.
Therefore, we have two stages of protection: the first stage involves the protection of data in the upward direction from the sensor layer to the cloud layer and then the applications; the second stage involves the protection of the rules resulting from training on historical data in the cloud, which will be sent to the fog layer.
The proposed enhanced model is based on several levels of protection, as described in the following steps:
(1)
Statistical level (fog layer);
(2)
Automated level (fog layer);
(3)
Encryption (fog layer);
(4)
Consensus verification (fog and aggregated fog);
(5)
Availability level (aggregated fog layer);
(6)
Permanent storage level (cloud layer).
In the second stage, after training on classified historical data (normal cases chain and threat cases chain), we produce new protection roles (the proposed training model was published in our previous research [27]). A new block is created with the resulting rules that achieved an acceptable accuracy rate and is sent to the aggregated fog nodes, which in turn add it to the chain of roles using the traditional PoW in the blockchain. Then, it is distributed to the fog nodes to be used in the classification process.

6. Discussion

A.
Model Performance
The model achieved a reasonable level of accuracy of approximately 98% when classifying the sensed data from several sensors. The overall model performance showed a high level in detecting benign behavior (class 0) or attacked behavior (class 1). For instance, in all the classifications of class detection, the model was able to successfully detect the true class with all sensors from 1 to 5.
B.
Robustness to Malfunctions
While the system successfully distinguished a malfunction in sensor 3, the model flagged this malfunction as obvious. This indicates a need for future work to integrate more advanced anomaly detection methods to enable real-time identification of such sensor failures.
Algorithm 1 explains the proposed deep learning (DL) and blockchain-based integration to secure IoT systems.
Algorithm 1 applies predictions using the test dataset. Thus, each prediction with its confidence level is logged and hashed into the blockchain to ensure data security. This step boosts the transparency and reliability of the entire IoT attack detection system. With blockchain integration, the hybrid framework guarantees that as soon as each entry is logged, it cannot be changed and can thus become more rigorous and trustworthy in an IoT environment.
C.
Proposed Cyberattack Detection Method and Algorithm Discussion
Algorithm 1. IoT Attack Detection with Enhanced Blockchain Logging
  • Clear R environment memory
  • Set working directory to the current script location
  • Load necessary libraries (H2O, GA, digest)
  • Start H2O JVM with specified settings (8 threads, 4GB max memory)
  • Remove any previous objects from H2O cluster
  • Import training, validation, and test datasets from CSV files
  • Convert the label column to a factor for classification purposes
  • Define response and predictor variables
  • Configure deep learning model parameters
  • Train the model on the training set and validate on the validation set
  • function HASH_DATA(data)
  • hash ← SHA-256(data) ▹ The SHA-256 hash function: H(x)=digest(x,"sha256")
  • return hash
  • end function
  • function LOG_TO_BLOCKCHAIN(prediction, confidence, data_hash)
  • signature ←Sks (data_hash) ▹ Cryptographic signing: Sks (m)=sign(m,ks )
  • timestamp ← GetCurrentTimestamp()     ▹ Temporal information:
  • block ← {prediction, confidence, signature, timestamp} ▹ Block structure: block = {prediction, confidence, signature, timestamp}
  • blockHash ← SHA-256(block)     ▹ Hashing the block: blockHash = H(block)
  • Add blockHash to Blockchain blockchain   ▹ Adding the block hash to the blockchain
  • end function
  • Perform predictions on the test dataset
  • Convert predictions to a data frame
  • for each row in predictions.df do
  •   Extract prediction and confidence
  •   Compute hash of the data point
  •   Log the prediction, confidence, and hash to the blockchain
  • end for
  • Print out all data hashes
Algorithm 2 shows the hybrid framework functionality and how the blockchain increases the sophistication of the IoT attack detection systems using specific mathematical notation and blockchain logging.
Algorithm 2. Blockchain-Enhanced IoT Attack Detection System with Mathematical Notations and Enhanced Blockchain Logging.
1:
IoT Layer:
2:
Devices collect and send raw data to clusters for pre-processing.
3:
Fog Layer:
4:
Fog nodes receive pre-processed data.
5:
Local AI predictors perform initial threat detection.
6:
Detected threats are logged by the Fog Blockchain Security Manager.
7:
Cloud Layer:
8:
Aggregated and refined data are sent to the Cloud Layer.
9:
Deep Learning Model Training:
10:
Import training, validation, and test datasets from CSV files.
11:
Convert 'label' column to a factor for classification.
12:
Define response and predictor variables.
13:
Configure deep learning model parameters.
14:
Train the model on the training set and validate on the validation set.
15:
function CREATEMODEL(input_size, hidden_layers)
16:
  Define model M with input size I, hidden layers H, parameters P.
17:
  Model structure: M(x;P,H) = σ(W⋅x+b).
18:
  Return Model M.
19:
end function
20:
Blockchain Recording and Global Threat Analysis:
21:
Each detected threat di ∈ D is recorded as a transaction T(di) on the blockchain.
22:
function HASH_DATA(data)
23:
  hash ← SHA-256(data) ▹ The SHA-256 hash function: H(x)=digest(x,"sha256")
24:
  return hash
25:
end function
26:
function LOG_TO_BLOCKCHAIN(prediction, confidence, data_hash)
27:
  signature ←Sks (data_hash) ▹ Cryptographic signing: SKs (m)=sign(m,ks)
28:
  timestamp ← GetCurrentTimestamp() ▹ Temporal information
29:
  block ← {prediction, confidence, signature, timestamp} ▹ Block structure: block =
{prediction, confidence, signature, timestamp}
30:
  blockHash   ← SHA-256(block) ▹ Hashing the block: blockHash = H(block)
31:
  Add blockHash to Blockchain   ▹ Adding the block hash to the blockchain
32:
end function
33:
Perform predictions on the test dataset.
34:
Convert predictions to a data frame.
35:
for each row in predictions.df do
36:
  Extract prediction and confidence.
37:
  Compute hash of the data point.
38:
  Log the prediction, confidence, and hash to the blockchain.
39:
end for
40:
Print out all data hashes.
41:
Smart Contracts for Automated Response:
42:
Smart contracts S are predefined with conditions {c1,c2,...,cn} and responses {r1,r2,...,rn}.
43:
For each new transaction T, smart contracts evaluate: S(T)= {rj|cj(T) = true}.
true⇒{trigger responses rj where cj (T)=true}.
44:
Triggered responses rj are automatically executed to mitigate threats.
45:
Attack Response and Notification:
46:
System-wide notifications are dispatched.
47:
Feedback from the response phase is used to fine-tune models.
48:
Compliance and Reporting:
49:
All actions and detected threats are logged for compliance and auditing.
50:
Cleanup:
51:
Optionally shut down H2O cluster.

7. Conclusions

In conclusion, our IoT hybrid anomaly detection framework effectively classified data in real time, thereby making use of the combination of deep learning and blockchain to secure data logging. This hybrid framework illustrated its ability to respond efficiently in the case of sensor malfunctions by halting data collection and logging the event. Evaluation metrics, such as the accuracy, precision, time response, and loss function, provided evidence of our framework’s trustworthiness and reliability. Comparative evaluations with existing methods, including lightweight blockchain and deep learning approaches, confirmed our framework’s superior performance, achieving 98% accuracy against their 94–97% under varied conditions like diverse attack types (e.g., DDoS, MITM) and network sizes (5–50 sensors). This validates its scalability and adaptability for real-world IoT applications. To validate our hybrid framework’s ability to detect real-world anomalies successfully, a test scenario was conducted within sensor 3, which was intentionally switched off so that the behavior of the hybrid framework toward this malfunction could be monitored. Interestingly, the hybrid framework did successfully identify this malfunction, revealing its effectiveness in detecting and responding to real-world attacks. To further assess the performance of our hybrid framework, we plan to evaluate its performance with a large number of users.
Other future works may include the following:
  • Anomaly detection enhancements: More sophisticated anomaly detection models to detect sensor malfunctions should be implemented.
  • Model optimization: Further tuning of the deep learning model, including hyperparameters and architecture improvements, is required.
  • Blockchain integration: The blockchain functionality should be extended to automatically trigger alerts upon detecting sensor malfunctions or data anomalies, in addition to creating another chain for roles and models.

Author Contributions

Conceptualization, A.M.A., A.B.A., M.K., F.E., A.A.A.S. and A.H.; Methodology, A.M.A., A.B.A., M.K., F.E. and A.A.A.S.; Validation, A.B.A., M.K., F.E. and A.H.; Investigation, M.K.; Writing—original draft, A.M.A. and A.A.A.S.; Writing—review & editing, A.M.A., A.B.A., M.K., F.E., A.A.A.S. and A.H.; Supervision, A.B.A., F.E. and A.A.A.S.; Project administration, M.K. All authors have read and agreed to the published version of the manuscript.

Funding

This research received no external funding.

Institutional Review Board Statement

Not applicable.

Informed Consent Statement

Not applicable.

Data Availability Statement

Data is contained within the article.

Conflicts of Interest

The authors declare no conflict of interest.

References

  1. Balaji, S.; Nathani, K.; Santhakumar, R. IoT technology, applications and challenges: A contemporary survey. Wirel. Pers. Commun. 2019, 108, 363–388. [Google Scholar] [CrossRef]
  2. Costa, F.; Genovesi, S.; Borgese, M.; Michel, A.; Dicandia, F.A.; Manara, G. A review of RFID sensors, the new frontier of internet of things. Sensors 2021, 21, 3138. [Google Scholar] [CrossRef] [PubMed]
  3. Andriulo, F.C.; Fiore, M.; Mongiello, M.; Traversa, E.; Zizzo, V. Edge Computing and Cloud Computing for Internet of Things: A Review. Informatics 2024, 11, 71. [Google Scholar] [CrossRef]
  4. Ogonji, M.M.; Okeyo, G.; Wafula, J.M. A survey on privacy and security of Internet of Things. Comput. Sci. Rev. 2020, 38, 100312. [Google Scholar] [CrossRef]
  5. Hussain, A.; Ali, T.; Althobiani, F.; Draz, U.; Irfan, M.; Yasin, S.; Alqhtani, S. Security framework for IoT based real-time health applications. Electronics 2021, 10, 719. [Google Scholar] [CrossRef]
  6. Abi Sen, A.A.; Eassa, F.A.; Jambi, K.; Yamin, M. Preserving privacy in internet of things: A survey. Int. J. Inf. Technol. 2018, 10, 189–200. [Google Scholar] [CrossRef]
  7. Ali, I.A.; Bukhari, W.A.; Adnan, M.; Kashif, M.I.; Danish, A.; Sikander, A. Security and privacy in IoT-based Smart Farming: A review. Multimed. Tools Appl. 2024, 1–61. [Google Scholar] [CrossRef]
  8. Fabrègue, B.F.G.; Bogoni, A. Privacy and Security Concerns in the Smart City. Smart Cities 2023, 6, 586–613. [Google Scholar] [CrossRef]
  9. Madhusudhan, R.; Surashe, S.V. Privacy and security comparison of web browsers: A review. In International Conference on Advanced Information Networking and Applications; Springer International Publishing: Cham, Switzerland, 2022; pp. 459–470. [Google Scholar]
  10. Zhang, Y.; Wu, S.; Jin, B. A secure and privacy-aware framework for IoT based on edge and fog computing. Future Gener. Comput. Syst. 2023, 148, 110–122. [Google Scholar]
  11. Ju, Z.; Zhang, H.; Li, X.; Chen, X.; Han, J.; Yang, M. A survey on attack detection and resilience for connected and automated vehicles: From vehicle dynamics and control perspective. IEEE Trans. Intell. Veh. 2022, 7, 815–837. [Google Scholar] [CrossRef]
  12. Chen, M.; Challita, U.; Saad, W.; Yin, C.; Debbah, M. Artificial neural networks-based machine learning for wireless networks: A tutorial. IEEE Commun. Surv. Tutor. 2019, 21, 3039–3071. [Google Scholar] [CrossRef]
  13. Batista, A.J.; Campello, R.J.; Sander, J. Active semi-supervised classification based on multiple clustering hierarchies. In Proceedings of the IEEE International Conference on Data Science and Advanced Analytics (DSAA), Montreal, QC, Canada, 17–19 October 2016; pp. 11–20. [Google Scholar]
  14. Pang, G.; Shen, C.; Cao, L.; Hengel, A.V.D. Deep learning for anomaly detection: A review. ACM Comput. Surv. (CSUR) 2021, 54, 1–38. [Google Scholar] [CrossRef]
  15. Christidis, K.; Devetsikiotis, M. Blockchains and smart contracts for the Internet of things. IEEE Access 2016, 4, 2292–2303. [Google Scholar] [CrossRef]
  16. Okfie, M.I.H.; Mishra, S. Anomaly Detection in IIoT Transactions using Machine Learning: A Lightweight Blockchain-based Approach. Engineering. Technol. Appl. Sci. Res. 2024, 14, 14645–14653. [Google Scholar] [CrossRef]
  17. Alsharif, N.A.; Mishra, S.; Alshehri, M. IDS in IoT using Machine Learning and Blockchain. Engineering. Technol. Appl. Sci. Res. 2023, 13, 11197–11203. [Google Scholar] [CrossRef]
  18. Abusitta, A.; de Carvalho, G.H.; Wahab, O.A.; Halabi, T.; Fung, B.C.; Al Mamoori, S. Deep learning-enabled anomaly detection for IoT systems. Internet Things 2023, 21, 100656. [Google Scholar] [CrossRef]
  19. Guo, L. Application of blockchain-based deep learning algorithm in the enterprise Internet of Things system. Mob. Inf. Syst. 2022, 2022, 9943452. [Google Scholar] [CrossRef]
  20. Shafay, M.; Ahmad, R.W.; Salah, K.; Yaqoob, I.; Jayaraman, R.; Omar, M. Blockchain for deep learning: Review and open challenges. Clust. Comput. 2023, 26, 197–221. [Google Scholar] [CrossRef]
  21. Khan, M.A.; Abbas, S.; Rehman, A.; Saeed, Y.; Zeb, A.; Uddin, M.I.; Ali, A. A machine learning approach for blockchain-based smart home network security. IEEE Netw. 2020, 35, 223–229. [Google Scholar] [CrossRef]
  22. Kumar, P.; Kumar, R.; Kumar, A.; Franklin, A.A.; Garg, S.; Singh, S. Blockchain and deep learning for secure communication in digital twin-empowered industrial IoT network. IEEE Trans. Netw. Sci. Eng. 2022, 10, 2802–2813. [Google Scholar] [CrossRef]
  23. Gadekallu, T.R.; Manoj, M.K.; Kumar, N.; Hakak, S.; Bhattacharya, S. Blockchain-based attack detection on machine learning algorithms for IoT-based e-health applications. IEEE Internet Things Mag. 2021, 4, 30–33. [Google Scholar] [CrossRef]
  24. Kumar, P.; Kumar, R.; Srivastava, G.; Gupta, G.P.; Tripathi, R.; Gadekallu, T.R.; Xiong, N.N. PPSF: A privacy-preserving and secure framework using blockchain-based machine learning for IoT-driven smart cities. IEEE Trans. Netw. Sci. Eng. 2021, 8, 2326–2341. [Google Scholar] [CrossRef]
  25. Sharma, M.; Pant, S.; Kumar Sharma, D.; Datta Gupta, K.; Vashishth, V.; Chhabra, A. Enabling security for the Industrial Internet of Things using deep learning, blockchain, and coalitions. Trans. Emerg. Telecommun. Technol. 2021, 32, e4137. [Google Scholar] [CrossRef]
  26. Rathore, S.; Park, J.H.; Chang, H. Deep learning and blockchain-empowered security framework for intelligent 5G-enabled IoT. IEEE Access 2021, 9, 90075–90083. [Google Scholar] [CrossRef]
  27. Almasabi, A.M.; Khemakhem, M.; Eassa, F.; Abi Sen, A.A.; Alkhodre, A.B.; Harbaoui, A. A Smart Framework to Detect Threats and Protect Data of IoT based on Machine Learning. IEEE Access 2024, 12, 176833–176844. [Google Scholar] [CrossRef]
Figure 1. The proposed architecture of hybrid testing and protection framework.
Information 16 00406 g001
Figure 2. Methodology process architecture with blockchain integration.
Information 16 00406 g002
Figure 3. Sensor 1 data.
Information 16 00406 g003
Figure 4. Sensor 2 and 3 data.
Information 16 00406 g004
Figure 5. Sensor 4 data.
Information 16 00406 g005
Figure 6. Comparison of results for DL, SVM, RF, DT, and Log R.
Information 16 00406 g006
Figure 7. Model loss function.
Information 16 00406 g007
Figure 8. Confusion matrix of accuracy and precision.
Information 16 00406 g008
Figure 9. Confusion matrix of the model.
Information 16 00406 g009
Figure 10. Accuracy across varied conditions [16,17,19].
Information 16 00406 g010
Figure 11. Interaction and response of threat detection mechanism framework.
Information 16 00406 g011
Table 1. This summarizes the diverse deep learning and blockchain methodologies in the IoT environment.
Techniques UsedFeature FocusKey FindingsLimitation
Deep learning (DL) and blockchain in IoT networks [19]The accuracy and time efficiency of the Internet of Things system were improved, and the burden of the system operators was greatly reducedThey used a base of 3 layers to integrate the application and the network’s IoT.It lacks certain protection mechanisms.
Blockchain-based deep neural networks (DLs) in clinical, and biomarker datasets within IoT environment [20]To monitor classification and assess the response time and accuracyThey enhanced the speed and delivery of healthcare data in a healthcare management system. The method reached accurate (98%) responses to the query.
Blockchain needs to more effectively record addresses via DL or ML.
Deep extreme learning machine (DELM)-based system, along with blockchain (involving privacy and security) in IoT [21]To evaluate its reliability, privacy, integrity, and accessibility They introduced simulation results to estimate the overhead distribution, processing time, and energy. The results were marginal in terms of their protection and privacy benefits.
The result demonstrated 93.91% accuracy.
Integration of digital twin (DT), deep learning, and blockchain in IIoT along with the long short-term memory–sparse autoencoder (LSTMSAE) technique [22]To ensure the integrity and authenticity of data, DL-based IDS was compared with three contemporary ML techniques, namely naive Bayes (NB), decision tree (DT) and random forest (RF), with values of 99.65%, 99.14%, 94.88%, and 95.77%They associated a long short-term memory–sparse autoencoder (LSTMSAE) technique with DL to learn the spatial–temporal representation. A multi-head self-attention (MHSA)-based bidirectional gated recurrent unit (BiGRU) algorithm was used to learn long-distance features and accurately detect attacks. It lacks the integration of federated learning in digital twin-enabled networks.
Machine learning (ML) along with blockchain (BC) [23]To secure IoT data integrityThey used BC to secure IoT devices in e-health apps, whereas ML was used for training purposes. It needs to focus more on feasibility checks with a different consensus for large scenarios that consider processing time, power, and data resources.
Blockchain-based machine learning in IoT-driven smart cities using gradient-boosting anomaly detector (GBAD) for evaluation privacy [24]To preserve privacy and data integrityThey used a two-level privacy scheme and an intrusion detection scheme, and they used principal component analysis (PCA) to transfer raw IoT data into a novel phase. This model detected diverse attacks with an average of 91%.
Blockchain and deep learning associated with coalition formation theory in IIotT [25]To keep the IIoT network sufficiently secureThey used a proof-of-reliance algorithm to enhance computational difficulties. The algorithm boosted the complexity of computation. Real-world IIoT apps need to be applied.
Deep learning (DL) along with blockchain (BC) in 5G-enabled IoT [26]To enhance the user experience and quality of service (QoS) They made use of DL competency for an intelligent data analysis operation and blockchain for data security.The traditional data analytics and security methods that were used are inadequate for 5G-enabled IoT due to their distinct need for low latency and high throughput.
Deep learning along with blockchain technique [27]To enhance security in IoT environment using six levels of detection and upward and downward direction among four layers to ensure and simulate a real-time IoT environmentOur hybrid makes use of a combination of two significant algorithms, deep learning and blockchain.We successfully achieved 100% accuracy, precision, recall, and F1 score rate. We applied five different machine learning models (DL, SVM, RF, DT, and Log R). Each model achieved a different performance level. DL was the best, with 100%.
Table 2. Advantages and disadvantages for all models.
ModelAdvantagesDisadvantages
DL (ANN)High accuracy, excels at modeling complex relationships, adaptable to diverse and high-dimensional data types.Requires substantial data and computational resources for training, less interpretable due to its “black box” nature.
SVMEffective in high-dimensional spaces, robust to overfitting with proper kernel choice.Kernel selection can be challenging, may not scale efficiently with very large datasets
RFHandles missing values well, reduces overfitting via ensemble learning, provides feature importance insights.Slower training and prediction with many trees, less effective on sparse or highly complex data
DTEasy to interpret, fast to train and predict, handles both numerical and categorical data.Prone to overfitting with deep trees, may not generalize as well to complex patterns.
Log RSimple to implement, interpretable, quick to train on smaller datasetsAssumes linear relationships, underperforms with complex, non-linear data
Table 3. Accuracy, precision, recall, and F1 score metrics for all models.
TPTNFPFNAccuracyPrecisionRecallF1 Score
DL2511239833470.980.990.980.98
SVM77868522150.980.970.980.98
RF75568135190.960.960.980.97
DT75368037200.960.950.970.96
LogR72964971510.920.910.930.92
Table 4. Comparison with state-of-the-art methods.
MethodAccuracyF1 ScoreScore Detection Time (ms)Key Features
Proposed Framework98%98%16–19DL + Blockchain, layered architecture
Lightweight Blockchain [16]95%94%15–20K-means + Blockchain, lightweight
RF + Blockchain [17]94%93%20–25Random Forest + Blockchain
Denoising Autoencoder [18]97%97%20–25Deep learning, no blockchain
Disclaimer/Publisher’s Note: The statements, opinions and data contained in all publications are solely those of the individual author(s) and contributor(s) and not of MDPI and/or the editor(s). MDPI and/or the editor(s) disclaim responsibility for any injury to people or property resulting from any ideas, methods, instructions or products referred to in the content.

