Article

Optimizing YouTube Video Visibility and Engagement: The Impact of Keywords on Fisheries’ Product Campaigns in the Supply Chain Sector

by
Emmanouil Giankos
1,
Nikolaos T. Giannakopoulos
2,* and
Damianos P. Sakas
2
1
Department of Radiology—Radiotherapy, University of Western Attica, 122 43 Athens, Greece
2
BICTEVAC LABORATORY—Business Information and Communication Technologies in Value Chains Laboratory, Department of Agribusiness and Supply Chain Management, School of Applied Economics and Social Sciences, Agricultural University of Athens, 118 55 Athens, Greece
*
Author to whom correspondence should be addressed.
Information 2025, 16(5), 353; https://doi.org/10.3390/info16050353
Submission received: 26 March 2025 / Revised: 21 April 2025 / Accepted: 25 April 2025 / Published: 27 April 2025
(This article belongs to the Section Information Applications)

Abstract

:
YouTube has emerged as a powerful platform for digital content distribution, particularly in niche sectors such as fisheries and environmental sustainability. This study examines the impact of specific keywords on video visibility and engagement, focusing on fishery-related YouTube channels within the broader supply chain context. Using a statistical analysis with R software, this study isolates the influence of keywords while controlling for macro-characteristics such as video duration, title length, and description length. The findings reveal that while most structural video attributes do not significantly impact views, keyword optimization in video titles is crucial in improving discoverability. Additionally, a positive correlation between views and user engagement (likes) is confirmed, highlighting the role of interaction in content promotion. These insights provide actionable recommendations for content creators seeking to enhance their digital outreach while offering theoretical contributions to search engine optimization (SEO) and social media marketing strategies.

Graphical Abstract

1. Introduction

1.1. Information on Fisheries’ SEO Video Visibility

SEO involves both technical and strategic efforts to enhance the ranking of web pages on platforms like Google, which serve as the main tools users rely on to find content relevant to their interests. Thus, a higher ranking in the resulting index pages is very likely to lead to an increase in traffic to a particular website and, consequently, to more sales that translate into profits and revenue [1].
While the general principles of SEO focus on enhancing digital visibility across industries, their relevance becomes especially pronounced within specialized sectors such as fisheries and supply chain marketing. In these contexts, video-based communication through platforms like YouTube allows fishery organizations to disseminate product information, promote sustainable practices, and enhance market competitiveness. Given the global shift toward sustainable and traceable seafood sourcing, the strategic optimization of YouTube content, through keyword-rich titles, metadata, and user engagement, can serve as a critical enabler of visibility, customer trust, and supply chain transparency. Therefore, applying SEO practices specifically to YouTube video campaigns is not only a digital marketing tactic but also a means of fostering informed consumer behavior and policy support within the fishery supply chain.
Traffic generated through SEO practices is commonly known as organic search traffic, setting it apart from paid methods. In contrast, traffic gained via payment-based strategies is typically labeled as search engine marketing (SEM) or pay-per-click (PPC). The ability to optimize search engine performance represents perhaps the most fundamental area of online marketing, as searching, as mentioned above, is the main way in which internet users navigate the web [2].
To understand this, it should be noted that the first result shown for a basic search query typically receives approximately 40–60% of the total traffic for that query. Consequently, the second and third positions attract considerably less user attention. Additionally, only about 2–3% of users continue browsing beyond the first page of results [3]. External links from other websites significantly impact a page’s ranking, as each link functions as a vote of trust or quality. Generally, site owners avoid linking to low-quality pages, reinforcing the importance of reputable backlinks [1].
Furthermore, search engines can evolve on their own by collecting and learning from users’ search behaviors, allowing them to display search results even before keyword typing is completed [2]. Essentially, the importance of a website increases as it receives more links from other websites [1].
It is reasonable to conclude that even the slightest improvement in search engine ranking will potentially lead a website, such as that of a company, to receive more user traffic and, consequently, more business and profits. As a result, numerous businesses and website administrators take deliberate actions to enhance their placement in search engine listings, aiming to surpass their competitors on the search engine results page (SERP) [4]. In essence, search engine optimization entails refining the three fundamental components of search engine algorithms to achieve better positioning in search results [2].
The growing reliance on YouTube as a digital marketing and content distribution platform necessitates a more comprehensive insight into the elements influencing how videos drive engagement and visibility. While previous research has examined aspects such as video duration, keyword relevance, and audience interaction, most studies have analyzed these factors in isolation rather than as an interconnected framework [5,6]. Furthermore, YouTube’s evolving algorithmic recommendations require continuous adaptation from content creators and marketers, making it imperative to identify the most statistically significant factors influencing video rankings and user engagement [7].
Despite increasing research in SEO-driven video optimization, there remains a lack of empirical evidence on how video-specific attributes—such as metadata, keyword density, and audience engagement—work together to influence content visibility [8]. The current literature has yet to comprehensively model the simultaneous effects of these factors, particularly in the context of machine-learning-driven content curation [9].
RQ: How do video attributes—including duration, keyword optimization, metadata length, and engagement metrics—interact to shape video viewership and algorithmic ranking on fishing companies’ YouTube channels?
The above research question seeks to fill the gap between content optimization strategies and algorithm-driven audience engagement, offering a holistic approach to understanding YouTube’s recommendation system [10]. By addressing this gap, the study will provide practical insights for online marketing professionals, video producers, and platform planning specialists seeking to improve visibility and audience engagement in a competitive video-sharing ecosystem [11].
The structure of this paper follows a systematic approach to analyzing the impact of YouTube marketing strategies on fisheries’ product campaigns within the supply chain. The Introduction presents the study’s background, emphasizing the role of influencer engagement, online shopping behavior, and keyword optimization in video marketing. The Materials and Methods section details the questionnaire design, including the development of targeted survey questions and the data collection process using stratified random sampling and YouTube analytics tools. The Results and Discussion section focuses on statistical analysis, where regression models and correlation tests evaluate the relationships between video attributes and audience engagement. Finally, the Conclusions section sums up the main practical and theoretical findings of the paper.

1.2. Importance of YouTube Platforms’ Marketing

YouTube has evolved into one of the most influential digital platforms, significantly shaping online marketing and consumer engagement. Initially founded in 2005, YouTube was acquired by Google in 2006, enabling rapid expansion and integration into the digital advertising ecosystem. As a globally accessible platform, YouTube enables individuals to freely upload videos, view content, leave comments, and share media with others, distinguishing it from other video-hosting services due to its user-friendly accessibility and extensive reach [12]. The democratization of content creation has led to the rise of professional bloggers and YouTubers who have transformed video sharing into a lucrative career. Many YouTubers have amassed millions of subscribers, leveraging their influence for brand collaborations and monetization [13,14].
Over the past few years, YouTube has emerged as a key pillar in the landscape of digital marketing, especially with the increased adoption of influencer-based advertising. The platform’s diverse advertising formats include bumper ads, TrueView discovery ads, and TrueView in-stream ads, each tailored to different consumer engagement strategies [15]. Bumper ads are short, non-skippable advertisements appearing before a video, maximizing brand exposure in a concise format. TrueView discovery ads appear in search results when users look for videos, aligning ad content with user intent. Meanwhile, TrueView in-stream ads are longer advertisements played before, during, or after videos, allowing users the option to skip after a few seconds [16].
Beyond these conventional advertising methods, YouTube’s role in influencer marketing has grown significantly. Many companies now prefer to market their brands and products through collaborations with YouTube content creators, leveraging their established audience trust and engagement [17]. Influencer partnerships have been particularly effective in reaching younger demographics, as Gen Z and Millennials tend to perceive influencer recommendations as more credible compared to traditional advertising [18]. Furthermore, AI-driven algorithms now optimize ad placements, ensuring brands reach the most relevant audiences based on user behavior and preferences [19].
Given these developments, YouTube marketing continues to evolve, integrating data analytics, AI-powered recommendations, and influencer-driven branding strategies to enhance consumer engagement and conversion rates. Future research should explore how emerging trends such as short-form content (e.g., YouTube Shorts), AI-enhanced video personalization, and live-stream commerce will shape the next phase of YouTube’s marketing landscape [20].

1.3. Fisheries’ Product Campaigns in the Supply Chain Context

Fisheries play a critical role in global supply chains, with both consumable and industrial fishery products contributing to trade dynamics. For example, while the U.S. typically imports more consumable fishery goods, it exports significantly more industrial fish products, underscoring the sector’s economic importance [21]. To broaden consumer reach, fisheries must innovate in packaging and product presentation, such as offering dried or pre-cut options, while also addressing ecological and regulatory challenges [22,23]. According to Love et al. [21], achieving improvements in seafood production requires coordinated changes across the supply chain, from producers to end consumers. Sustainable consumption can be promoted through better education, government support, and clear labeling, empowering consumers to choose responsibly sourced seafood [24,25].
Moreover, applying SEO strategies to YouTube marketing campaigns can help fisheries raise awareness, increase consumer trust, and expand visibility. This digital engagement provides additional market value by enhancing transparency, enabling traceability, and connecting producers directly with informed audiences [26,27,28]. Given the limited adoption of certification schemes like the Marine Stewardship Council among small-scale fisheries, digital outreach via platforms like YouTube offers a viable alternative for promoting sustainability while supporting supply chain competitiveness [29,30,31].

1.4. Research Hypotheses Development

With the increasing influence of digital platforms, understanding the factors that drive video engagement and visibility on YouTube is crucial for content creators, marketers, and businesses. Video performance is determined by several attributes, including video age, duration, title and description structure, keyword relevance, and audience interaction metrics [14,32]. The hypotheses formulated in this study aim to examine these relationships, identifying the essential measurable elements that influence how well YouTube videos perform. By analyzing the statistical significance of these attributes, this research provides valuable insights into content optimization strategies and algorithm-driven user engagement. The results are expected to enhance the comprehension of how YouTube’s algorithm prioritizes content, how viewers interact with different video elements, and how creators can optimize their videos to increase reach and engagement [6,32].
The formulated hypotheses explore the interplay between video characteristics, keyword relevance, and user engagement metrics in driving viewership.
H1: 
The length of time a video remains active (AGE) has a statistically significant, linear, and positive effect on the number of views (VIEWS).
This hypothesis aligns with studies highlighting that older videos tend to accumulate higher views over time due to sustained audience discovery, recommendations, and search engine indexing [8,32]. YouTube’s algorithm often promotes evergreen content, making video longevity an important determinant of visibility.
H2: 
The duration of a video (DURATION_SEC) has a statistically significant, linear, and negative effect on the number of views (VIEWS).
Prior research indicates that longer videos may experience higher dropout rates, reducing total watch time and audience retention [14]. Viewers tend to engage more with shorter, concise videos, particularly in competitive digital environments where attention spans are limited [12].
H3: 
The number of words in the title (TITLE_COUNT) has a statistically significant, linear, and negative effect on the number of views (VIEWS).
H4: 
The number of words in the description (DESC_COUNT) has a statistically significant, linear, and negative effect on the number of views (VIEWS).
Overly long titles and descriptions can reduce click-through rates (CTR), as viewers are less likely to engage with cluttered or overly detailed content [9]. Studies indicate that succinct, keyword-optimized titles and descriptions improve discoverability and enhance viewer engagement [10].
H5: 
There is (overall) a statistically significant relationship between keywords and video views.
H6: 
There are specific keywords that statistically determine video views.
Keywords play a vital role in YouTube’s SEO by affecting content discoverability, categorization, and ranking in search results [11]. Research highlights that videos optimized with trending and high-search-volume keywords tend to attract higher engagement and visibility [33].
H7: 
There is a statistically significant positive linear relationship between video views and the interaction they receive from users (“likes”).
Viewer engagement, measured through likes, shares, and comments, directly influences YouTube’s recommendation algorithm [34]. Videos that receive higher engagement metrics are more likely to be promoted by YouTube, leading to increased visibility and organic reach [13].

2. Materials and Methods

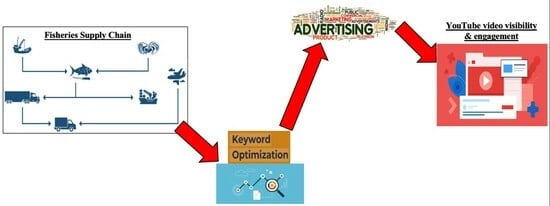
This research adopts a systematic approach to evaluate the influence of keyword usage on the efficiency of fishery product campaigns through YouTube, emphasizing supply chain marketing strategies [35]. The research follows a three-stage process: sample selection, data collection, and analytical procedures, including both summary-level statistics (descriptive) and linear regression modeling using the R software (version 4.1.0). This approach ensures a comprehensive understanding of the connection between features of YouTube videos and how viewers interact with them.
  • Sample Selection
The sample selection focuses on identifying YouTube channels that provide reliable fishery-related content, ensuring that the data accurately represent the seafood supply chain marketing landscape. The selection process involved targeting channels associated with sustainable fisheries, particularly those endorsed by recognized non-profit organizations such as FoodTank [36], which highlights organizations contributing to sustainable fisheries and responsible seafood marketing. To achieve a representative dataset, sixteen fishery-related organizations with an active YouTube presence and significant engagement in seafood supply chain awareness campaigns were selected [37]. These organizations have Marine Stewardship Council (MSC) certifications or actively promote sustainable fishing practices, aligning with global seafood sustainability efforts.
  • Data Gathering
Data collection was conducted using VIDIQ [38] software, a widely used YouTube analytics tool that evaluates content performance by extracting video metadata, audience interaction metrics, and keyword effectiveness. The dataset included all videos published by the selected YouTube channels, ensuring that the analysis captures longitudinal trends in seafood marketing [6]. The primary dependent variable in this study is total video views (VIEWS), serving as a key performance indicator (KPI) of audience engagement. Additional independent variables include video duration, title word count, description word count, and interaction metrics (e.g., likes and shares). These metrics allow for an in-depth assessment of YouTube marketing strategies and their effectiveness in promoting sustainable fisheries.
  • Statistical Analysis
The final stage of the methodology involves statistical analysis using R software, focusing on descriptive statistics and linear regression models. Descriptive statistics summarize the dataset’s characteristics, such as the distribution of video attributes, engagement metrics, and keyword frequency. Linear regression models examine the relationship between independent variables (e.g., keyword usage, video duration, engagement metrics) and dependent variables (e.g., video views, likes). This approach identifies the statistical significance of specific video characteristics in influencing audience engagement, providing insights into how keyword optimization affects YouTube’s algorithmic ranking and content visibility. The analysis also accounts for multicollinearity and model validation, ensuring the robustness of the results.
By integrating sample selection, data gathering, and statistical modeling, this research adds to the wider discourse on digital marketing in the seafood supply chain, offering empirical insights for content creators, marketers, and policymakers in sustainable fisheries and responsible seafood consumption campaigns.

2.1. Sample Selection

The aim of selecting the sample is to use YouTube channels that are considered equally reliable in providing fishery-related content. For this purpose, primary data were obtained from the globally recognized, non-profit food sustainability organization FoodTank [39], specifically focusing on sixteen (16) groups and organizations that have been highlighted for their notable contributions to sustainable fisheries and their active involvement across the entire fishery value chain [36]. It is important to note that all 16 groups maintain an active presence on YouTube. Initially, 16 organizations operating in the fishery and environmental communication sector were identified as potential data sources. However, following a preliminary screening process, 7 of these were excluded from the final dataset due to a lack of relevant content, inconsistent or shared YouTube channels, or technical limitations in retrieving publicly accessible metadata. Consequently, 9 organizations with dedicated, active, and thematically relevant YouTube channels were selected for final analysis.
To calculate the age of each video, the reference date was set as 3 May 2021, which marked the final day of data collection. This consistent cutoff point allowed for accurate measurement of the “AGE” variable, defined as the period in days from when the video was published to the chosen reference point.

2.2. Data Collection

Given the above, within this framework, information was gathered through the use of specific software of VIDIQ [38], which is specifically designed to provide metrics for the evaluation and exploitation of the videos by the producers of each channel, or-in general- by the platform.
  • Video selection:
No restrictions were used for the selection of videos; all videos published by each channel up to the reporting date were included in the sample.
  • Dependent variables:
Dependent variables are those variables for which the hypothesis of their change is made by changing the independent variables. In other words, these are the variables that describe the phenomenon the researcher is interested in studying.
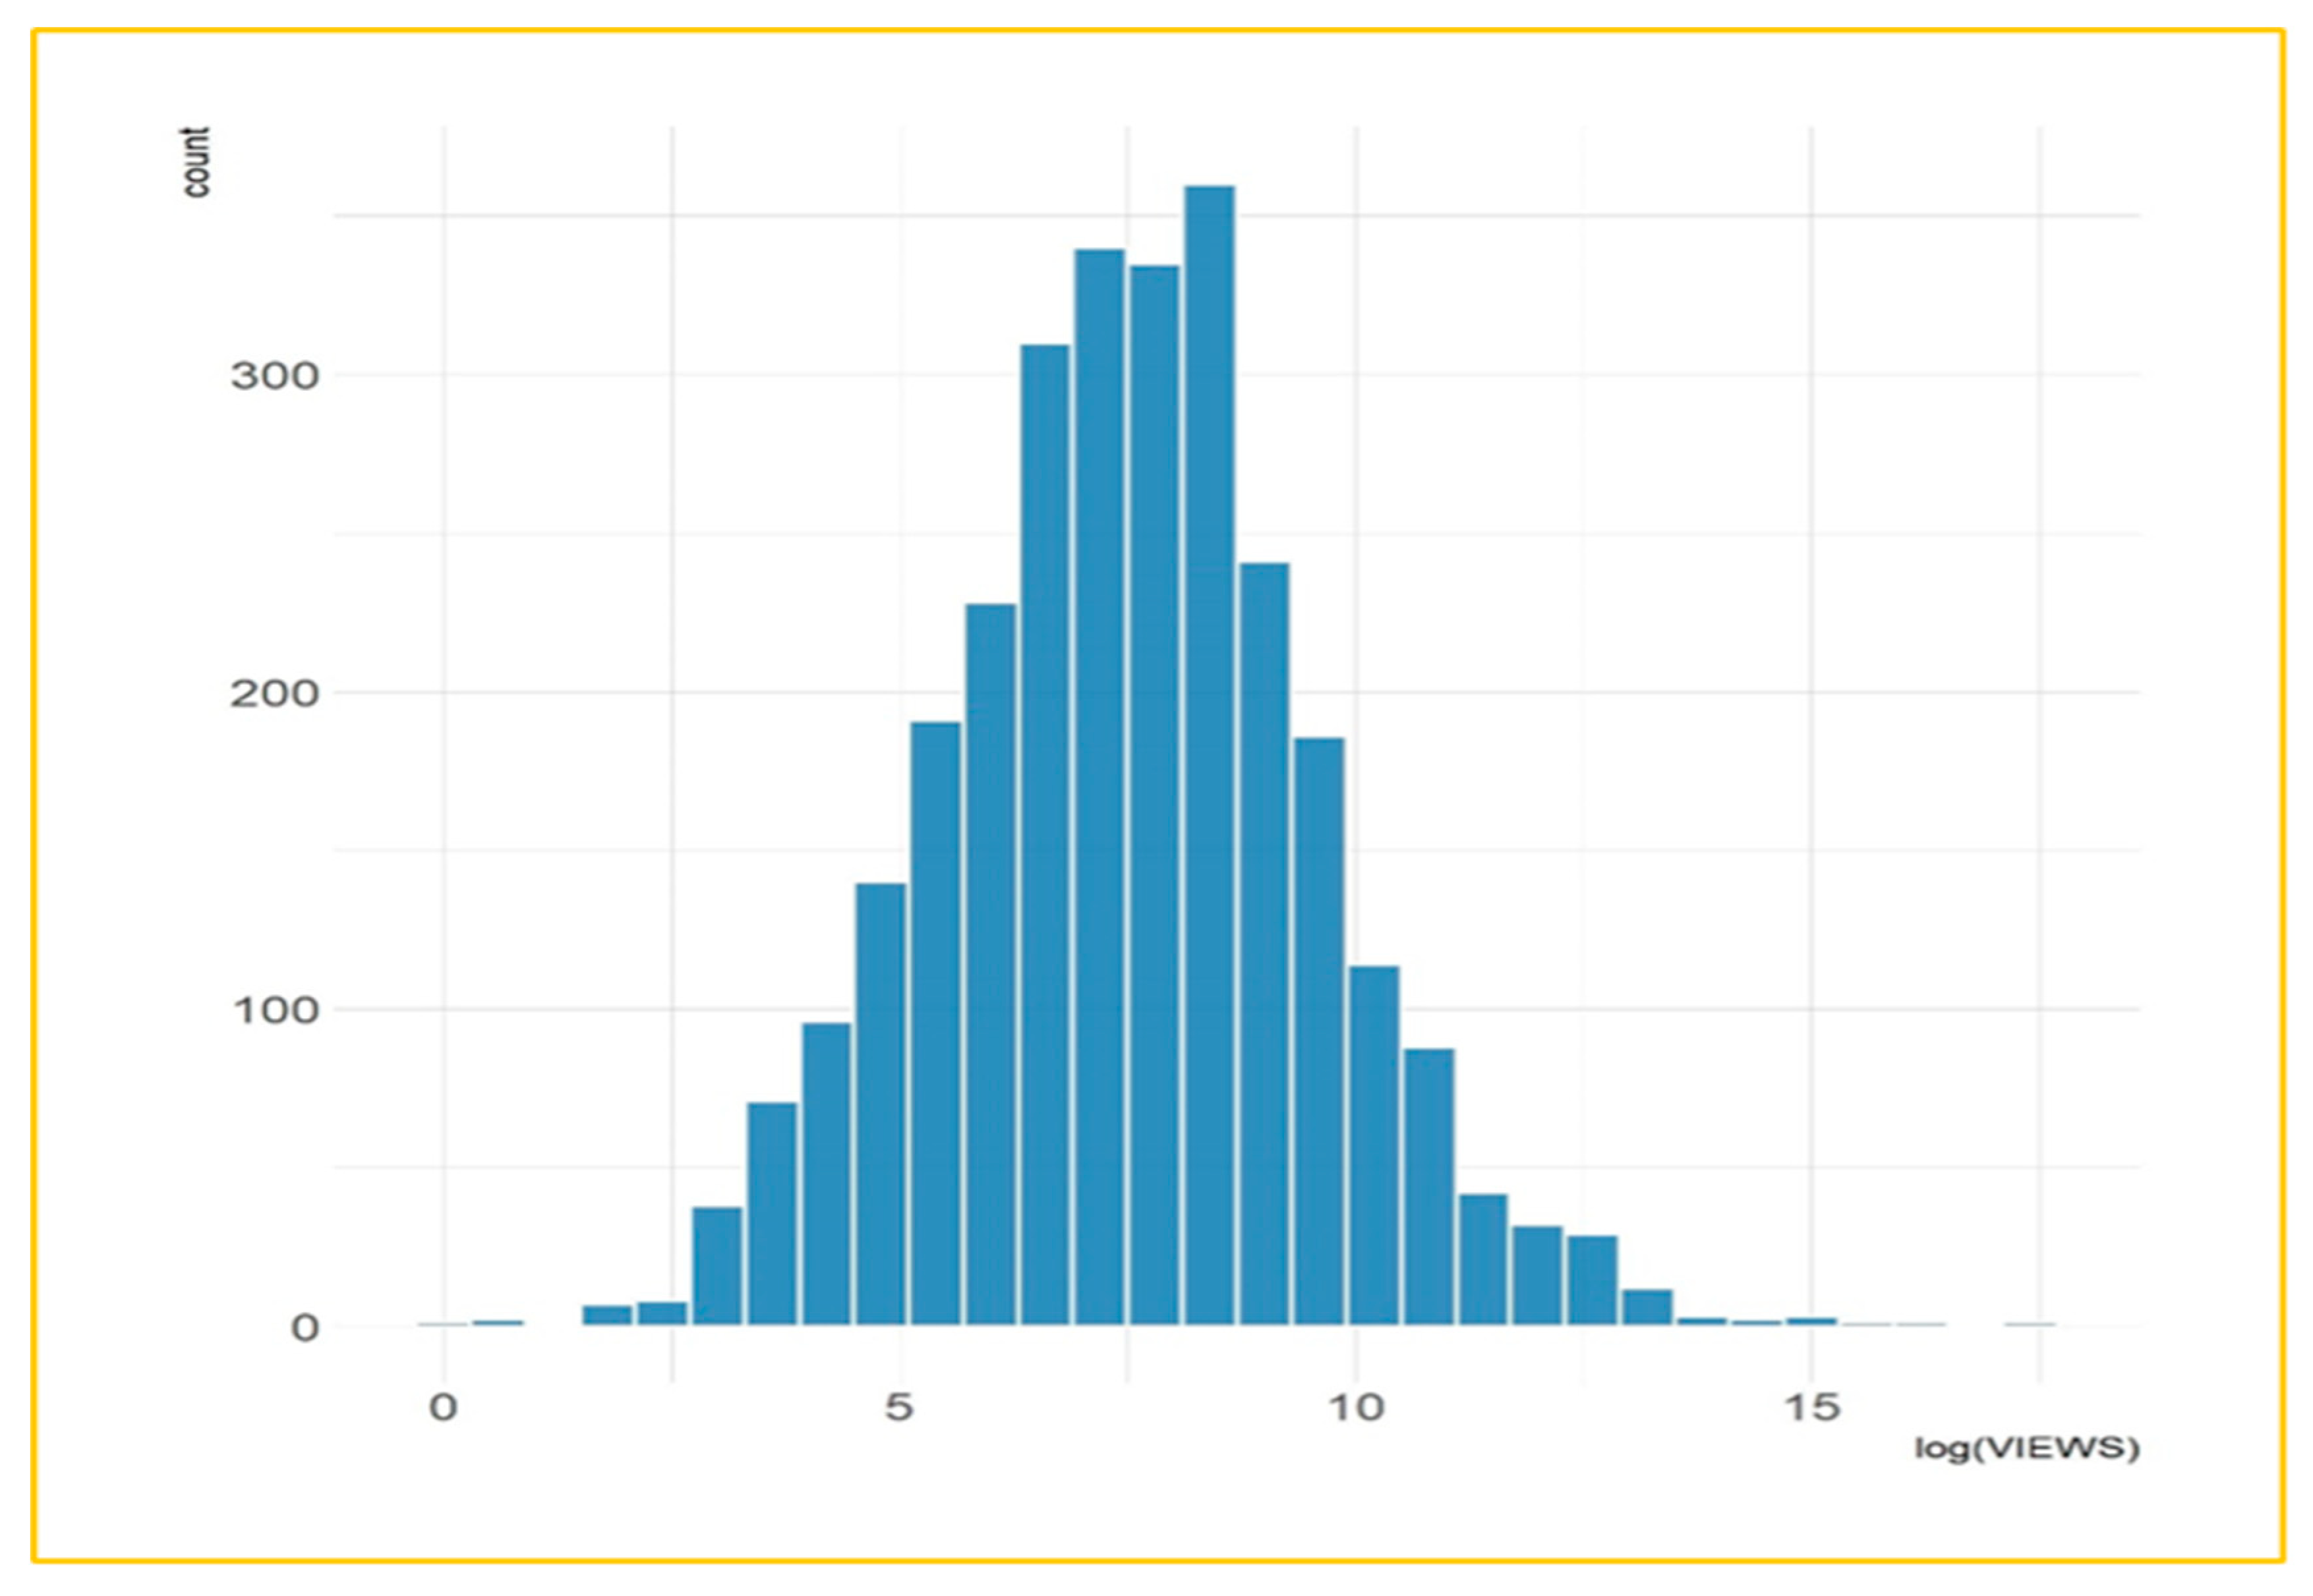
In this paper, the focus of interest is on understanding the pattern of total views of a YouTube video; therefore, the primary dependent variable of the research is the views of each of the specific videos in the population, as it (the population) was summarized in the previous section. For easy reference and also for inclusion in the relevant algebraic relationships below, we call this dependent variable VIEWS. We note that this variable is not accompanied by a unit of measurement; it is a pure number. In parallel with the dependent variable VIEWS, we create for the survey the variable LOG(VIEWS), which is obtained as the natural logarithm of the VIEWS variable for each particular video in the population. That is:
L O G V I E W S = l n ( V I E W S )
The transformation of the specific dependent variable is necessary as it allows, as will be shown below, the transformation of the quantitative regression model from a multiplicative to an additive one, which not only facilitates the analysis but also the reading/explanation of the resulting conclusions.
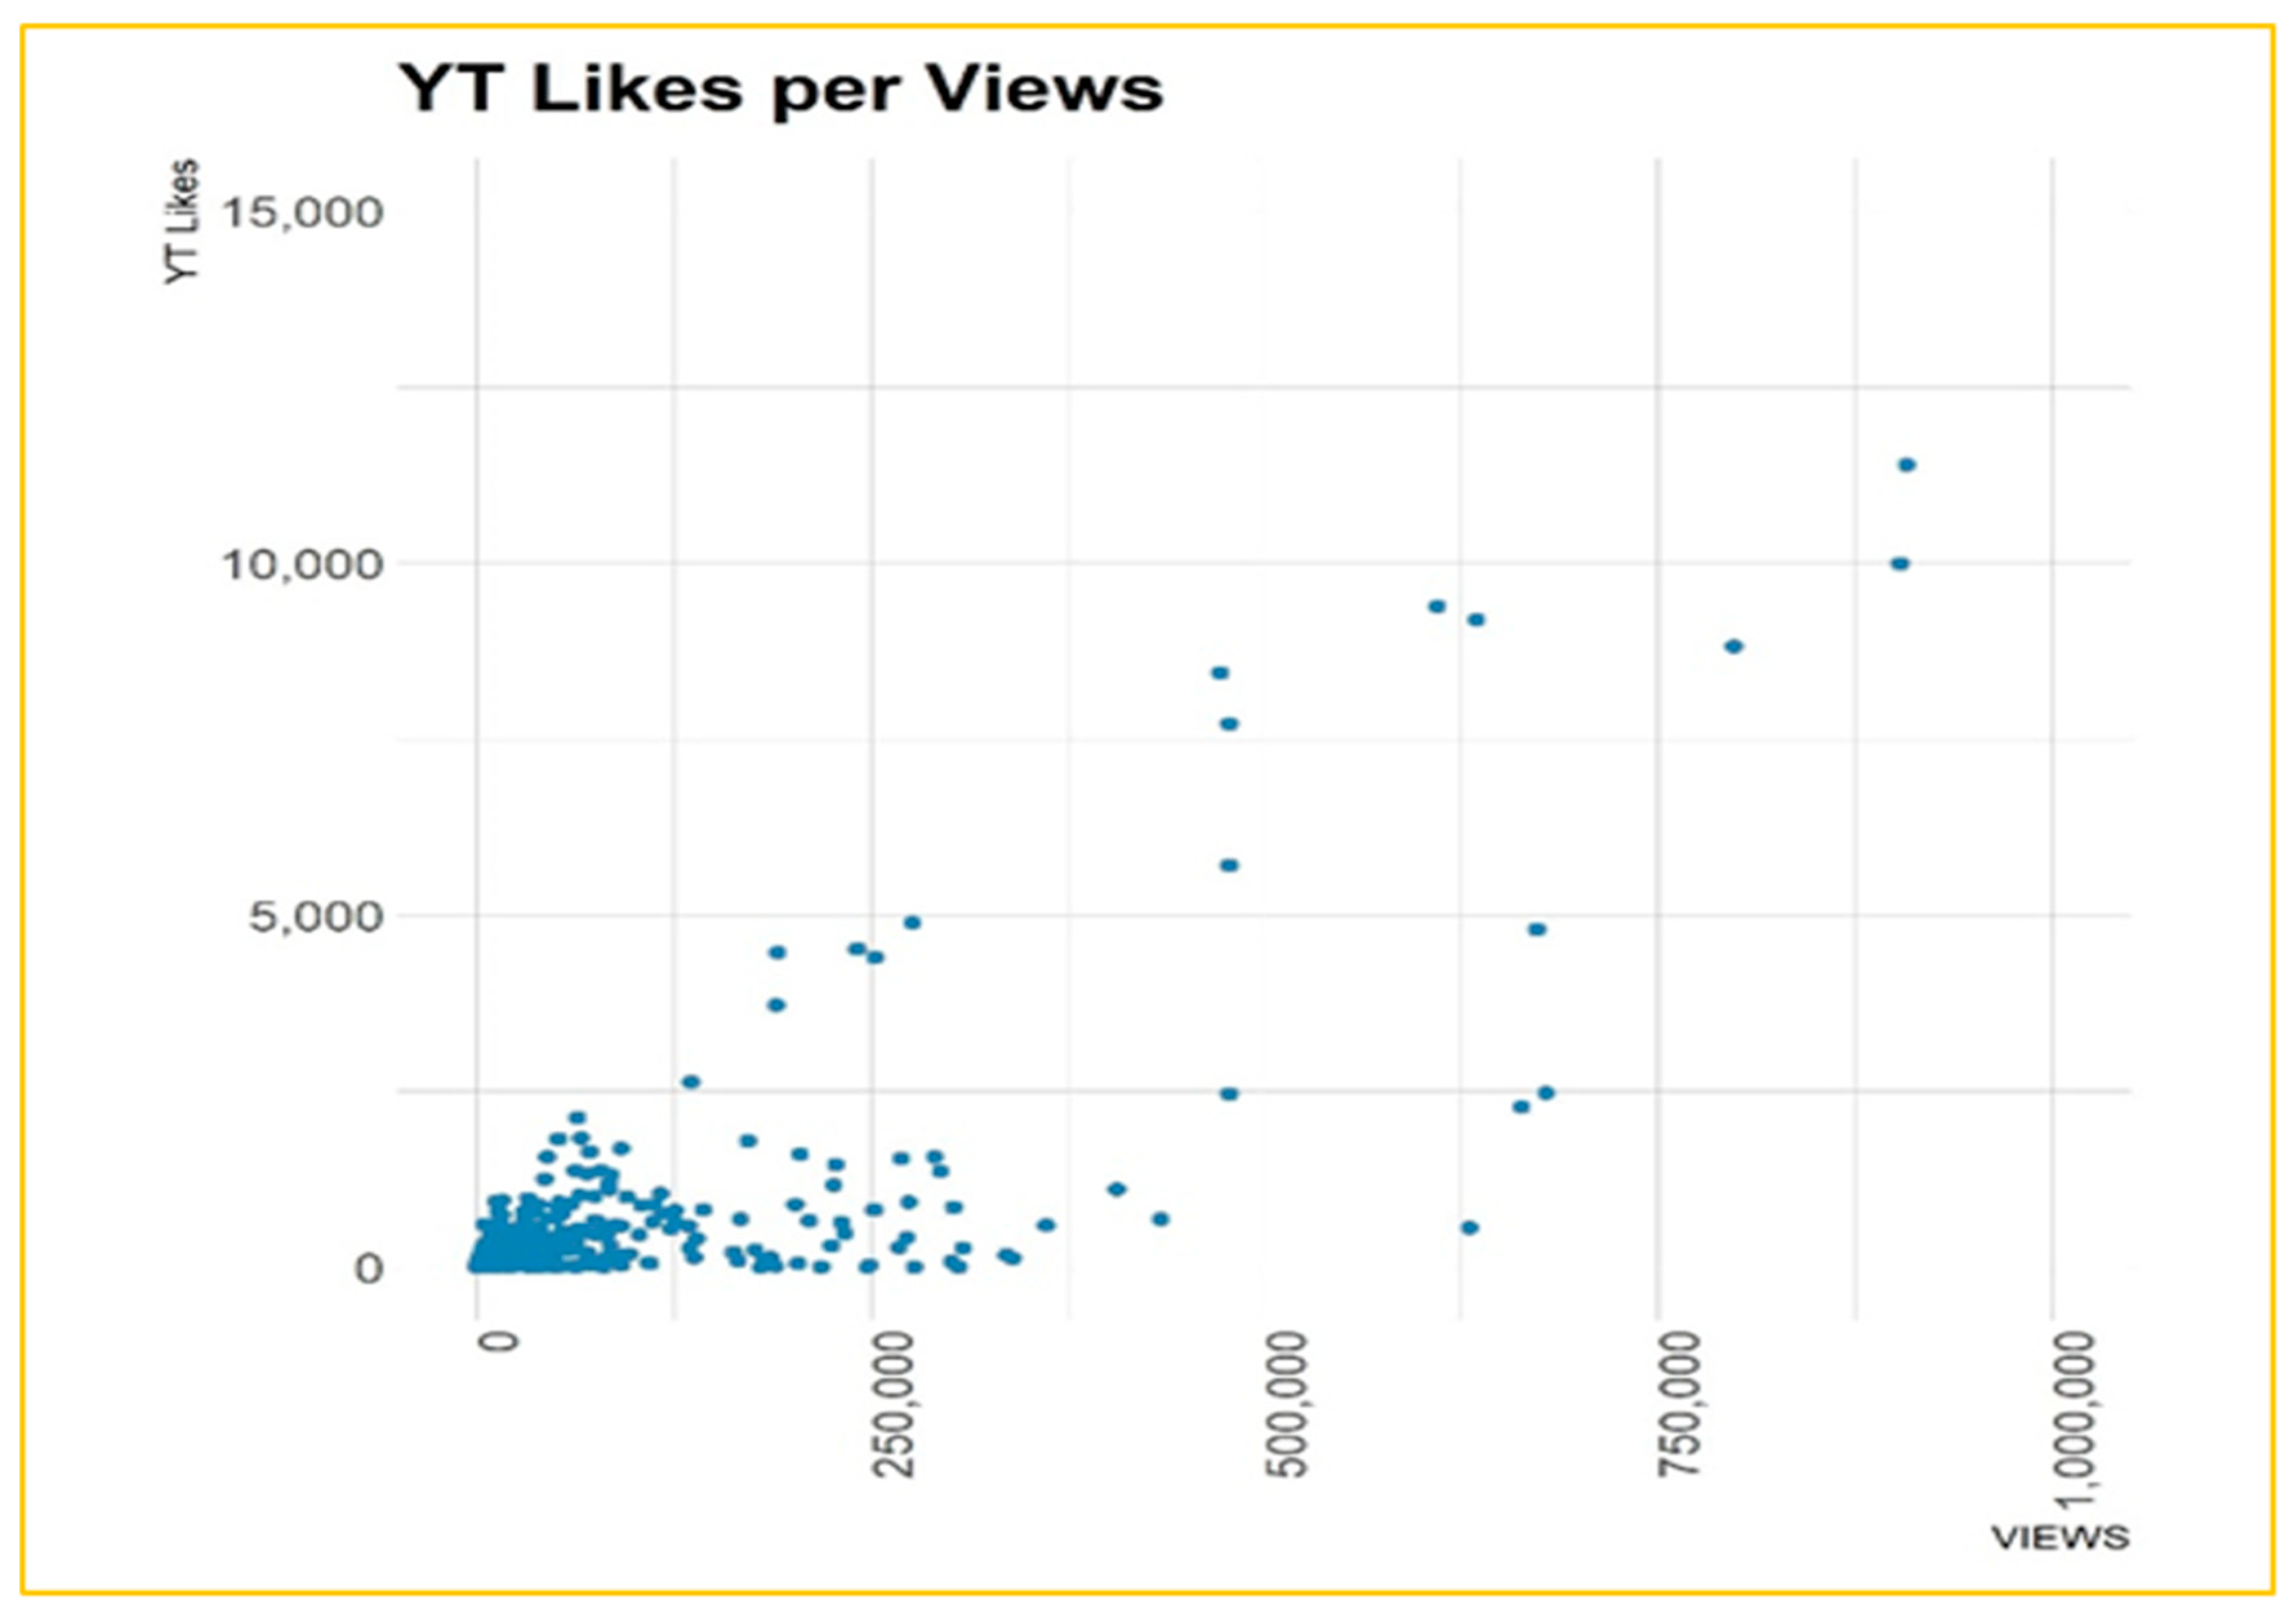
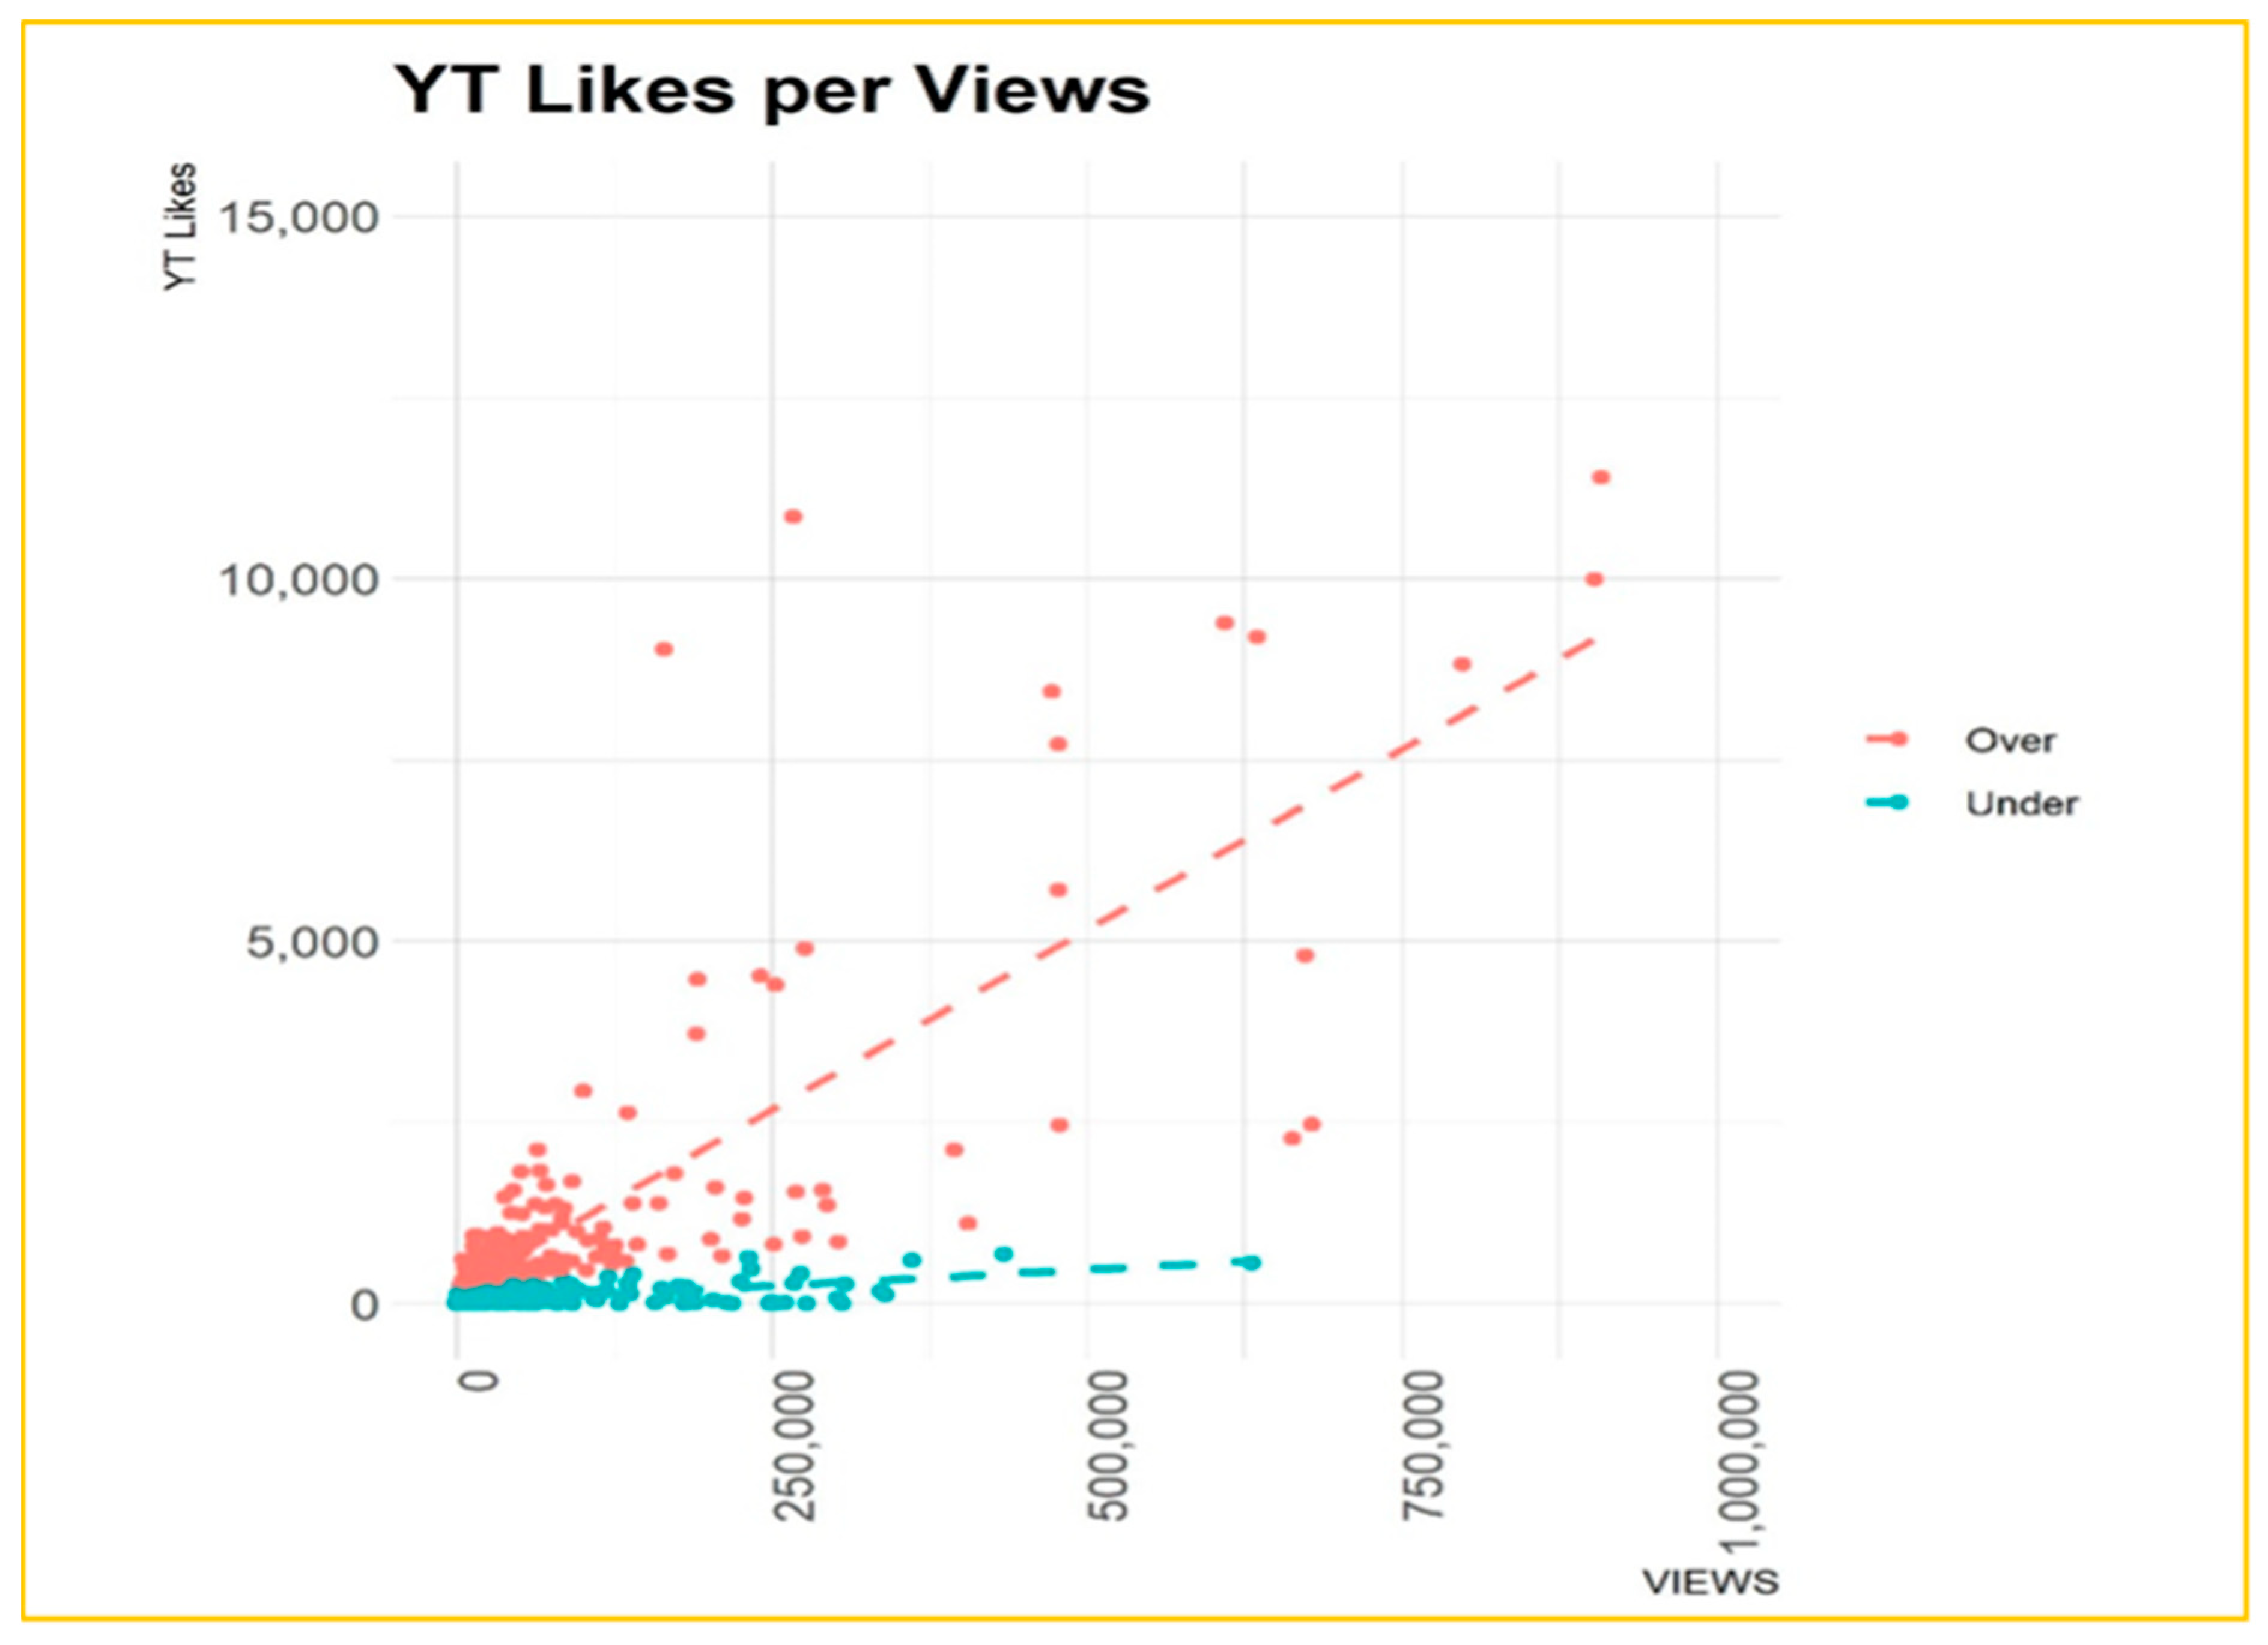
In addition to the views of each video in the population, this paper also considers the prediction of potential user interaction with these videos. To this end, the number of users who have expressed a positive attitude towards each video (“Likes”) is included in the survey as a second primary independent variable. Accordingly, for easy reference and inclusion in the relevant algebraic relationships below, we call this dependent variable YTLIKES. Like the VIEWS variable, the YTLIKES variable is not accompanied by a unit of measurement, being a pure number.
It should be noted that the definition of the above variables as independent variables relates to the specific context of the present study and describes their use in the context of the relevant models. Within a different methodological/research framework, these variables could be independent, potentially facilitating the investigation of ‘downstream’ phenomena, such as the wider acceptance/interaction of these channels in social media, a question that is outside the current research framework.
However, remaining within the present research framework, it is easy to see that the number of users expressing a positive attitude towards each video (YTLIKES) presupposes the existence of users to whom each specific video has been shown (VIEWS). Consequently, and within the present research framework, the variable VIEWS will also be used as an independent variable, in terms of the approach to the variable YTLIKES.
In conclusion, in the context of the present study, two primary independent variables, VIEWS and YTLIKES, are used, and the (independent) transformation variable of VIEWS via the natural logarithm (LOG(VIEWS)) is additionally created.
  • Independent variables
In contrast to dependent variables, independent variables are used as (potential) determinants of the phenomenon under study or, more practically, of the dependent variables. In other words, the concept of research is to examine whether changes in the independent variables (including the presence or absence of an item) lead to or explain (or at least correlate with) changes in the dependent variables.
Given the information that can be efficiently collected from YouTube, the independent variables in this survey are presented in Table 1.
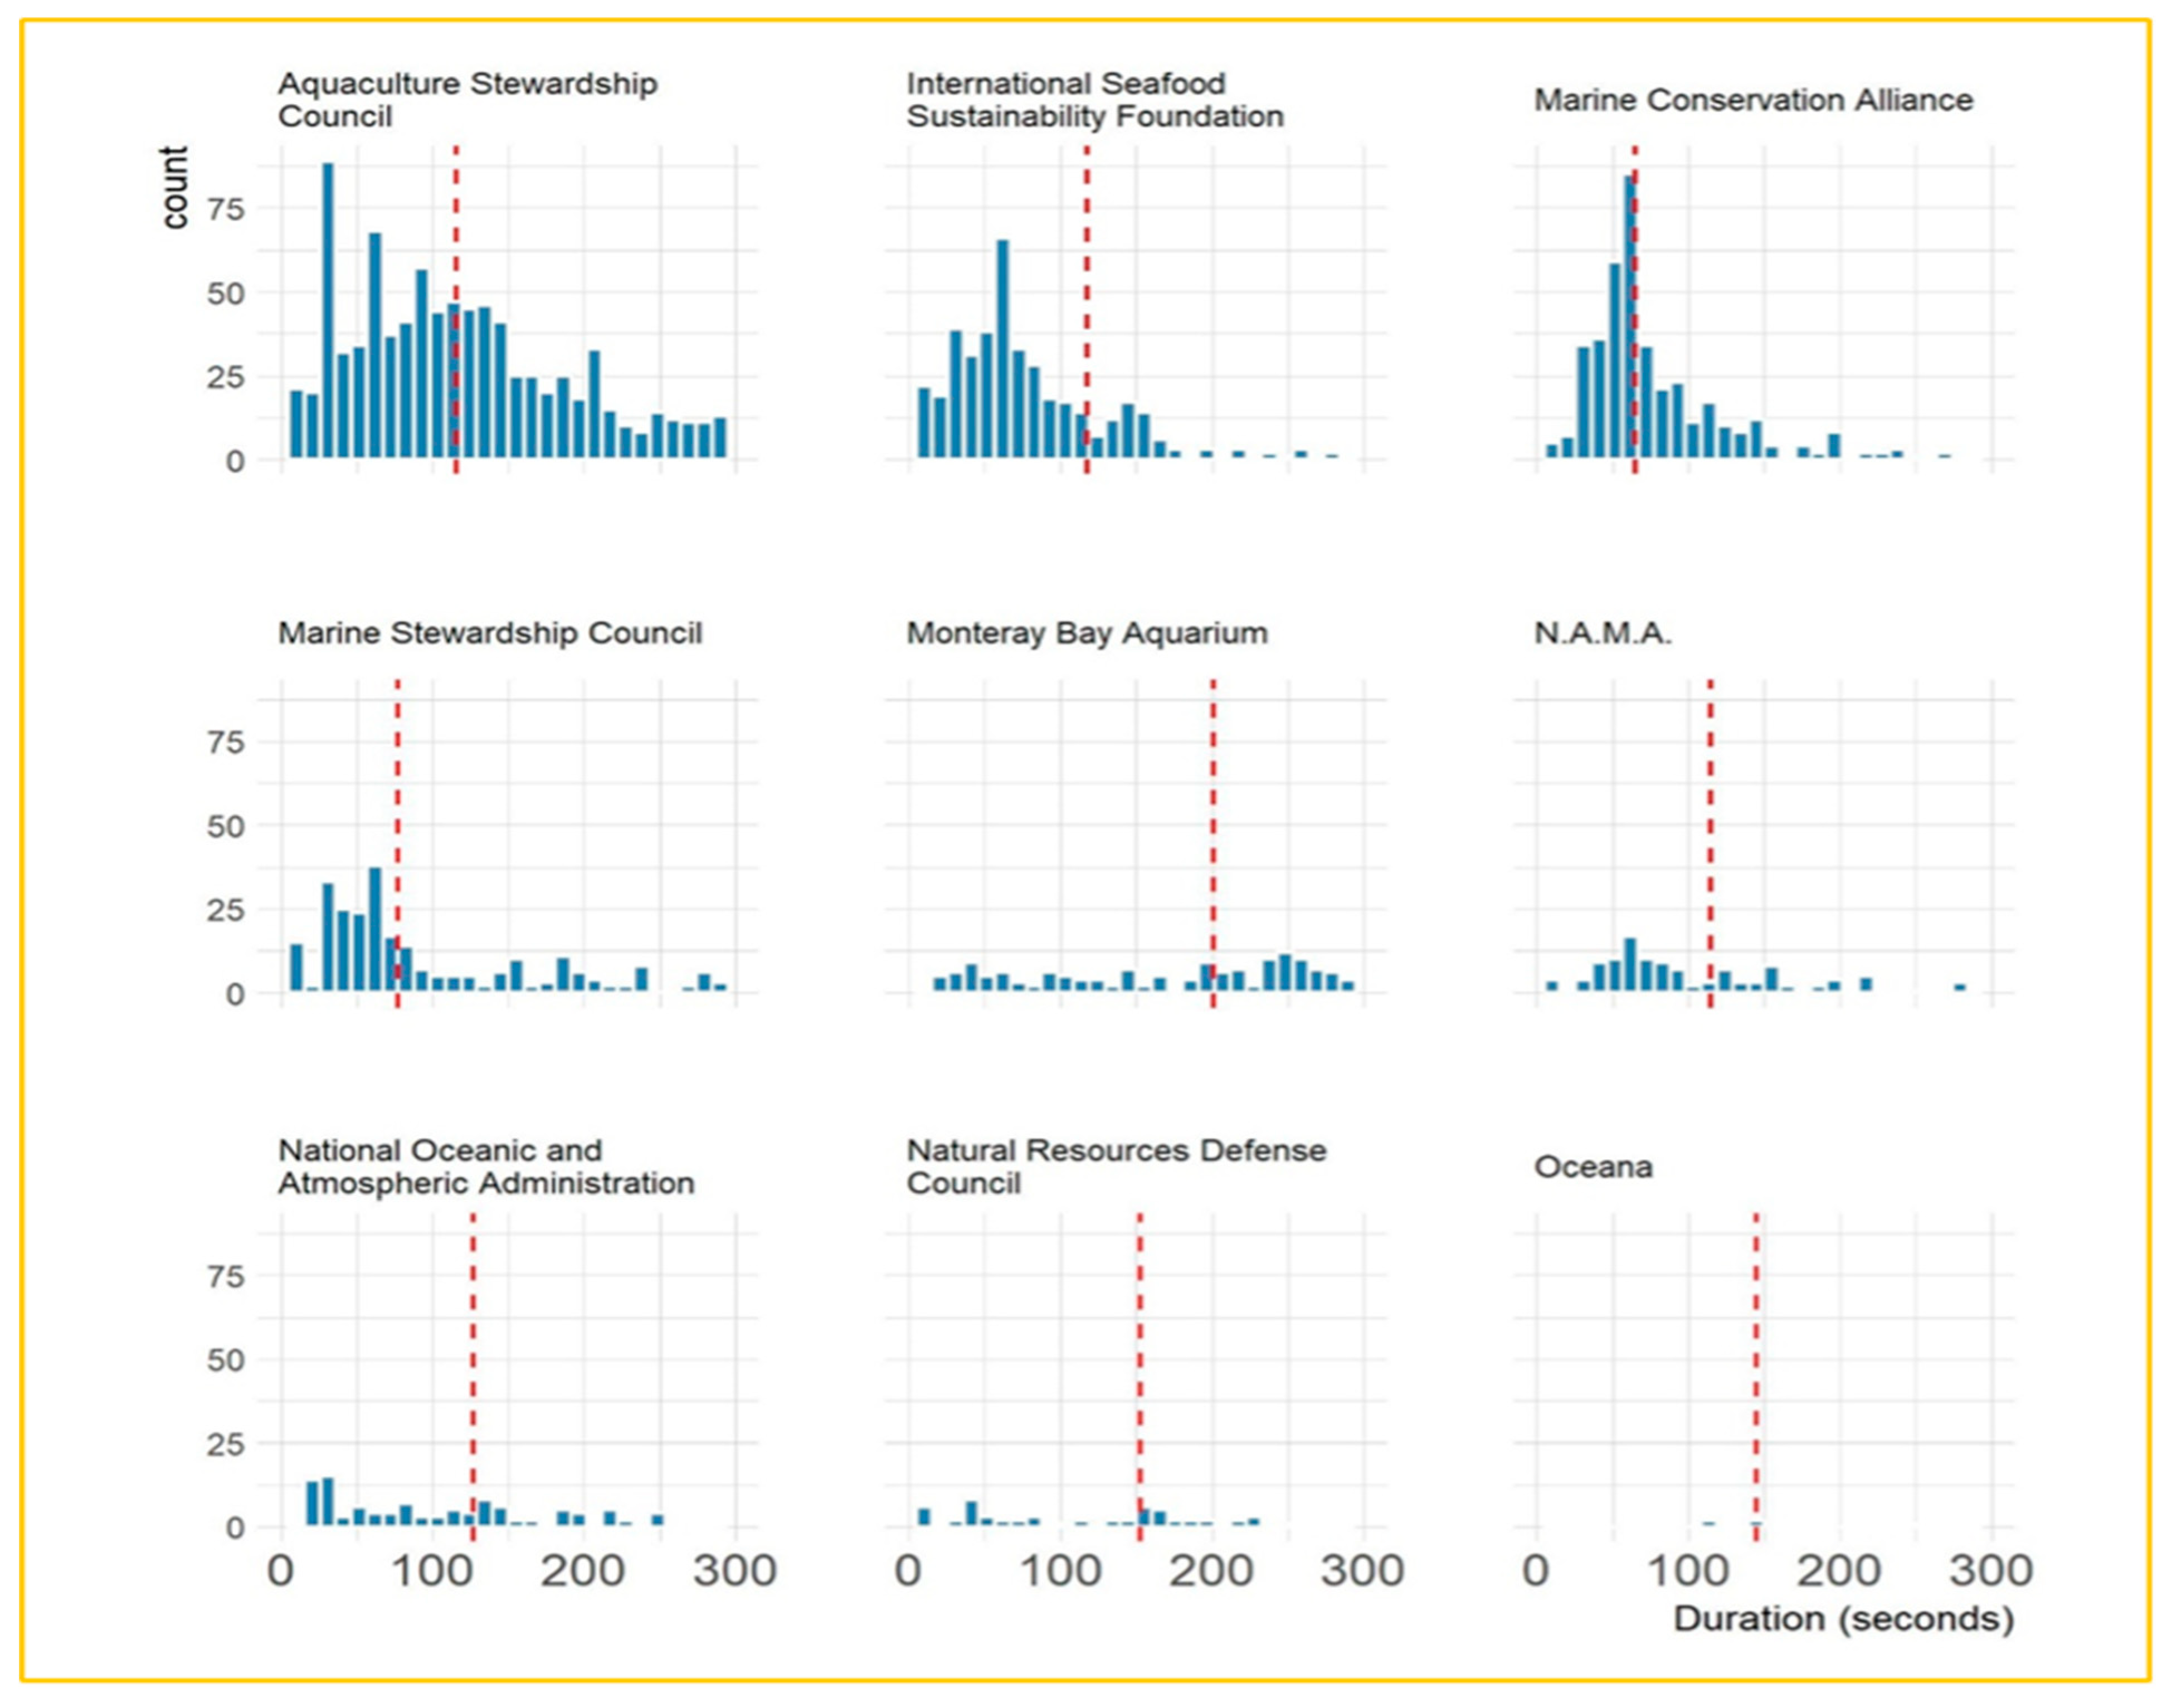
The function used for duration (seconds) is presented below:
D U R A T I O N _ S E C = D U R A T I O N ( h o u r s × 3600 + m i n u t e s × 60 + s e c o n d s )
In conclusion, 8 primary independent variables were created in the context of this research, as outlined above. To address the specific characteristics of fishery-related YouTube videos, the chosen independent variables—such as title word count, keyword presence, and video duration—were selected not only for their algorithmic relevance but also for their strategic applicability in communicating sustainability and traceability in the seafood supply chain. These structural characteristics reflect how fishery organizations shape narratives, engage consumers, and position products within global digital ecosystems. For example, longer descriptions may allow space for sustainability certifications or traceability information, which are vital for ethical seafood consumption. Similarly, the use of targeted keywords and metadata helps align video visibility with consumer search behaviors related to fishery topics. This tailored approach ensures the structural variables used in the model align with domain-specific communication strategies rather than generic video features.

2.3. Stages of Analysis

Having described the independent, dependent, and auxiliary variables used in the analysis, this section outlines the steps involved in conducting the survey. The survey process can be categorized into two distinct stages. In Stage A, the effects of macro-characteristics, such as the age of each video or the number of words in the title or description, are evaluated. In Stage B, if statistically and managerially significant effects are identified, the analysis then focuses on evaluating the impact of specific keywords.

2.3.1. Macro-Factors’ Impact Analysis

As described in the relevant literature, the existence (or individual parameters/values) of brand attributes may be related to (or even determine) dependent variables such as the number of views of a YouTube video. For example, the length of time a particular video has been active can be seen as a potential determinant of its views: a video that (ceteris paribus) was activated very recently may not have had the opportunity to be “shown” via the YouTube search engine to a sufficient audience to record corresponding views.
The examination of the research hypotheses around the relationship between macro-characteristics and projections requires in parallel, the definition of the (sub-positive) function which is likely to link the independent and dependent variables. Since these are continuous variables, this research initially used a linear function through the simple linear regression (SLR) methodology using the ordinary least squares (OLS) method:
V I E W S = a + b   · [ m a c r o _ v α r i a b l e ] + ε
The use of an SLR model is considered a satisfactory approach, but it is not the only (hypothetical) function that is likely to link the independent variables to the dependent variables. With this in mind, it was considered appropriate, using a review of the relevant scatterplots of the independent/dependent variable, to consider alternative functions, where appropriate (e.g., 2nd or 3rd-degree polynomials) or alternative forms of transformation of the variables to maintain the criterion of linearity and, consequently, to facilitate understanding of the potential relationship.

2.3.2. Keywords’ Impact Analysis

Having examined the relationship between macro-features and projections, in Stage B, we move on to examine the relationship between the existence (or not) of specific keywords and projections. Specifically, the inclusion of keywords in the model is done as follows:
Isolation of the words included in the titles (tokenization)—for example, the (hypothetical) titles “Great fishing today!” and “What a great day for fishing on the lake” are decomposed into their constituent words and recombined into a unique word vector as follows:
“Great, fishing, today, what, a day, for, on, the, lake”.
At the same time, the frequencies of occurrence of each word are recorded, forming the above vector as follows:
“Great (2), fishing (2), today (1), what (1), a (1), day (1), for (1), on (1), the (1), lake (1)”.
The resulting vector is filtered for (a) unimportant words and (b) words that appear only a few times. Trivial words are those words that do not add ‘meaning’ to the sentence but are used as conjunctions, articles, etc. For example, in the vector above, the words ‘a, ‘on’, and ‘the’ clearly do not add meaning to the reader, although they occur very frequently in speech. The full list of meaningless words used [33] is provided in Table A1. Similarly, words that appear less than ten (10) times in the entire population of videos examined were excluded—although these words may describe a very specific video that enjoys particularly high (or low) levels of views, the use of a word that appears very infrequently creates theoretical and practical problems in creating a reliable (robust) and—most importantly—useful business model. Continuing the example of the vector above, this would be formulated as follows:
“Great (2), fishing (2), today (1), day (1), lake (1)”.
It now becomes obvious that the above words can be used as categorical variables in a multiple linear regression model.
In this particular case, the model used has the form:
V I E W S = + i = 1 n b i x i + ε
where,
  • VIEWS is the number of views of a video;
  • a is the constant term of the model for the case where all xi equal zero (0);
  • bi is the marginal effect coefficient from the existence of the keyword xi;
  • xi is the auxiliary variable (dummy variable) that takes the value one (1) when the specific keyword is present in the video title and zero (0) when it is not present (boolean);
  • e is the statistical error.
Some observations are important for the completeness of the analysis at this point. Although technically, the analysis is not limited by the language of the text/title, in this research, only videos whose titles are in English are investigated. This was, on the one hand, so that we had a better understanding of the trivial words, and on the other hand, so that the conclusions could be processed. Since there are many English titles in the videos included on YouTube, we consider that this does not limit the analysis and, above all, the applicability of any conclusions in different contexts.
The model proposed above uses residual views as the dependent variable, but the logarithm of views (LOG(VIEWS)) could also be used. In this case, the model is not differentiated (the general assumptions of multiple linear regression apply), but the numerical value of the coefficients (a and β) is differentiated, as well as the way they are explained. Specifically, the modification of the terms for explanatory purposes is as follows:
For the case where all xi is equal to zero (0), the remaining views will be described by the relationship ea.
The effect of each keyword on the remaining views will be determined by the marginal coefficient of the model as eβ.
The standard significance tests of a multiple linear regression model (F-test) as well as the adjusted coefficient of determination (adjusted R2) are valid and can be tested normally.

2.3.3. Additional Analysis: The Relationship Between Views and Interaction

As mentioned above, this paper also examines the relationship between views and interaction with users, specifically, the relationship between views and expressed positive mood (“likes”) towards each video. This relationship is first examined through a simple linear regression (SLR) model of the form.
Y T L I K E S = a + b · V I E W S + ε
It is noted that the above analysis treats the relationship between views and interaction (“likes”) uniformly throughout the range of data. However, there may be different “groups” within these data where the relationship between views and interaction differs (for example, in Group A an increase in views is related to a given increase in “likes”, while in Group B the same increase in views is associated with twice the above increase).
To investigate this possibility, two additional linear regression (SLR) models are constructed, one on items that have a positive residual (thus above the line of best fit) and one on items that have a negative residual (thus below the line of best fit), setting the constant parameter (a) equal to zero in both models. By then comparing the linear projection coefficients (ba − bb), it can be safely investigated whether these are statistically different samples.

3. Results

Building on the methodology described in the previous chapter, this chapter presents the results obtained during the implementation process. The next section outlines the basic characteristics of the sample, using key descriptive statistical indicators to provide an overview. Subsequent sections present the findings derived from the application of inferential statistical methods. While the research results are discussed in detail in the following chapter, an effort is made in the subsequent sections to interpret and connect numerical and statistical indicators with the studied phenomena. This approach ensures a coherent integration of analysis and explanation, aligning with the objectives of this research.

3.1. Descriptive Statistics

Starting from the total activity within the sample, it is observed that this consists of a total of 2882 videos, which were published through nine (9) channels. Table 2 shows the distribution of videos by channel.
From the table above, it becomes immediately apparent that the various channels do not participate equally in the totality of the sample videos. Figure 1 highlights exactly this disparity, comparing each channel’s video “production” to the average of all channels (~320 videos).
Accordingly, the number of subscribers varies significantly between the channels, with two channels exceeding one hundred thousand subscribers, three channels moving into the thousands, and four channels not managing to exceed one thousand subscribers (Table 3).
Although the above unequal distribution is likely to lead to different views per video for each channel, it is noted that the direction of this relationship cannot be established a priori, nor the reverse (i.e., the different views of each channel’s videos may lead to a different number of subscribers for each channel) could equally apply. Documenting the direction of the above relationship requires data from different moments in time (longitudinal data) for both variables (views, subscribers) and, consequently, is not included in the research hypotheses of the present research. In any case, this fact is recognized as one of the limitations of the present research and cited as an opportunity for additional future actions.
Then, the following table (Table 4) lists for consideration the time intervals during which the videos are produced (by channel).
It becomes clear that while most channels are active until 2021, the “Oceana” channel is practically inactive after the third quarter of 2012, while the “Monterey Bay Aquarium”, “NOAA (National Oceanic and Atmospheric Administration)” and “NRDC (Natural Resources Defense Council)” did not become active in 2021. In addition, it is observed that all channels have a relatively long history (and thus experience) of publishing on YouTube, since the start of their activity is from 2010 and earlier (except the channel “N.A.M.A.”, which started its activity in 2013, but we do not consider this fact to limit it with regard to the experience gained over the other channels).
The above characteristics refer to the analyzed channels as the primary mechanisms of video production. The main conclusions drawn are that the channels included in this research have (almost) the same “live” time (video production experience), although they differ significantly within this period in terms of their activity. Accordingly, we observe a significant variation in the number of subscribers per channel, but unfortunately, we cannot document the direction of influence of this variable from/toward individual video views. Next, we focus on features that pertain to the videos themselves, starting with views.
Figure 2 shows the views of the videos, from the least (=1) to the most (=36,209,288).
From Figure 2, it is clear that the distribution of videos regarding their a-number of views includes a particularly large number of those with (relatively) limited views (of the order of a few thousand) and a relatively limited number of videos with particularly high view numbers (of the order of hundreds of thousands of views). As can be seen in the summary table below (Table 5), 75% of videos (~2150) were viewed less than 6500 times, while one in four videos were viewed less than 460 times.
Given the above observations and focusing on the highly asymmetric distribution of the data (asymmetry index = 44.1), the use of a logarithmic transformation on the views of each video becomes imperative [38]. Figure 3 shows the histogram of the distribution of the (natural) logarithm of the views, where the more “normalized” behavior of the new variable can be seen—characteristically, the skewness index of the new variable amounts to 0.17.
As a second dependent variable, user interaction with the videos is examined, specifically, the YTLIKES variable. Table 6 lists its distribution, where it becomes apparent that one in four videos had fewer than three interactions, while three in four videos had fewer than 82 interactions.
It is also important to note that the asymmetry coefficient is very high (=42) while the average is above the Q3 (=236.4).
Since the present research examines the correlation between projections and interactions (as defined), the transformation of this variable through a natural logarithm is not deemed necessary. Focusing then on the independent variables, the first of these is the duration of the videos, in seconds. Figure 4 lists the distribution of videos by duration (videos > 300 s are not shown) and by channel.
It becomes apparent that the median for most channels lies between 100 and 200 s (2–3 min), while there is generally a high concentration of up to 300 s (5 min). Table 7 lists the most important descriptive statistics metrics by channel.
As a next feature, the distribution of the amount of time a video remains active (AGE) is shown in Figure 5 below. Figure 5 shows the generally increasing trend of video production mainly from the International Seafood Sustainability Foundation, Marine Conservation Alliance, and Marine Stewardship Council channels, while the Aquaculture Stewardship Council, Natural Resources Defense Council, and National Oceanic and Atmospheric Administration channels have a gradually decreasing production of new videos. This fact may affect the analysis results of the variable in question (AGE) as there seems to be a relationship between the variables AGE and CHANNEL (in essence, while the analysis targets the relationship AGE and VIEWS, it is redirected to the relationship CHANNEL and VIEWS (multicollinearity)) [37].
Regarding the number of words in the title (TITLE_COUNT), Figure 6 shows the relative distributions per channel and overall. It becomes clear that most titles range between three (3) and thirteen (13) words, with an average of around eight (8) words. Even more important is that, unlike the previous variable for variable, the distribution of the number of title words per channel does not seem to vary significantly.
Finally, Figure 7 shows the distribution of the number of words in the description (DESC_COUNT) of each video. The median number of words in the description of the videos is fifty (50) (about 3–4 lines), but there are also a significant number of videos with more than one hundred (100) words in their description, mainly from the channels that operate more recently (International Seafood Sustainability Foundation, Marine Conservation Alliance and Marine Stewardship Council).

3.2. Inductive Statistics

Having described the characteristics of the variables in the previous section, in the present section, we proceed to investigate the relative effects. As mentioned above, the analysis focuses first on the impact of macro-factors and then on the impact of keywords. Finally, the relationship between projections and interaction is examined.

3.2.1. Macro-Factors’ Impact Results

For the research hypothesis (H1), the length of time a video remains active (AGE) has a statistically significant, linear, and positive effect on the number of views (VIEWS). To examine the above relationship under the H1 research hypothesis, we configure the simple linear model as before, even setting the constant term equal to zero (0), as for zero active days, it is obvious that the number of views will be exactly equal to zero (0). From the results of Table 8 and Table 9, it is clear that the estimated average value of the coefficient of the time interval during which a video remains active (AGE) is positive, demonstrating that for each active day, the views are expected to increase (positive effect) by fifteen (15). The overall pattern can be considered statistically significant (Significance F = 0.006 < 0.05). The value that this coefficient can take varies (within a 95% confidence interval) from 4.2 to 25.7, which means that on 95% of the days when a video is active, an increase in views is expected within the space bar. Hence, H1 is confirmed.
According to the previous analysis, we constructed a simple linear model between views and duration of the videos, the results of which are shown in the table below. It is noted that in this case, it makes no sense to impose a constant term equal to zero (0), as such a thing is not logically supported (even a “video” with a duration of less than one second could have views). Contrary to the previous model, this one does (Table 10 and Table 11) not document a (linear) relationship between the duration of the videos and their views (Significance F = 0.66 > 0.05). More specifically, the independent variable of the model appears with a slight negative trend (coefficient = −1) as was initially assumed, but since it varies between −6.5 and 4.1, we cannot safely conclude that its real value is not zero (0). Consequently, H2 is not confirmed.
The following tables (Table 12 and Table 13) present the results of the relevant simple linear regression model, as in the previous research hypotheses. Here, it seems that it cannot be established that the number of words in the title of each video affects the views of these, although the coefficient of the variable is indeed negative (−472). More specifically, the p-value (Significance F) of the model is 0.90 > 0.05, while as we can see from the 95% confidence interval of the coefficient, the effect can range from −7.849 (that is, each additional one word reduces views by −7.849) to 6.904 (i.e., each additional word in the title increases views accordingly). Therefore, H3 cannot be confirmed.
At this point, a review of the structure of the model is appropriate. In particular, the construction of the model in question can lead (under certain conditions) to a “paradoxical” interpretation: either the constant term will be “low” and there will be a positive slope of the line (case 1), or the constant term will be “high” and a negative slope of the line will appear (case 2). In case 1, the interpretation of the example would be that more words in the title increase views, which would be too much to claim to be the case in practice. Accordingly, under case 2, the interpretation of the pattern would be that most views are made with few words in the title (if not “no title”), which would also be too much to support in practice.
For this reason, the method of piece-wise regression was additionally used, where the data are examined for the existence of breakpoints of different models (that is, it is examined whether the data are better adapted to the use of two distinct models, in this case, two different linear models, due to “change of behavior” at given points of the independent variable) [40]. The use of said technique did not reveal any statistically significant pattern or coefficients, but it does show as the most likely (but not statistically significant) “intersection” point of the six (6) words in the title.
Finally, (regarding the effects of macro-attributes), the following tables (Table 14 and Table 15) summarize the statistical model of the simple linear regression between the number of words in the video description and its views. From Table 14 and Table 15, it follows that there is no statistically significant relationship between the number of description words and views of the videos: although each additional word seems to “remove” seventy (70) views, the coefficient can vary between −390 and 250 (with a 95% confidence interval), which does not exclude the existence of a zero (0) coefficient. Accordingly, the p-value of the sample (Significance F) is 0.67 > 0.05. Therefore, H4 cannot be confirmed.

3.2.2. Keywords’ Impact Results

Having examined the effect of macro-characteristics on views, in this section, we move on to the (independent) examination of the effect of keywords. From the total of 2882 videos, those whose language in the description (DESCRIPTION) is English (=2344) were initially selected. The vector of keywords to be examined was then created: the titles of each video were analyzed into unique words (tokenization) together with their frequency of occurrence, and, subsequently, the words considered “unimportant” (stop words—Table A1 in the Appendix A of the present paper) were excluded, but also those that appeared less than ten (10) times. Also, single “numbers” (such as “2010”, “14”, etc.) were excluded.
Finally, to facilitate the regression analysis, each record was multiplied according to the conserved words that appeared in the title: for example, a video that has three conserved words in its title (e.g., “white”, “time”, “action”) will appear three times by adding each of the above words to the corresponding field (“word”). From this process, a new dataset was created with 7066 records (now using video-words as “key”). Two (2) subsamples were created, using (alternatively) the VIEWS variable and its natural logarithm, LOG(VIEWS). The following table (Table 16) presents these results.
As can be seen from the Table above, the use of the natural logarithm forms a very different model, corresponding with very significant differences in terms of its statistical properties. Specifically, the model that uses simple views (VIEWS) cannot be considered statistically significant (Significance F = 0.96 > 0.05), while, on the contrary, the model that uses the logarithm of views turns out to be statistically significant (Significance F < 0.00 < 0.05). Consequently, in the continuation of the analysis, we focus on the model that uses the logarithm of projections as a dependent variable.
In this model, it is important to note the R2 coefficient as well as the Adjusted R2 coefficient: these coefficients refer to the percentage of the variability in the dependent variable that is explained by the independent variables, with the Adjusted R2 coefficient adjusting the result for the number (number) of independent variables. It can therefore be seen that the keyword model explains 30% of the variability in the (log) views, a percentage which can be considered, from a practical point of view, significant. Therefore, it is documented that H5 can be confirmed, as there is a statistically significant relationship between keywords and views. Continuing the analysis, we analyze the impact of specific keywords, according to H6.
To carry out the specific analysis, we focus on the coefficients of the logarithmic model, looking for statistically significant ones (p-value < 0.05). Table 17 below lists the statistically significant coefficients based on the kept words for the analysis (Table A2).
Reading the above table is as follows: for each keyword, the coefficient represents the expected change in the logarithm of views when that keyword is present in the video title. Since the model includes dummy variables for individual keywords, the correct interpretation is multiplicative rather than additive. Specifically, if a word has a coefficient β, then its presence in the title is associated with a multiplicative effect of eβ on the expected number of views. For example, for a video with the words “save” (β = −1.02) and “pup” (β = 2.23) in its title, the expected views are:
l o g ( V I E W S ) = α 1.02 + 2.23 = α + 1.21 V I E W S = e α + 1.21
Thus, the presence of these two keywords increases expected views by a factor of e1.21 ≈ 3.35, compared to titles without them, holding other variables constant.
According to the above analysis, H6 is confirmed, while Table 17 lists the relevant keywords. The relationship between views and interaction (YTLIKES) is then examined. In this direction, Figure 8 is presented, which shows a proportionally positive relationship between the two variables.
Accordingly, by creating the relevant statistical model of simple linear regression, we obtain the following results from Table 18 and Table 19. From the above results, it follows that the model in question is statistically significant (Significance F < 0.00 < 0.05), while through the analysis of the relative coefficient, it appears that for every approximately 1000 views, approximately 2.3 interactions arise (between 2.1 and 2.4 with a confidence level of 95%). At this point, it is important to note that, although the effect of views on positive interactions is fractional (2.3/1000), this does not prevent it from being statistically significant. Accordingly, H7 is confirmed.
Then, based on Figure 8, it is examined whether there are two different groups of videos regarding the rate of interaction/views. For this purpose, the data are divided into two groups, according to whether they are “above” or “below” the line of best fit in the overall model. Figure 9 below shows the two groups.
Then, we compared the models created by the two groups (Table 20).
As can be seen in Table 21, the prospect of two different interaction/projection models seems highly likely—each model increases the explanatory coefficient (R2) to over 90%, while both models are statistically significant. In this direction, we compare the two resulting coefficients (β).
For the comparison between the coefficients, we use the following equation.
z = β 1 β 2 S E β 1 2 + S E β 2 2
z = 0.0112 0.0007 0.00015 2 + 0.00000 2     70
This means that the above coefficients are significantly different, and the result is much greater than the two-tailed test statistic z = 1.96. Although the above analysis does not solve the problem of a priori ranking a video between the two samples, from a practical point of view it becomes clear that, due to the significant difference between the two coefficients, it becomes very easy for the business user/analyst to rank any videos in the said groups from the very first results (VIEWS): in the first group, videos that generate about 11 Likes/1000 Views can be classified, while in the second group, videos that generate about 1 Like/1000 Views can be classified.

4. Discussion

This research offers important perspectives on the elements that affect YouTube video performance, particularly about video characteristics, keyword optimization, and user engagement. By analyzing a dataset of 2882 videos across multiple channels, the study examined how video age, duration, metadata structure, and keyword selection impact viewership and interaction. The discussion section interprets these results in light of the existing literature, assessing their alignment with prior research while highlighting potential implications for content creators and digital marketers. The confirmed hypotheses reinforce established theories on search engine optimization and audience engagement, whereas the rejected hypotheses suggest the need for a more nuanced understanding of video consumption behaviors.
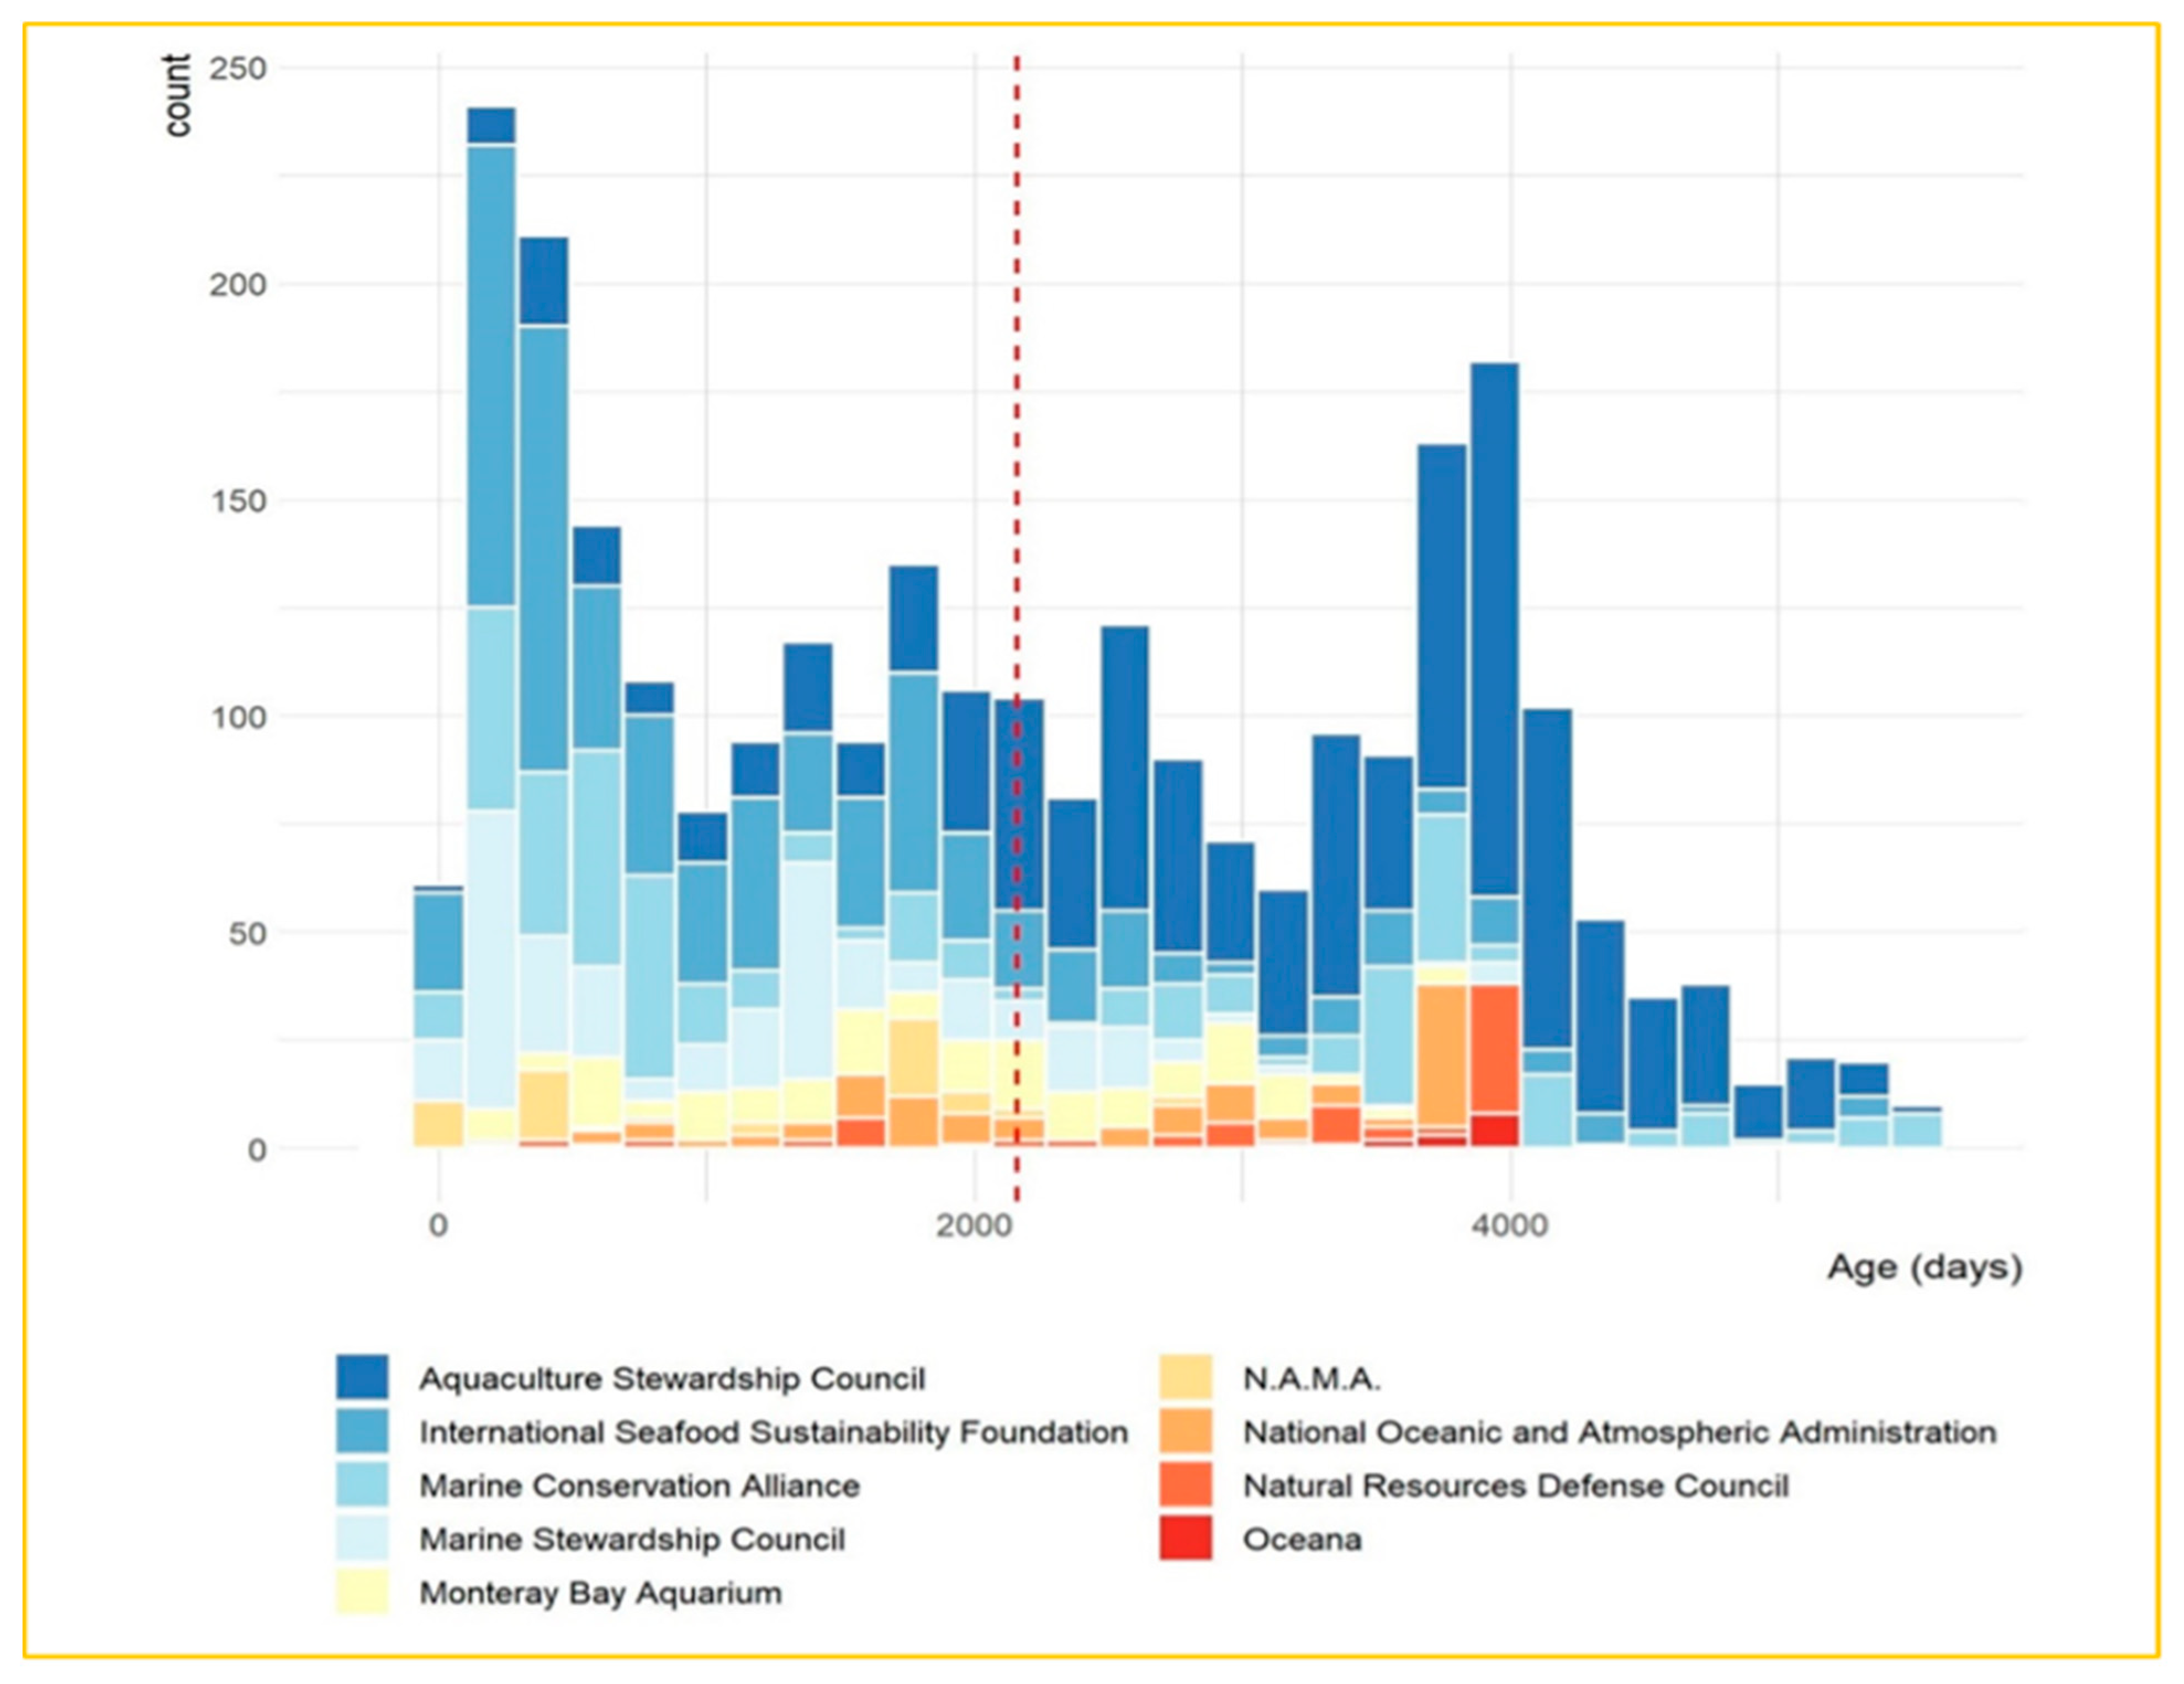
The results confirm H1, demonstrating that video age positively correlates with accumulated views, aligning with prior research emphasizing that older videos benefit from sustained exposure and algorithmic recommendations over time [41,42]. The statistical analysis reveals that for every additional active day, the number of views increases, reinforcing the premise that evergreen content gains traction through continuous engagement and search engine indexing. YouTube’s algorithm prioritizes videos with proven engagement, often resurfacing older, high-performing content in recommendations [43]. However, this effect may be influenced by initial engagement metrics—videos that perform well early tend to continue gaining traction.
Contrary to expectations, H2 was not statistically confirmed, indicating that video duration alone does not significantly impact viewership. While prior studies have suggested that shorter videos might yield higher retention rates due to declining attention spans [44], the current findings suggest that factors such as content quality, engagement triggers, and audience intent may moderate this relationship [45]. YouTube’s recommendation algorithm increasingly favors longer videos with high watch time and retention, as they contribute more to overall session duration, a key ranking factor [46]. Therefore, while shorter videos may attract initial clicks, longer content that retains viewers for extended periods can perform equally well or better in terms of engagement.
The statistical results do not confirm H3 or H4, implying that title and description length do not directly linearly influence video viewership. While prior research suggests that concise and keyword-rich titles improve CTR [47], the current study finds no strong evidence that longer titles negatively impact views. Similarly, despite the expectation that lengthy descriptions might dilute keyword effectiveness, reducing discoverability [48], the data does not support this hypothesis. These findings suggest that optimizing video metadata requires a balance—titles should be engaging and relevant, but not necessarily short, while descriptions should be informative without overwhelming the viewer.
This study confirms H5 and H6, emphasizing the critical role of keywords in determining video visibility and engagement. The analysis demonstrates that keyword-optimized content significantly affects view counts, corroborating research on YouTube SEO and search behavior [49]. Specific keywords such as “sustainability”, “fisheries”, and “conservation” yielded higher engagement, aligning with previous findings that niche-specific, high-relevance keywords enhance discoverability [50]. Conversely, generic or highly competitive keywords may dilute a video’s ranking potential due to oversaturation. These results underscore the need for content creators to employ targeted keyword strategies, integrating trending terms while maintaining relevance to their audience.
The results confirm H7, highlighting a strong correlation between views and user interactions, particularly likes. This finding aligns with studies emphasizing engagement as a primary driver of YouTube’s recommendation algorithm [51]. The analysis shows that highly viewed videos tend to receive more likes, reinforcing prior research on social proof and engagement metrics [52]. Videos that actively encourage audience interaction—through calls to action, community engagement, and high-quality content—often outperform those that rely solely on organic discovery [53]. These results highlight the necessity of fostering viewer interaction to sustain visibility and maximize reach.

5. Conclusions

This study presents meaningful theoretical insights into areas such as digital marketing, search engine optimization, and user interaction on social media. This study confirms that video longevity plays a critical role in increasing views over time, aligning with previous research on algorithmic ranking factors [54]. However, the absence of a statistically significant impact of video duration, title length, and description length on viewership challenges the existing literature that emphasizes content length as a determinant of audience retention [55]. This suggests that YouTube’s recommendation system may prioritize other engagement-driven factors, such as keyword relevance and user interaction. The research also highlights the importance of keyword selection in improving video visibility, reinforcing prior studies on SEO optimization and digital content strategies [56]. These insights expand theoretical models on content discoverability, emphasizing that keyword optimization may serve as a stronger predictor of video success than structural video attributes.
From a practical perspective, this study provides actionable insights for content creators, marketers, and organizations using YouTube as a promotional platform. The confirmation of H5 and H6 suggests that strategic keyword use in video titles significantly influences viewership, supporting best practices in digital marketing that advocate for SEO-driven content strategies [57]. Organizations in the fishery and sustainability sector can leverage this finding to optimize their video campaigns by incorporating high-impact keywords aligned with audience search behaviors. Furthermore, the confirmed relationship between views and user interactions (H7) underscores the need for engagement-driven content strategies. Given that videos with higher numbers of likes receive increased visibility and organic reach, marketers should prioritize community engagement through compelling storytelling and interactive features [58]. This aligns with broader digital marketing research emphasizing the role of engagement metrics in social media algorithm rankings [59].
Although this study offers important contributions, it also presents certain limitations that open pathways for future research. First, the sample consists of videos from a specific thematic domain—fisheries and environmental sustainability—raising concerns about the generalizability of findings to other industries. The effects of keywords and engagement metrics may vary across different content genres, such as entertainment, education, or product marketing. Future research should extend the analysis to diverse thematic categories to examine whether similar keyword-driven patterns hold across industries [60]. Moreover, the analysis relies on cross-sectional data gathered at a specific moment, limiting insights into longitudinal trends. A time-series analysis of video performance over extended periods would offer a deeper understanding of the evolution of keyword effectiveness and engagement patterns [61].
Another key limitation is the exclusion of qualitative video characteristics, such as production quality, storytelling techniques, and audience demographics. While the study confirms the statistical significance of keyword selection and engagement metrics, it does not account for content quality factors that may drive user interest [62]. For instance, videos with compelling narratives and high production value may experience higher engagement regardless of keyword optimization. Future studies should incorporate qualitative content analysis methods to explore the impact of storytelling, visual aesthetics, and brand positioning on video success. Additionally, research could examine the role of psychographic segmentation in understanding how different audience personas interact with various types of video content [63].
Looking ahead, subsequent studies should investigate the cause-and-effect dynamics between subscriber count and video views in the context of fisheries. While this study acknowledges that a channel’s subscriber base may influence video reach, the direction of causality remains unclear. A larger-scale, longitudinal dataset would help establish whether an increase in video views leads to higher subscriber growth or vice versa [64]. Moreover, further investigation into the early-life performance of videos is warranted. Since video longevity is a confirmed predictor of views, researchers should examine factors that accelerate early video traction, such as promotional strategies, cross-platform marketing, and influencer collaborations [65]. Understanding how videos gain momentum in their initial stages would be particularly beneficial for marketers seeking to optimize content distribution strategies.
To sum up, this research offers essential perspectives on the function of keyword optimization, engagement metrics, and video longevity in determining YouTube video success. While it confirms the importance of strategic keyword selection and user interactions, it also challenges traditional assumptions regarding video duration and metadata structure. These findings offer both theoretical contributions to digital marketing literature and practical implications for content creators aiming to enhance the video discoverability of fisheries. However, this study’s limitations highlight the need for broader, cross-industry research incorporating qualitative and demographic factors. Future investigations should explore longitudinal video performance trends, audience segmentation, and the interplay between content quality and algorithmic visibility. By filling these research voids, academics and professionals are able to further refine content marketing strategies and improve the effectiveness of digital campaigns across diverse platforms.

Author Contributions

Conceptualization, E.G., N.T.G. and D.P.S.; methodology, E.G., N.T.G. and D.P.S.; software, E.G., N.T.G. and D.P.S.; validation, E.G., N.T.G. and D.P.S.; formal analysis, E.G., N.T.G. and D.P.S.; investigation, E.G., N.T.G. and D.P.S.; resources, E.G., N.T.G. and D.P.S.; data curation, E.G., N.T.G. and D.P.S.; writing—original draft preparation, E.G., N.T.G. and D.P.S.; writing—review and editing, E.G., N.T.G. and D.P.S.; visualization, E.G., N.T.G. and D.P.S.; supervision, E.G., N.T.G. and D.P.S.; project administration, E.G., N.T.G. and D.P.S.; funding acquisition, E.G., N.T.G. and D.P.S. All authors have read and agreed to the published version of the manuscript.

Funding

This research received no external funding.

Institutional Review Board Statement

Not applicable.

Informed Consent Statement

Not applicable.

Data Availability Statement

Dataset available upon request from the authors.

Conflicts of Interest

The authors declare no conflicts of interest.

Appendix A

Table A1. Stop Words.
a; a’s; able; about; above; according; accordingly; across; actually; after; afterwards; again; against; ain’t; all; allow; allows; almost; alone; along; already; also; although; always; am; among; amongst; an; and; another; any; anybody; anyhow; anyone; anything; anyway; anyways; anywhere; apart; appear; appreciate; appropriate; are; aren’t; around; as; aside; ask; asking; associated; at; available; away; awfully; b; be; became; because; become; becomes; becoming; been; before; beforehand; behind; being; believe; below; beside; besides; best; better; between; beyond; both; brief; but; by; c; c’mon; c’s; came; can; can’t; cannot; cant; cause; causes; certain; certainly; changes; clearly; co; com; come; comes; concerning; consequently; consider; considering; contain; containing; contains; corresponding; could; couldn’t; course; currently; d; definitely; described; despite; did; didn’t; different; do; does; doesn’t; doing; don’t; done; down; downwards; during; e; each; edu; eg; eight; either; else; elsewhere; enough; entirely; especially; et; etc; even; ever; every; everybody; everyone; everything; everywhere; ex; exactly; example; except; f; far; few; fifth; first; five; followed; following; follows; for; former; formerly; forth; four; from; further; furthermore; g; get; gets; getting; given; gives; go; goes; going; gone; got; gotten; greetings; h; had; hadn’t; happens; hardly; has; hasn’t; have; haven’t; having; he; he’s; hello; help; hence; her; here; here’s; hereafter; hereby; herein; hereupon; hers; herself; hi; him; himself; his; hither; hopefully; how; howbeit; however; i; i’d; i’ll; i’m; i’ve; ie; if; ignored; immediate; in; inasmuch; inc; indeed; indicate; indicated; indicates; inner; insofar; instead; into; inward; is; isn’t; it; it’d; it’ll; it’s; its; itself; j; just; k; keep; keeps; kept; know; knows; known; l; last; lately; later; latter; latterly; least; less; lest; let; let’s; like; liked; likely; little; look; looking; looks; ltd; m; mainly; many; may; maybe; me; mean; meanwhile; merely; might; more; moreover; most; mostly; much; must; my; myself; n; name; namely; nd; near; nearly; necessary; need; needs; neither; never; nevertheless; new; next; nine; no; nobody; non; none; noone; nor; normally; not; nothing; novel; now; nowhere; o; obviously; of; off; often; oh; ok; okay; old; on; once; one; ones; only; onto; or; other; others; otherwise; ought; our; ours; ourselves; out; outside; over; overall; own; p; particular; particularly; per; perhaps; placed; please; plus; possible; presumably; probably; provides; q; que; quite; qv; r; rather; rd; re; really; reasonably; regarding; regardless; regards; relatively; respectively; right; s; said; same; saw; say; saying; says; second; secondly; see; seeing; seem; seemed; seeming; seems; seen; self; selves; sensible; sent; serious; seriously; seven; several; shall; she; should; shouldn’t; since; six; so; some; somebody; somehow; someone; something; sometime; sometimes; somewhat; somewhere; soon; sorry; specified; specify; specifying; still; sub; such; sup; sure; t; t’s; take; taken; tell; tends; th; than; thank; thanks; thanx; that; that’s; thats; the; their; theirs; them; themselves; then; thence; there; there’s; thereafter; thereby; therefore; therein; theres; thereupon; these; they; they’d; they’ll; they’re; they’ve; think; third; this; thorough; thoroughly; those; though; three; through; throughout; thru; thus; to; together; too; took; toward; towards; tried; tries; truly; try; trying; twice; two; u; un; under; unfortunately; unless; unlikely; until; unto; up; upon; us; use; used; useful; uses; using; usually; uucp; v; value; various; very; via; viz; vs; w; want; wants; was; wasn’t; way; we; we’d; we’ll; we’re; we’ve; welcome; well; went; were; weren’t; what; what’s; whatever; when; whence; whenever; where; where’s; whereafter; whereas; whereby; wherein; whereupon; wherever; whether; which; while; whither; who; who’s; whoever; whole; whom; whose; why; will; willing; wish; with; within; without; won’t; wonder; would; would; wouldn’t; x; y; yes; yet; you; you’d; you’ll; you’re; you’ve; your; yours; yourself; yourselves; z; zero; i; me; my; myself; we; our; ours; ourselves; you; your; yours; yourself; yourselves; he; him; his; himself; she; her; hers; herself; it; its; itself; they; them; their; theirs; themselves; what; which; who; whom; this; that; these; those; am; is; are; was; were; be; been; being; have; has; had; having; do; does; did; doing; would; should; could; ought; i’m; you’re; he’s; she’s; it’s; we’re; they’re; i’ve; you’ve; we’ve; they’ve; i’d; you’d; he’d; she’d; we’d; they’d; i’ll; you’ll; he’ll; she’ll; we’ll; they’ll; isn’t; aren’t; wasn’t; weren’t; hasn’t; haven’t; hadn’t; doesn’t; don’t; didn’t; won’t; wouldn’t; shan’t; shouldn’t; can’t; cannot; couldn’t; mustn’t; let’s; that’s; who’s; what’s; here’s; there’s; when’s; where’s; why’s; how’s; a; an; the; and; but; if; or; because; as; until; while; of; at; by; for; with; about; against; between; into; through; during; before; after; above; below; to; from; up; down; in; out; on; off; over; under; again; further; then; once; here; there; when; where; why; how; all; any; both; each; few; more; most; other; some; such; no; nor; not; only; own; same; so; than; too; very; a; about; above; across; after; again; against; all; almost; alone; along; already; also; although; always; among; an; and; another; any; anybody; anyone; anything; anywhere; are; area; areas; around; as; ask; asked; asking; asks; at; away; back; backed; backing; backs; be; became; because; become; becomes; been; before; began; behind; being; beings; best; better; between; big; both; but; by; came; can; cannot; case; cases; certain; certainly; clear; clearly; come; could; did; differ; different; differently; do; does; done; down; down; downed; downing; downs; during; each; early; either; end; ended; ending; ends; enough; even; evenly; ever; every; everybody; everyone; everything; everywhere; face; faces; fact; facts; far; felt; few; find; finds; first; for; four; from; full; fully; further; furthered; furthering; furthers; gave; general; generally; get; gets; give; given; gives; go; going; good; goods; got; great; greater; greatest; group; grouped; grouping; groups; had; has; have; having; he; her; here; herself; high; high; high; higher; highest; him; himself; his; how; however; i; if; important; in; interest; interested; interesting; interests; into; is; it; its; itself; just; keep; keeps; kind; knew; know; known; knows; large; largely; last; later; latest; least; less; let; lets; like; likely; long; longer; longest; made; make; making; man; many; may; me; member; members; men; might; more; most; mostly; mr; mrs; much; must; my; myself; necessary; need; needed; needing; needs; never; new; new; newer; newest; next; no; nobody; non; noone; not; nothing; now; nowhere; number; numbers; of; off; often; old; older; oldest; on; once; one; only; open; opened; opening; opens; or; order; ordered; ordering; orders; other; others; our; out; over; part; parted; parting; parts; per; perhaps; place; places; point; pointed; pointing; points; possible; present; presented; presenting; presents; problem; problems; put; puts; quite; rather; really; right; right; room; rooms; said; same; saw; say; says; second; seconds; see; seem; seemed; seeming; seems; sees; several; shall; she; should; show; showed; showing; shows; side; sides; since; small; smaller; smallest; some; somebody; someone; something; somewhere; state; states; still; still; such; sure; take; taken; than; that; the; their; them; then; there; therefore; these; they; thing; things; think; thinks; this; those; though; thought; thoughts; three; through; thus; to; today; together; too; took; toward; turn; turned; turning; turns; two; under; until; up; upon; us; use; used; uses; very; want; wanted; wanting; wants; was; way; ways; we; well; wells; went; were; what; when; where; whether; which; while; who; whole; whose; why; will; with; within; without; work; worked; working; works; would; year; years; yet; you; young; younger; youngest; your; yours
Table A2. Kept Words.
sea; oceana; bay; nrdc; monterey; ocean; aquarium; seafood; cam; sustainable; otter; live; fish; marine; climate; msc; clean; water; change; oceans; green; oil; food; list; action; deans; meet; shark; day; fishing; save; tuna; sharks; gulf; fisheries; nrdc’s; life; octopus; sands; tar; deep; stewardship; world; future; pollution; wild; whales; asc; protect; feeding; council; energy; watch; dr; exhibit; global; kelp; species; time; turtles; growing; health; penguin; power; stop; voices; president; spill; stories; blue; california; fast; fund; wfm; white; fishery; conservation; forest; issf; protecting; saving; home; matters; plastic; pup; salmon; atlantic; carbon; chick; jellies; keystone; obama; pipeline; redford; robert; video; whale; brewers; conference; earth; support; 3; bycatch; campaign; cuttlefish; diving; fishes; message; north; otters; pacific; psa; recipe; tide; xl; animal; aquaculture; biogems; coast; dolphins; drilling; mediterranean; river; talks; tour; york; alaska; de; defender; environmental; insights; offshore; penguins; science; south; squid; corner; critter; crossing; feed; festival; habitat; research; turtle; warming; acid; awards; chain; chef; fight; jelly; noaa; plan; seals; test; week; act; air; baby; certified; comb; custody; director; jobs; planet; plant; resident; scenes; sen; sustainability; america; endangered; fisherman; happy; indian; king; morning; party; purse; reef; reel; rule; seine; trailer; training; water

References

  1. Busche, L. Powering Content: Building a Nonstop Content Marketing Machine; O’Reilly Media, Inc.: Sebastopol, CA, USA, 2017. [Google Scholar]
  2. Pateil, N. 11 Reasons You Need to Focus on Long-Tail Keywords for SEO. 2018. Available online: https://neilpatel.com/blog/long-tail-keywords-seo/ (accessed on 27 June 2023).
  3. Alderson, J. How to Use Headings on Your Site. Available online: https://yoast.com/how-to-use-headings-on-your-site/ (accessed on 27 June 2023).
  4. Ahola, A. The SEO Battlefield; O’Reilly Media, Inc.: Sebastopol, CA, USA, 2017. [Google Scholar]
  5. Yang, J.; Zhang, J.; Zhang, Y. Engagement that sells: Influencer video advertising on TikTok. Mark. Sci. 2024, 44, 247–267. [Google Scholar] [CrossRef]
  6. Hoiles, W.; Aprem, A.; Krishnamurthy, V. Engagement dynamics and sensitivity analysis of YouTube videos. arXiv 2016, arXiv:1611.00687. [Google Scholar] [CrossRef]
  7. Nguyen, K.; Nguyen, N.; Cao, P.; Vo, L.; Kieu, T. Understanding AI-Based Content Recommendation Experience Perceptions on Short-Video Platforms and Enhancing Customer Engagement: The Mediation of Empathy and Self-Congruence. Int. J. Hum. Comput. Interact. 2024, 1–17. [Google Scholar] [CrossRef]
  8. Tafesse, W. YouTube marketing: How marketers’ video optimization practices influence video views. Internet Res. 2020, 30, 1689–1707. [Google Scholar] [CrossRef]
  9. Park, J.S.; Park, J.H.; Park, J.H. The effects of user engagements for user and company generated videos on music sales: Empirical evidence from YouTube. Front. Psychol. 2018, 9, 1880. [Google Scholar] [CrossRef] [PubMed]
  10. Roy, M.; Kar, P.; Datta, S. Recommender Systems: A Multi-Disciplinary Approach; CRC Press: Boca Raton, FL, USA, 2023. [Google Scholar]
  11. Moriuchi, E. English accent variations in YouTube voice-over ads and the role of perceptions on attitude and purchase intentions. J. Interact. Advert. 2021, 21, 191–208. [Google Scholar] [CrossRef]
  12. Harmeling, C.M.; Moffett, J.W.; Arnold, M.J.; Carlson, B.D. Toward a theory of customer engagement marketing. J. Acad. Mark. Sci. 2017, 45, 312–335. [Google Scholar] [CrossRef]
  13. Khan, A.; Khan, Z.; Nabi, M.K.; Saleem, I. Unveiling the role of social media and females’ intention to buy online cosmetics. Glob. Knowl. Mem. Commun. 2024; ahead-of-print. [Google Scholar] [CrossRef]
  14. Lou, C.; Jin, S.V. Charting new waters in influencer advertising: Summary of recent inquiries. J. Interact. Advert. 2024, 24, 103–106. [Google Scholar] [CrossRef]
  15. Ladhari, R.; Massa, E.; Skandrani, H. YouTube vloggers’ popularity and influence: The roles of homophily, emotional attachment, and expertise. J. Retail. Consum. Serv. 2020, 54, 102027. [Google Scholar] [CrossRef]
  16. De Veirman, M.; Hudders, L.; Nelson, M.R. What is influencer marketing and how does it target children? A review and direction for future research. Front. Psychol. 2019, 10, 498106. [Google Scholar] [CrossRef]
  17. Huang, Z.; Benyoucef, M. The effects of social commerce design on consumer purchase decision-making: An empirical study. Electron. Commer. Res. Appl. 2017, 25, 40–58. [Google Scholar] [CrossRef]
  18. Lee, J.K. The effects of team identification on consumer purchase intention in sports influencer marketing: The mediation effect of ad content value moderated by sports influencer credibility. Cogent Bus. Manag. 2021, 8, 1957073. [Google Scholar] [CrossRef]
  19. Dwivedi, Y.K.; Hughes, L.; Ismagilova, E.; Aarts, G.; Coombs, C.; Crick, T.; Duan, Y.; Dwivedi, R.; Edwards, J.; Eirug, A.; et al. Artificial Intelligence (AI): Multidisciplinary perspectives on emerging challenges, opportunities, and agenda for research, practice and policy. Int. J. Inf. Manag. 2021, 57, 101994. [Google Scholar] [CrossRef]
  20. Alalwan, A.A. Investigating the impact of social media advertising features on customer purchase intention. Int. J. Inf. Manag. 2018, 42, 65–77. [Google Scholar] [CrossRef]
  21. Love, D.C.; da Silva, P.P.; Olson, J.; Fry, J.P.; Clay, P.M. Fisheries, food, and health in the USA: The importance of aligning fisheries and health policies. Agric. Food Secur. 2017, 6, 16. [Google Scholar] [CrossRef]
  22. Mai, N.; Bogason, S.G.; Arason, S.; Arason, S.V.; Matthiasson, T.G. Benefits of traceability in fish supply chains–case studies. Br. Food J. 2010, 112, 976–1002. [Google Scholar] [CrossRef]
  23. Abedi, A.; Zhu, W. An optimisation model for purchase, production and distribution in fish supply chain–a case study. Int. J. Prod. Res. 2017, 55, 3451–3464. [Google Scholar] [CrossRef]
  24. Gardner, C.J.; Rocliffe, S.; Gough, C.; Levrel, A.; Singleton, R.L.; Vincke, X.; Harris, A. Value Chain Challenges in Two Community-Managed Fisheries in Western Madagascar: Insights for the Small-Scale Fisheries Guidelines. In The Small-Scale Fisheries Guidelines; Jentoft, S., Chuenpagdee, R., Barragán-Paladines, M.J., Franz, N., Eds.; MARE Publication Series: Amsterdam, The Netherlands, 2017; p. 14. [Google Scholar] [CrossRef]
  25. Ivanov, D.; Das, A.; Choi, T.M. New flexibility drivers for manufacturing, supply chain and service operations. Int. J. Prod. Res. 2018, 56, 3359–3368. [Google Scholar] [CrossRef]
  26. Mondragon, A.E.C.; Mondragon, C.E.C.; Coronado, E.S. Managing the food supply chain in the age of digitalisation: A conceptual approach in the fisheries sector. Prod. Plan. Control. 2021, 32, 242–255. [Google Scholar] [CrossRef]
  27. Fowler, F. Survey Research Methods; Sage Publication: London, UK, 2014. [Google Scholar]
  28. McNeill, P.; Chapman, S. Research Methods; Routledge: London, UK, 2005. [Google Scholar]
  29. Avadí, A.; Fréon, P.; Tam, J. Coupled ecosystem/supply chain modelling of fish products from sea to shelf: The Peruvian anchoveta case. PLoS ONE 2014, 9, e102057. [Google Scholar] [CrossRef]
  30. Kumar, K.; Zindani, D.; Davim, J.P. Industry 4.0: Developments Towards the Fourth Industrial Revolution; Springer: Berlin/Heidelberg, Germany, 2019. [Google Scholar]
  31. Akhtar, P.; Ghouri, A.M.; Saha, M.; Khan, M.R.; Shamim, S.; Nallaluthan, K. Industrial digitization, the use of real-time information, and operational agility: Digital and information perspectives for supply chain resilience. IEEE Trans. Eng. Manag. 2022, 71, 10387–10397. [Google Scholar] [CrossRef]
  32. Khan, S.W.; Shahwar, D.; Khalid, S. Unlocking the Potential of YouTube Marketing Communication: The Effects of YouTube Influencer Attributes on Millennials’ Purchase Intention in Pakistan. Ann. Soc. Sci. Perspect. 2023, 4, 65–76. [Google Scholar]
  33. Verma, S.; Kapoor, D.; Gupta, R. Role of influencer–follower congruence in influencing followers’ food choices and brand advocacy: Mediating role of perceived trust. Br. Food J. 2024, 126, 4055–4071. [Google Scholar] [CrossRef]
  34. Aw, E.C.X.; Agnihotri, R. Influencer marketing research: Review and future research agenda. J. Mark. Theory Pract. 2024, 32, 435–448. [Google Scholar] [CrossRef]
  35. Christensen, V.; de la Puente, S.; Sueiro, J.C.; Steenbeek, J.; Majluf, P. Valuing seafood: The Peruvian fisheries sector. Mar. Policy 2014, 44, 302–311. [Google Scholar] [CrossRef]
  36. FoodΤank. 16 Organizations Promoting Sustainable Fishing Practices. Available online: https://foodtank.com/news/2017/10/sustainable-fisheries-list/ (accessed on 10 July 2023).
  37. Iue, M.; Makino, M.; Asari, M. Seafood Sustainability Supply Chain Trends and Challenges in Japan: Marine Stewardship Council Fisheries and Chain of Custody Certificates. Sustainability 2022, 14, 13523. [Google Scholar] [CrossRef]
  38. VIDIQ. Available online: https://vidiq.com/ (accessed on 10 July 2023).
  39. FoodΤank. Available online: https://foodtank.com/ (accessed on 10 July 2023).
  40. Hair, J.F.; Anderson, R.E.; Black, W.C. Multivariate Data Analysis; Pearson: Harlow, UK, 2014. [Google Scholar]
  41. Cha, M.; Kwak, H.; Rodriguez, P.; Ahn, Y.Y.; Moon, S. Analyzing the video popularity characteristics of large-scale user generated content systems. IEEE/ACM Trans. Netw. 2009, 17, 1357–1370. [Google Scholar] [CrossRef]
  42. Covington, P.; Adams, J.; Sargin, E. Deep neural networks for YouTube recommendations. In Proceedings of the 10th ACM Conference on Recommender Systems, Boston, MA, USA, 15–19 September 2016; pp. 191–198. [Google Scholar] [CrossRef]
  43. Brodie, R.J.; Ilic, A.; Juric, B.; Hollebeek, L. Consumer engagement in a virtual brand community: An exploratory analysis. J. Bus. Res. 2013, 66, 105–114. [Google Scholar] [CrossRef]
  44. Guo, P.J.; Kim, J.; Rubin, R. How video production affects student engagement: An empirical study of MOOC videos. In Proceedings of the 1st ACM Conference on Learning @ Scale Conference, Atlanta, GA, USA, 4–5 March 2014; pp. 41–50. [Google Scholar] [CrossRef]
  45. Munaro, A.C.; Hübner Barcelos, R.; Francisco Maffezzolli, E.C.; Santos Rodrigues, J.P.; Cabrera Paraiso, E. To engage or not engage? The features of video content on YouTube affecting digital consumer engagement. J. Consum. Behav. 2021, 20, 1336–1352. [Google Scholar] [CrossRef]
  46. Bishop, S. Algorithmic experts: Selling algorithmic lore on YouTube. Soc. Media + Soc. 2020, 6. [Google Scholar] [CrossRef]
  47. Gothankar, R.; Troia, F.D.; Stamp, M. Clickbait detection for YouTube videos. In Artificial Intelligence for Cybersecurity; Stamp, M., Aaron Visaggio, C., Mercaldo, F., Di Troia, F., Eds.; Springer: Cham, Switzerland, 2022; pp. 261–284. [Google Scholar] [CrossRef]
  48. Manawathilake, C.; Ganegoda, G.U. Optimizing YouTube Video Discoverability Through Trend Analysis and Hashtag Generation. In Proceedings of the 2024 9th International Conference on Information Technology Research (ICITR), Colombo, Sri Lanka, 5–6 December 2024; pp. 1–6. [Google Scholar] [CrossRef]
  49. Smith, A.N.; Fischer, E.; Yongjian, C. How does brand-related user-generated content differ across YouTube, Facebook, and Twitter? J. Interact. Mark. 2012, 26, 102–113. [Google Scholar] [CrossRef]
  50. Peiris, P.; Herath, T.; Dissanayaka, R.; Saranga, K.; Thelijjagoda, S.; Weerathunge, I. Comprehensive Browser Extension for Analysing YouTube User Engagement, Controversy, User Requirements, and Trending Keywords. In Proceedings of the 2023 33rd International Telecommunication Networks and Applications Conference, Melbourne, Australia, 29 November–1 December 2023; pp. 134–139. [Google Scholar] [CrossRef]
  51. Naeem, M. The role of social media to generate social proof as engaged society for stockpiling behaviour of customers during COVID-19 pandemic. Qual. Mark. Res. Int. J. 2021, 24, 281–301. [Google Scholar] [CrossRef]
  52. Berger, J.; Milkman, K.L. What makes online content viral? J. Mark. Res. 2012, 49, 192–205. [Google Scholar] [CrossRef]
  53. Kapoor, K.K.; Tamilmani, K.; Rana, N.P.; Patil, P.; Dwivedi, Y.K.; Nerur, S. Advances in social media research: Past, present and future. Inf. Syst. Front. 2018, 20, 531–558. [Google Scholar] [CrossRef]
  54. Zhang, S.; Cabage, N. Does SEO Matter? Increasing Classroom Blog Visibility Through Search Engine Optimization. In Proceedings of the 46th Hawaii International Conference on System Sciences (HICSS), Maui, HI, USA, 7–10 January 2013. [Google Scholar]
  55. Wang, F.; Li, Y.; Zhang, Y. An empirical study on the search engine optimization technique and its outcomes. In Proceedings of the 2nd International Conference on Artificial Intelligence, Management Science and Electronic Commerce (AIMSEC), Chongqing, China, 8 August 2011; pp. 2767–2770. [Google Scholar]
  56. Benoit, K.; Muhr, K.; Watanabe, K. Stopwords: Multilingual Stopword Lists. R Package Version 2.2. Available online: https://CRAN.R-project.org/package=stopwords (accessed on 16 July 2023).
  57. Meyers, L.S.; Gamst, G.; Guarino, A.J. Applied Multivariate Research: Design and Interpretation; Sage Publications: Thousand Oaks, CA, USA, 2006. [Google Scholar]
  58. Dessart, L.; Pitardi, V. How stories generate consumer engagement: An exploratory Study. J. Bus. Res. 2019, 104, 183–195. [Google Scholar] [CrossRef]
  59. Sakas, D.P.; Giannakopoulos, N.T.; Terzi, M.C.; Kamperos, I.D.G.; Kanellos, N. What is the connection between Fintechs’ video marketing and their vulnerable customers’ brand engagement during crises? Int. J. Bank Mark. 2024, 42, 1313–1347. [Google Scholar] [CrossRef]
  60. Giannakopoulos, N.T.; Reklitis, D.P.; Terzi, M.C.; Sakas, D.P.; Kanellos, N. Video marketing for decentralized finance platforms’ services. J. Financ. Serv. Mark. 2024, 29, 1225–1259. [Google Scholar] [CrossRef]
  61. Roetzel, P.G. Information overload in the information age: A review of the literature from business administration, business psychology, and related disciplines with a bibliometric approach and framework development. Bus. Res. 2018, 12, 479–522. [Google Scholar] [CrossRef]
  62. Oosterbaan, R.J. Statistical Significance of Segmented Linear Regression with Break-Point Using Variance Analysis (Anova) and F-Tests. Available online: https://www.waterlog.info/pdf/anova.pdf (accessed on 19 July 2023).
  63. Paternoster, R.; Brame, R.; Mazerolle, P.; Piquero, A. Using the correct statistical test for equality of regression coefficients. Criminology 1998, 36, 859–866. [Google Scholar] [CrossRef]
  64. Field, A. Discovering Statistics Using SPSS; Sage Publications: London, UK, 2009. [Google Scholar]
  65. Hinson, R.E.; Mhlanga, D.; Osei-Frimpong, K.; Doe, J. Social Media Marketing Management: How to Penetrate Emerging Markets and Expand Your Customer Base; CRC Press: Boca Raton, FL, USA, 2024. [Google Scholar]
Figure 1. Distribution of video output.
Information 16 00353 g001
Figure 2. Distribution of video views.
Information 16 00353 g002
Figure 3. Histogram of the (natural) logarithm of views.
Information 16 00353 g003
Figure 4. Video duration per channel and its mean values.
Information 16 00353 g004
Figure 5. Length of time videos remain active (AGE).
Information 16 00353 g005
Figure 6. Distribution of title word count (TITLE_COUNT) per channel.
Information 16 00353 g006
Figure 7. Distribution of the number of words in the description (DESC_COUNT) per channel.
Information 16 00353 g007
Figure 8. Scatterplot between video views and the “likes” from users.
Information 16 00353 g008
Figure 9. Grouping of videos based on their views and the “likes” from users.
Information 16 00353 g009
Table 1. Distribution of videos by channel participating in the survey.
Variable NameDescription
(a) DATE_PUBLISHEDRefers to the date of publication of each video. Used to calculate the time interval during which each video remains active.
(b) AGERefers to the number of days a video remains active, calculated as the difference between DATE_PUBLISHED and the reference date (3 May 2021).
(c) TITLERefers to the title of each video (in characters/words) as given by the producer. Used to identify the language of the title and analyze individual key words.
(d) TITLE _WORD_COUNTRefers to the number of words (including non-trivial) in the video title. This reflects the “length” of the title.
(e) DESCRIPTIONRefers to the video description (in characters/words), as provided by the producer. Used to identify the language of the video.
(f) DESC_WORD_COUNTRefers to the number of words in the video description. Indicates the “length” of the description in words.
(g) DURATIONRefers to the duration of the video in hours, minutes, and seconds.
(h) DURATION_SECRefers to the duration of the video in seconds. This variable is derived from DURATION for analysis consistency.
(i) VIDEO_IDAn auxiliary variable used to identify each video uniquely on YouTube. It ensures data integrity and accuracy, and videos without an ID were excluded from analysis.
Table 2. Distribution of videos by channel participating in the survey.
YouTube Channels n
Aquaculture Stewardship Council 967
International Seafood Sustainability Foundation 649
Marine Conservation Alliance 415
Marine Stewardship Council 308
Monteray Bay Aquarium 169
N.A.M.A. 150
National Oceanic and Atmospheric Administration 136
Natural Resources Defense Council 73
Oceana 15
Total2882
Table 3. Subscribers per sample channel.
YouTube Channel Subscribers
Aquaculture Stewardship Council24,000
International Seafood Sustainability Foundation158,000
Marine Conservation Alliance116,000
Marine Stewardship Council3630
Monteray Bay Aquarium9040
N.A.M.A.310
National Oceanic and Atmospheric Administration672
Natural Resources Defense Council45
Oceana142
Table 4. Production period of the videos per sample channel.
YouTube ChannelMin DateMax Date
Aquaculture Stewardship Council8 March 200624 February 2021
International Seafood Sustainability Foundation26 July 20062 November 2021
Marine Conservation Alliance22 June 20061 May 2021
Marine Stewardship Council7 April 20073 April 2021
Monteray Bay Aquarium17 November 201020 November 2020
N.A.M.A.5 August 20138 April 2021
National Oceanic and Atmospheric Administration23 December 20103 September 2020
Natural Resources Defense Council10 April 201010 July 2020
Oceana27 June 201026 September 2012
Table 5. Asymmetry of sample video views.
MetricsViews
Min.1
Q1459
Median1834.00
Mean37,445.00
Q36484
Max.36,209.288
Skewness (asymmetry)44.1
Table 6. Asymmetry YT LIKES sample video.
MetricsViews
Min.0
Q13
Median13
Mean236.4
Q382
Max.161.841
Skewness (asymmetry)42.0
Table 7. Asymmetry of video duration per sample channel.
Metrics (per Channel) MinQ1Q2Q3MaxAvgSkew
Aquaculture Stewardship Council3631161955512176.511.0
International Seafood Sustainability Foundation659118381043,2745079.11.8
Marine Conservation Alliance12506510735,290182.320.2
Marine Stewardship Council1348782076835303.45.4
Monteray Bay Aquarium1597201258481182.4−0.1
N.A.M.A.6631142256588223.210.1
National Oceanic and Atmospheric Administration16491272293839299.54.6
Natural Resources Defense Council6481532161094169.32.9
Oceana61110145173384158.31.4
Table 8. Model summary of the active days (AGE).
Model Summary
Observations2743
F-statistic7.47
df-regression1
df-residuals2742
Significance F0.006
Table 9. AGE model coefficients.
Model Coefficients
Estimate2.5%97.5%Std. Errort valuePr(>|t|)
AGE (days)154.225.75.52.7330.006
Table 10. Model summary of the video duration.
Model Summary
Observations2882
F-statistic0.19
df-regression1
df-residuals2880
Significance F0.66
Table 11. Video duration model coefficients.
Model Coefficients
Estimate2.5%97.5%Std. Errort valuePr(>|t|)
(Intercept)39.00811.93166.62514.0852.770.006
DURATION SEC−1−6.54.12.7−0.440.66
Table 12. Model summary of the video title.
Model Summary
Observations2882
F-statistic0.02
df-regression1
df-residuals2880
Significance F0.90
Table 13. Video title model coefficients.
Model Coefficients
Estimate2.5%97.5%Std. Errort valuePr(>|t|)
(Intercept)41.299−24.567107.16533.5921.230.22
TITLE WORD COUNT−472−7.8496.9043.762−0.130.90
Table 14. Model summary of the number of words.
Model Summary
Observations 2876
F-statistic 0.19
df-regression 1
df-residuals 2874
Significance F 0.67
Table 15. Number of words model coefficients.
Model Coefficients
Estimate2.5%97.5%Std. Errort valuePr(>|t|)
(Intercept)42.4607.11077.81118.0292.360.02
DESC COUNT−70−390250163−0.430.67
Table 16. Model summary of video keywords and views.
Model Summary
VIEWSLOG (VIEWS)
Observations7.0667.066
F-statistic0.8217.54
df-regression184184
df-residuals6.8816.881
Significance F0.960.00
R20.020.32
Adjusted R20.000.30
Table 17. Statistical significance between specific video keywords and the views.
Estimate2.50%97.50%Pr (>|t|)
(Intercept)8.287.389.170.000
asc−3.69−4.68−2.710.000
week−3.59−4.60−2.580.000
custody−3.99−5.13−2.850.000
chain−3.88−5.01−2.750.000
recipe−3.56−4.64−2.480.000
festival−3.95−5.22−2.680.000
training−3.57−4.75−2.390.000
wfm−2.96−4.01−1.920.000
issfsf−2.74−3.83−1.650.000
reel−3.31−4.66−1.960.000
matters−2.72−3.86−1.570.000
insights−2.95−4.20−1.710.000
fish−2.20−3.15−1.260.000
fishes−2.44−3.60−1.270.000
defender−2.59−3.83−1.340.000
msc−1.95−2.90−1.010.000
stewardship−2.10−3.12−1.080.000
council−2.13−3.17−1.100.000
brewers−2.43−3.63−1.240.000
pup2.231.123.340.000
tour−2.45−3.68−1.220.000
seafood−1.87−2.82−0.920.000
campaign−2.37−3.58−1.160.000
de−1.92−2.90−0.930.000
aquaculture−2.31−3.50−1.110.000
biogems−2.35−3.58−1.130.000
message−2.31−3.52−1.100.000
dr−1.98−3.03−0.920.000
bycatch−2.20−3.39−1.000.000
power−1.93−3.04−0.820.001
sustainability−2.23−3.52−0.940.001
seine−2.13−3.38−0.880.001
purse−2.13−3.38−0.880.001
jobs−2.16−3.42−0.890.001
rule−2.30−3.65−0.950.001
clean−1.65−2.63−0.670.001
nrdc’s−1.71−2.73−0.680.001
conference−1.88−3.07−0.680.002
otters1.870.683.070.002
plant−2.04−3.36−0.720.002
saving1.690.592.780.003
list−1.52−2.54−0.510.003
otter1.410.472.360.003
deans−1.52−2.53−0.500.003
sustainable−1.43−2.39−0.470.003
earth−1.68−2.82−0.540.004
plan−1.88−3.17−0.590.004
party−1.86−3.17−0.540.006
fisheries−1.44−2.47−0.400.006
energy−1.46−2.51−0.410.006
carbon−1.61−2.79−0.430.007
indian−1.80−3.15−0.450.009
marine−1.29−2.25−0.320.009
support−1.57−2.75−0.390.009
awards−1.63−2.85−0.400.009
food−1.31−2.32−0.300.011
climate−1.18−2.15−0.200.018
talks−1.43−2.62−0.230.019
planet−1.48−2.74−0.210.022
change−1.16−2.16−0.160.024
health−1.26−2.37−0.150.027
water−1.11−2.10−0.130.027
sen−1.44−2.73−0.150.028
offshore−1.34−2.57−0.110.032
fund−1.21−2.33−0.080.036
director−1.28−2.53−0.030.044
fishery−1.16−2.29−0.020.046
south−1.26−2.51−0.020.047
action−1.02−2.0500.049
fishing−1.01−2.0200.050
save−1.02−2.0400.050
protect−1.07−2.1400.050
Table 18. Model summary of the video views and the “likes” from users.
Model Summary
Observations2882
F-statistic976.2
df-regression1
df-residuals2880
Significance F0.00
R20.25
Adjusted R20.25
Table 19. Video views and “likes” from user model coefficients.
Model Coefficients
Estimate2.5%97.5%Std. Errort-valuePr(>|t|)
(Intercept)151.547.2255.753.22.80.004
VIEWS0.0022680.0021260.0024110.00007331.20.000
Table 20. Model summary of the two video views groups and the “likes” from users.
Model Summary
OverUnder
Observations3572525
F-statistic5.939159.347
df-regression11
df-residuals3562524
Significance F0.000.00
R20.940.98
Adjusted R20.940.98
Table 21. Statistical significance between the two video view groups and the “likes” from users.
Estimate2.50%97.50%Std. Errort ValuePr (>|t|)
VIEWS_OVER0.01120.0110.01150.0001577.10.000
VIEWS_UNDER0.00070.00070.00070.000399.20.000
Disclaimer/Publisher’s Note: The statements, opinions and data contained in all publications are solely those of the individual author(s) and contributor(s) and not of MDPI and/or the editor(s). MDPI and/or the editor(s) disclaim responsibility for any injury to people or property resulting from any ideas, methods, instructions or products referred to in the content.

