Article

HFMM-Net: A Hybrid Fusion Mamba Network for Efficient Multimodal Industrial Defect Detection

1
School of Electrical and Electronic Engineering, Hubei University of Technology, Wuhan 430068, China
2
Hubei Key Laboratory for High-Efficiency Utilization of Solar Energy and Operation Control of Energy Storage System, Hubei University of Technology, Wuhan 430068, China
*
Author to whom correspondence should be addressed.
Information 2025, 16(12), 1018; https://doi.org/10.3390/info16121018 (registering DOI)
Submission received: 21 August 2025 / Revised: 20 September 2025 / Accepted: 20 November 2025 / Published: 23 November 2025
(This article belongs to the Section Artificial Intelligence)

Abstract

With the increasing demand for higher precision and real-time performance in industrial surface defect detection, multimodal detection methods integrating RGB images and 3D point clouds have drawn considerable attention. However, current mainstream methods typically employ computationally expensive Transformer-based models for capturing global features, resulting in significant inference delays that hinder their practical deployment for online inspection tasks. Furthermore, existing approaches exhibit limited capability in deep cross-modal interactions, negatively impacting defect detection and segmentation accuracy. In this paper, we propose a novel multimodal anomaly detection framework based on a bidirectional Mamba network to enhance cross-modal feature interaction and fusion. Specifically, we introduce an anomaly-aware parallel feature extraction network, leveraging a hybrid scanning state space model (SSM) to efficiently capture global and long-range dependencies with linear computational complexity. Additionally, we develop a cross-enhanced feature fusion module to facilitate dynamic interaction and adaptive fusion of multimodal features at multiple scales. Extensive experiments conducted on two publicly available benchmark datasets, MVTec 3D-AD and Eyecandies, demonstrate that the proposed method consistently outperforms existing approaches in both defect detection and segmentation tasks.

1. Introduction

Industrial anomaly detection (AD) plays a vital role in modern manufacturing, particularly in high-precision industries such as semiconductor and automotive manufacturing. Its primary goal is to precisely identify potential defect areas from image or point-level data, thereby ensuring product quality and manufacturing safety [1]. With the development of intelligent manufacturing, increasing demands for accuracy and real-time detection capabilities have driven continuous advances in unsupervised anomaly detection methods.
Due to the scarcity and unpredictability of anomalous samples in industrial scenarios, current mainstream methods commonly adopt an unsupervised learning paradigm, training only on defect-free samples [2]. However, most existing approaches predominantly rely on RGB images as their primary information source. Although RGB images excel in color and texture representation, they remain prone to false positives and missed detections when faced with small, deformable, or illumination-sensitive defects, resulting in clear performance bottlenecks.
Recently, following the publication of multimodal industrial defect detection datasets, such as MVTec 3D-AD [3] and Eyecandies [4], multimodal fusion approaches combining RGB images and 3D point clouds have attracted significant attention [5,6,7]. Previous works, such as PatchCore + FPFH [8] and CPMF [9], have established strong baselines using handcrafted 3D local descriptors, while methods like BTF [10] and M3DM [11] have achieved excellent performance by constructing large-scale feature memory banks. Additionally, CFM [12] utilized modality-specific features extracted from frozen 2D and 3D encoders. Despite progress in performance, these methods still face two fundamental challenges: (1) low efficiency in long-range dependency modeling, as they predominantly employ Transformer-based architectures with quadratic computational complexity, limiting inference speed in high-resolution scenarios; (2) insufficient depth in cross-modal feature fusion, with current fusion strategies largely limited to simple concatenation or addition, lacking explicit mechanisms for modeling semantic relationships across modalities.
To address these issues, the Mamba architecture has recently been introduced into computer vision tasks, exhibiting promising performance [13]. Based on the state space model (SSM), Mamba effectively captures long-range dependencies via an implicit recursive mechanism while maintaining approximately linear computational complexity. Recent studies [14,15,16,17,18] demonstrated that Mamba not only achieves Transformer-level performance in tasks such as image recognition and segmentation but also significantly reduces inference latency and GPU memory usage, making it highly suitable for industrial online detection applications with strict requirements on speed and resources.
Motivated by these observations, we propose a novel multimodal unsupervised industrial anomaly detection framework called the Hybrid Fusion Mamba Network (HFMM-Net). Our method comprises two core components: First, a Dual-Path Mamba Encoder (DPME) separately extracts multi-scale features from RGB images and point cloud inputs using hybrid directional state space scanning, greatly enhancing global feature representation capability. Second, we design a Cross-Enhanced Fusion Mamba Block (Cro-EFMB), which dynamically injects cross-modal information at multiple scales through learnable cross-enhancement matrices and efficient two-dimensional SSM scanning, thereby achieving deep coupling and precise alignment across modalities. Additionally, to enhance segmentation resolution and preserve detail, we introduce an “upsampling + channel attention” decoder, progressively restoring fused multi-scale features to their original spatial resolution, thus aiding subsequent memory bank scoring and anomaly localization.
Extensive experiments on the MVTec 3D-AD and Eyecandies datasets demonstrate that our HFMM-Net significantly outperforms existing methods on various metrics, including Image-level Area Under the Receiver Operating Characteristic (I-AUROC), Pixel-level Area Under the Receiver Operating Characteristic (P-AUROC), and Area Under the Per-Region Overlap curve (AUPRO). Moreover, our approach exhibits strong robustness in low-sample scenarios while substantially reducing inference time and memory usage, showing great promise for practical industrial deployment.
The main contributions of this work are summarized as follows:
  • We propose HFMM-Net, a novel Mamba-based multimodal anomaly detection framework that achieves state-of-the-art detection and segmentation performance on MVTec 3D-AD and Eyecandies datasets.
  • We introduce a Dual-Path Mamba Encoder (DPME) that enhances multi-scale global feature representation using hybrid directional state space modeling while maintaining linear complexity.
  • We design a Cross-Enhanced Fusion Mamba Block (Cro-EFMB), enabling dynamic injection and efficient fusion of image and point cloud features, significantly enhancing modality complementarity and localization performance.

2. Related Work

2.1. Multimodal Industrial Anomaly Detection

Multimodal approaches, which integrate RGB images with 3D geometric information, have demonstrated improved robustness and detection accuracy in industrial anomaly detection. The MVTec 3D-AD dataset, proposed by Bergmann et al. in 2021 [3], provides precisely aligned RGB images and point clouds for each sample, enabling systematic investigation of multimodal anomaly detection under unified evaluation protocols. Based on this dataset, early methods primarily adopted distribution modeling techniques inspired by Generative Adversarial Networks (GANs) [19] and Variational Autoencoders (VAEs) [20]. Specifically, GAN-based approaches learned the distribution of normal samples and identified anomalies by evaluating reconstruction errors, whereas VAE-based methods estimated anomaly scores via reconstruction probabilities to facilitate pixel-level detection. Another category of methods relied on autoencoder architectures [21,22,23], where the discrepancy between input and reconstructed output served as the anomaly indicator.
Inspired by PatchCore [24], which introduced the use of memory banks in 2D image anomaly detection [25], Binary Transfer Fusion (BTF) [10] extended this idea to the 3D domain. In BTF, RGB features are first extracted using a frozen convolutional backbone, and multiple handcrafted 3D descriptors are then incorporated into a dedicated 3D memory bank to enhance sensitivity to fine-grained geometric anomalies. However, such handcrafted features are often fragile to noise and exhibit poor generalization across different domains.
To address the aforementioned limitations, M3DM [11] proposed a self-supervised Transformer-based multimodal feature fusion framework. It employs DINO [26] and Point Transformer [27,28,29] to extract high-dimensional 2D and 3D features, respectively, which are then projected into a unified feature space via a learnable fusion function and stored in a shared memory bank for fine-grained anomaly detection and segmentation. In contrast, CFM [12] utilizes modality-specific features extracted from frozen 2D and 3D encoders. As these feature extractors are fixed during training, the resulting representations lack adaptability and cannot be optimized for downstream tasks. Moreover, the CFM module fails to perform sufficient cross-modal interaction modeling when handling heterogeneous information, relying instead on static and shallow mapping functions for feature transformation. This significantly limits its ability to capture and represent fine-grained anomalies in complex industrial scenarios. TRD [30] revisits multimodal AD based on KD. Instead of forming a single fused teacher, which can smooth out anomalies when one modality is normal and the other is anomalous, TRD adopts a multibranch distillation design in which each modality has an independent teacher–student pair, thereby enabling multimodal industrial defect detection. BiDFNet [31] achieves bidirectional fusion of point cloud and image features by utilizing pseudo point clouds, enabling efficient 3D object detection. Overall, these methods heavily depend on Transformer-based feature extractors, whose quadratic computational complexity grows rapidly with input resolution, making them unsuitable for real-time applications under industrial resource constraints. Additionally, their fusion strategies are typically static or shallow, lacking the capacity to fully exploit semantic complementarities across modalities, thus constraining the expressive power of the fused representations.

2.2. Applications of Mamba in Visual Representation

Mamba is a novel sequence modeling architecture based on Selective Structured State Spaces (S4). Its core idea lies in eliminating the attention mechanism and multilayer perceptrons (MLPs) commonly used in traditional Transformers, and instead updating features through state-space recurrence. This design preserves the ability to model long-range dependencies while significantly reducing computational complexity. Due to its linear-time and memory efficiency, Mamba has recently achieved remarkable progress in both natural language processing and computer vision domains.
In the field of computer vision, researchers have applied Mamba to a variety of tasks such as image classification, video understanding, and medical image segmentation. For instance, VM-UNet [32] adopts a U-shaped architecture built upon the state space model and achieves outstanding performance in medical imaging tasks. Graph-Mamba [33] introduces node-priority sorting and learnable recurrent path control into graph neural networks to enable effective long-range dependency modeling on large-scale graph data. In low-level vision tasks such as image deraining and enhancement [34], the linear scanning mechanism of Mamba also demonstrates strong capability in image restoration. ESM-Net [35] utilizes spatial modeling Mamba for interactive segmentation of medical images, improving both segmentation accuracy and efficiency.
In the domain of point cloud processing, researchers have also explored the integration of Mamba into 3D representation learning. Given the unordered nature of point clouds, most existing methods adopt serialization strategies to convert point clouds into one-dimensional ordered sequences before feeding them into Mamba encoders. For example, Point cloud mamba [36] employs a uniform traversal approach to construct sequences, while Point Mamba [37] leverages Hilbert spacefilling curves to generate serialized input orders.
In cross-modal scenarios, Xie et al. [38] propose FusionMamba, a Mamba-based multimodal image fusion framework that integrates dynamic convolution and channel attention mechanisms to enhance the visual state space model. This design improves global feature modeling while strengthening the representation of local features. Vision mamba [39] further incorporates a compressed sensing mechanism to construct a lightweight and efficient bidirectional state space module, achieving a favorable trade-off between accuracy and computational efficiency in image recognition tasks. These advancements collectively highlight Mamba’s potential to serve as a next-generation, high-performance visual backbone network.
In summary, Mamba’s advantages in modeling long-range dependencies, hardware efficiency, and linear computational complexity provide a solid foundation for its application in industrial multimodal anomaly detection. However, there remains a lack of effective frameworks that integrate Mamba with multimodal feature fusion mechanisms—particularly in terms of cross-modal alignment and heterogeneous scale representation. To address the challenges of inefficient long-range dependency modeling and shallow cross-modal fusion in existing multimodal anomaly detection methods, we propose a novel Mamba-based framework named HFMM-Net. This framework introduces two key components: a Dual-Path Mamba Encoder (DPME) for parallel modality-specific feature extraction, and a Cross-Enhanced Fusion Mamba Block (Cro-EFMB) for deep cross-modal interaction and fusion, as detailed below.

3. Approach

3.1. Preliminaries

The state space model (SSM) [40,41,42] is a class of sequence-to-sequence modeling systems whose dynamics remain invariant over time, also known as linear time-invariant systems. SSMs exhibit linear computational complexity and establish a mapping between the input x ( t ) R and the updated state via the latent state h ( t ) R N , where N denotes the state dimension. The SSM can be expressed by the following linear differential equations:
h ( t ) = A h ( t ) + B x ( t ) y ( t ) = C h ( t ) + D x ( t )
where A R N × N denotes the state transition matrix, B R N × 1 correctly aligns dimensions for input-to-state transformation, C R 1 × N , and D R 1 × N are the projection parameters. Then a discretization procedure is typically applied in practical deep learning implementations. Specifically, let Δ be the time-scale parameter used to convert the continuous parameters A and B into the discrete parameters A ¯ and B ¯ , and let I denote the identity matrix. Using the zero-order hold method, the discrete parameters are defined as
A ¯ = exp ( Δ A ) , B ¯ = ( Δ A ) 1 exp ( Δ A ) I Δ B
After discretization with step size Δ , the discrete-time SSM can be written as
h k = A ¯ h k 1 + B ¯ x k y k = C h k + D x k
Finally, the model output is obtained via global convolution:
K ¯ C B ¯ , C A ¯ B ¯ , , C A ¯ L 1 B ¯ , y = x K ¯
where K ¯ R L is the structured convolution kernel, L denotes the length of the input sequence x, and C is the projection parameter of the SSM.

3.2. Overall Architecture

The proposed HFMM-Net is designed as an efficient multimodal industrial anomaly detection framework that jointly processes RGB images and 3D point clouds. The overall architecture is shown in Figure 1. It comprises three main components: a Dual-Path Mamba Encoder (DPME), a Cross-Enhanced Fusion Mamba Block (Cro-EFMB), and a decision module. During encoding, the first layer employs bidirectional scanning, while each subsequent layer adopts the same network structure as the forward-scanning branch and is cascaded sequentially to extract multiscale features. The features from every level of both branches are then passed through the fusion module. Finally, the decision module produces the anomaly scores and segmentation maps.

3.3. Feature Extraction Module: Dual-Path Mamba Encoder (DPME)

(1)
Hybrid Scan Strategy
Extending Mamba, originally adept at 1D sequence modeling, to 2D and 3D tasks introduces several challenges. A central issue is how to preserve the global correlations of the original data while serializing high-dimensional inputs into 1-D token sequences. Unlike image features, point clouds are unordered. This has little impact on Transformers, which can attend across all tokens at any time, but it poses specific difficulties for Mamba, whose selective scan is based on linear recursion. Because Mamba models sequences unidirectionally and selectively compresses historical information, it becomes partially dependent on the token order. To mitigate this order dependency, we adopt a hybrid scan strategy. The Dual-Path Mamba Encoder (DPME) consists of two Mamba branches: forward and backward. The forward branch applies a standard Selective SSM without hybrid scanning; in the backward branch, the hidden-state sequence undergoes bidirectional scanning—performing state recursion in both forward and backward directions—before entering the Selective SSM. The residual stream is subjected to backward scanning and then fused with the hidden-state sequence entering the Selective SSM. The combination of bidirectional and backward scanning effectively enlarges the global receptive field and enhances the model’s capability for global feature extraction.
(2)
Token Generation for Each Modality
The encoder comprises two branches that separately process RGB images and 3D point clouds. Specifically, each RGB image I i ( I i R H × W × C , H = height , W = width , C = channels ) and each point cloud P i ( P i R N × 3 , N = number of points ) are converted into token sequences using modality-specific pipelines. To enhance efficiency and modeling capacity on long sequences, the RGB branch retains the patch partitioning, linear projection, and positional encoding steps from the DINO [26] framework to produce S rgb R M × C , after which the original Transformer encoder is replaced by a bidirectional Mamba encoder. For the point cloud branch, we follow a similar procedure: first, M local patches are generated via farthest point sampling (FPS) and k-nearest neighbors (KNNs); then, a lightweight PointNet [43] extracts a feature vector from each patch, yielding the point cloud token sequence S pc R M × C . Finally, an identical architecture (no weight sharing) bidirectional Mamba encoder is applied to S pc in place of the traditional Transformer for sequence modeling.
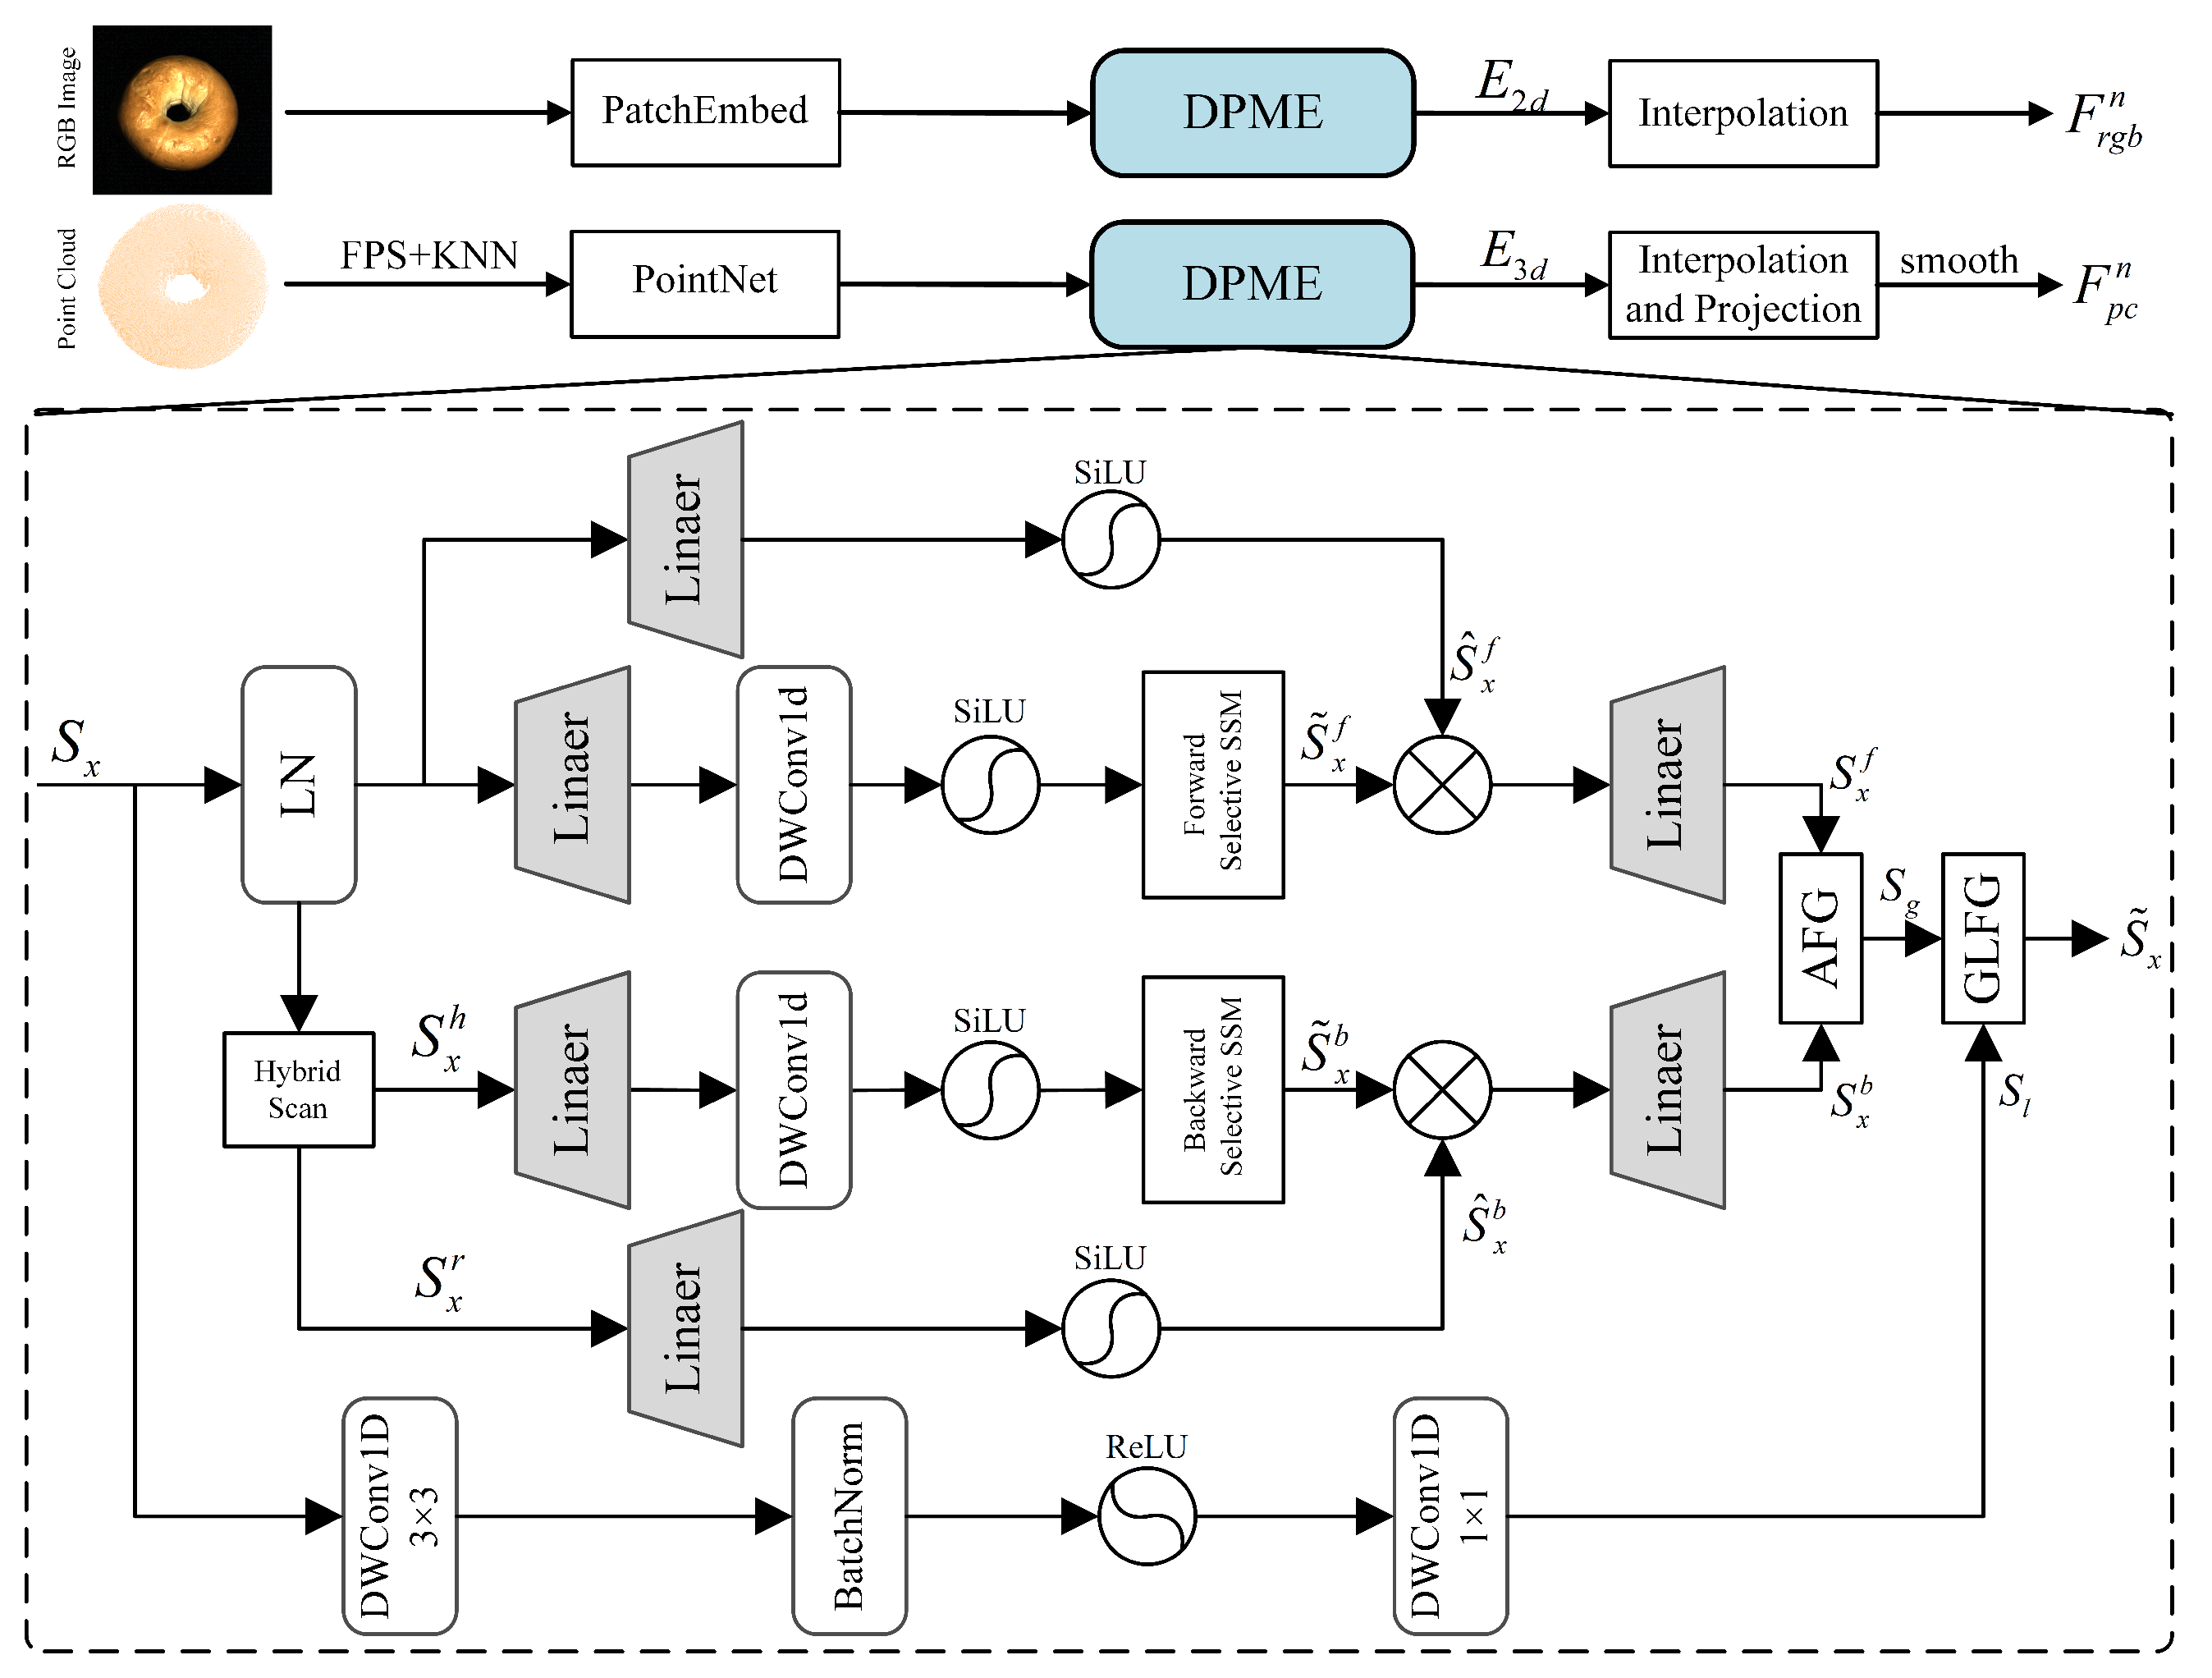
After obtaining the RGB token sequence S rgb and the 3D point cloud token sequence S pc , both are fed into the feature extraction module for encoding. The overall architecture of this module is illustrated in Figure 2. The two Mamba branches capture global representations from different perspectives, and these representations are subsequently fused by a dedicated Adaptive Fusion Gate (AFG). Subsequently, we use the Global–Local Fusion Gate (GLFG) to integrate global and local features, yielding the final fused feature sequence S ˜ x for each modality ( x { rgb , pc } ). Afterward, we obtain the feature map E 2 d from the RGB modality through interpolation, and the feature map E 3 d from the point cloud modality through interpolation and projection. Then a 3 × 3 smoothing kernel is applied to E 3 d , resulting in pixel-level aligned feature maps.
For two per-modality DPMEs, we instantiate two identical-architecture Dual-Path Mamba Encoders (DPMEs), one for RGB and one for point clouds; no weights are shared. The feature extraction network employs two parallel Mamba branches to strengthen the model’s ability to perceive sequences from different directions, thereby mitigating the negative impact of the unordered nature of point cloud data. Each branch consists of a closed-loop state space model (SSM) block. For the forward branch, given the input feature sequence S x (where x { rgb , pc } ), the features are first normalized using LayerNorm (LN), followed by a linear transformation, depthwise 1D convolution (DWConv1d), and SiLU activation, and then processed by the forward SSM. This pipeline employs mapping-based convolution to avoid independent token-wise computation. After SSM processing, the output S ^ x f is element-wise multiplied with the residual stream output S ˜ x f . A subsequent linear projection refines and resizes the fused features, ultimately forming the global feature representation S x f of the forward Mamba branch. The detailed workflow is described below:
S ˜ x f = SelectiveSSM f SiLU DWConv 1 d Linear LN ( S x ) S ^ x f = SiLU Linear ( LN ( S x ) ) S x f = Linear S ˜ x S ^ x
The processing pipeline of the backward branch mirrors that of the forward branch, with the key difference that, before entering the Mamba module, the feature sequence undergoes the Hybrid Scan to generate both hidden-state and residual representations.
S x h , S x r = HybridScan ( LN ( S x ) ) , S ˜ x b = SelectiveSSM b SiLU DWConv1d ( Linear ( S x h ) ) ) ) , S ^ x b = SiLU Linear ( S x r ) , S x b = Linear S ˜ x b S ^ x b .
Once processed by the backward Mamba branch, a second global feature sequence S x b is obtained. These two sequences are then passed to the Adaptive Fusion Gate (AFG) to produce the fused feature S g . The AFG is an adaptive weight-allocation module whose weights are learned end-to-end during network training, thereby continuously optimizing the feature fusion ratio. The fusion process can be formalized as follows:
S g = w 1 S x f + w 2 S x b
Here, w 1 and w 2 denote the learnable fusion weights, and S g represents the global fused feature. During training, w 1 and w 2 are continuously optimized, allowing dynamic adjustment of the feature ratio from the two branches, which facilitates selective emphasis on important features.
We further introduce a convolutional branch that employs a 3 × 3 convolution with stride 1 to focus on fine-grained local details, producing the local feature sequence S l . These local features are then combined with the global features via the Global–Local Fusion Gate (GLFG). Specifically, let S denote the concatenation of the global and local feature scores used for adaptive fine-tuning; the final fused feature S ˜ is obtained as follows:
S = Softmax Linear Mean ( [ S g , S l ] ) , S ˜ = α S g + ( 1 α ) S l
In multimodal anomaly detection tasks, we assume a strict pixel-level spatial correspondence between RGB images and 3D point clouds, i.e., each 3D coordinate has a matching location in the RGB image. Since the 2D feature map E 2 d and the 3D feature map E 3 d are both interpolated within the network to align their sizes with the original image and point cloud spaces, we can project E 3 d onto the 2D image plane to obtain a feature map of size H × W × C 3 d . During this projection, the original RGB features and the projected 3D features maintain strict spatial correspondence. Furthermore, for those image regions that do not correspond to valid 3D coordinates, feature values are masked to zero. Finally, we apply a 3 × 3 smoothing to E 3 D after projection to the image plane to suppress interpolation noise and sparsity-induced discontinuities in the point cloud features, whereas no extra smoothing is applied to E 2 D because the 2D map is dense and already bilinearly upsampled. This process can be formally expressed as
E 3 d = smooth E 3 d , 3 × 3
After the above processing pipeline, we obtain two pixel-aligned feature maps, which respectively represent the multi-scale feature representations of the RGB images and the 3D point clouds. These aligned feature maps serve as the foundation for subsequent feature fusion and defect detection.

3.4. Cross-Enhanced Fusion Mamba Block (Cro-EFMB)

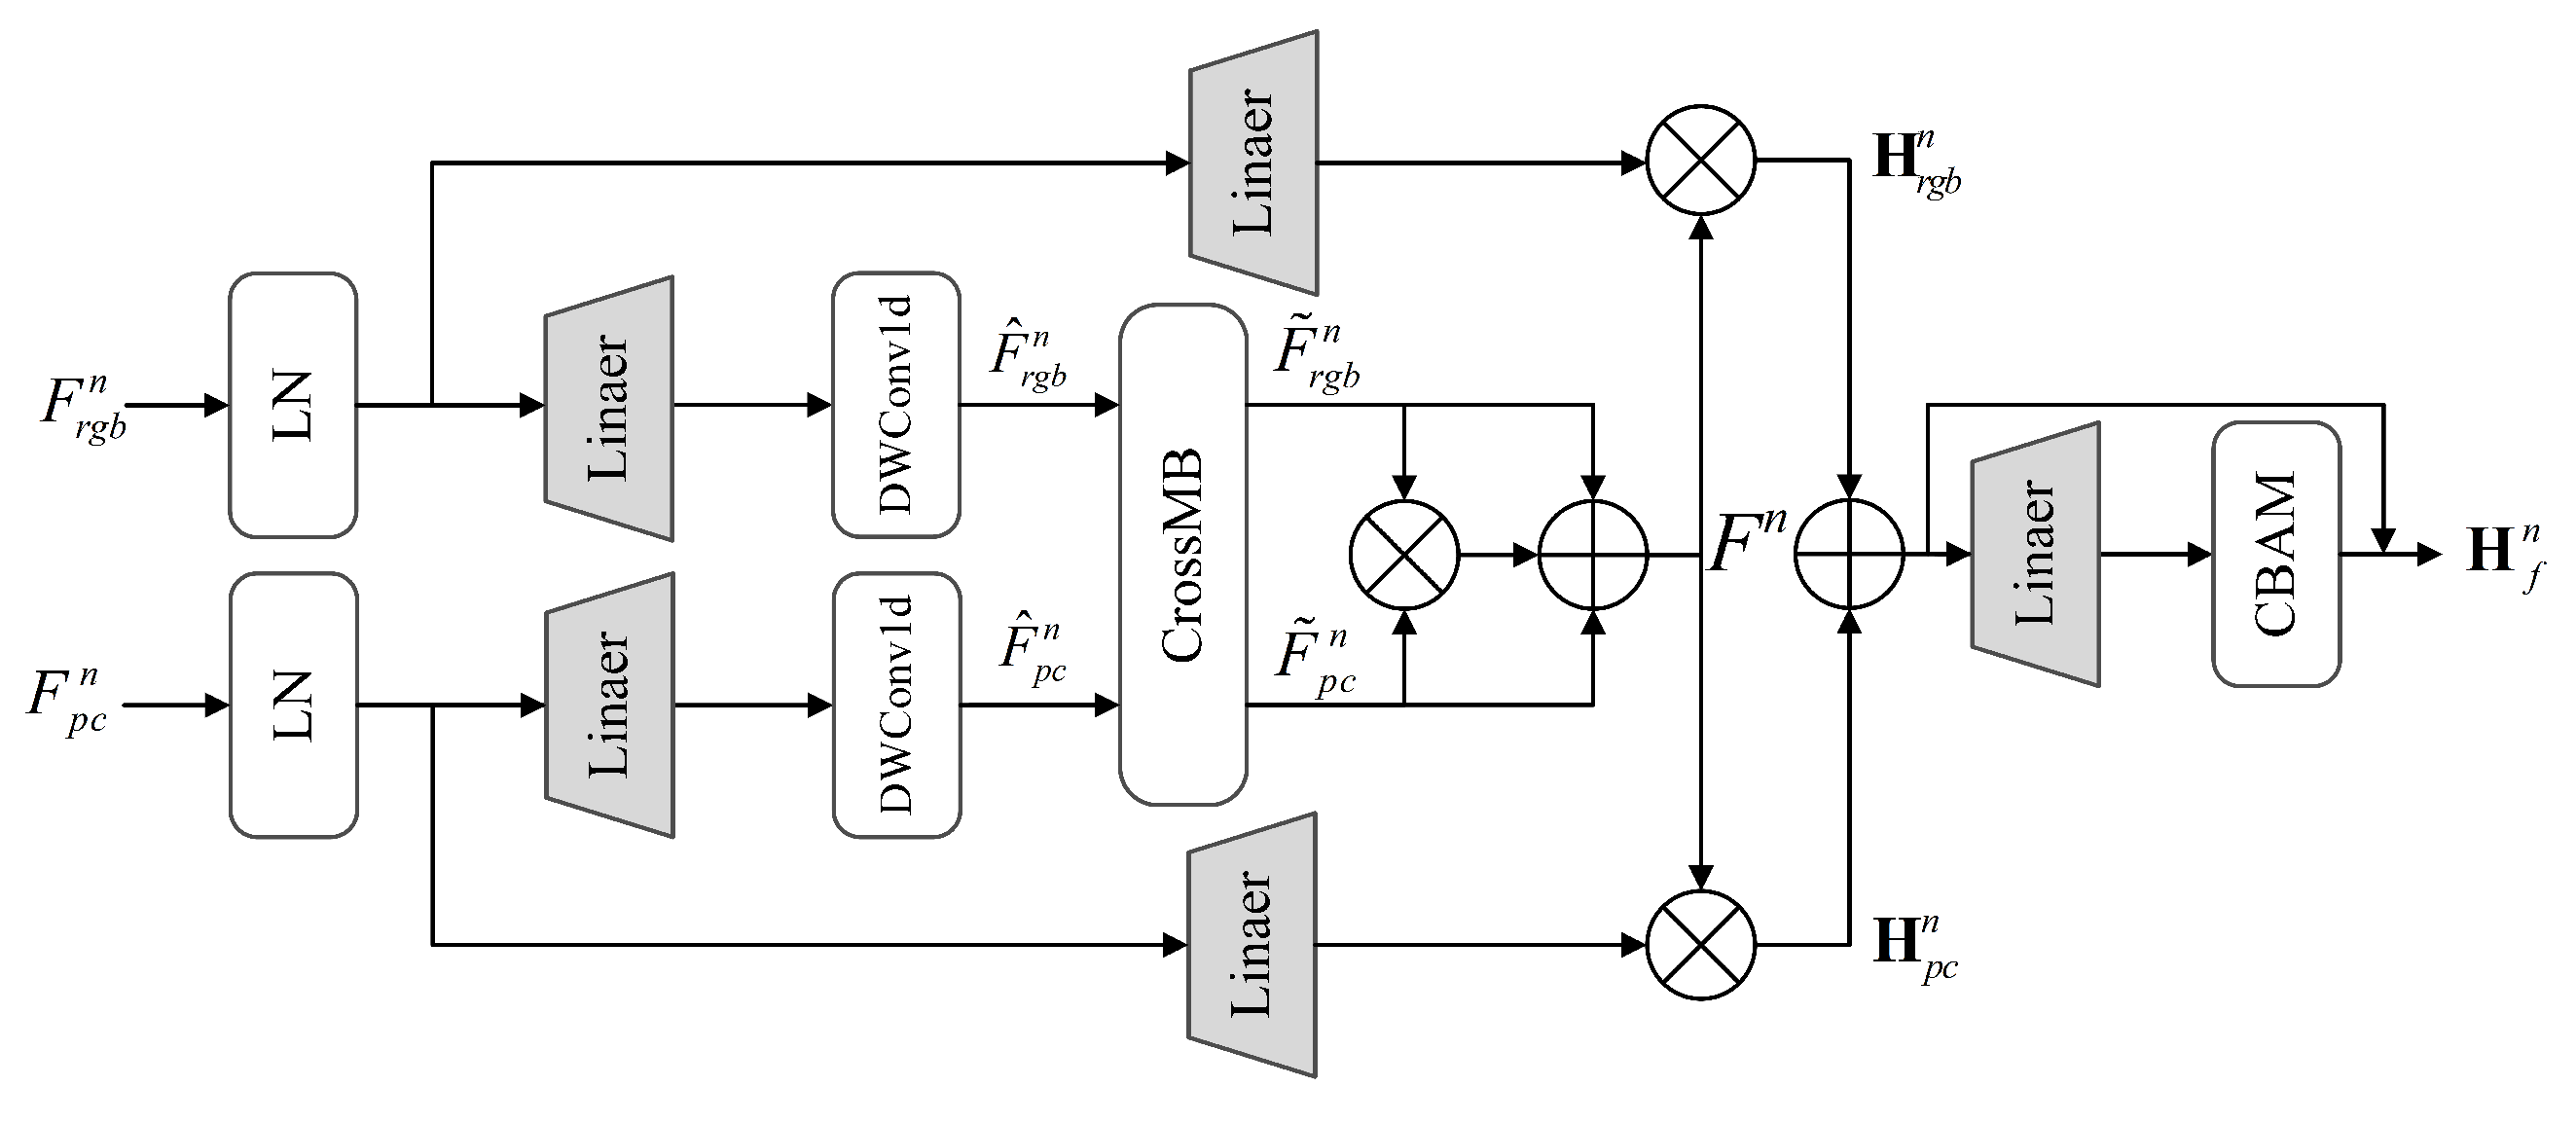
Interactions between modality-specific features can create novel information, which is essential for industrial anomaly detection where both color and geometric cues must be combined to identify defects. To facilitate fine-grained fusion and explore relationships across modalities, we design a Cross-Enhanced Fusion Mamba Block. As illustrated in Figure 3, the two input feature streams are first processed by a linear layer and depthwise convolution, and then passed to the Cross-Selective Scan (Cross-SS). The cross-modality outputs are fused via element-wise multiplication and addition, followed by a linear layer and a CBAM block to yield the final fused feature H f n . Using the Mamba selection mechanism described in Section 3.1, the system matrices B, C, and the time-scale parameter Δ are generated using linear projections to allow the model to be contextually aware. In particular, matrix C is used to decode information from the hidden state h n to produce the output y n . This process can be formally expressed as
A ¯ rgb = exp Δ rgb A rgb , A ¯ pc = exp Δ pc A pc B ¯ rgb = Δ rgb B rgb , B ¯ pc = Δ pc B pc h rgb t = A ¯ rgb h rgb t 1 + B ¯ rgb x rgb t , h pc t = A ¯ pc h pc t 1 + B ¯ pc x pc t y rgb t = C rgb h rgb t + D rgb x rgb t , y pc t = C pc h pc t + D pc x pc t y rgb = y rgb 1 , y rgb 2 , , y rgb L , y pc = y pc 1 , y pc 2 , , y pc L
Here, x rgb / pc t denotes the input at time step t, and y rgb / pc t denotes the output of the Selective Scan. The matrix C rgb / pc is used to decode information from the hidden state and recover the cross-modal output at each time step. Where n indicates the n-th layer, and F rgb n and F pc n denote the modality-specific feature maps input to that layer. The fused feature F n is then generated as follows:
F ^ rgb n = DWConv 1 d Linear ( LN ( F rgb n ) ) F ^ pc n = DWConv 1 d Linear ( LN ( F pc n ) ) F ^ rgb n , F ^ pc n = CrossSS F ˜ rgb n , F ˜ pc n F n = F ˜ rgb n F ˜ pc n F ˜ rgb n F ˜ pc n
Here, DWConv 1 d ( · ) denotes depthwise convolution, and ⊕ and ⊗ represent element-wise addition and multiplication, respectively. The features are then refined by the Convolutional Block Attention Module (CBAM) [44] to enhance the detection of fine-grained defects to produce the final fused feature H f n , as follows:
H rgb n = LN Linear ( F rgb n ) F n H pc n = LN Linear ( F pc n ) F n H f n = CBAM Linear ( H rgb n H pc n ) ( H rgb n H pc n )
During inference, the outputs are concatenated to produce the final fused feature map at each layer, denoted by H ^ n :
H ^ n = H f n F rgb n F pc n

3.5. Decision-Level Fusion

We employ an upsampling and channel attention strategy to progressively restore the multiscale RGB, point cloud, and fused feature maps to the original input resolution. This ensures that subsequent memory bank scoring and segmentation map generation preserve both global semantics and local details.
During inference, we maintain three separate memory banks for RGB, point cloud, and fused feature streams, denoted M rgb , M pc , and M f , respectively. Each memory bank stores feature embeddings extracted from normal training samples. For each input feature sequence, we perform scoring and segmentation generation by comparing its feature vectors against the corresponding memory bank. Concretely, for the kth memory bank M k ( k { rgb , pc , f } ) and its set of feature vectors { f j k } , we compute a distance-based score function ϕ by measuring the Euclidean distance between each feature vector and its nearest neighbor in the memory bank, scaled by a factor η . Specifically, for each feature vector f i , j k , we find its closest neighbor prototype m k in the memory bank M k , where m denotes any candidate prototype in the bank.
ϕ M k , f i , j k = η f i , j k m k 2 m k = arg min m M k f i , j k m 2
Consequently, we define the local segmentation confidence using the ψ function, which for each feature patch computes the minimum distance to any sample in its memory bank:
ψ M k , f i , j k = min m M k f i , j k m 2
After obtaining the three modality-specific scores and segmentation maps, we introduce two learnable one-class SVM models: G s c o r e for global anomaly scoring and G s e g for final segmentation map generation. Each SVM takes as input the concatenated ϕ -outputs or ψ -outputs from the three modalities:
σ = G s c o r e ϕ M rgb , f rgb , ϕ M pc , f pc , ϕ M f , f f Y = G s e g ψ M rgb , f rgb , ψ M pc , f pc , ψ M f , f f
where σ is the final anomaly score and Y is the segmentation confidence map.

4. Experiments

4.1. Experiment Settings

Datasets. We evaluate our framework on two multimodal anomaly detection benchmarks. The MVTec 3D-AD dataset [3] comprises 10 industrial object categories with a total of 2656 training samples, 294 validation samples, and 1197 test samples. Eyecandies [4] is a synthetic dataset featuring photorealistic images of 10 food items on an industrial conveyor belt. It contains 10,000 training samples, 1000 validation samples, and 4000 test samples. Both datasets provide for each sample an RGB image and a pixel-aligned 3D point cloud, ensuring that every pixel location has a corresponding 3D coordinate.
Experimental Details. Following the procedure in [25], during data preprocessing we first apply RANSAC to the raw point cloud to estimate the background plane and remove all points within 0.005 m of this plane to filter out irrelevant noise. The corresponding pixels of these removed points in the RGB image are then set to zero to minimize background interference in anomaly detection. Finally, to match the input resolution of the downstream feature extractors, we resample or crop both the point cloud coordinates and the RGB image to a size of 224 × 224 . This pipeline both accelerates 3D feature processing and effectively reduces background false positives. Consistent with prevailing practice in industrial AD, all experiments are conducted in an unsupervised regime: no anomalous labels or pixel-wise masks are used during training; the model is applied at inference to test sets that may contain anomalies, and ground-truth is used only for evaluation.
Training Settings. We use the AdamW optimizer with an initial learning rate of 0.003 and a batch size of 8. The model is trained for 500 epochs on a NVIDIA GeForce RTX 4090 GPU with 24 GB of memory.
Evaluation Metrics. We adopt the evaluation protocols introduced in MVTec 3D-AD. Specifically, we assess image-level anomaly detection performance via the area under the ROC curve computed on global anomaly scores (I-AUROC). Pixel-level ROC AUC (P-AUROC) and the area under the per-region overlap curve (AUPRO) are used to evaluate segmentation performance. Prior works uniformly integrate up to a false positive rate (FPR) threshold of 0.3 when computing AUPRO. However, CFM [12] argued that, for practical industrial applications, such a large allowance for false positives may be too lenient. Therefore, we additionally compute AUPRO using a stricter FPR threshold of 0.01. We denote these metrics as AUPRO@30% and AUPRO@1%, respectively.

4.2. Anomaly Detection on MVTec 3D-AD

We explore the potential of Mamba for multimodal defect detection. In the MVTec-3D-AD dataset, we compare our approach with several RGB+3D multimodal methods. Table 1 reports anomaly detection results in terms of I-AUROC; Table 2 presents anomaly segmentation results measured by P-AUROC; our method attains the best average results on MVTec-3D-AD across all summary metrics—namely I-AUROC, P-AUROC, AUPRO@30%, and AUPRO@1%—and also performs better on most individual categories compared with prior approaches. In terms of I-AUROC, HFMM-Net reaches 0.956, improving over TRD by 0.3 percentage points (pp) and over CPMF by 0.6 pp. For P-AUROC, HFMM-Net achieves 0.993, surpassing TRD (0.992).
To further assess segmentation robustness under stricter conditions, we evaluate AUPRO at two operating points (Table 3 and Table 4). At AUPRO@30%, HFMM-Net achieves a mean score of 0.982, outperforming the previous best TRD (0.979) by 0.3 pp and CFM (0.976) by 0.6 pp. Our method attains the best or tied-best results on Bagel, Carrot (tie), Cookie, Peach, Rope, and Tire, indicating fewer false alarms and higher-quality masks in common operating ranges.
Under the stricter AUPRO@1% setting, HFMM-Net obtains a mean of 0.457, surpassing M3DM (0.450) and TRD (0.446) by 0.7 pp and 1.1 pp, respectively. Per-category inspection shows best or tied-best performance on Bagel (0.480), Carrot (0.500), Cookie (0.470; tied with M3DM), Foam (0.420), Potato (0.490), and Tire (0.470). These results confirm that HFMM-Net retains superior confidence and stability at very low false positive rates, demonstrating stronger resilience to fine-grained anomalies and background noise.

4.3. Anomaly Detection on Eyecandies

Regarding Eyecandies (Table 5), our method ranks first on both segmentation-oriented metrics, achieving the highest AUPRO@30% = 0.891 and AUPRO@1% = 0.341. Compared with the best-competing baseline (TRD), these correspond to gains of +0.004 and +0.003, respectively. On the classification-oriented metrics, we remain competitive—I-AUROC = 0.887 and P-AUROC = 0.966—placing second to CFM (0.891/0.976) with narrow gaps of 0.4 pp and 1.0 pp. Overall, our fusion and memory design yields state-of-the-art localization under strict false-positive budgets while preserving strong detection accuracy. All experiments were conducted on a single NVIDIA GeForce RTX 4090 using our implementation together with the authors’ official code for competing multimodal AD methods.

4.4. Few-Shot Anomaly Detection

We evaluate the few-shot setting on MVTec 3D-AD by randomly sampling 5, 10, and 50 images per category for training, while always using the full official test set for evaluation. On each sampled split, we train the top multimodal baselines TRD [30], CFM [12], and M3DM [11], and then test them on the entire MVTec 3D-AD test set. All results are reported in Table 6. We observe that, even with only 5-shot or 10-shot supervision, our method still achieves superior segmentation performance compared with several non–few-shot baselines.

4.5. Ablation Studies

To verify the effectiveness of the proposed Dual-Path Mamba Encoder (DPME) for multimodal feature modeling, we conduct a series of ablation and module-replacement experiments. These experiments are designed to isolate the contribution of DPME to the overall performance and to compare it against commonly used visual encoders.
We first construct two ablated variants:
  • w/o DPME: The bidirectional Mamba encoder is removed, and the RGB and point cloud features are simply concatenated before being fed into the subsequent modules.
  • w/o Dual-Path: The bidirectional hybrid scanning is replaced with a standard unidirectional SSM to assess the modeling capability of a single pathway.
In the module-replacement study, we substitute DPME with encoders widely used in vision tasks, including a Vision Transformer (ViT), a ResNet-18 convolutional encoder, and a multi-head attention (MHA) block from a standard Transformer. “W/o smooth” indicates that the smoothing operation is removed before entering the feature fusion stage. All other components are kept unchanged, and all variants are trained and evaluated under the same protocol on the MVTec 3D-AD dataset.
As summarized in Table 7, the full HFMM-Net consistently achieves the best results across all metrics, confirming the positive contribution of DPME to multimodal anomaly detection. Specifically, removing DPME leads to average drops of 1.2 pp, 1.1 pp, 1.4 pp, and 1.9 pp on I-AUROC, P-AUROC, AUPRO@30%, and AUPRO@1%, respectively. Moreover, replacing DPME with ViT or ResNet-18 also leads to degraded performance, which indicates that DPME achieves a better balance between long-range dependency modeling and local detail aggregation compared to Transformer-based methods, while maintaining favorable efficiency. The results of the w/o smooth variant indicate that applying the smoothing operation to E 3 D is beneficial for both anomaly detection and segmentation performance.
To evaluate the impact of the channel attention mechanism on multimodal feature fusion, we introduce CBAM (Convolutional Block Attention Module) into the fusion module Cro-EFMB and conduct comparative experiments with a version in which CBAM is removed. As shown in Table 8, without CBAM the model exhibits drops of 1.6%, 1.5%, 0.5%, and 1.1% on I-AUROC, P-AUROC, AUPRO@30%, and AUPRO@1%, respectively, indicating that CBAM effectively enhances the model’s focus on critical channels and spatial regions, thereby improving the discriminability of anomalous areas. These results verify the importance and effectiveness of introducing an attention mechanism for multimodal fusion architectures.
We conduct an ablation study on MVTec-3D to examine the contribution of each component in the proposed HFMM-Net. We first analyze the effect of the DPME module. Following PatchCore, we adopt a baseline that uses fixed, off-the-shelf pre-trained features without adaptation for all evaluations. As shown in Table 9, this baseline yields lower accuracy on all metrics, consistent with its reliance on frozen features. In contrast, DPME enlarges the receptive field via hybrid scanning and strengthens feature extraction, leading to a clear performance gain and increased sensitivity to anomalous patterns. We then study the impact of Cro-EFMB. As also reported in Table 9, Cro-EFMB achieves accuracy comparable to DPME by performing cross-enhanced feature fusion through cross-selective scanning. Moreover, combining DPME with Cro-EFMB brings a further improvement. These results verify the effectiveness of the proposed DPME, Cro-EFMB, and their key components.
To assess the contribution of multimodal fusion, Table 10 compares RGB-only, point cloud-only, and the full model. The results confirm that the single-modality variants are feasible and that the proposed fusion produces consistent improvements beyond either modality alone.

4.6. Inference Efficiency and Memory Footprint

We assess efficiency on the same hardware/software environment to ensure fair timing. Inference speed (FPS) is measured end-to-end over the full test set with GPU synchronization. Besides FPS, we report peak GPU memory consumption (MB). Accuracy is summarized by image-level AUROC (I-AUROC).
As shown in Table 11, HFMM-Net achieves the highest inference speed (24.8 FPS) among all compared methods while maintaining a moderate memory footprint of 594.7 MB. In contrast, TRD reaches 21.7 FPS with 682.5 MB, CFM 12.0 FPS with 437.91 MB, and M3DM reaches only 0.528 FPS with 6528.7 MB. On accuracy, HFMM-Net attains I-AUROC = 0.956, slightly higher than TRD (0.953), CFM (0.948), and M3DM (0.942).
In relative terms, HFMM-Net is 47.0× faster than M3DM, 14.3% faster than TRD, and 106.7% faster than CFM. It also reduces peak memory by 90.9% compared with M3DM and by 12.9% compared with TRD, while delivering the best accuracy. Although the absolute accuracy gain is modest—likely due to ceiling effects on MVTec 3D-AD—the accuracy–efficiency trade-off is clearly superior: HFMM-Net provides real-time throughput with sub-GB memory, making it particularly suitable for latency- and memory-constrained industrial inspection.

4.7. Features Visualization

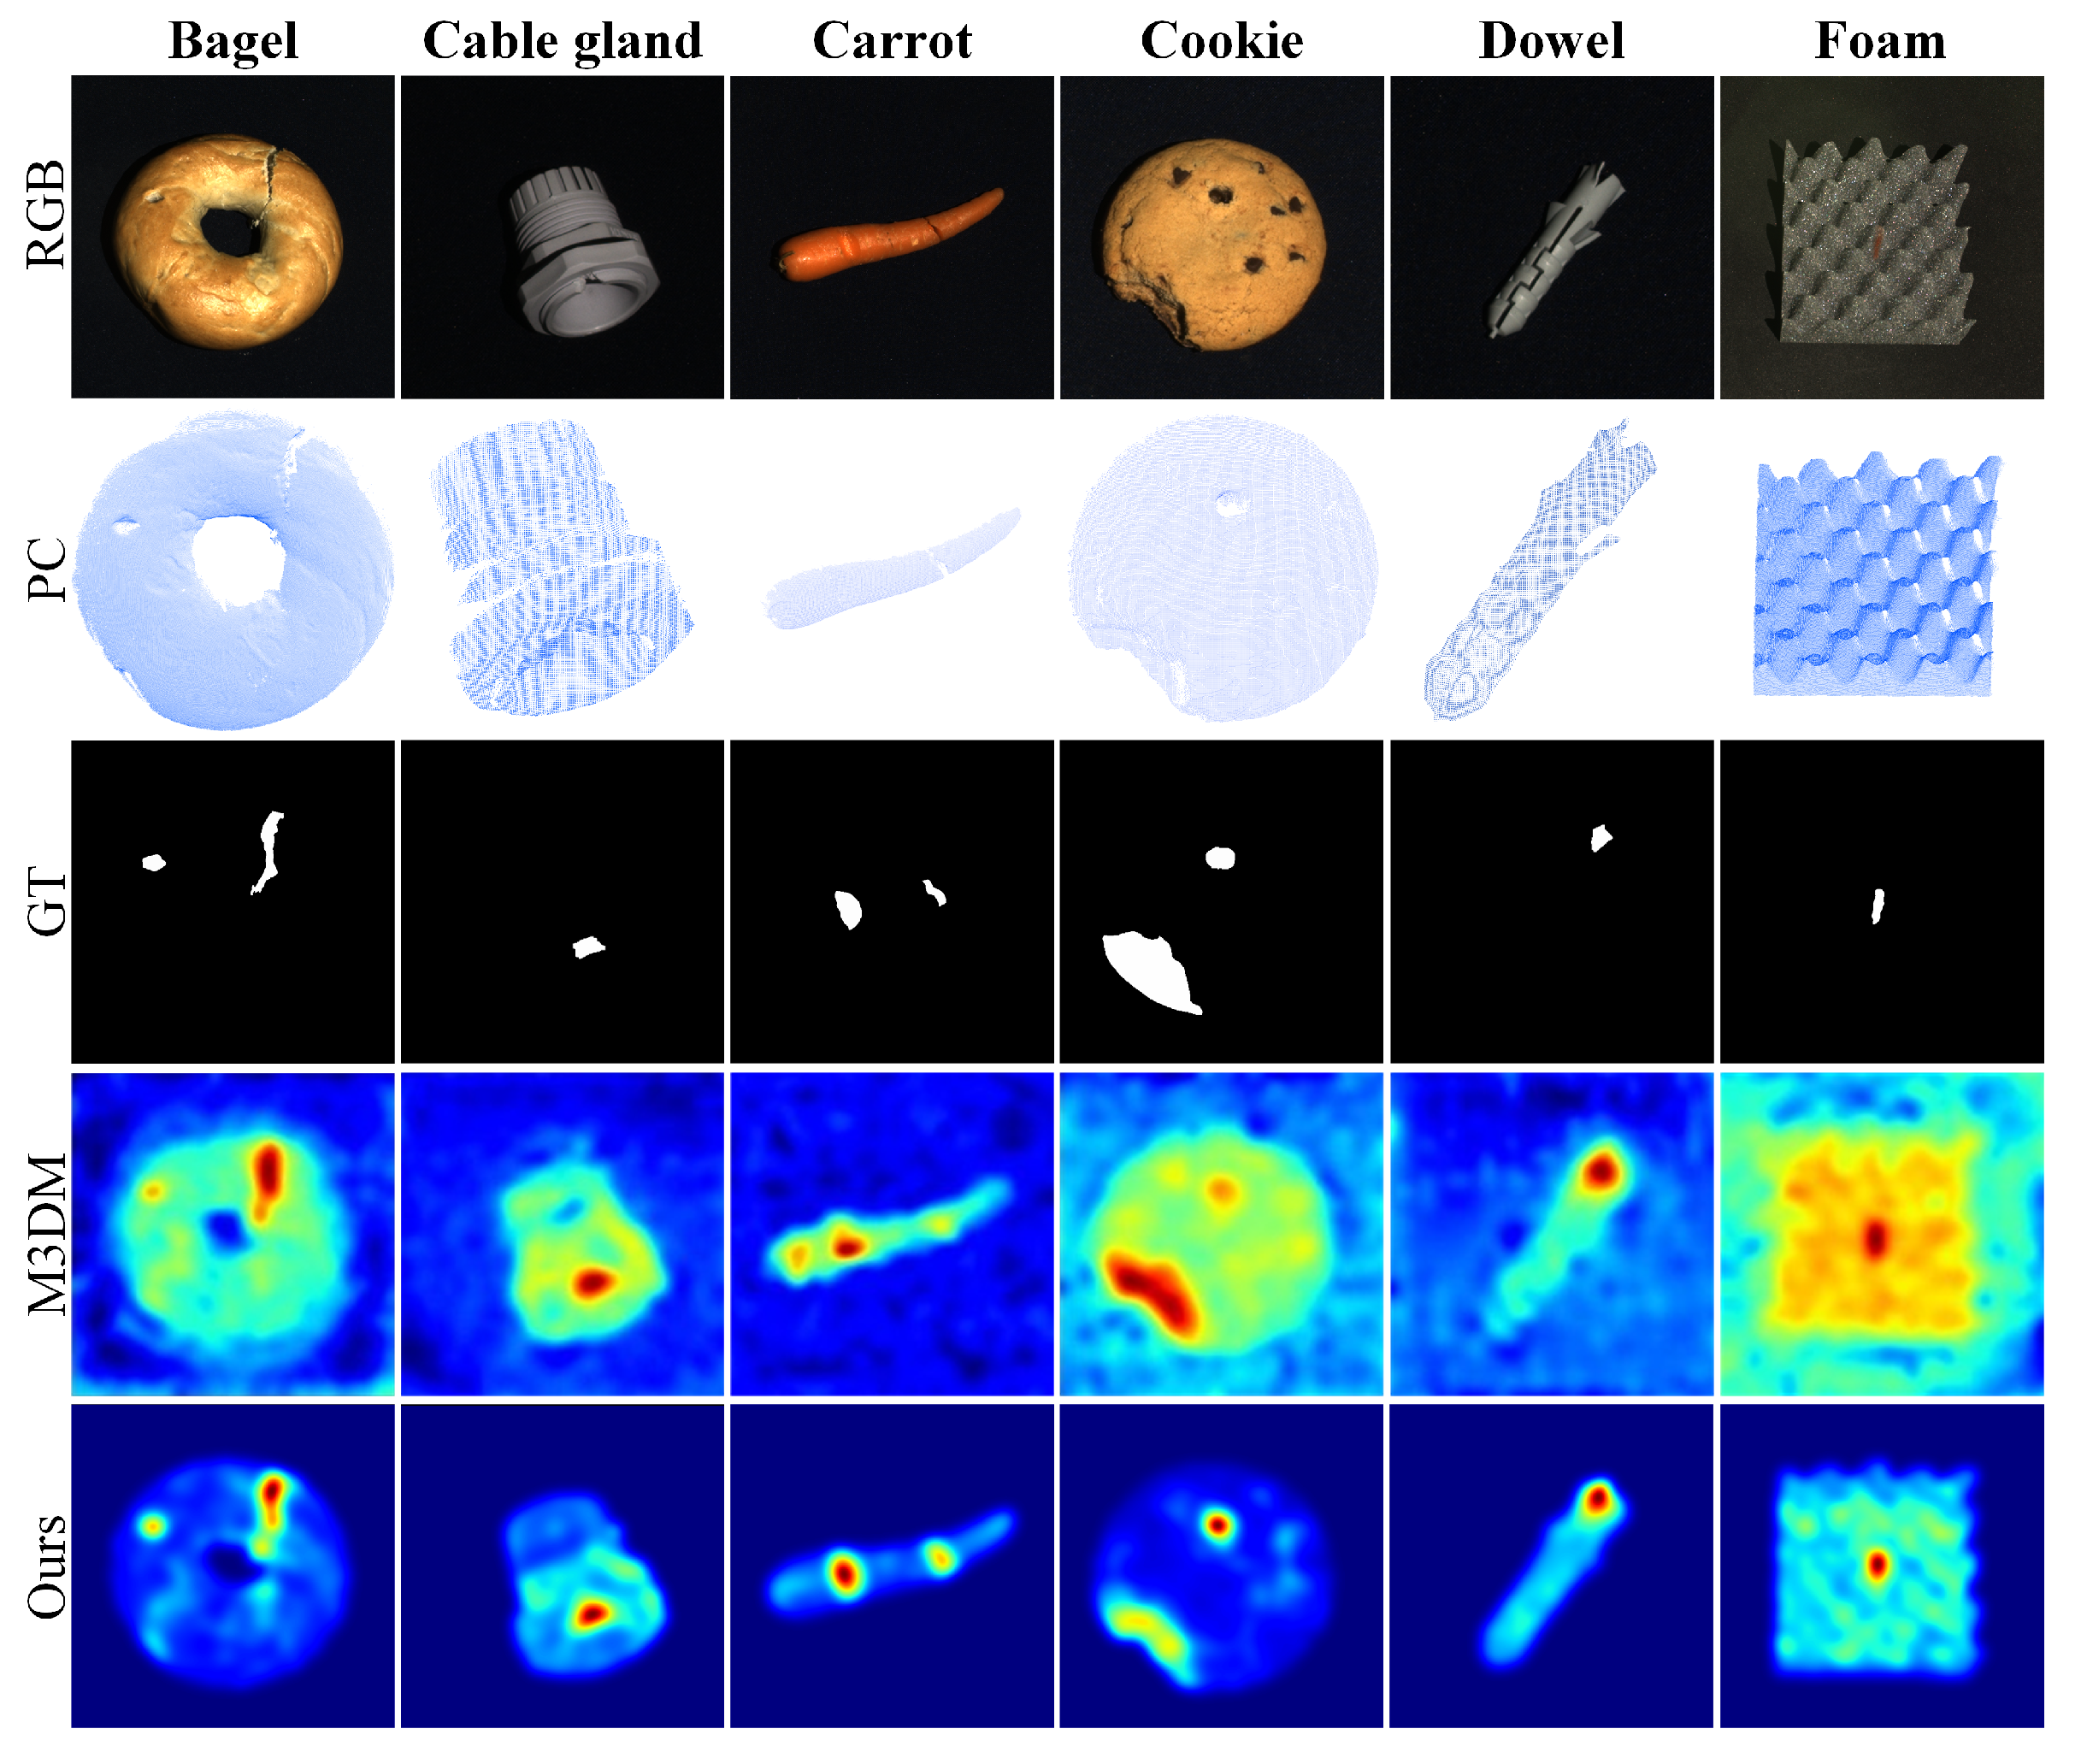
We visualize anomaly maps on MVTec 3D-AD (Figure 4). The first row shows RGB images, the second row shows the raw point clouds (PCs), and the third row shows ground-truth masks. The subsequent rows present the heat maps produced by M3DM and our method, respectively.
Qualitative comparison of prediction results between HFMM-Net and M3DM on the MVTec 3D-AD dataset. HFMM-Net accurately detects anomalies with few misses or false positives.

5. Conclusions

In this paper, we propose a multimodal industrial defect detection network based on Mamba that integrates point clouds and RGB images, called HFMM-Net. To the best of our knowledge, this is the first attempt to apply Mamba to multimodal industrial defect detection. HFMM-Net employs a hybrid-scanning Mamba encoder to extract multi-scale features from RGB images and point clouds in parallel. To achieve efficient fusion of heterogeneous features, we design a new feature fusion module (Cro-EFMB) that can cross-enhance and fuse features at different scales. HFMM-Net opens up a new direction for multimodal industrial defect detection. Experiments on two public datasets, MVTec 3D-AD and Eyecandies, demonstrate that the proposed HFMM-Net surpasses existing methods in both anomaly detection and anomaly segmentation performance.

Author Contributions

Conceptualization, L.T. and G.Z.; methodology, L.T.; software, L.T. and G.Z.; validation, L.T.; formal analysis, G.Z.; investigation, L.T. and Q.W.; resources, L.T. and G.Z.; data curation, M.H.; writing—original draft preparation, L.T.; writing—review and editing, L.T. and G.Z.; visualization, L.T.; supervision, G.Z.; project administration, G.Z. All authors have read and agreed to the published version of the manuscript.

Funding

This research received no external funding.

Institutional Review Board Statement

Not applicable.

Informed Consent Statement

Not applicable.

Data Availability Statement

The data presented in this study are openly available in the MVTec 3D-AD dataset at https://www.mvtec.com/company/research/datasets/mvtec-3d-ad, accessed on 20 August 2025. Additionally, the Eyecandies dataset is available at https://eyecan-ai.github.io/eyecandies/, accessed on 20 August 2025.

Conflicts of Interest

The authors declare no conflicts of interest.

References

  1. Liu, J.; Xie, G.; Wang, J.; Li, S.; Wang, C.; Zheng, F.; Jin, Y. Deep industrial image anomaly detection: A survey. Mach. Intell. Res. 2024, 21, 104–135. [Google Scholar] [CrossRef]
  2. Bergmann, P.; Fauser, M.; Sattlegger, D.; Steger, C. Uninformed students: Student-teacher anomaly detection with discriminative latent embeddings. In Proceedings of the IEEE/CVF Conference on Computer vision and Pattern Recognition, Seattle, WA, USA, 14–19 June 2020; pp. 4183–4192. [Google Scholar]
  3. Bergmann, P.; Jin, X.; Sattlegger, D.; Steger, C. The mvtec 3d-ad dataset for unsupervised 3d anomaly detection and localization. arXiv 2021, arXiv:2112.09045. [Google Scholar] [CrossRef]
  4. Bonfiglioli, L.; Toschi, M.; Silvestri, D.; Fioraio, N.; De Gregorio, D. The eyecandies dataset for unsupervised multimodal anomaly detection and localization. In Proceedings of the Asian Conference on Computer Vision, Macao, China, 4–8 December 2022; pp. 3586–3602. [Google Scholar]
  5. Tu, Y.; Zhang, B.; Liu, L.; Li, Y.; Zhang, J.; Wang, Y.; Wang, C.; Zhao, C. Self-supervised feature adaptation for 3d industrial anomaly detection. In Proceedings of the European Conference on Computer Vision, Milan, Italy, 29 September–4 October 2024; pp. 75–91. [Google Scholar]
  6. Rudolph, M.; Wehrbein, T.; Rosenhahn, B.; Wandt, B. Asymmetric student-teacher networks for industrial anomaly detection. In Proceedings of the IEEE/CVF Winter Conference on Applications of Computer Vision, Waikoloa, HI, USA, 3–7 January 2023; pp. 2592–2602. [Google Scholar]
  7. Gu, Z.; Zhang, J.; Liu, L.; Chen, X.; Peng, J.; Gan, Z.; Jiang, G.; Shu, A.; Wang, Y.; Ma, L. Rethinking reverse distillation for multi-modal anomaly detection. In Proceedings of the AAAI Conference on Artificial Intelligence, Vancouver, BC, Canada, 20–21 February 2024; Volume 38, pp. 8445–8453. [Google Scholar]
  8. Jing, Y.; Zhong, J.X.; Sheil, B.; Acikgoz, S. Anomaly detection of cracks in synthetic masonry arch bridge point clouds using fast point feature histograms and PatchCore. Autom. Constr. 2024, 168, 105766. [Google Scholar] [CrossRef]
  9. Cao, Y.; Xu, X.; Shen, W. Complementary pseudo multimodal feature for point cloud anomaly detection. Pattern Recognit. 2024, 156, 110761. [Google Scholar] [CrossRef]
  10. Horwitz, E.; Hoshen, Y. Back to the feature: Classical 3d features are (almost) all you need for 3d anomaly detection. In Proceedings of the IEEE/CVF Conference on Computer Vision and Pattern Recognition, Vancouver, BC, Canada, 18–22 June 2023; pp. 2968–2977. [Google Scholar]
  11. Wang, Y.; Peng, J.; Zhang, J.; Yi, R.; Wang, Y.; Wang, C. Multimodal industrial anomaly detection via hybrid fusion. In Proceedings of the IEEE/CVF Conference on Computer Vision and Pattern Recognition, Vancouver, BC, Canada, 18–22 June 2023; pp. 8032–8041. [Google Scholar]
  12. Costanzino, A.; Ramirez, P.Z.; Lisanti, G.; Di Stefano, L. Multimodal industrial anomaly detection by crossmodal feature mapping. In Proceedings of the IEEE/CVF Conference on Computer Vision and Pattern Recognition, Seattle, WA, USA, 16–22 June 2024; pp. 17234–17243. [Google Scholar]
  13. Gu, A.; Dao, T. Mamba: Linear-time sequence modeling with selective state spaces. arXiv 2023, arXiv:2312.00752. [Google Scholar] [CrossRef]
  14. Liu, Y.; Tian, Y.; Zhao, Y.; Yu, H.; Xie, L.; Wang, Y.; Ye, Q.; Jiao, J.; Liu, Y. Vmamba: Visual state space model. Adv. Neural Inf. Process. Syst. 2024, 37, 103031–103063. [Google Scholar]
  15. Zhang, H.; Zhu, Y.; Wang, D.; Zhang, L.; Chen, T.; Wang, Z.; Ye, Z. A survey on visual mamba. Appl. Sci. 2024, 14, 5683. [Google Scholar] [CrossRef]
  16. Ma, C.; Wang, Z. Semi-Mamba-UNet: Pixel-level contrastive and cross-supervised visual Mamba-based UNet for semi-supervised medical image segmentation. Knowl.-Based Syst. 2024, 300, 112203. [Google Scholar] [CrossRef]
  17. Zou, W.; Gao, H.; Yang, W.; Liu, T. Wave-mamba: Wavelet state space model for ultra-high-definition low-light image enhancement. In Proceedings of the 32nd ACM International Conference on Multimedia, Melbourne, VIC, Australia, 28 October–1 November 2024; pp. 1534–1543. [Google Scholar]
  18. Li, W.; Zhou, H.; Yu, J.; Song, Z.; Yang, W. Coupled mamba: Enhanced multimodal fusion with coupled state space model. Adv. Neural Inf. Process. Syst. 2024, 37, 59808–59832. [Google Scholar]
  19. Perera, P.; Nallapati, R.; Xiang, B. Ocgan: One-class novelty detection using gans with constrained latent representations. In Proceedings of the IEEE/CVF Conference on Computer Vision and Pattern Recognition, Seoul, Republic of Korea, 27 October–2 November 2019; pp. 2898–2906. [Google Scholar]
  20. Kipf, T.N.; Welling, M. Variational graph auto-encoders. arXiv 2016, arXiv:1611.07308. [Google Scholar] [CrossRef]
  21. Bergmann, P.; Fauser, M.; Sattlegger, D.; Steger, C. MVTec AD–A comprehensive real-world dataset for unsupervised anomaly detection. In Proceedings of the IEEE/CVF Conference on Computer Vision and Pattern Recognition, Seoul, Republic of Korea, 27 October–2 November 2019; pp. 9592–9600. [Google Scholar]
  22. Gong, D.; Liu, L.; Le, V.; Saha, B.; Mansour, M.R.; Venkatesh, S.; Hengel, A.v.d. Memorizing normality to detect anomaly: Memory-augmented deep autoencoder for unsupervised anomaly detection. In Proceedings of the IEEE/CVF International Conference on Computer Vision, Seoul, Republic of Korea, 27 October–2 November 2019; pp. 1705–1714. [Google Scholar]
  23. Zavrtanik, V.; Kristan, M.; Skočaj, D. Reconstruction by inpainting for visual anomaly detection. Pattern Recognit. 2021, 112, 107706. [Google Scholar] [CrossRef]
  24. Roth, K.; Pemula, L.; Zepeda, J.; Schölkopf, B.; Brox, T.; Gehler, P. Towards total recall in industrial anomaly detection. In Proceedings of the IEEE/CVF Conference on Computer Vision and Pattern Recognition, New Orleans, LA, USA, 18–24 June 2022; pp. 14318–14328. [Google Scholar]
  25. Horwitz, E.; Hoshen, Y. An empirical investigation of 3d anomaly detection and segmentation. arXiv 2022, arXiv:2203.05550. [Google Scholar]
  26. Caron, M.; Touvron, H.; Misra, I.; Jégou, H.; Mairal, J.; Bojanowski, P.; Joulin, A. Emerging properties in self-supervised vision transformers. In Proceedings of the IEEE/CVF International Conference on Computer Vision, Montreal, QC, Canada, 10–17 October 2021; pp. 9650–9660. [Google Scholar]
  27. Pang, Y.; Tay, E.H.F.; Yuan, L.; Chen, Z. Masked autoencoders for 3d point cloud self-supervised learning. World Sci. Annu. Rev. Artif. Intell. 2023, 1, 2440001. [Google Scholar]
  28. Zhao, H.; Jiang, L.; Jia, J.; Torr, P.H.; Koltun, V. Point transformer. In Proceedings of the IEEE/CVF International Conference on Computer Vision, Montreal, QC, Canada, 10–17 October 2021; pp. 16259–16268. [Google Scholar]
  29. Wang, Z.; Wang, Y.; An, L.; Liu, J.; Liu, H. Local transformer network on 3d point cloud semantic segmentation. Information 2022, 13, 198. [Google Scholar] [CrossRef]
  30. Liu, X.; Wang, J.; Leng, B.; Zhang, S. Tuned Reverse Distillation: Enhancing Multimodal Industrial Anomaly Detection with Crossmodal Tuners. arXiv 2025, arXiv:2412.08949. [Google Scholar]
  31. Zhu, Q.; Wan, Y. BiDFNet: A Bidirectional Feature Fusion Network for 3D Object Detection Based on Pseudo-LiDAR. Information 2025, 16, 437. [Google Scholar] [CrossRef]
  32. Ruan, J.; Li, J.; Xiang, S. Vm-unet: Vision mamba unet for medical image segmentation. arXiv 2024, arXiv:2402.02491. [Google Scholar] [CrossRef]
  33. Wang, C.; Tsepa, O.; Ma, J.; Wang, B. Graph-mamba: Towards long-range graph sequence modeling with selective state spaces. arXiv 2024, arXiv:2402.00789. [Google Scholar]
  34. Li, Y.; Xie, C.; Chen, H. Multi-scale representation for image deraining with state space model. Signal Image Video Process. 2025, 19, 183. [Google Scholar] [CrossRef]
  35. Tang, Y.; Li, Y.; Zou, H.; Zhang, X. Interactive Segmentation for Medical Images Using Spatial Modeling Mamba. Information 2024, 15, 633. [Google Scholar] [CrossRef]
  36. Zhang, T.; Yuan, H.; Qi, L.; Zhang, J.; Zhou, Q.; Ji, S.; Yan, S.; Li, X. Point cloud mamba: Point cloud learning via state space model. In Proceedings of the AAAI Conference on Artificial Intelligence, Philadelphia, PA, USA, 25 February–4 March 2025; Volume 39, pp. 10121–10130. [Google Scholar]
  37. Liang, D.; Zhou, X.; Xu, W.; Zhu, X.; Zou, Z.; Ye, X.; Tan, X.; Bai, X. Pointmamba: A simple state space model for point cloud analysis. Adv. Neural Inf. Process. Syst. 2024, 37, 32653–32677. [Google Scholar]
  38. Xie, X.; Cui, Y.; Tan, T.; Zheng, X.; Yu, Z. Fusionmamba: Dynamic feature enhancement for multimodal image fusion with mamba. Vis. Intell. 2024, 2, 37. [Google Scholar] [CrossRef]
  39. Zhu, L.; Liao, B.; Zhang, Q.; Wang, X.; Liu, W.; Wang, X. Vision mamba: Efficient visual representation learning with bidirectional state space model. arXiv 2024, arXiv:2401.09417. [Google Scholar] [CrossRef]
  40. Gu, A.; Goel, K.; Ré, C. Efficiently modeling long sequences with structured state spaces. arXiv 2021, arXiv:2111.00396. [Google Scholar]
  41. Gu, A.; Johnson, I.; Goel, K.; Saab, K.; Dao, T.; Rudra, A.; Ré, C. Combining recurrent, convolutional, and continuous-time models with linear state space layers. Adv. Neural Inf. Process. Syst. 2021, 34, 572–585. [Google Scholar]
  42. Smith, J.T.; Warrington, A.; Linderman, S.W. Simplified state space layers for sequence modeling. arXiv 2022, arXiv:2208.04933. [Google Scholar]
  43. Qi, C.R.; Su, H.; Mo, K.; Guibas, L.J. Pointnet: Deep learning on point sets for 3d classification and segmentation. In Proceedings of the IEEE Conference on Computer Vision and Pattern Recognition, Honolulu, HI, USA, 21–26 July 2017; pp. 652–660. [Google Scholar]
  44. Woo, S.; Park, J.; Lee, J.Y.; Kweon, I.S. Cbam: Convolutional block attention module. In Proceedings of the European Conference on Computer Vision (ECCV), Munich, Germany, 8–14 September 2018; pp. 3–19. [Google Scholar]
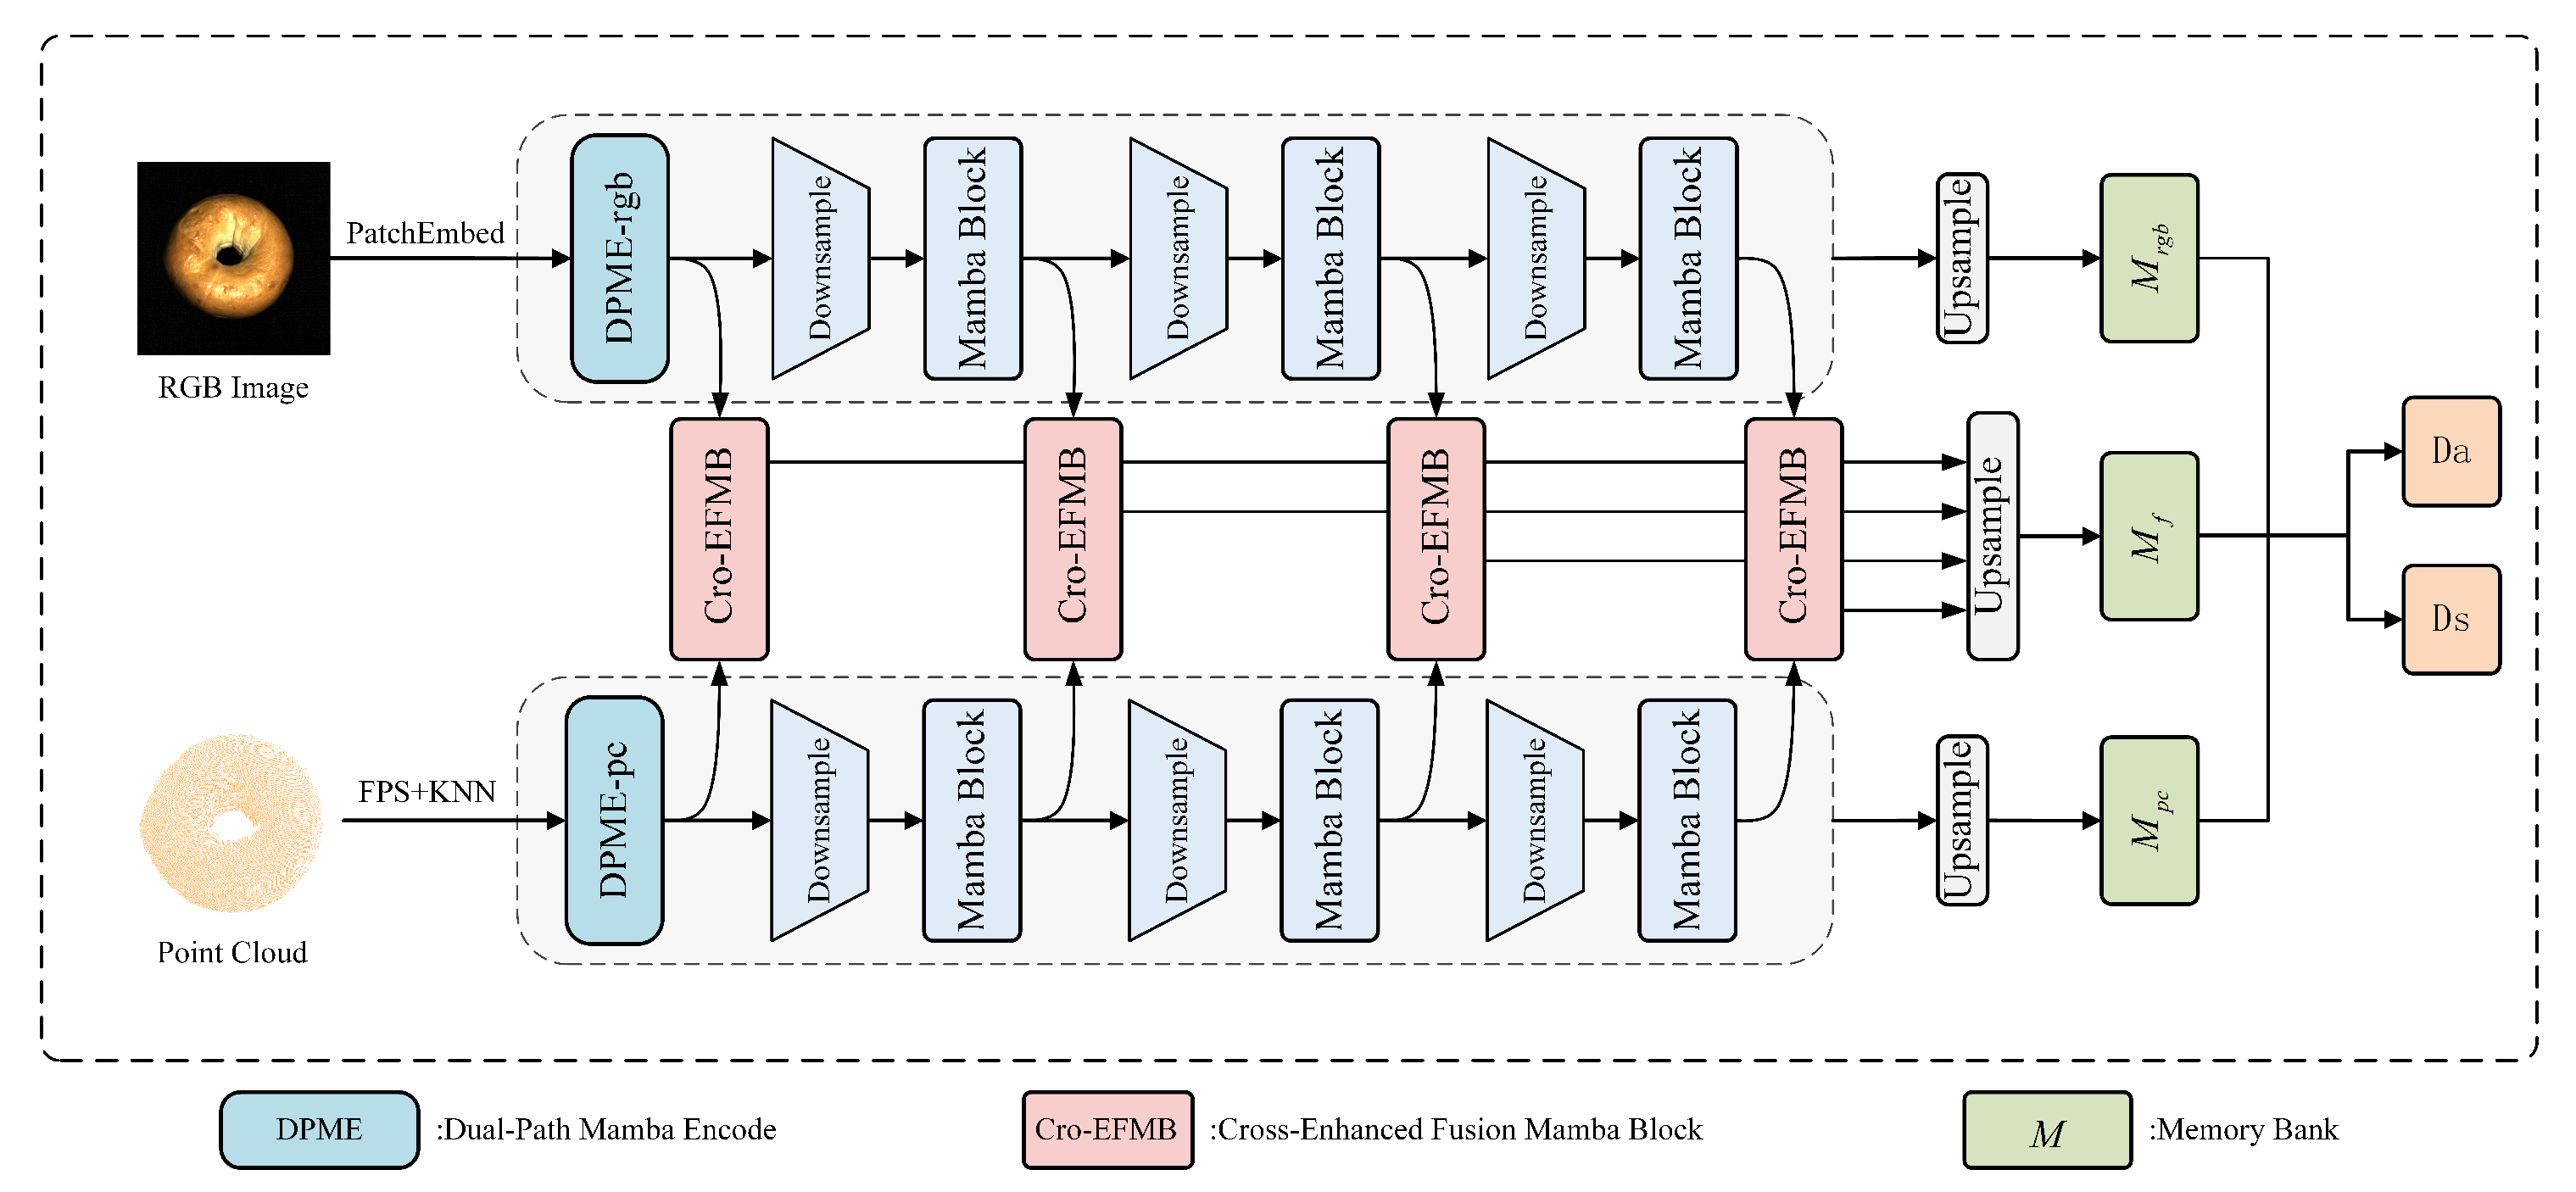
Figure 1. Overall architecture of HFMM-Net. The bidirectional Mamba encoder extracts multiscale features from RGB and point cloud inputs, which are then fused by Cro-EFMB before passing to the decision module.
Information 16 01018 g001
Figure 2. Overall architecture of the Dual-Path Mamba Encoder. Each modality (rgb or pc) has its own DPME. Each modality uses an identical DPME architecture but is trained independently with non-shared weights.
Information 16 01018 g002
Figure 3. Schematic of the Cross-Enhanced Fusion Mamba Block (Cro-EFMB). The ⊕ and ⊗ in the figure represent element-wise addition and multiplication, respectively.
Information 16 01018 g003
Figure 4. Visualization of prediction results on the MVTec 3D-AD dataset using our method and other baselines. In the heatmap, the red regions indicate the actual locations of defects detected by the model, with deeper color indicating higher contribution to the model’s decision-making.
Information 16 01018 g004
Table 1. I-AUROC scores for anomaly detection on all categories of the MVTec 3D-AD dataset. The best results are shown in bold and the second-best are underlined.
MethodBagelCableGlandCarrotCookieDowelFoamPeachPotatoRopeTireMean
BTF0.9180.7480.9670.8830.9320.5820.8960.9120.9410.8860.866
PatchCore + FPFH0.9300.8170.9520.8220.9030.6880.8590.9240.9200.9660.878
M3DM0.9860.8910.9880.9730.9570.8090.9810.9580.9670.9110.942
CFM0.9840.9050.9740.9670.9600.9410.9730.9370.9720.8690.948
CPMF0.9770.9320.9560.9770.9610.8810.9650.9540.9590.9390.950
TRD0.9860.9610.9680.9660.9720.9020.9820.9350.9840.8810.953
Ours0.9950.9200.9850.9950.9740.9000.9600.9330.9800.9200.956
Table 2. P-AUROC scores for anomaly segmentation on all categories of the MVTec 3D-AD dataset. The best results are shown in bold and the second-best are underlined.
MethodBagelCableGlandCarrotCookieDowelFoamPeachPotatoRopeTireMean
BTF0.9300.9600.9700.8900.9500.9500.9200.9400.9200.9000.933
PatchCore + FPFH0.9500.8600.9900.9000.9300.8200.9600.9800.9600.9600.931
M3DM0.9800.9500.9950.9600.9850.9450.9900.9700.9950.9900.976
CFM0.9890.9630.9980.9750.9830.9520.9880.9800.9980.9630.979
CPMF0.9940.9900.9820.9830.9850.9870.9920.9930.9940.9860.988
TRD0.9950.9930.9890.9960.9930.9890.9910.9950.9950.9900.992
Ours0.9960.9920.9970.9930.9940.9880.9920.9930.9970.9890.993
Table 3. AUPRO@30% scores for anomaly segmentation on all categories of the MVTec 3D-AD dataset. The best results are shown in bold and the second-best are underlined.
MethodBagelCableGlandCarrotCookieDowelFoamPeachPotatoRopeTireMean
BTF0.8800.7000.9100.8500.9300.5500.8900.9000.9000.8800.839
PatchCore + FPFH0.9720.9660.9700.9270.9330.8890.9750.9810.9520.9710.953
M3DM0.9670.9700.9730.9490.9410.9320.9780.9660.9680.9710.961
CFM0.9800.9720.9950.9500.9700.9710.9860.9920.9710.9800.976
CPMF0.9570.9450.9790.8680.8970.7460.9790.9800.9610.9770.928
TRD0.9770.9810.9880.9690.9720.9830.9910.9830.9760.9780.979
Ours0.9890.9700.9950.9740.9700.9600.9960.9900.9950.9820.982
Table 4. AUPRO@1% scores for anomaly segmentation on all categories of the MVTec 3D-AD dataset. The best results are shown in bold and the second-best are underlined.
MethodBagelCableGlandCarrotCookieDowelFoamPeachPotatoRopeTireMean
BTF0.260.200.310.280.240.180.300.260.290.280.26
PatchCore + FPFH0.370.300.450.420.360.290.420.440.390.400.384
M3DM0.430.380.480.470.460.380.500.460.480.460.45
CFM0.460.430.470.450.440.400.480.450.440.400.442
CPMF0.470.410.480.440.420.410.460.470.430.420.441
TRD0.460.430.490.430.410.400.460.480.440.460.446
Ours0.480.420.500.470.390.420.470.490.460.470.457
Table 5. Results on Eyecandies. We report the mean scores over 10 categories. The best results are shown in bold and the second-best are underlined.
MethodI-AUROCP-AUROCAUPRO@30%AUPRO@1%
M3DM0.7830.9020.8650.225
CFM0.8910.9760.8820.334
CPMF0.8820.9620.8750.335
TRD0.8770.9630.8870.338
Ours0.8870.9660.8910.341
Table 6. Few-shot and full-set results on MVTec 3D-AD across four metrics. Best in bold, second-best underlined.
I-AUROCP-AUROCAUPRO@30%AUPRO@1%
Method5-Shot10-Shot50-ShotFull5-Shot10-Shot50-ShotFull5-Shot10-Shot50-ShotFull5-Shot10-Shot50-ShotFull
M3DM0.8230.8450.9070.9420.9820.9840.9860.9860.9370.9430.9550.9610.3300.3550.3990.450
CFM0.8110.8460.9060.9480.9660.9670.9750.9790.9490.9540.9680.9760.3820.3980.4320.442
TRD0.8330.8510.9120.9530.9740.9830.9890.9920.9390.9500.9670.9790.3930.4020.4350.448
Ours0.8220.8450.9080.9560.9820.9850.9910.9930.9480.9540.9630.9820.3920.3990.4450.457
Table 7. Ablation and encoder replacement on MVTec 3D-AD.
MethodI-AUROCP-AUROCAUPRO@30%AUPRO@1%
HFMM-Net0.9560.9870.9820.457
w/o DPME0.9440.9760.9680.438
w/o Dual-Path0.9470.9780.9700.440
w/o smooth0.9530.9830.9790.449
HFMM-ViT0.9460.9770.9690.439
HFMM-MHA0.9430.9750.9660.435
HFMM-ResNet180.9360.9720.9610.428
Table 8. Effect of CBAM on multimodal fusion. We report I-AUROC, P-AUROC, AUPRO@30%, and AUPRO@1% on the MVTec 3D-AD dataset.
MethodI-AUROCP-AUROCAUPRO@30%AUPRO@1%
HFMM-Net0.9560.9930.9820.457
w/o Cro-EFMB0.9430.9770.9800.452
w/o CBAM0.9400.9720.9770.446
Table 9. Ablation of the proposed DPME and Cro-EFMB modules. Results are reported for I-AUROC, P-AUROC, AUPRO@30%, and AUPRO@1%.
ComponentI-AUROCP-AUROCAUPRO@30%AUPRO@1%
DPMECro-EFMB
××0.8990.9650.9610.430
×0.9440.9760.9680.438
×0.9430.9770.9800.452
0.9560.9930.9820.457
Table 10. Single-modality vs. our method on the MVTec 3D-AD dataset.
MethodI-AUROCP-AUROCAUPRO@30%AUPRO@1%
Only RGB0.8540.9340.9770.448
Only PC0.8730.9050.9620.439
Ours0.9560.9870.9820.457
Table 11. Efficiency and accuracy comparison.
MethodMemory (MB)Inference (FPS)t (ms)I-AUROC
BTF381.063.91255.80.866
M3DM6528.700.5281893.90.942
CFM437.9112.0083.30.948
CPMF2195.000.6091642.00.950
TRD682.5021.7046.10.953
w/o DPME524.326.138.50.944
HFMM-ViT780.25.3188.70.946
HFMM-Net (Ours)594.7024.8040.30.956
Disclaimer/Publisher’s Note: The statements, opinions and data contained in all publications are solely those of the individual author(s) and contributor(s) and not of MDPI and/or the editor(s). MDPI and/or the editor(s) disclaim responsibility for any injury to people or property resulting from any ideas, methods, instructions or products referred to in the content.