An AI Hybrid Building Energy Benchmarking Framework Across Two Time Scales
Abstract
1. Introduction
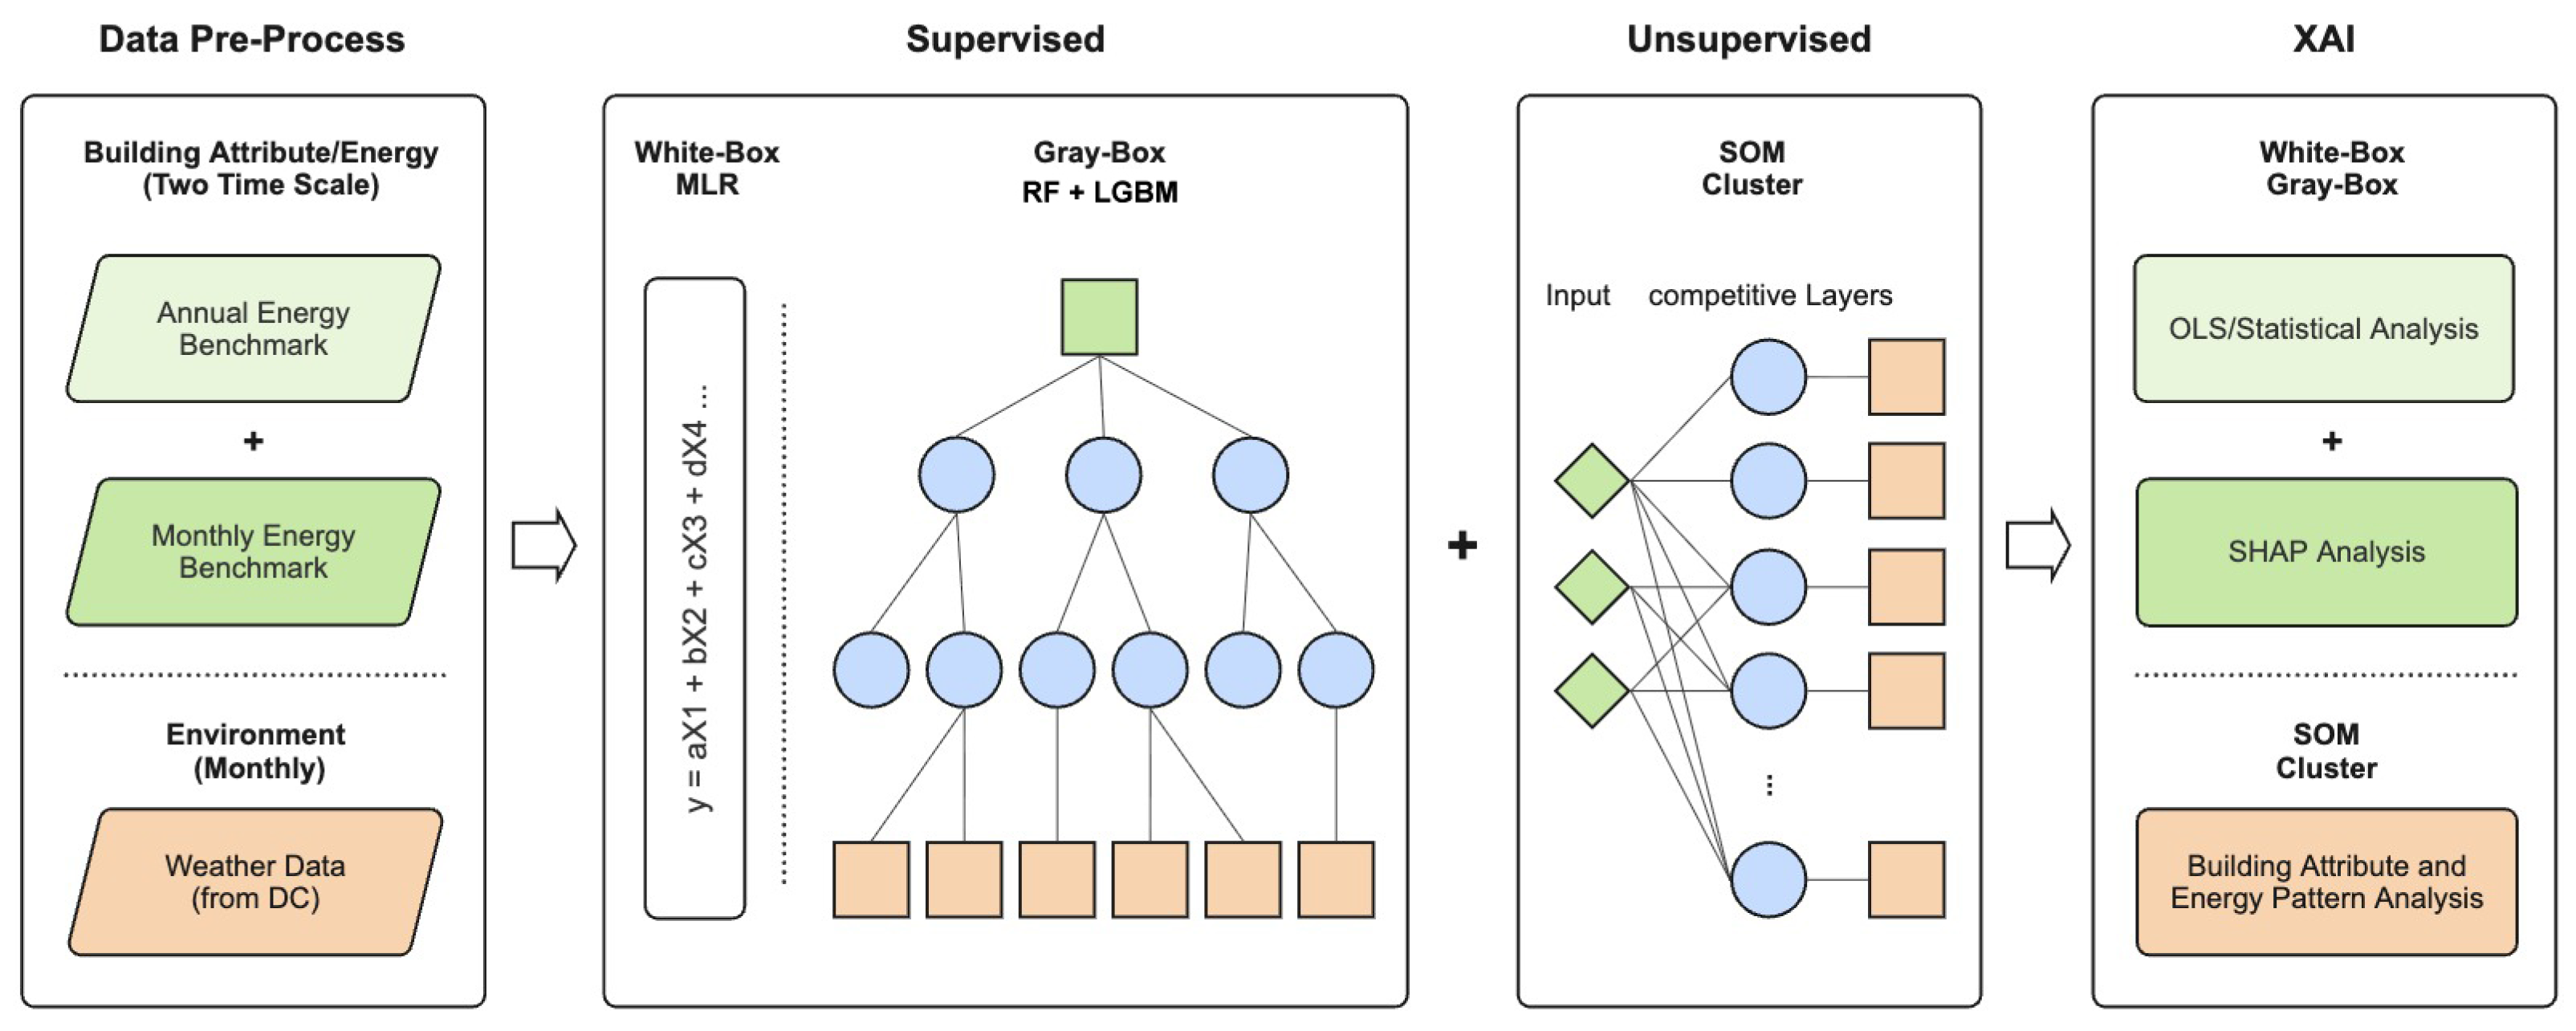
- Develop a hybrid supervised and unsupervised learning framework for energy benchmarking across two time scales, integrating both annual and monthly perspectives.
- Provide interpretability and sensitivity analyses of building attributes across scales, highlighting the impacts/roles of building attributes and climate factors.
- Demonstrate the advantages of SOM in classifying heterogeneous building stocks to challenge traditional building classifications.
- Offer a replicable and transferable framework for cities and regions seeking scalable energy benchmarking methods to support decarbonization.
2. High-Granularity Dataset and Methodology
2.1. Data Collection and Preprocessing
2.2. Supervised Prediction Models
2.3. Model Evaluation and Interpretability
2.4. Cluster Benchmarking via SOM Unsupervised Learning
3. Results
3.1. Supervised Prediction at the Annual and Monthly Scale
3.2. Sensitivity and Feature Importance
3.3. Unsupervised Clustering with SOM
4. Discussion
4.1. Dual-Scale Insights and the Balance Between Accuracy and Interpretability
4.2. SOM-Based Classification and Benchmarking Implications
4.3. Practical Relevance, Limitations, and Future Directions
4.4. Summary
5. Conclusions
- Developed a dual-scale (annual and monthly) benchmarking framework that enhances both prediction accuracy and interpretability of building energy performance.
- Demonstrated the model’s generalizability across different climate zones (Washington, D.C.–4A and Pittsburgh, PA–5A) with consistently strong and low RMSE values.
- Integrated XAI methods using SHAP and clustering analysis to quantify key drivers of building energy use, highlighting the dominant influence of Energy Star rating, electricity, and natural gas intensities.
- Employed SOM-based unsupervised clustering to challenge conventional building classification methods, enabling a deeper understanding of cluster-specific characteristics.
- Provided a transparent, stakeholder-oriented decision-support tool that fosters trust in AI-based benchmarking for policymakers, designers, and building operators.
Author Contributions
Funding
Institutional Review Board Statement
Informed Consent Statement
Data Availability Statement
Acknowledgments
Conflicts of Interest
References
- Fumo, N. A review on the basics of building energy estimation. Renew. Sustain. Energy Rev. 2014, 31, 53–60. [Google Scholar] [CrossRef]
- Bie, H.; Guo, B.; Li, T.; Loftness, V. A review of air-side economizers in human-centered commercial buildings: Control logic, energy savings, IAQ potential, faults, and performance enhancement. Energy Build. 2025, 331, 115389. [Google Scholar] [CrossRef]
- IEA. Net Zero by 2050; IEA: Paris, France, 2021. [Google Scholar]
- Ye, Y.; Zuo, W.; Wang, G. A comprehensive review of energy-related data for US commercial buildings. Energy Build. 2019, 186, 126–137. [Google Scholar] [CrossRef]
- Triana, M.A.; Lamberts, R.; Sassi, P. Characterisation of representative building typologies for social housing projects in Brazil and its energy performance. Energy Policy 2015, 87, 524–541. [Google Scholar] [CrossRef]
- Yu, Y.; Cheng, J.; You, S.; Ye, T.; Zhang, H.; Fan, M.; Wei, S.; Liu, S. Effect of implementing building energy efficiency labeling in China: A case study in Shanghai. Energy Policy 2019, 133, 110898. [Google Scholar] [CrossRef]
- Kontokosta, C.E.; Spiegel-Feld, D.; Papadopoulos, S. The impact of mandatory energy audits on building energy use. Nat. Energy 2020, 5, 309–316. [Google Scholar] [CrossRef]
- Sharp, T. Energy benchmarking in commercial office buildings. ACEEE 1996, 7996, 321–329. [Google Scholar]
- Papadopoulos, S.; Bonczak, B.; Kontokosta, C.E. Spatial and geographic patterns of building energy performance: A cross-city comparative analysis of large-scale data. In Proceedings of the International Conference on Sustainable Infrastructure 2017, New York, NY, USA, 26–28 October 2017; pp. 336–348. [Google Scholar] [CrossRef]
- Arjunan, P.; Poolla, K.; Miller, C. EnergyStar++: Towards more accurate and explanatory building energy benchmarking. Appl. Energy 2020, 276, 115413. [Google Scholar] [CrossRef]
- Li, T.; Bie, H.; Lu, Y.; Sawyer, A.O.; Loftness, V. MEBA: AI-powered precise building monthly energy benchmarking approach. Appl. Energy 2024, 359, 122716. [Google Scholar] [CrossRef]
- Arjunan, P.; Poolla, K.; Miller, C. BEEM: Data-driven building energy benchmarking for Singapore. Energy Build. 2022, 260, 111869. [Google Scholar] [CrossRef]
- Li, T.; Liu, T.; Sawyer, A.O.; Tang, P.; Loftness, V.; Lu, Y.; Xie, J. Generalized building energy and carbon emissions benchmarking with post-prediction analysis. Dev. Built Environ. 2024, 17, 100320. [Google Scholar] [CrossRef]
- Baset, A.; Jradi, M. Data-driven decision support for smart and efficient building energy retrofits: A review. Appl. Syst. Innov. 2024, 8, 5. [Google Scholar] [CrossRef]
- Sartor, D.; Piette, M.A.; Tschudi, W.; Fok, S. Strategies for Energy Benchmarking in Cleanrooms and Laboratory-Type Facilities; Lawrence Berkeley National Lab (LBNL): Berkeley, CA, USA, 2000. [Google Scholar]
- Zhao, H.x.; Magoulès, F. A review on the prediction of building energy consumption. Renew. Sustain. Energy Rev. 2012, 16, 3586–3592. [Google Scholar] [CrossRef]
- Mahmoud, R.; Kamara, J.M.; Burford, N. Opportunities and limitations of building energy performance simulation tools in the early stages of building design in the UK. Sustainability 2020, 12, 9702. [Google Scholar] [CrossRef]
- Amasyali, K.; El-Gohary, N.M. A review of data-driven building energy consumption prediction studies. Renew. Sustain. Energy Rev. 2018, 81, 1192–1205. [Google Scholar] [CrossRef]
- Papadopoulos, S.; Kontokosta, C.E. Grading buildings on energy performance using city benchmarking data. Appl. Energy 2019, 233, 244–253. [Google Scholar] [CrossRef]
- Park, H.S.; Lee, M.; Kang, H.; Hong, T.; Jeong, J. Development of a new energy benchmark for improving the operational rating system of office buildings using various data-mining techniques. Appl. Energy 2016, 173, 225–237. [Google Scholar] [CrossRef]
- Robinson, C.; Dilkina, B.; Hubbs, J.; Zhang, W.; Guhathakurta, S.; Brown, M.A.; Pendyala, R.M. Machine learning approaches for estimating commercial building energy consumption. Appl. Energy 2017, 208, 889–904. [Google Scholar] [CrossRef]
- Chen, Y.; Tan, H.; Berardi, U. A data-driven approach for building energy benchmarking using the Lorenz curve. Energy Build. 2018, 169, 319–331. [Google Scholar] [CrossRef]
- Catalina, T.; Virgone, J.; Blanco, E. Development and validation of regression models to predict monthly heating demand for residential buildings. Energy Build. 2008, 40, 1825–1832. [Google Scholar] [CrossRef]
- Vaisi, S.; Firouzi, M.; Varmazyari, P. Energy benchmarking for secondary school buildings, applying the Top-Down approach. Energy Build. 2023, 279, 112689. [Google Scholar] [CrossRef]
- Gao, X.; Malkawi, A. A new methodology for building energy performance benchmarking: An approach based on intelligent clustering algorithm. Energy Build. 2014, 84, 607–616. [Google Scholar] [CrossRef]
- Roth, J.; Lim, B.; Jain, R.K.; Grueneich, D. Examining the feasibility of using open data to benchmark building energy usage in cities: A data science and policy perspective. Energy Policy 2020, 139, 111327. [Google Scholar] [CrossRef]
- Bandam, A.; Busari, E.; Syranidou, C.; Linssen, J.; Stolten, D. Classification of building types in germany: A data-driven modeling approach. Data 2022, 7, 45. [Google Scholar] [CrossRef]
- Li, T.; Xie, J.; Liu, T.; Lu, Y.; Sawyer, A.O. An Innovative Building Energy Use Analysis by Unsupervised Classification and Supervised Regression Models. In Proceedings of the ASHRAE Annual Conference, Tampa, FL, USA, 24–28 June 2023. [Google Scholar] [CrossRef]
- Kohonen, T. The self-organizing map. Proc. IEEE 2002, 78, 1464–1480. [Google Scholar] [CrossRef]
- Vesanto, J. Neural network tool for data mining: SOM toolbox. In Proceedings of the Symposium on Tool Environments and Development Methods for Intelligent Systems (TOOLMET2000), Oulu, Finland, 13–14 April 2000; pp. 184–196. [Google Scholar]
- Sengupta, M.; Xie, Y.; Lopez, A.; Habte, A.; Maclaurin, G.; Shelby, J. The national solar radiation data base (NSRDB). Renew. Sustain. Energy Rev. 2018, 89, 51–60. [Google Scholar] [CrossRef]
- Parsons, H.M.; Ludwig, C.; Günther, U.L.; Viant, M.R. Improved classification accuracy in 1-and 2-dimensional NMR metabolomics data using the variance stabilising generalised logarithm transformation. BMC Bioinform. 2007, 8, 234. [Google Scholar] [CrossRef]
- Tian, J.; Zhao, T.; Li, Z.; Li, T.; Bie, H.; Loftness, V. VOD: Vision-Based Building Energy Data Outlier Detection. Mach. Learn. Knowl. Extr. 2024, 6, 965–986. [Google Scholar] [CrossRef]
- Ding, Y.; Liu, X. A comparative analysis of data-driven methods in building energy benchmarking. Energy Build. 2020, 209, 109711. [Google Scholar] [CrossRef]
- Ke, G.; Meng, Q.; Finley, T.; Wang, T.; Chen, W.; Ma, W.; Ye, Q.; Liu, T.Y. Lightgbm: A highly efficient gradient boosting decision tree. Adv. Neural Inf. Process. Syst. 2017, 30, 3295074. [Google Scholar]
- Rosenfelder, M.; Wussow, M.; Gust, G.; Cremades, R.; Neumann, D. Predicting residential electricity consumption using aerial and street view images. Appl. Energy 2021, 301, 117407. [Google Scholar] [CrossRef]
- Wei, Z.; Xu, W.; Wang, D.; Li, L.; Niu, L.; Wang, W.; Wang, B.; Song, Y. A study of city-level building energy efficiency benchmarking system for China. Energy Build. 2018, 179, 1–14. [Google Scholar] [CrossRef]
- Li, Y.; O’Neill, Z.; Zhang, L.; Chen, J.; Im, P.; DeGraw, J. Grey-box modeling and application for building energy simulations-A critical review. Renew. Sustain. Energy Rev. 2021, 146, 111174. [Google Scholar] [CrossRef]
- Zhang, J.; Huang, Y.; Cheng, H.; Chen, H.; Xing, L.; He, Y. Ensemble learning-based approach for residential building heating energy prediction and optimization. J. Build. Eng. 2023, 67, 106051. [Google Scholar] [CrossRef]
- Tramontana, G.; Jung, M.; Schwalm, C.R.; Ichii, K.; Camps-Valls, G.; Ráduly, B.; Reichstein, M.; Arain, M.A.; Cescatti, A.; Kiely, G.; et al. Predicting carbon dioxide and energy fluxes across global FLUXNET sites with regression algorithms. Biogeosciences 2016, 13, 4291–4313. [Google Scholar] [CrossRef]
- Chai, T.; Draxler, R.R. Root mean square error (RMSE) or mean absolute error (MAE). Geosci. Model Dev. Discuss. 2014, 7, 1525–1534. [Google Scholar] [CrossRef]
- Uyar, S.G.K.; Ozbay, B.K.; Dal, B. Interpretable building energy performance prediction using XGBoost Quantile Regression. Energy Build. 2025, 340, 115815. [Google Scholar] [CrossRef]
- Dwivedi, R.; Dave, D.; Naik, H.; Singhal, S.; Omer, R.; Patel, P.; Qian, B.; Wen, Z.; Shah, T.; Morgan, G.; et al. Explainable AI (XAI): Core ideas, techniques, and solutions. ACM Comput. Surv. 2023, 55, 1–33. [Google Scholar] [CrossRef]
- Rezazadeh, F.; Barrachina-Muñoz, S.; Chergui, H.; Mangues, J.; Bennis, M.; Niyato, D.; Song, H.; Liu, L. Toward explainable reasoning in 6g: A proof of concept study on radio resource allocation. IEEE Open J. Commun. Soc. 2024, 5, 6239–6260. [Google Scholar] [CrossRef]
- Chung, W.; Yeung, I.M. Benchmarking by convex non-parametric least squares with application on the energy performance of office buildings. Appl. Energy 2017, 203, 454–462. [Google Scholar] [CrossRef]
- Zhang, S.; Wang, Z.; Su, X. A Study on the Inter-Pretability of Network Attack Prediction Models Based on Light Gradient Boosting Machine (LGBM) and SHapley Additive exPlanations (SHAP). Comput. Mater. Contin. 2025, 83, 062080. [Google Scholar] [CrossRef]
- Lundberg, S.M.; Lee, S.I. A unified approach to interpreting model predictions. arXiv 2017, arXiv:1705.07874. [Google Scholar] [CrossRef]
- Rocha, E.M.; Brochado, Â.F.; Rato, B.; Meneses, J. Benchmarking and Prediction of Entities Performance on Manufacturing Processes through MEA Robust XGBoost and SHAP Analysis. In Proceedings of the 2022 IEEE 27th International Conference on Emerging Technologies and Factory Automation (ETFA), Stuttgart, Germany, 6–9 September 2022; IEEE: Piscataway, NJ, USA, 2022; pp. 1–8. [Google Scholar] [CrossRef]
- Joshi, K.; Jana, A.; Arjunan, P.; Ramamritham, K. XENIA: Axplainable energy informatics and attributes for building energy benchmarking. In Proceedings of the 9th ACM International Conference on Systems for Energy-Efficient Buildings, Cities, and Transportation, Boston, MA, USA, 9–10 November 2022; pp. 406–412. [Google Scholar] [CrossRef]
- Li, T.; Lu, Y. AI-Driven Dual-Scale Building Energy Benchmarking for Decarbonization. SSRN 2025. [Google Scholar] [CrossRef]
- Kohonen, T. Essentials of the self-organizing map. Neural Netw. 2013, 37, 52–65. [Google Scholar] [CrossRef]
- Majidi, F. A Hybrid SOM and K-means Model for Time Series Energy Consumption Clustering. arXiv 2023, arXiv:2312.11475. [Google Scholar] [CrossRef]
- Zhang, W.; Liu, X.; Wen, Y.; Zhou, S.; Ge, R.; Xie, X. User classification based on SOM+ K-means cluster analysis. In Proceedings of the 2023 International Conference on Applied Physics and Computing (ICAPC), Ottawa, ON, Canada, 27–29 December 2023; IEEE: Piscataway, NJ, USA, 2023; pp. 391–394. [Google Scholar] [CrossRef]
- Vesanto, J.; Alhoniemi, E. Clustering of the self-organizing map. IEEE Trans. Neural Netw. 2000, 11, 586–600. [Google Scholar] [CrossRef]
- Vaisi, S.; Mohammadi, S.; Nastasi, B.; Javanroodi, K. A new Generation of Thermal Energy Benchmarks for University Buildings. Energies 2020, 13, 6606. [Google Scholar] [CrossRef]
- Farrou, I.; Kolokotroni, M.; Santamouris, M. A method for energy classification of hotels: A case-study of Greece. Energy Build. 2012, 55, 553–562. [Google Scholar] [CrossRef]
- Yang, Z.; Roth, J.; Jain, R.K. DUE-B: Data-driven urban energy benchmarking of buildings using recursive partitioning and stochastic frontier analysis. Energy Build. 2018, 163, 58–69. [Google Scholar] [CrossRef]
- Keyhani, M.; Abbaspour, A.; Bahadori-Jahromi, A.; Mylona, A.; Janbey, A.; Godfrey, P.; Zhang, H. Whole life carbon assessment of a typical UK residential building using different embodied carbon data sources. Sustainability 2023, 15, 5115. [Google Scholar] [CrossRef]
- Gan, V.J.; Chan, C.; Tse, K.; Lo, I.M.; Cheng, J.C. A comparative analysis of embodied carbon in high-rise buildings regarding different design parameters. J. Clean. Prod. 2017, 161, 663–675. [Google Scholar] [CrossRef]
- Trahair, N.S.; Bradford, M.; Nethercot, D.; Gardner, L. The Behaviour and Design of Steel Structures to EC3; CRC Press: London, UK, 2017. [Google Scholar] [CrossRef]
- Wernet, G.; Bauer, C.; Steubing, B.; Reinhard, J.; Moreno-Ruiz, E.; Weidema, B. The ecoinvent database version 3 (part I): Overview and methodology. Int. J. Life Cycle Assess. 2016, 21, 1218–1230. [Google Scholar] [CrossRef]

| Study (Ref.) | Location | Model (Approach) | Contribution | Research Gap |
|---|---|---|---|---|
| Catalina et al. (2008) [23] | France | Regression | Validate a regression for residential energy prediction | Building classification is limited in the study |
| Gao & Malkawi (2014) [25] | USA | K-Means | Develop a cluster-based energy benchmarking nationally | Energy use prediction is not addressed |
| Park et al. (2016) [20] | Korea | Decision Tree | Propose a rating system that outperforms the existing ones | Focus only on annual scale, less energy pattern analysis |
| Papadopoulos et al. (2017) [9] | USA | Statistic analysis | Propose a cross-city benchmark system using EUI and CO2 | Focus only on annual scale, less energy pattern analysis |
| Robinson et al. (2017) [21] | USA | MLR, SVM, etc. (13 total) | Reduce predictive errors than compared baseline | Focus only on annual scale, less energy pattern analysis |
| Chen et al. (2018) [22] | China | Lorenz curve | Increase 54% model predictive accuracy () than baseline | Focus only on annual scale |
| Roth et al. (2020) [26] | USA | RF, LASSO | Develop an accurate energy benchmark framework | Building classification and patterns are not covered |
| Bandam et al. (2022) [27] | Germany | HexaGAN, ANN | Introduce a solid classification method for energy modeling | Focus only on classification, without energy predictions |
| Li et al. (2023) [28] | USA | K-Means, LGBM | Introduce two steps of energy benchmarking in 5 climates | Energy pattern for annual and monthly is not explored |
| Vaisi et al. (2023) [24] | Iran | Statistic analysis | Propose a top-down benchmark system via site EUI | Relationship of annual and monthly energy is not covred |
| Li et al. (2024) [13] | USA | XGBoost | Proposed a generalized model that can be used nationally | Focus only on annual scale |
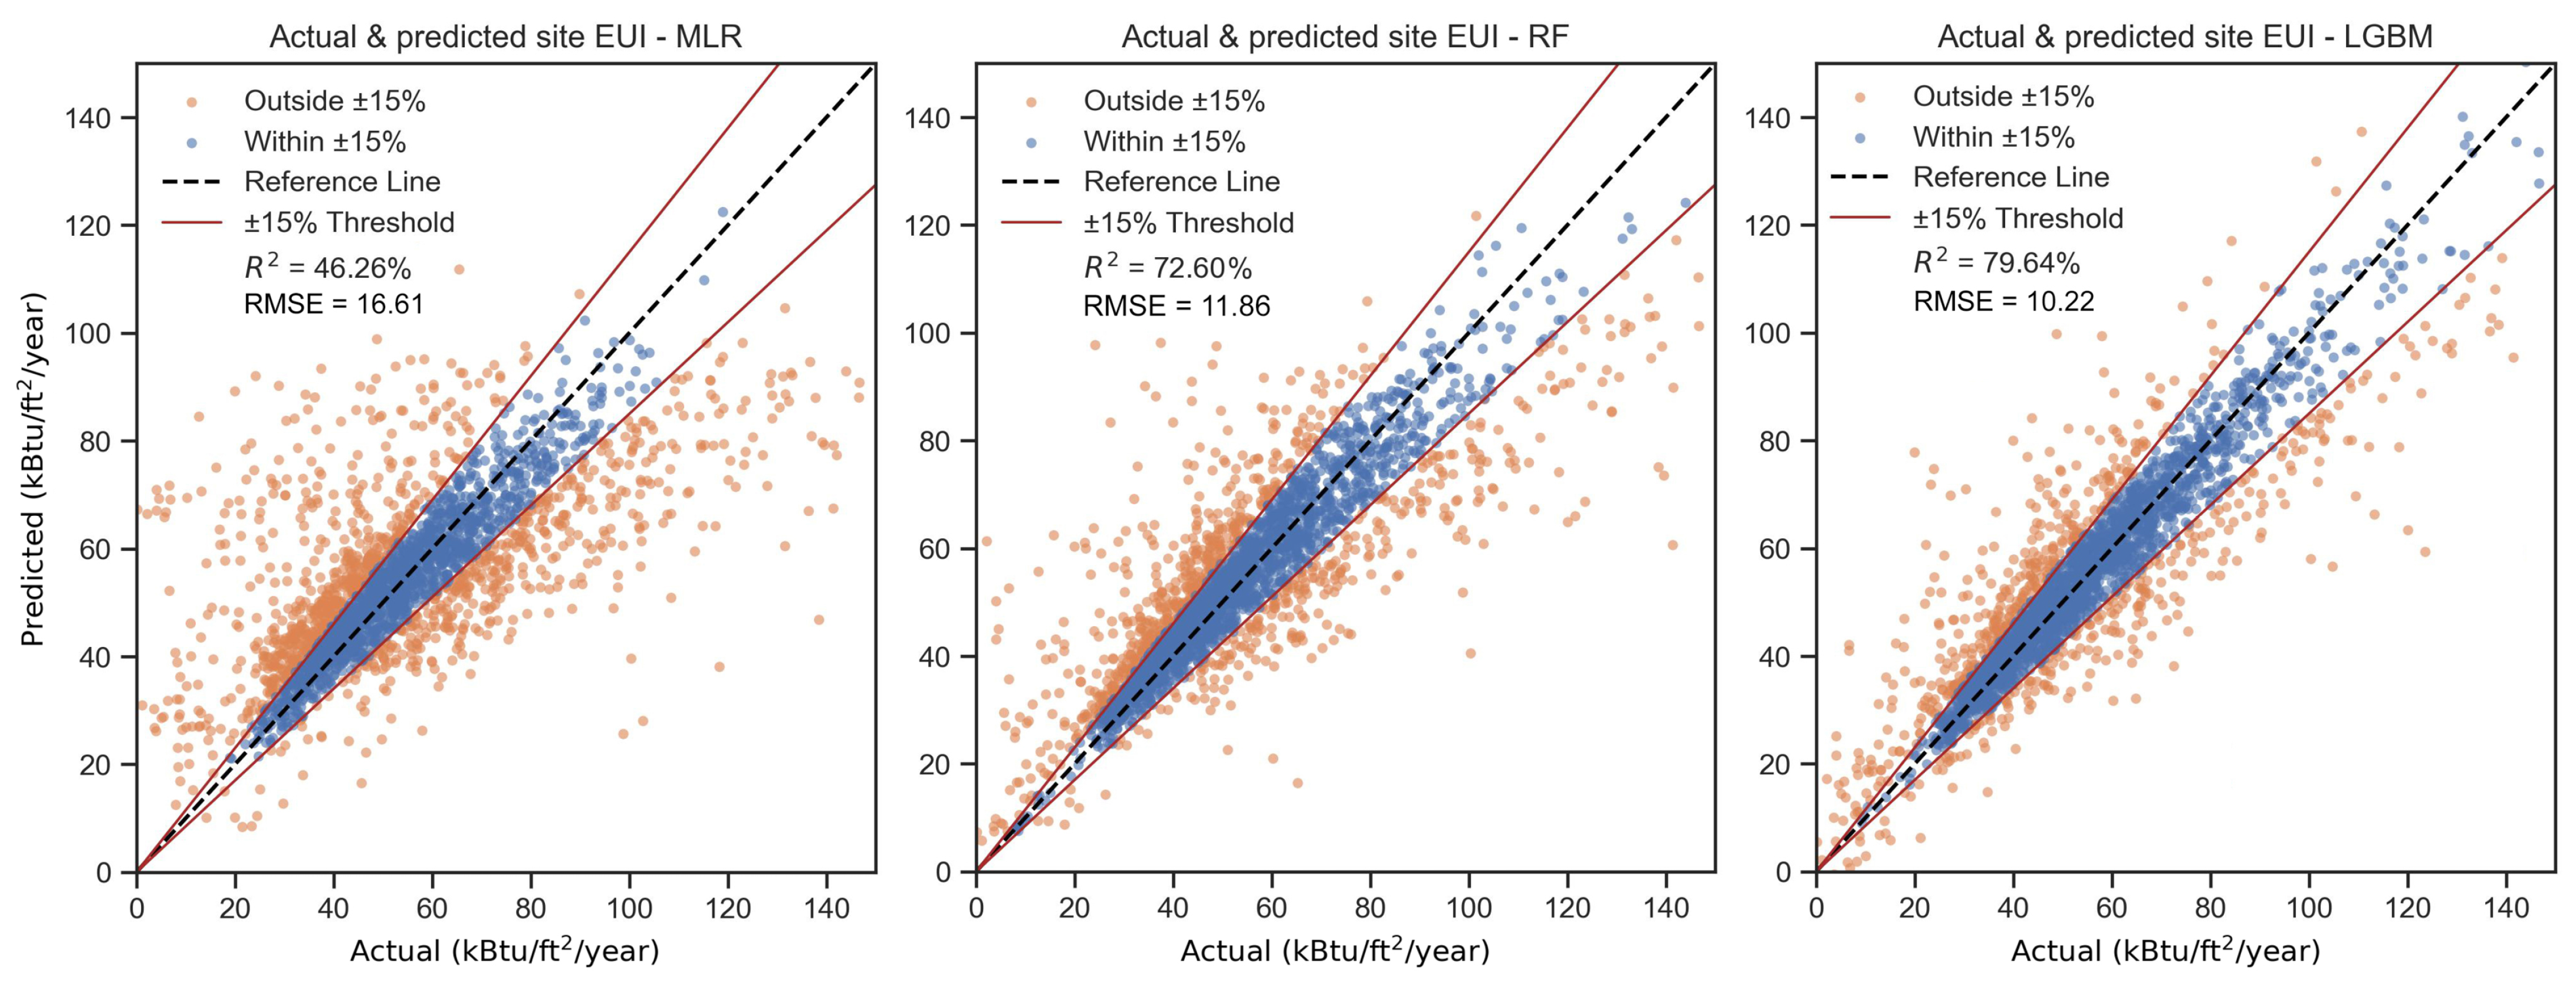
| Evaluation Metrics | MLR (Baseline) | RF (Dependent) | LGBM (Independent) |
|---|---|---|---|
| 46.26% | 72.60% | 79.64% | |
| RMSE | 16.61 | 11.86 | 10.22 |
| Acceptance interval % (±15%) | 55.40% | 67.08% | 73.76% |
| Computing time (base unit: T) | 1 × T | 200 × T | 10 × T |
| Metric | January | February | March | April | May | June | July | August | September | October | November | December | Annual |
|---|---|---|---|---|---|---|---|---|---|---|---|---|---|
| (D.C. only) | 0.79 | 0.86 | 0.79 | 0.56 | 0.46 | 0.63 | 0.66 | 0.65 | 0.58 | 0.54 | 0.80 | 0.81 | 0.80 |
| RMSE (D.C. only) | 3.57 | 2.04 | 1.78 | 1.17 | 1.04 | 0.88 | 1.02 | 0.98 | 0.91 | 1.04 | 1.66 | 2.56 | 10.22 |
| (D.C. + Pit) | 0.72 | 0.79 | 0.74 | 0.64 | 0.67 | 0.68 | 0.78 | 0.61 | 0.66 | 0.70 | 0.81 | 0.78 | 0.82 |
| RMSE (D.C. + Pit) | 2.96 | 2.28 | 2.38 | 1.92 | 2.16 | 1.23 | 1.76 | 1.08 | 1.16 | 1.47 | 1.36 | 2.05 | 10.89 |
| Variable | Coefficient | Std Error | t-Test | p-Value | 97.5% CI Lower | 97.5% CI Upper |
|---|---|---|---|---|---|---|
| Warehouse/storage | −53.748 | 7.460 | −7.204 | 0.000 | −68.372 | −39.124 |
| Other building types | −37.304 | 8.077 | −4.618 | 0.000 | −53.137 | −21.471 |
| Technology/science | −35.844 | 18.068 | −1.984 | 0.047 | −71.261 | −0.428 |
| Natural Gas (%) | 33.968 | 0.874 | 38.853 | 0.000 | 32.254 | 35.682 |
| Religious worship | −32.468 | 7.481 | −4.340 | 0.000 | −47.132 | −17.804 |
| Manufacturing/industrial | −29.454 | 9.651 | −3.052 | 0.002 | −48.373 | −10.536 |
| Utility | 22.799 | 18.062 | 1.262 | 0.207 | −12.606 | 58.203 |
| Mixed use | −21.234 | 7.556 | −2.810 | 0.005 | −36.046 | −6.422 |
| Services | −19.170 | 8.204 | −2.337 | 0.019 | −35.252 | −3.089 |
| Retail | −17.634 | 7.547 | −2.336 | 0.019 | −32.428 | −2.839 |
| Lodging/residential | −16.570 | 7.392 | −2.242 | 0.025 | −31.059 | −2.080 |
| Education | −15.974 | 7.401 | −2.158 | 0.031 | −30.481 | −1.467 |
| Banking/financial services | 14.874 | 9.207 | 1.616 | 0.106 | −3.173 | 32.921 |
| Parking | −14.294 | 12.045 | −1.187 | 0.235 | −37.905 | 9.317 |
| Entertainment/public assembly | −13.759 | 7.455 | −1.846 | 0.065 | −28.372 | 0.855 |
| Food sales and service | 12.336 | 8.109 | 1.521 | 0.128 | −3.559 | 28.232 |
| Public services | −11.713 | 7.441 | −1.574 | 0.115 | −26.299 | 2.872 |
| Office | −7.668 | 7.403 | −1.036 | 0.300 | −22.179 | 6.842 |
| Healthcare | 5.020 | 7.511 | 0.668 | 0.504 | −9.704 | 19.744 |
| Electricity Use (%) | −4.396 | 0.468 | −9.402 | 0.000 | −5.313 | −3.480 |
| Energy Star® rating | −0.369 | 0.007 | −54.156 | 0.000 | −0.382 | −0.355 |
| Jun_Relative Humidity | 0.129 | 0.009 | 14.090 | 0.000 | 0.111 | 0.146 |
| May_DHI | −0.109 | 0.015 | −7.131 | 0.000 | −0.139 | −0.079 |
| May_Relative Humidity | 0.102 | 0.015 | 6.610 | 0.000 | 0.072 | 0.133 |
| WARD | −0.101 | 0.084 | −1.190 | 0.234 | −0.266 | 0.065 |
| Characteristics | Cluster 0 | Cluster 1 | Cluster 2 | Cluster 3 | Cluster 4 | Cluster 5 |
|---|---|---|---|---|---|---|
| Dominant type (%) | Office | Lodging/residential | Office | Lodging/residential | Office | Lodging/residential |
| Median built year | 1984 | 1954 | 1991 | 1956 | 1982 | 1989 |
| Median area | 187,490 | 51,877 | 288,311 | 99,044 | 103,782 | 194,073 |
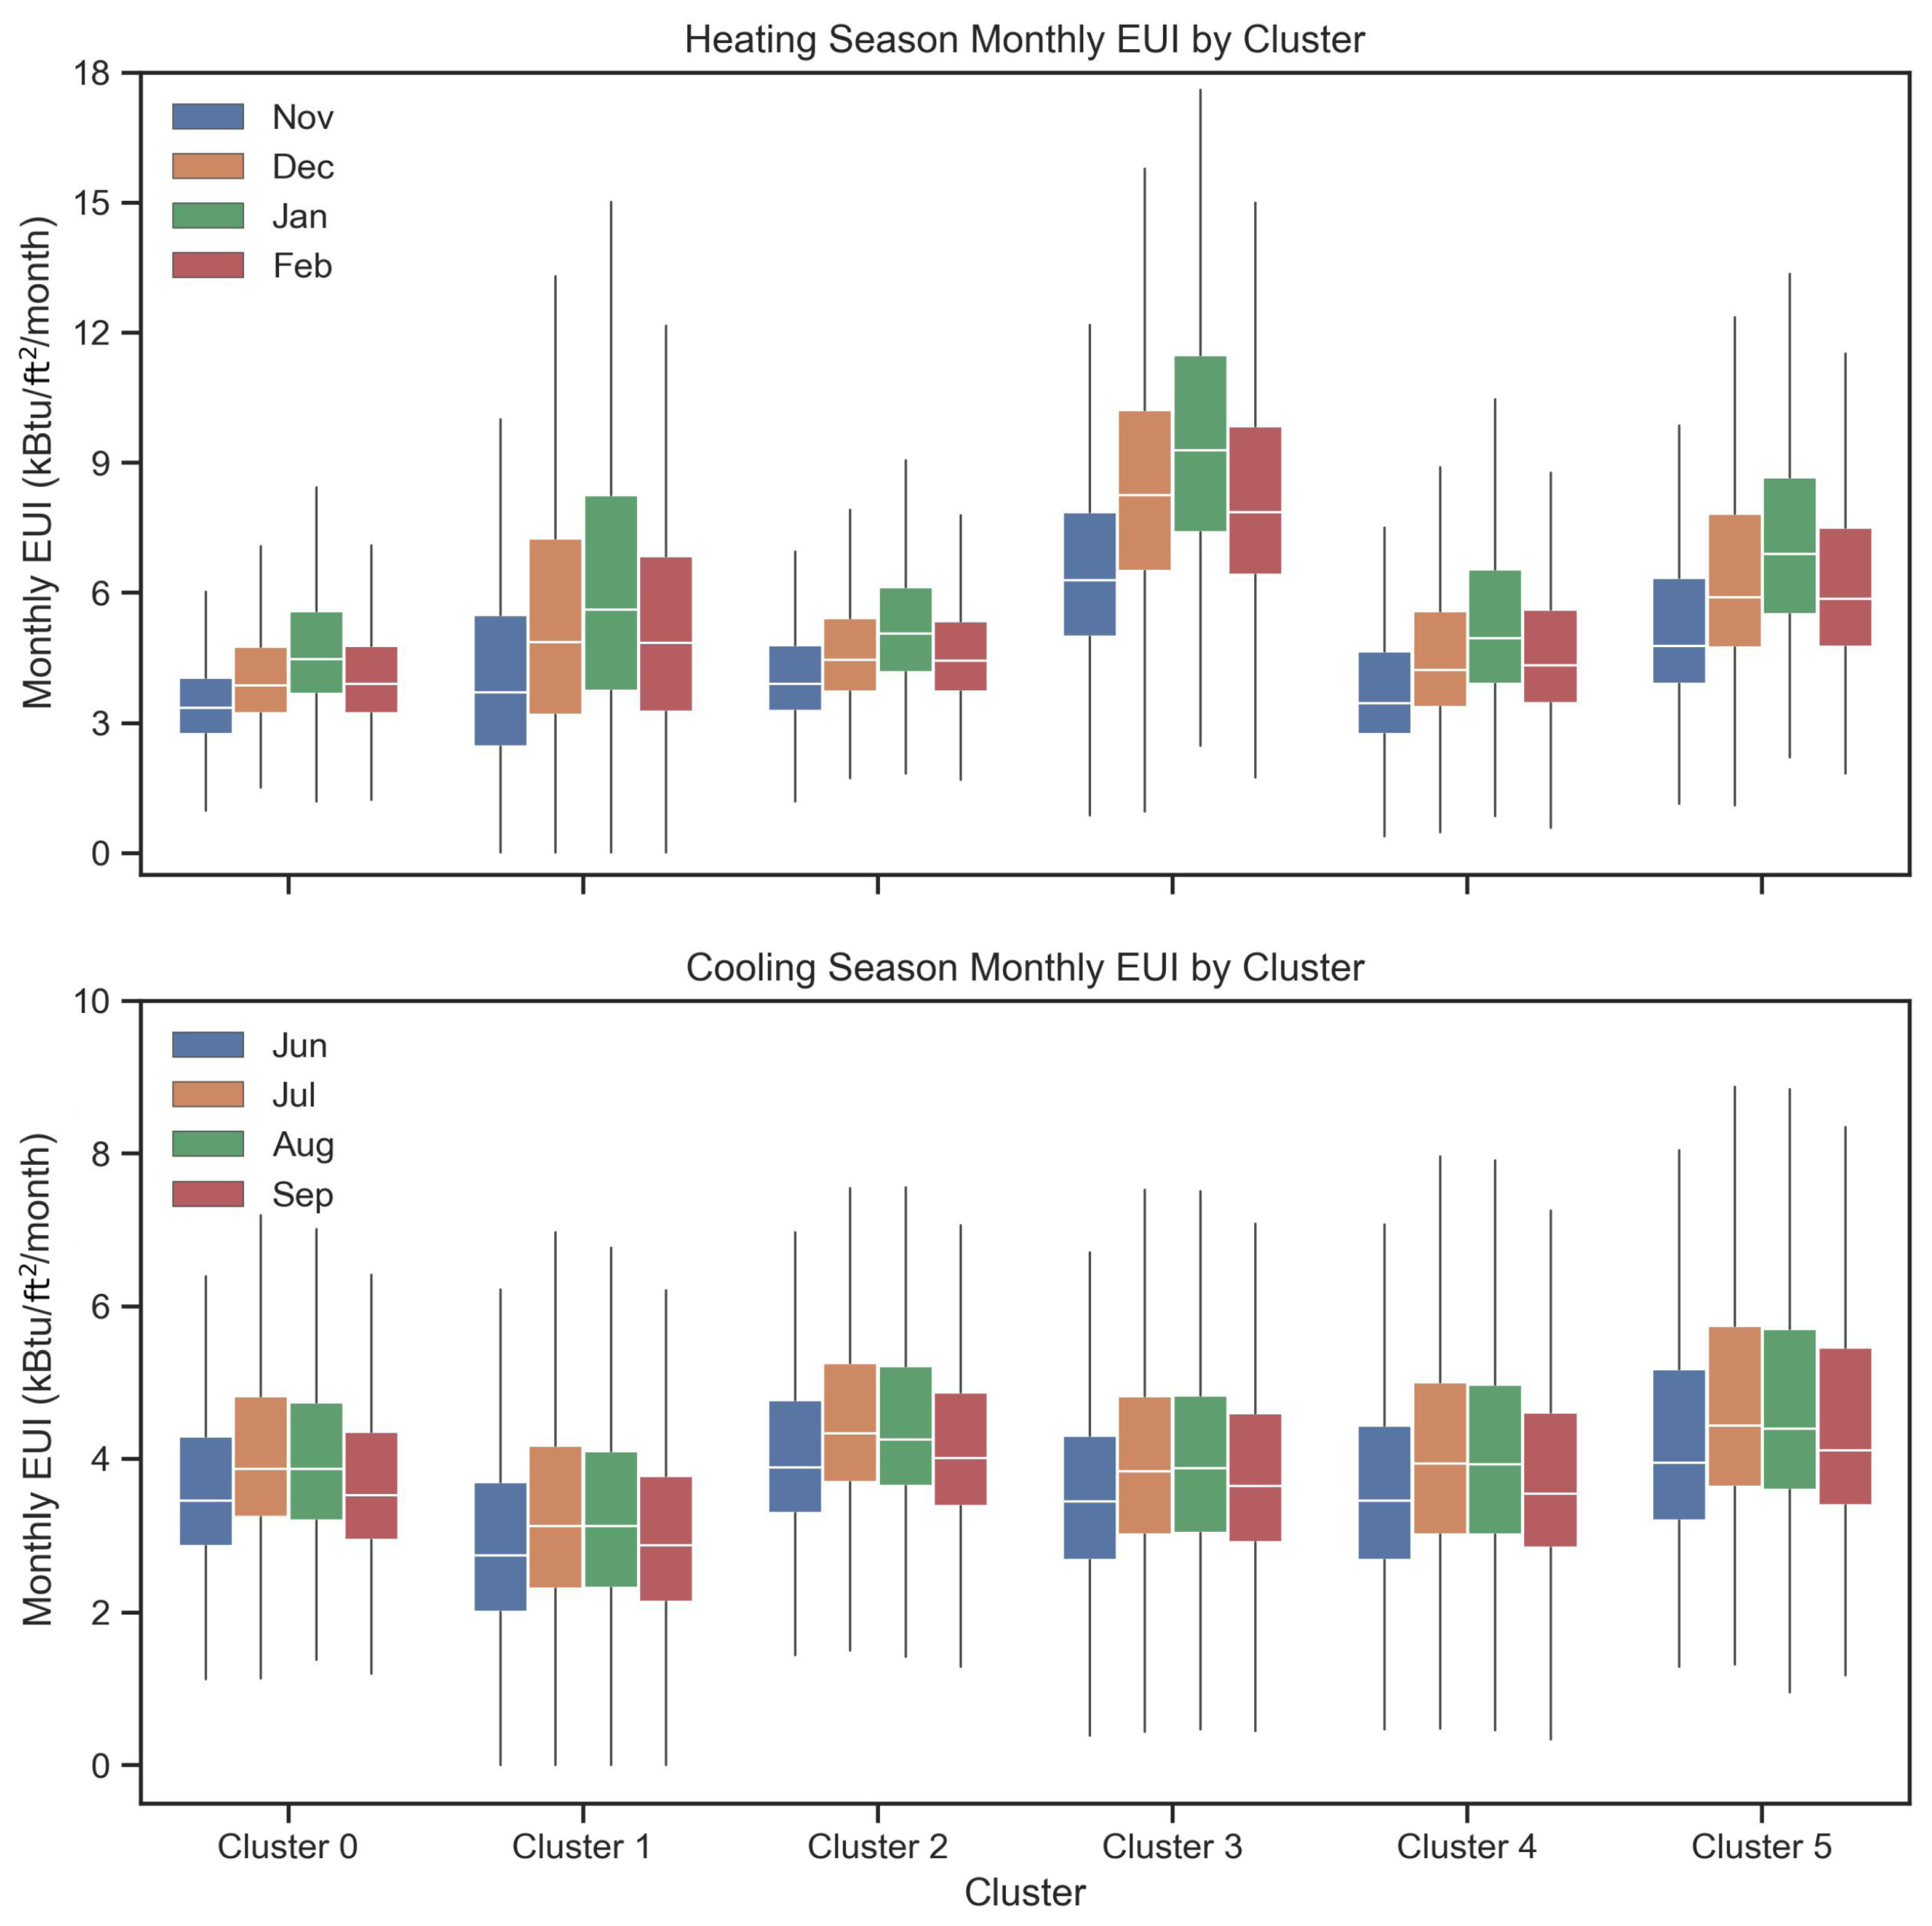
| Mean heating EUI | 4.72 | 5.88 | 4.95 | 8.81 | 5.07 | 7.06 |
| Mean cooling EUI | 3.98 | 3.39 | 4.38 | 4.08 | 4.19 | 4.72 |
Disclaimer/Publisher’s Note: The statements, opinions and data contained in all publications are solely those of the individual author(s) and contributor(s) and not of MDPI and/or the editor(s). MDPI and/or the editor(s) disclaim responsibility for any injury to people or property resulting from any ideas, methods, instructions or products referred to in the content. |
© 2025 by the authors. Licensee MDPI, Basel, Switzerland. This article is an open access article distributed under the terms and conditions of the Creative Commons Attribution (CC BY) license (https://creativecommons.org/licenses/by/4.0/).
Share and Cite
Lu, Y.; Li, T. An AI Hybrid Building Energy Benchmarking Framework Across Two Time Scales. Information 2025, 16, 964. https://doi.org/10.3390/info16110964
Lu Y, Li T. An AI Hybrid Building Energy Benchmarking Framework Across Two Time Scales. Information. 2025; 16(11):964. https://doi.org/10.3390/info16110964
Chicago/Turabian StyleLu, Yi, and Tian Li. 2025. "An AI Hybrid Building Energy Benchmarking Framework Across Two Time Scales" Information 16, no. 11: 964. https://doi.org/10.3390/info16110964
APA StyleLu, Y., & Li, T. (2025). An AI Hybrid Building Energy Benchmarking Framework Across Two Time Scales. Information, 16(11), 964. https://doi.org/10.3390/info16110964


