Article

Solving the Interdependence of Weighted Shortest Job First Variables by Applying Fuzzy Cognitive Mapping

by
Bryan Nagib Zambrano Manzur
1,2,*,
Fabián Andrés Espinoza Bazán
2,3,
Yamilis Fernandez
4 and
Carlos Cruz Corona
1
1
Department Computer Sciences and Artificial Intelligence (CITIC-UGR), University of Granada, 18071 Granada, Spain
2
ESPAE Graduate School of Management, Escuela Superior Politécnica del Litoral, University of Guayaquil, Guayaquil 090306, Ecuador
3
Faculty of Mathematical and Physical Sciences, University of Guayaquil, Guayaquil 090514, Ecuador
4
Information Technology Department, University of Informatics Sciences, Havana 10800, Cuba
*
Author to whom correspondence should be addressed.
Information 2025, 16(11), 944; https://doi.org/10.3390/info16110944 (registering DOI)
Submission received: 3 October 2025 / Revised: 21 October 2025 / Accepted: 23 October 2025 / Published: 30 October 2025
(This article belongs to the Topic Fuzzy Optimization and Decision Making)

Abstract

In agile, adaptive, and hybrid project management, the Weighted Shortest Job First (WSJF) technique is increasingly being used to prioritize the most relevant business opportunities for organizations. However, this decision-making process often involves the evaluation of multiple interconnected factors whose interactions can influence outcomes in unforeseen ways. Traditional decision-making models tend to assume independence between variables for the sake of simplicity and tractability. In real-world contexts, however, variables rarely operate in isolation; their interdependence introduces complexities that challenge the validity, robustness, and practical applicability of conventional decision-making tools. The objective of this research is to address the problem of interdependence among WSJF variables. To achieve this, Fuzzy Cognitive Mapping (FCM) was applied to evaluate the impact and influence of interdependencies during the decision-making process. The findings demonstrate that incorporating FCM into WSJF yields a 76% correlation in prioritization order with the best outcomes, compared to linear WSJF, while revealing a 24% variation that highlights areas for further study. This evidence indicates that accounting for interdependence leads to more efficient and reliable decision-making than traditional approaches.

1. Introduction

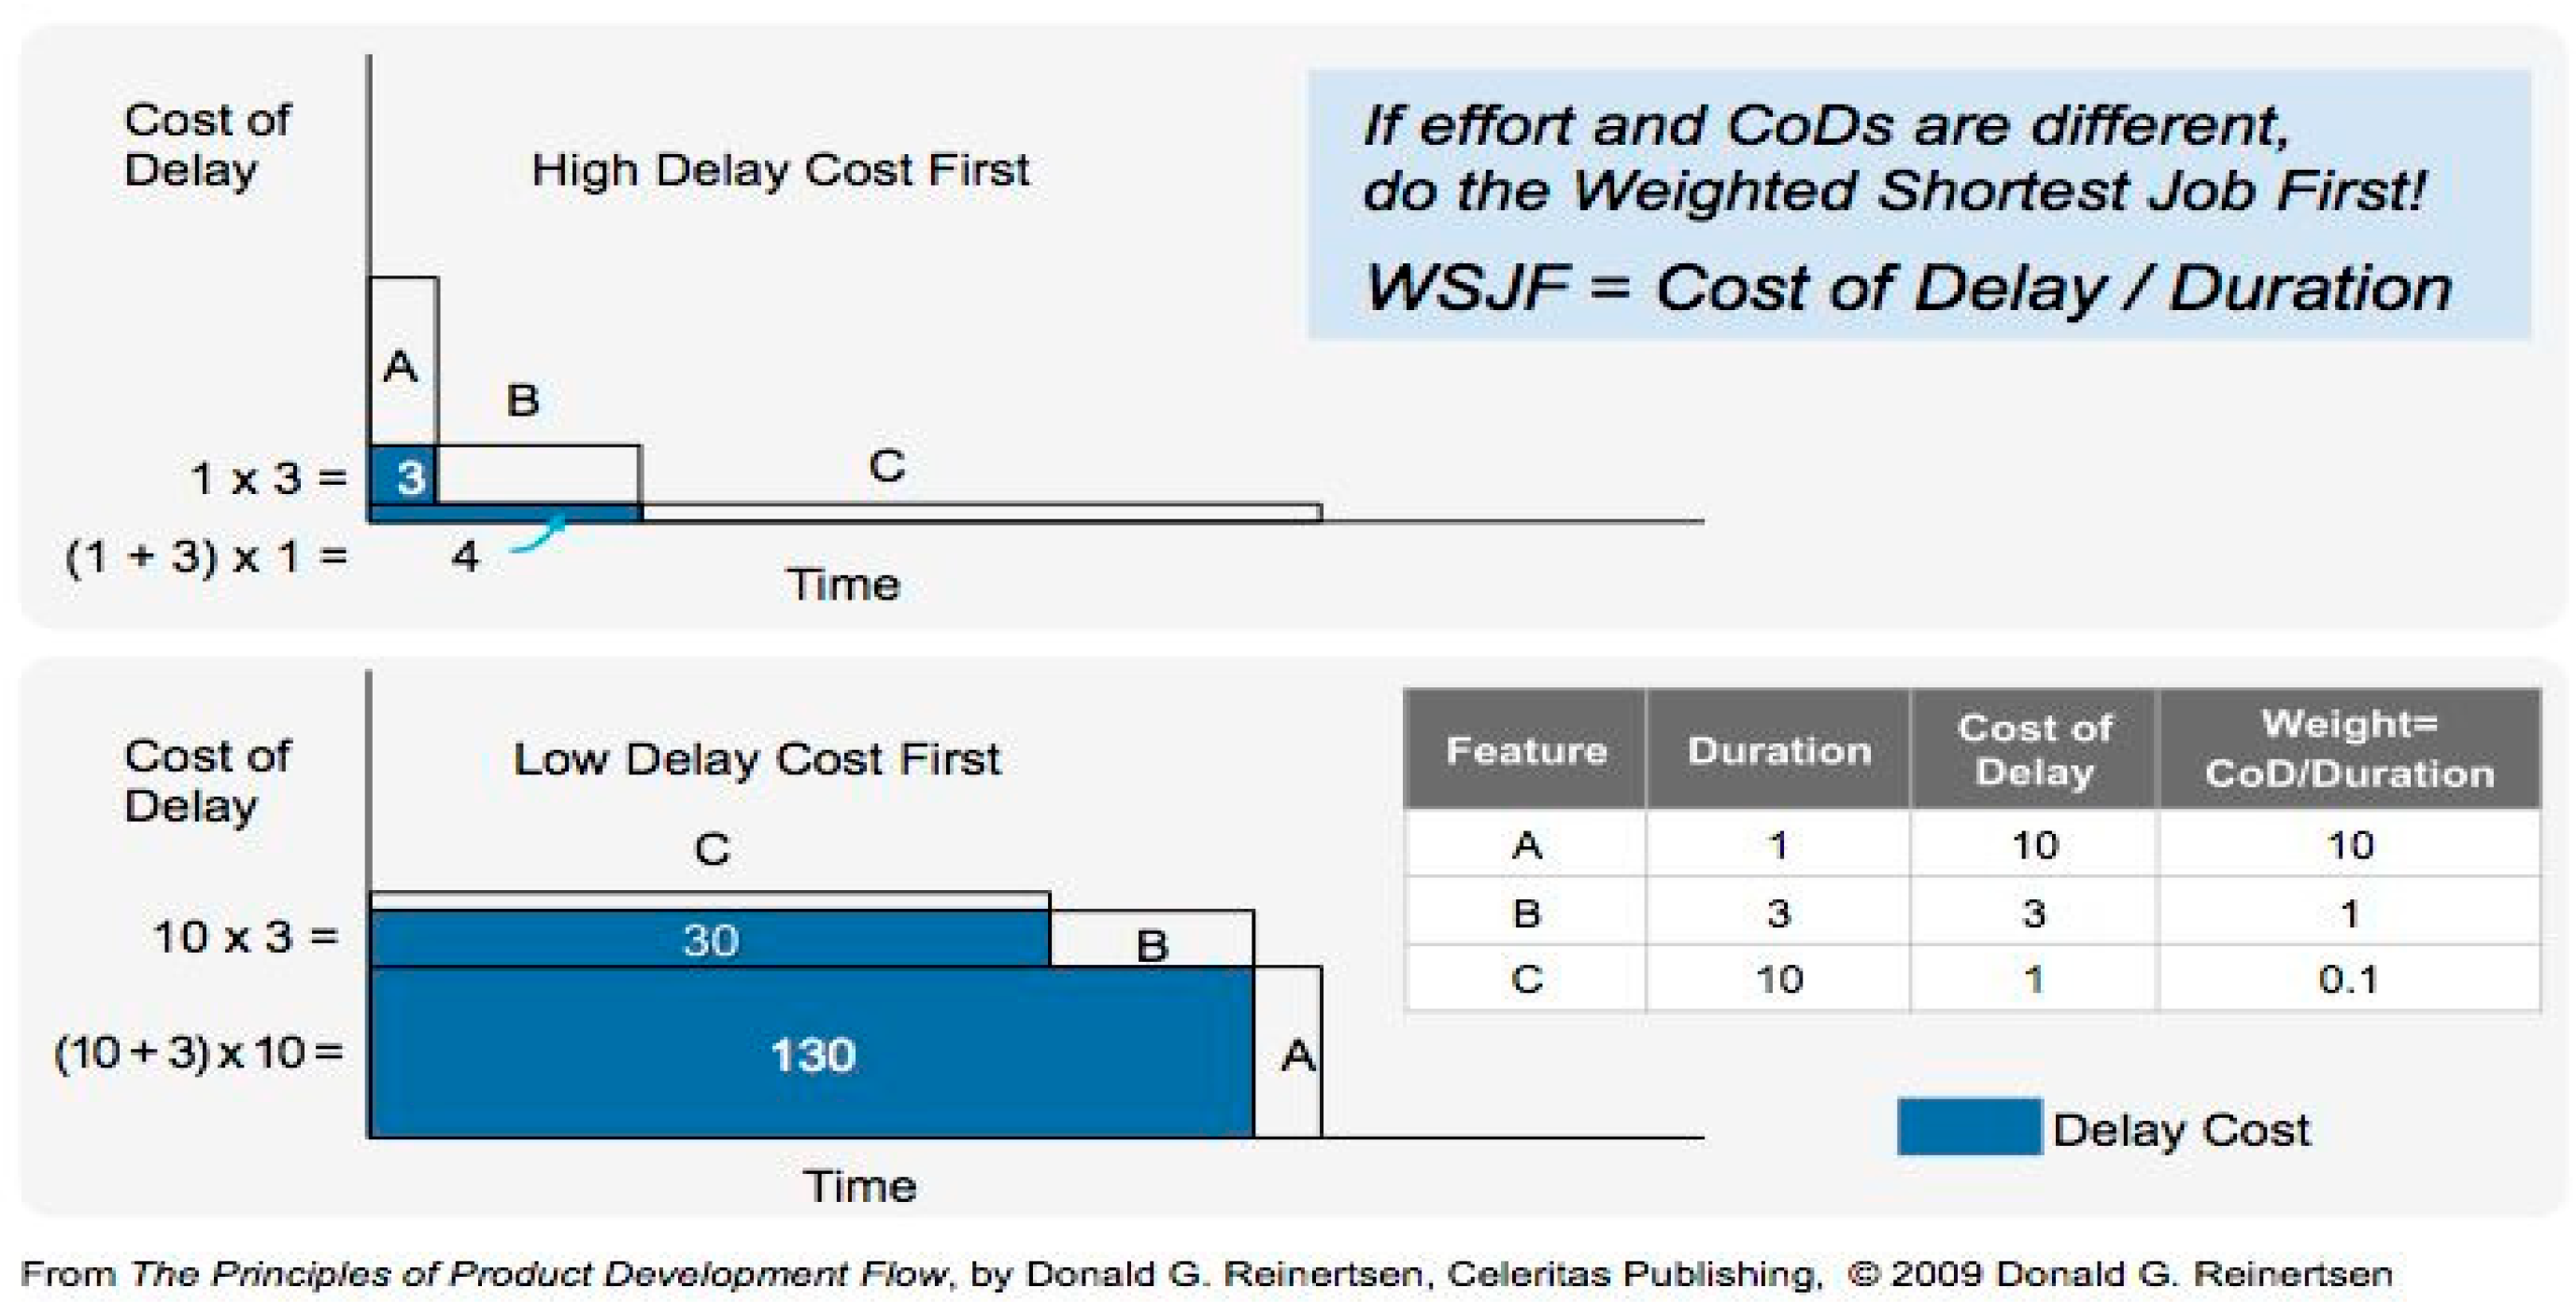
Currently, digital innovation and transformation are some of the main pillars of organizations seeking to develop new products, services, or business models using agile project approaches. In this context, the decision-making process in volatile, uncertain, complex, and ambiguous (VUCA) environments, as described by [1], involves the use of prioritization techniques such as Weighted Shortest Job First (WSJF) by [2], as shown in Figure 1. The WSJF model is gaining significant importance today because it allows alternatives to be prioritized based on the greatest business value and the least effort. Leading global organizations such as the LEGO Group (Billund, Denmark), AT&T (Dallas, TX, USA), Cisco (San Jose, CA, USA), and Fitbit (San Francisco, CA, USA) have adopted this technique as part of their decision-making processes.
WSJF can be theoretically outlined as a multi-criteria decision-making (MCDM) technique [3], where multiple evaluation criteria—user business value, time criticality, risk reduction, and job size—are assessed to determine priority. Additionally, WSJF involves multiple decision-makers, aligning with the wisdom of crowds theory [2], which advances that collective judgment can improve decision quality under uncertainty.
The WSJF prioritization formula calculates the Cost of Delay (CoD) as the sum of user business value, time criticality, and risk reduction, divided by job size. This ratio guides decision-makers to select alternatives that deliver the highest value in the shortest time, optimizing resource allocation [4]. Although there is no statistical data on the percentage of use of WSJF, the Pulse of the Profession Report [5] notes that more than 65% of organizations today are using agile or hybrid approaches and therefore may be applying WSJF.
However, a key limitation persists: WSJF is applied in a linear manner, where each variable is considered independently, and interactions among variables are not formally accounted for. Prior approaches have emphasized the relative importance of individual factors but have not provided mechanisms to model causal feedback loops, nonlinear dependencies, or dynamic changes in relationships over time. As a result, traditional WSJF does not capture the complexity of decision-making in VUCA environments, where the influence of one criterion (e.g., risk reduction) can significantly alter the interpretation of another (e.g., business value).
This gap is critical because it restricts WSJF’s ability to reflect real-world decision dynamics. Addressing this, Fuzzy Cognitive Maps (FCMs) [6,7] have emerged as a valuable tool for modeling and analyzing complex systems [8]. Unlike linear models, FCMs allow for the representation of fuzzy and nonlinear causal relationships, capturing interdependencies and feedback effects between variables. Their ability to incorporate degrees of influence, uncertainty, and dynamic adjustment makes them particularly suitable for decision-making problems in agile project management. Recent studies demonstrate the effectiveness of FCMs in diverse fields—from social systems and neural networks to gene regulatory modeling [9,10,11]—underscoring their robustness for contexts characterized by complexity and uncertainty.
Therefore, this research directly addresses the identified gap by applying FCM to WSJF, creating a decision-making model that explicitly captures variable interdependence. By integrating fuzzy logic, linguistic modeling, and cognitive mapping, the proposed model moves beyond the traditional independent-variable assumption of WSJF and provides a more dynamic, responsive, and theoretically grounded framework for prioritization in complex environments.
The use of these tools allows for diverse applications ranging from the simulation of social systems to the prediction of behavior in neural networks and the generation of probabilistic forecasts such as those carried out in research studies with fuzzy time series as proposed by [12,13]. The application of FCMs has even extended to the field of gene regulatory networks, where they have been used to infer models from gene expression data, as investigated by [9], highlighting their ability to model complex interactions within biological systems. On the other hand, [10] demonstrated the effectiveness of FCMs combined with evolutionary algorithms in reconstructing gene regulatory networks, highlighting the potential of FCMs in managing complex and interdependent variables.
Similarly, [11] explored the scalability of FCMs using a hybrid approach combining memetic algorithms and neural networks, providing a robust framework for learning large-scale cognitive maps, which can be particularly beneficial in the WSJF context, and other authors such as [14] present an innovative approach to improve the adaptability and learning efficiency of FCMs in dynamic environments.
Ref. [15]’s research shows how the combination of hybrid learning with evolutionary optimization opens new possibilities to improve the robustness and interpretability of FCM-based decision models as also supported by [11,16,17]. All these advances cited above are particularly relevant in the context of decision making using WSJF, where accuracy and adaptability are crucial for success. Another interesting example of the use of FCM is the multi-criteria evaluation model for software quality based on soft computing techniques, such as fuzzy logic and Fuzzy Cognitive Maps, which manage heterogeneous, imprecise, and uncertain data from various sources [18].
In the decision-making process, the use of FCM to analyze the interdependence of variables in WSJF offers a novel perspective, because it allows to explicitly model how changes in one variable can affect others, which offers decision makers to better anticipate the results of their actions, so that these practices have already been implemented in virtual or digital worlds, as explained by [19].
The Weighted Shortest Job First (WSJF) method remains one of the most adopted prioritization techniques in Agile frameworks, particularly within the Scaled Agile Framework (SAFe), due to its balance between value delivery and cost of delay. However, as organizations evolve toward hybrid and adaptive project environments, the linear and independent assumption of WSJF variables becomes a significant limitation. Real-world prioritization scenarios involve interdependent and dynamic variables—such as business value, risk reduction, and job duration—that influence each other nonlinearly.
To address this limitation, this research introduces an enhanced WSJF approach using Fuzzy Cognitive Mapping (FCM). FCM enables the modeling of causal interdependencies between WSJF criteria through fuzzy logic and directed graphs, allowing for the representation of uncertainty, feedback loops, and variable influence strengths. Unlike traditional linear or AHP-based methods, FCM captures systemic interactions without requiring large datasets or rigid hierarchies, making it suitable for agile and uncertain environments.
This research contributes by developing a decision-making model that applies FCM to WSJF, improving the prioritization of alternatives compared to conventional WSJF methods. By leveraging fuzzy logic, fuzzy linguistic modeling, and FCM, the proposed model addresses the theoretical gap in WSJF’s treatment of variable interdependence and uncertainty. This approach offers a more dynamic, responsive, and theoretically grounded framework for project prioritization in complex, uncertain environments.
The article has been structured in five main sections. Section 1 presents an introduction and the relevance and objective of the study. Section 2 reviews the existing literature to position the research within the academic field, making a comparative analysis of related studies. Section 3 describes modeling interdependencies with Fuzzy Cognitive Maps. Section 4 presents a case study of the proposed model with its Model, Assessment Method, and Case Study Results applying FCM to the WSJF prioritization technique. Finally, Section 5 includes the main discussions, conclusions, and key findings of the article.

2. Related Works

Although there is no literature related to studies or research on decision-making optimization using WSJF with Fuzzy Cognitive Maps, articles have been found that address the problem independently, that is, some address the problem of prioritization in decision-making with a particular technique and others the application of Fuzzy Cognitive Maps in decision-making without using any prioritization technique.
Authors such as [20,21] have developed research on the application of the WSJF prioritization technique in the field of technology and the impact it produces to mitigate adverse effects of low performance in computing systems, as well as the prevention of poor estimates on the size of the calculated work that affects the performance of the systems.
Other research has been conducted on prioritization in decision making, such as that of [22] which presents how, from the user’s perspective, business options are prioritized in the field of technology (Internet of Things—IoT) by applying the MoSCoW prioritization technique. On the other hand, refs. [23,24] developed their research on prioritization using the Kano model technique applied to the fields of health and education, respectively, which is a significant reference that it is feasible to apply FCM on prioritization techniques, as in this case WSJF (for further details, see Table 1).
Addressing the application of FCM for the decision-making process, it has been found that [25] have investigated how the use of FCM in decision-making support in the field of medicine significantly improves accuracy and efficiency when making diagnoses, executing treatments, or identifying symptoms, which represents an important advance in the medical area.
Ref. [16] suggest that the integration of fuzzy logic and multi-criteria decision-making techniques can be combined to handle the complexity; their research discusses various approaches, including fuzzy AHP, fuzzy TOPSIS, fuzzy inference systems, and hierarchical aggregation models that combine expert judgments with objective metrics.
On the other hand, authors such as [26] have proposed the use of FCMs to model the interdependence of various factors that affect risks in complex systems, such as technology, human behavior, and external conditions. Other research by [4] addresses how FCMs help improve decision making in dynamic environments, where rapid changes and complex relationships between variables make prediction and analysis difficult. Finally, ref. [3] highlights how FCMs are used in collaborative processes that allow representing the vision of multiple stakeholders and managing uncertainty and conflicts of interest in the decision-making process.
From another perspective, ref. [19] presents advanced methodologies for evaluating software usability through the integration of fuzzy logic, Fuzzy Cognitive Maps (FCMs), and interdependence matrices. This novel approach captures the influence and interrelations among sub-criteria and incorporates constraints on essential factors to produce a comprehensive usability index. As illustrated in Table 2, a general summary of the works related to prioritization using the WSJF technique with FCM is presented, and as can be observed, there is no previous scientific literature that comprehensively addresses the problem. Although these studies contribute significantly to the research field, there is still a gap in the literature regarding the explicit integration of FCMs into decision-making processes, especially through the application of WSJF.
FCMs are presented as a highly efficient option to help mitigate the problem of decision-making in highly uncertain environments, because they allow us to identify the interdependence in their models and the influence between their nodes, as well as the impact that occurs because of the relationship. Ref. [7] introduced a comprehensive approach that integrates multiple metrics and criteria through Fuzzy Cognitive Maps (FCMs), allowing for the modeling of interdependencies and expert opinions.
While WSJF operates without considering the dependencies of its variables, there are techniques that allow working with nonlinear models such as ANP [25], which effectively models interdependencies, although it requires extensive pairwise comparisons, which limits scalability in dynamic environments. On the other hand, ELECTRE [27] incorporates uncertainty but lacks the ability to represent feedback loops between criteria. However, FCM improves WSJF by dynamically capturing the causal influence between variables. The study demonstrates that applying FCM to WSJF increases alignment with current business outcomes, as evidenced by a stronger correlation with ultimate revenue performance.

3. Modeling Interdependencies with Fuzzy Cognitive Maps

This section describes the methodology used to analyze the interdependence and influence of WSJF variables on the decision-making process by applying Fuzzy Cognitive Mapping. The research will be developed through the representation of the Fuzzy Cognitive Map, the model’s linguistic labels, and the WSJF Variable Interdependence Mapping.
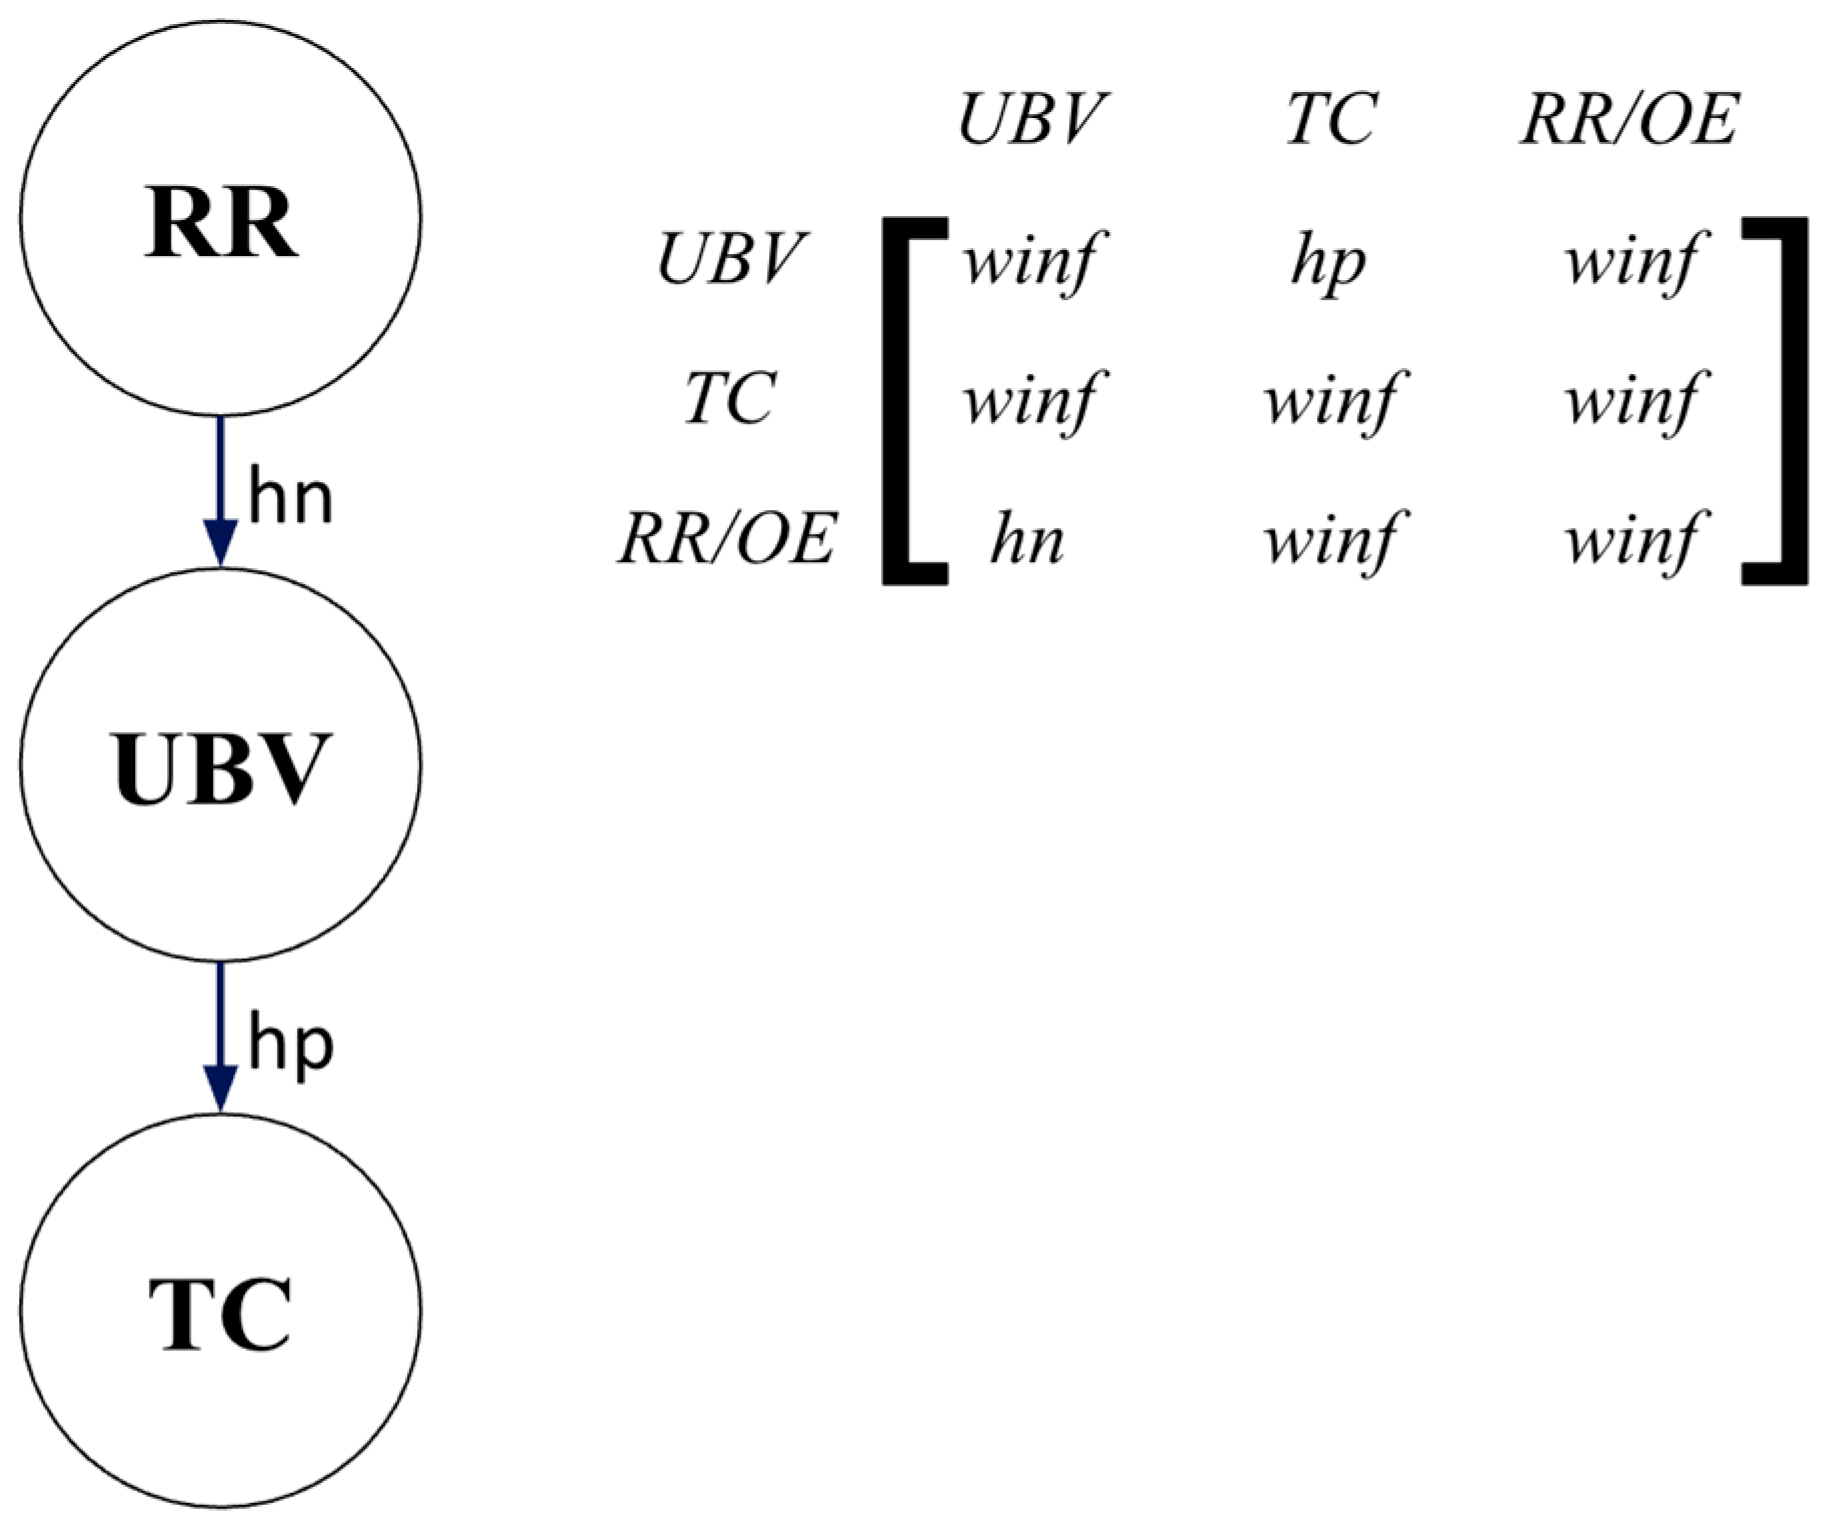
Fuzzy Cognitive Maps (FCMs) are widely used for quantitative modeling. They are based on expert knowledge and experience and consist of a directed fuzzy graph. FCMs are frequently used to represent and model complex interdependencies between variables. For the present research, Figure 2 represents the WSJF FCM, which illustrates the relationship between the nodes of the fuzzy graph, considering the relationships between the variables Business Value to the User (BV), Risk Reduction or Opportunity Enablement (RR), and Critical Time (TC). In this context, the image illustrates the interdependence between the variables RR and UVB with a negative influence and, on the other hand, the interdependence between the variable UBV and TC with a positive influence.
However, to evaluate each variable within the model, it is necessary to define a range of values that represent the impact on each according to the decision-makers’ criteria and it is represented through the Fuzzy Triangular Numbers.
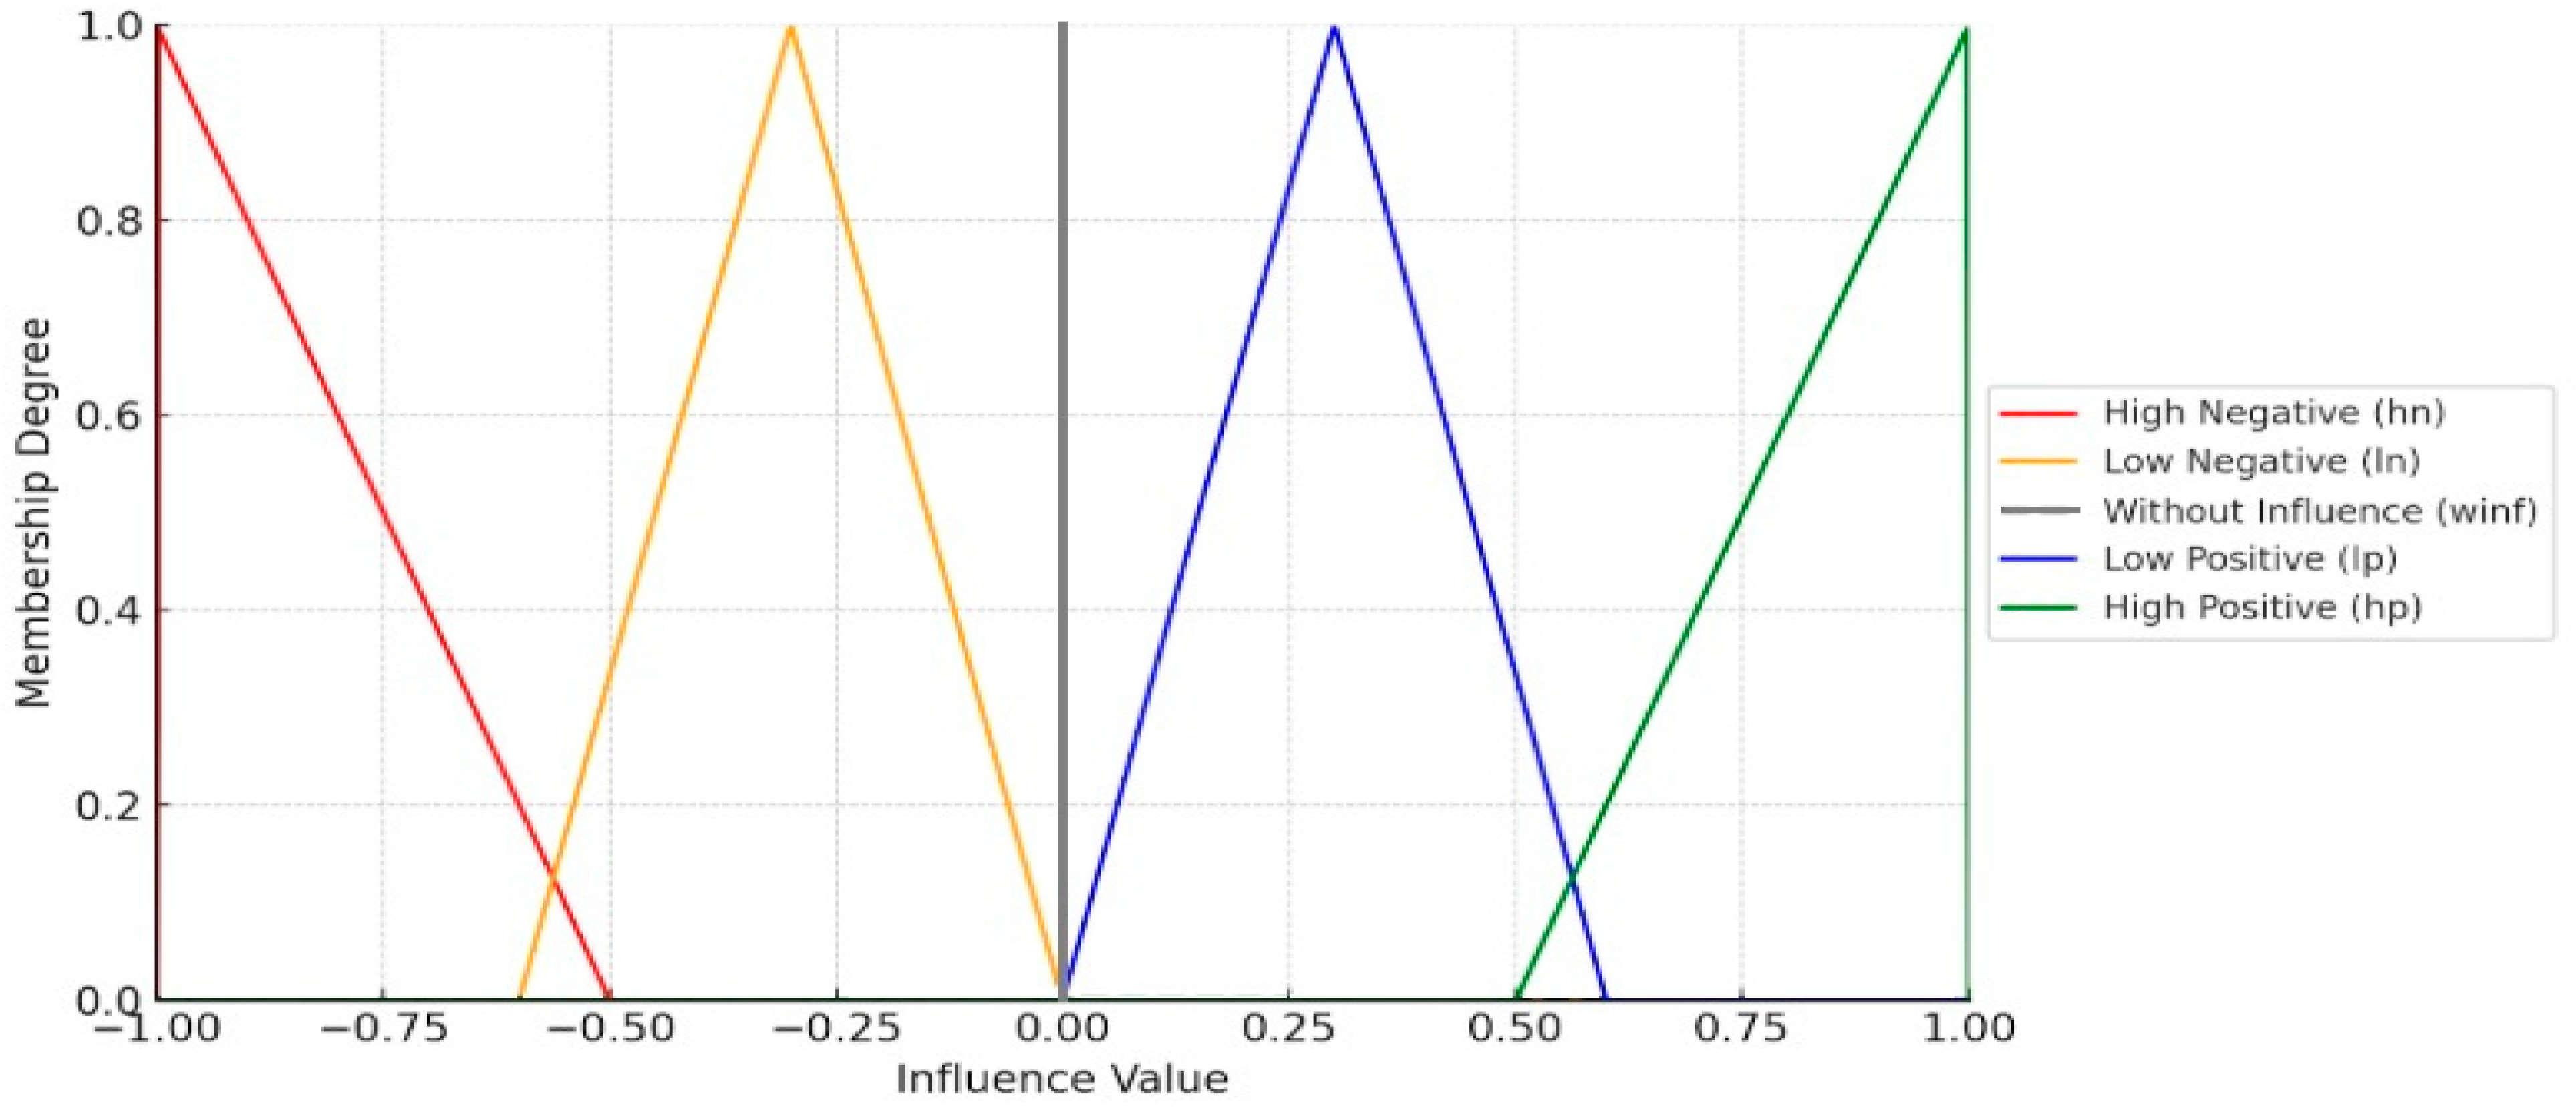
In order to define the BSE series to be used in the model, Table 3 presents the Linguistic Labels that have been defined, i.e., the semantic rule of the model. For greater clarity, the description of their membership range, their membership function and the degree of membership of each linguistic label have been included, taking values in the universe U = [−1, 1] according to the Bucket System Estimation scale and its set of terms T (influence) is:
T   ( influence )   =   { h n , l n , w i n f , l p ,   h p }
Figure 3 shows fuzzy membership functions for the levels of influence that occur between variables, each interval corresponding to a linguistic label that defines the strength of an influence, ranging from High Negative Influence (HN) to High Positive Influence (HP), including a No Influence (WINF) category at zero. The x-axis represents the influence values, ranging from −1 to 1, while the y-axis represents the degree of membership (μ), which indicates how strongly a given value belongs to a particular fuzzy set (ranging from 0 to 1).
On the other hand, Table 4 provides a detailed representation of the interdependencies between the WSJF variables. It achieves this by applying the predefined linguistic labels and their corresponding membership functions, which are integral to the model’s framework. Each variable’s membership function helps quantify the relationship between the linguistic labels (e.g., low, medium, high) and their associated numerical values, providing a more nuanced understanding of how these variables interact.
Additionally, the table includes the value scales for each linguistic label, which are used to determine the degree to which each variable aligns with a particular label. This scale allows for a consistent application of the model across different contexts and projects. It is important to note that the Job Size variable is excluded from this analysis, as it is considered an independent variable that does not directly interact with the other variables in the matrix. This exclusion helps to focus the analysis on the interdependence among the remaining variables, such as User Business Value (UBV), Time Criticality (TC), and Risk Reduction (RR).
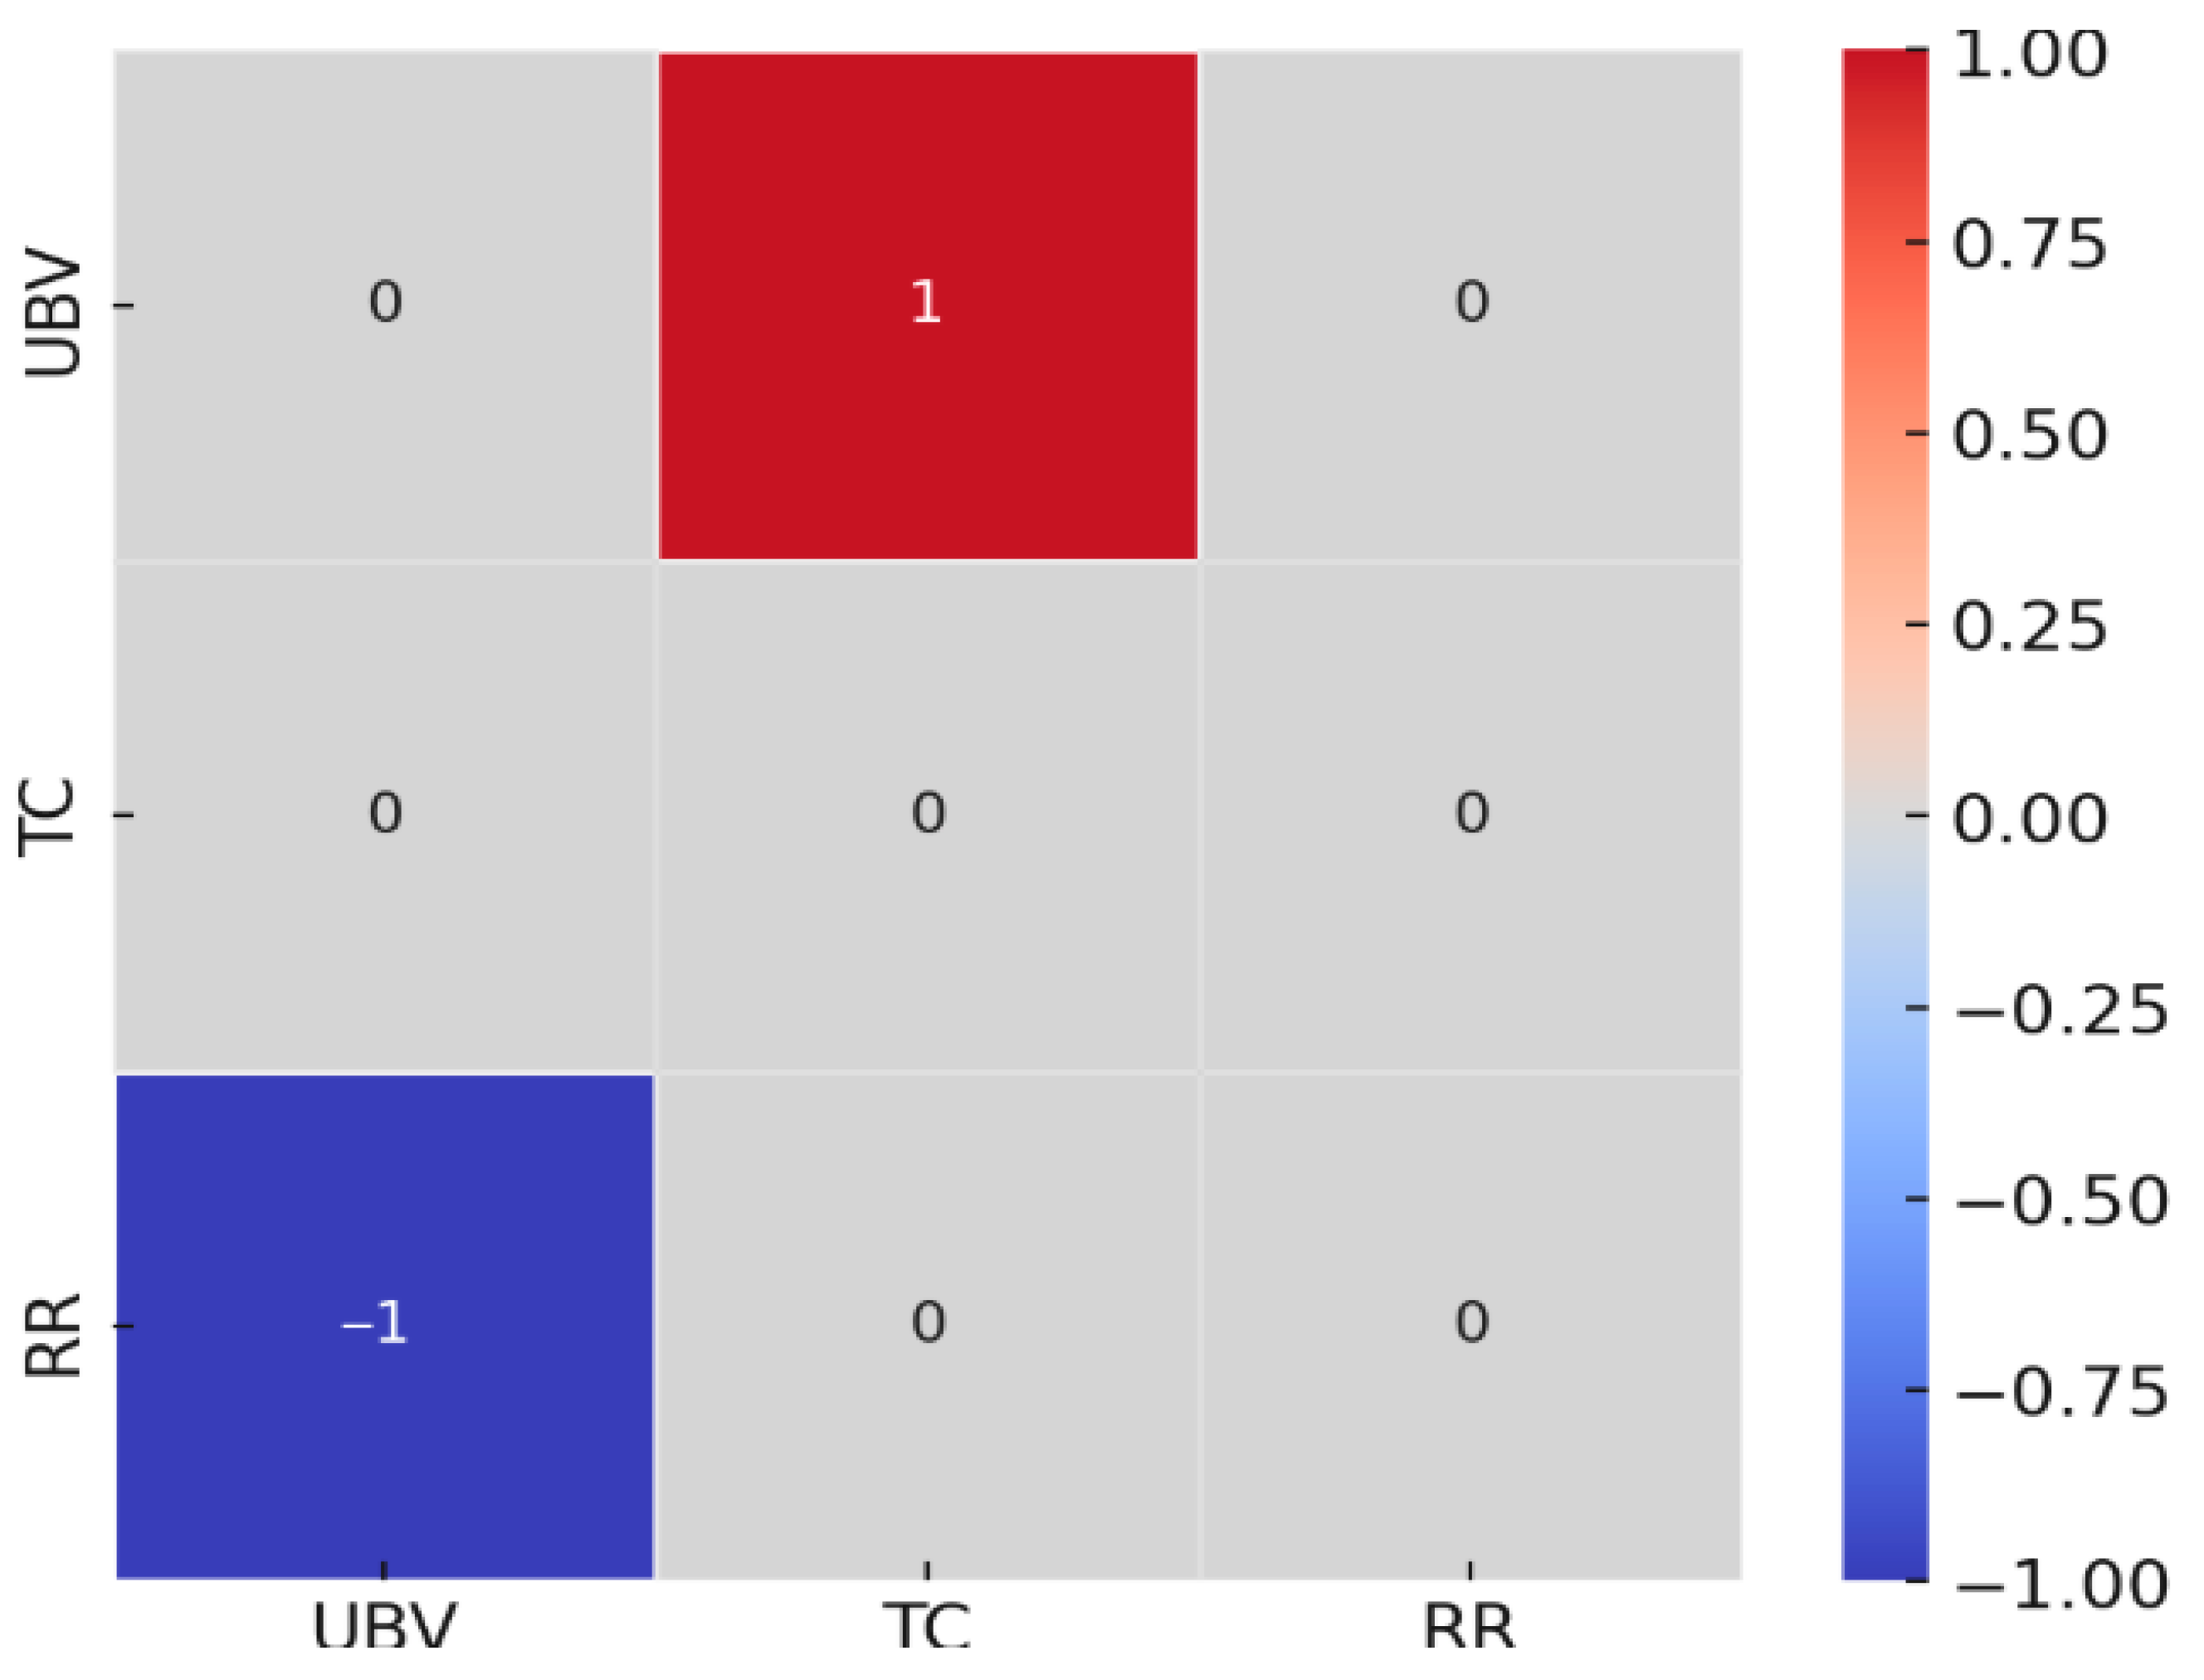
Another way to better illustrate the level of intensity in the dependencies of the WSJF variables is represented in Figure 4, through a heat map, where the level of intensity is expressed by applying the membership functions of the linguistic labels. As can be seen, there is a high level of dependence with a negative influence of high intensity between the variables RR and UBV h n and a high level of dependence between the variables UBV and TCV h p with a positive influence of high intensity.

4. Proposed Model

This section presents the Assessment Method that will be used, the WSJF model and the case study.

4.1. WSJF Model

The model (WSJF model) is represented with a graph defined as:
W S J F   M o d e l =   C ,   A ,   L v ,   L h ,          
where
  • C is the set of criteria. This represents the decision factors or variables that compose the WSJF evaluation. Typical criteria include Business Value, Time Criticality, Risk Reduction, and Job Size. Each criterion contributes to determining the prioritization score of every alternative. In the extended FCM-based model, these criteria are treated as nodes that can influence one another, capturing interdependencies that traditional WSJF ignores.
  • A is the set of alternatives. These are the individual projects, features, or tasks subject to prioritization. Each alternative is evaluated against the defined criteria to calculate its overall WSJF score. The alternatives form the evaluation layer of the graph, where decision-makers compare and select the most valuable initiatives.
  • Lv is the set of vertical links (function of aggregation). Vertical links define how information flows from the criteria layer to the alternative layer. They represent the aggregation functions used to combine multiple criteria into a single prioritization score for each alternative. For example, weighted sums or normalized fuzzy aggregation functions may be used to integrate the influence of all criteria on each alternative.
  • Lh is the set of horizontal links (influence). Horizontal links capture the interdependencies or causal influences among the criteria themselves. These are essential in the FCM-enhanced WSJF model, as they model how a change in one variable (e.g., increasing Business Value) may affect others (e.g., Risk Reduction or Job Size). Lh transforms the static WSJF framework into a dynamic system capable of simulating feedback and mutual influence between decision variables.
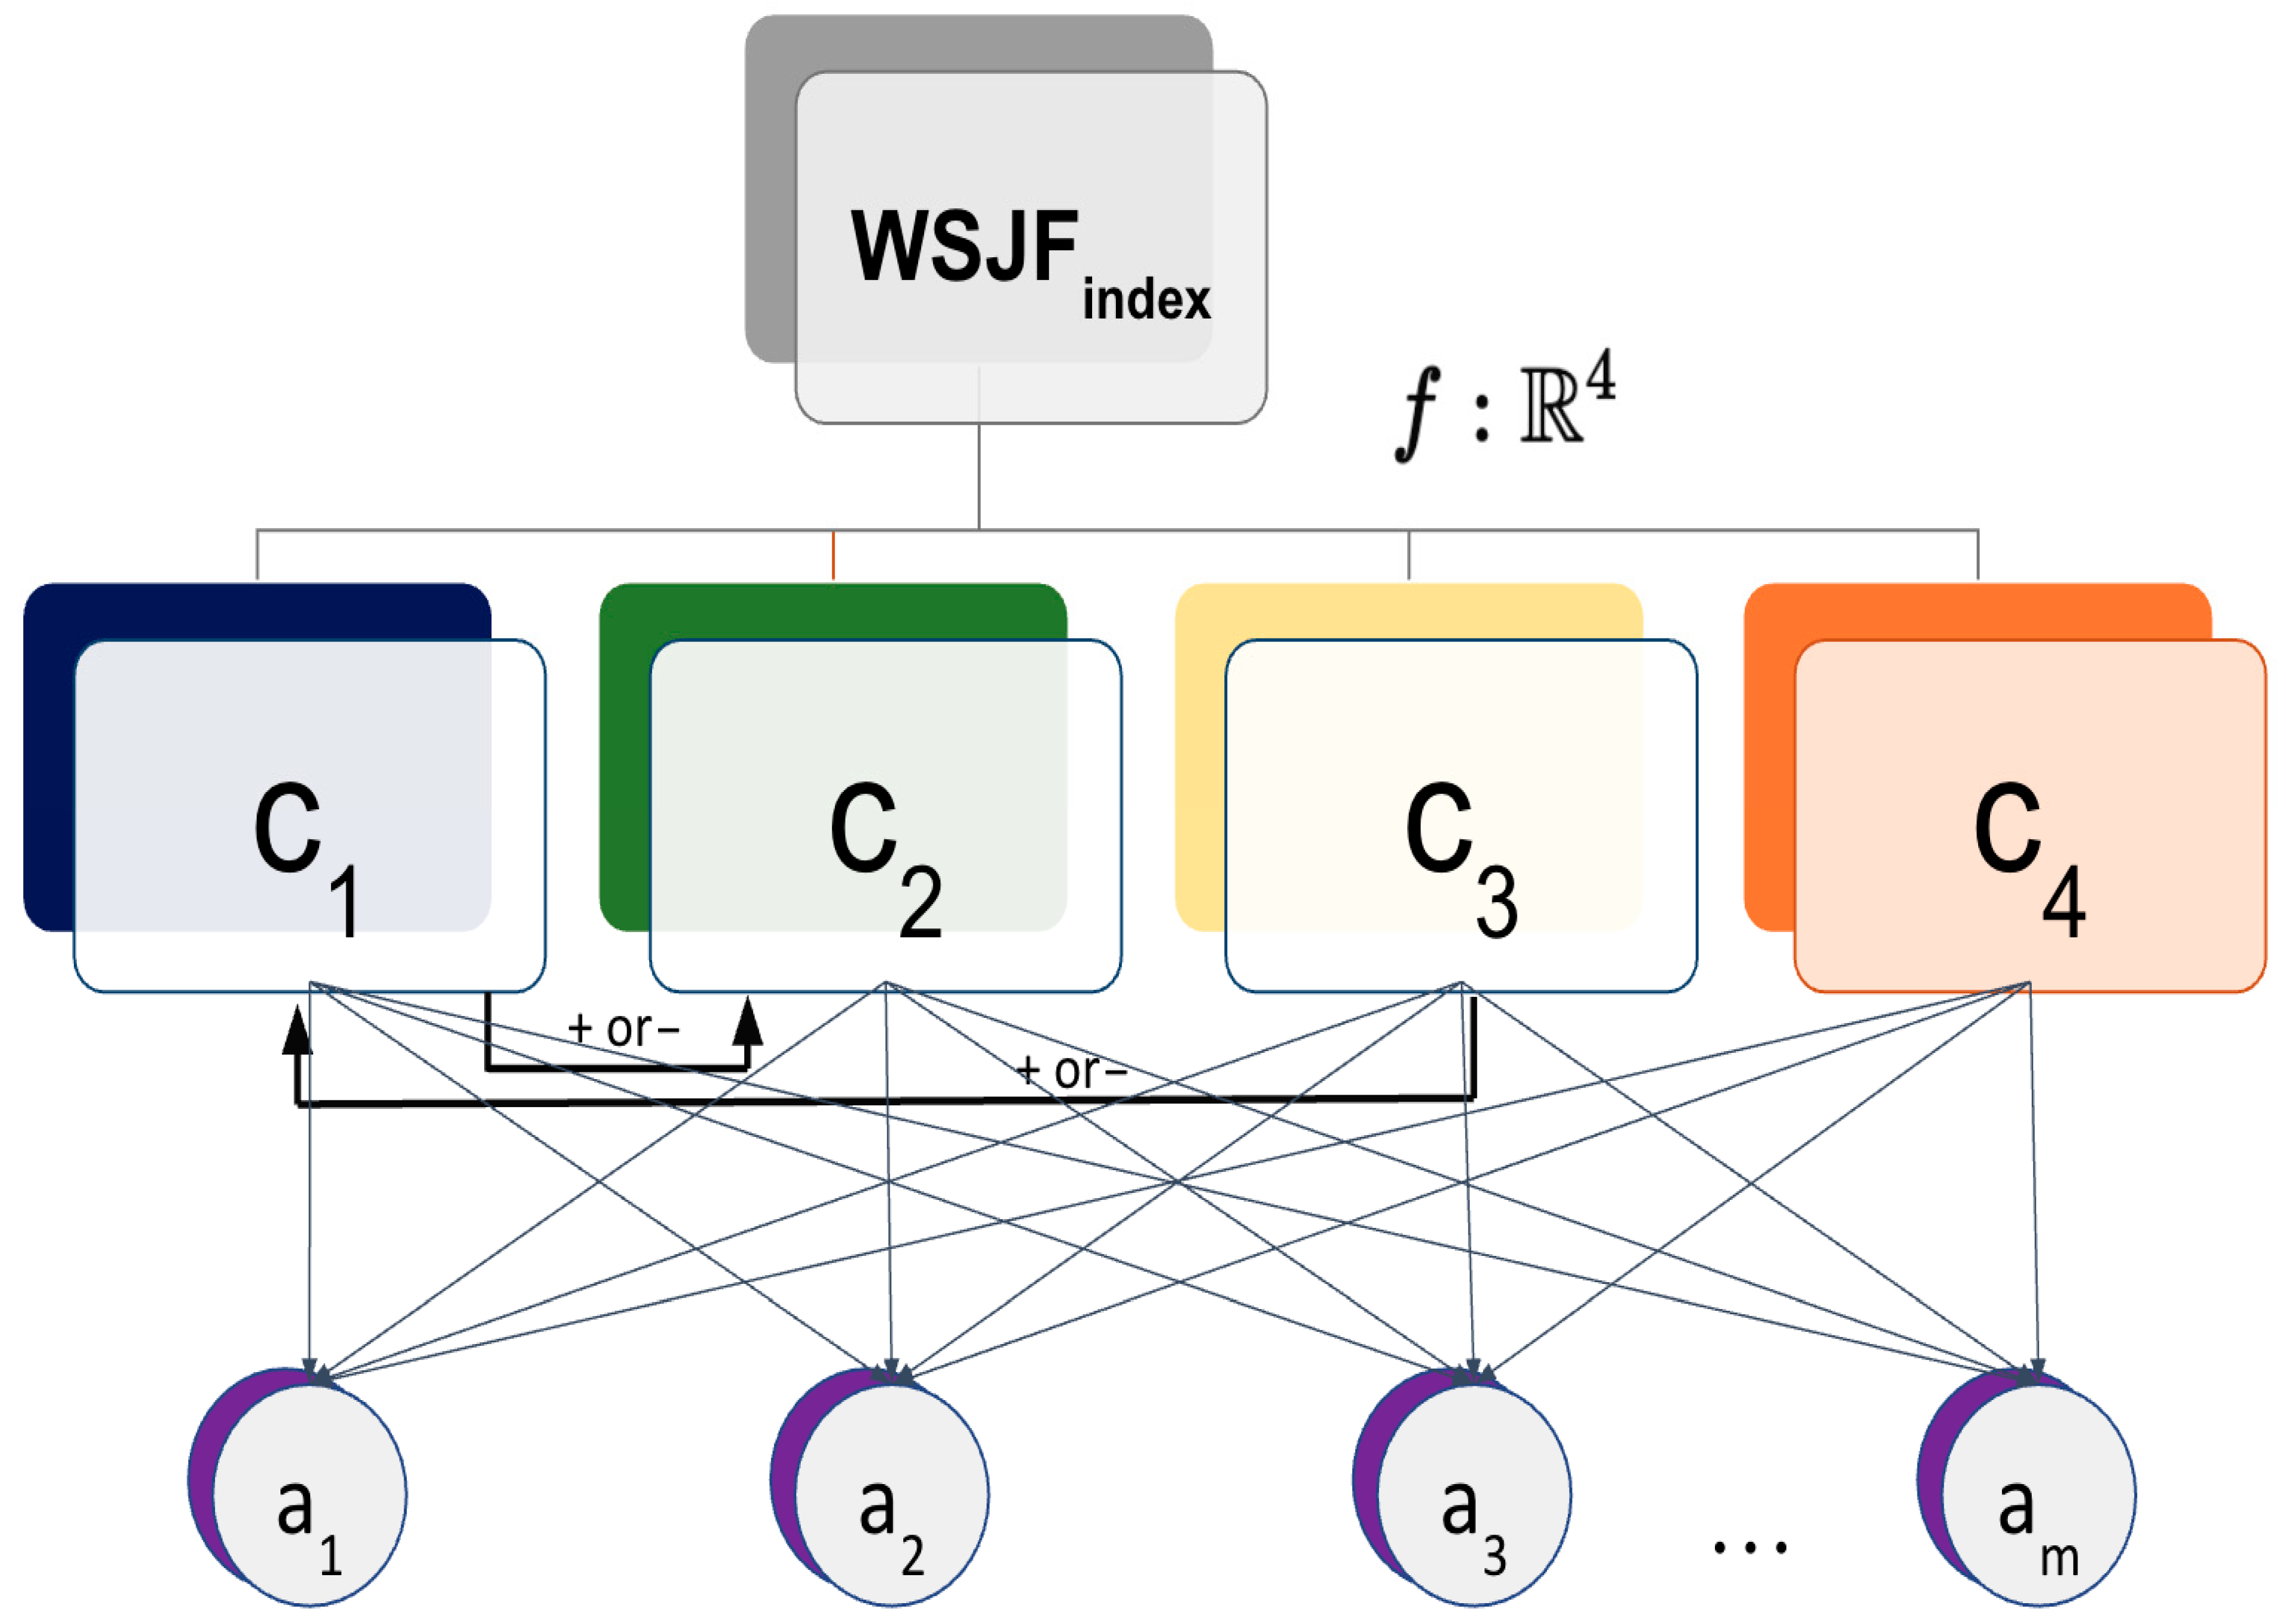
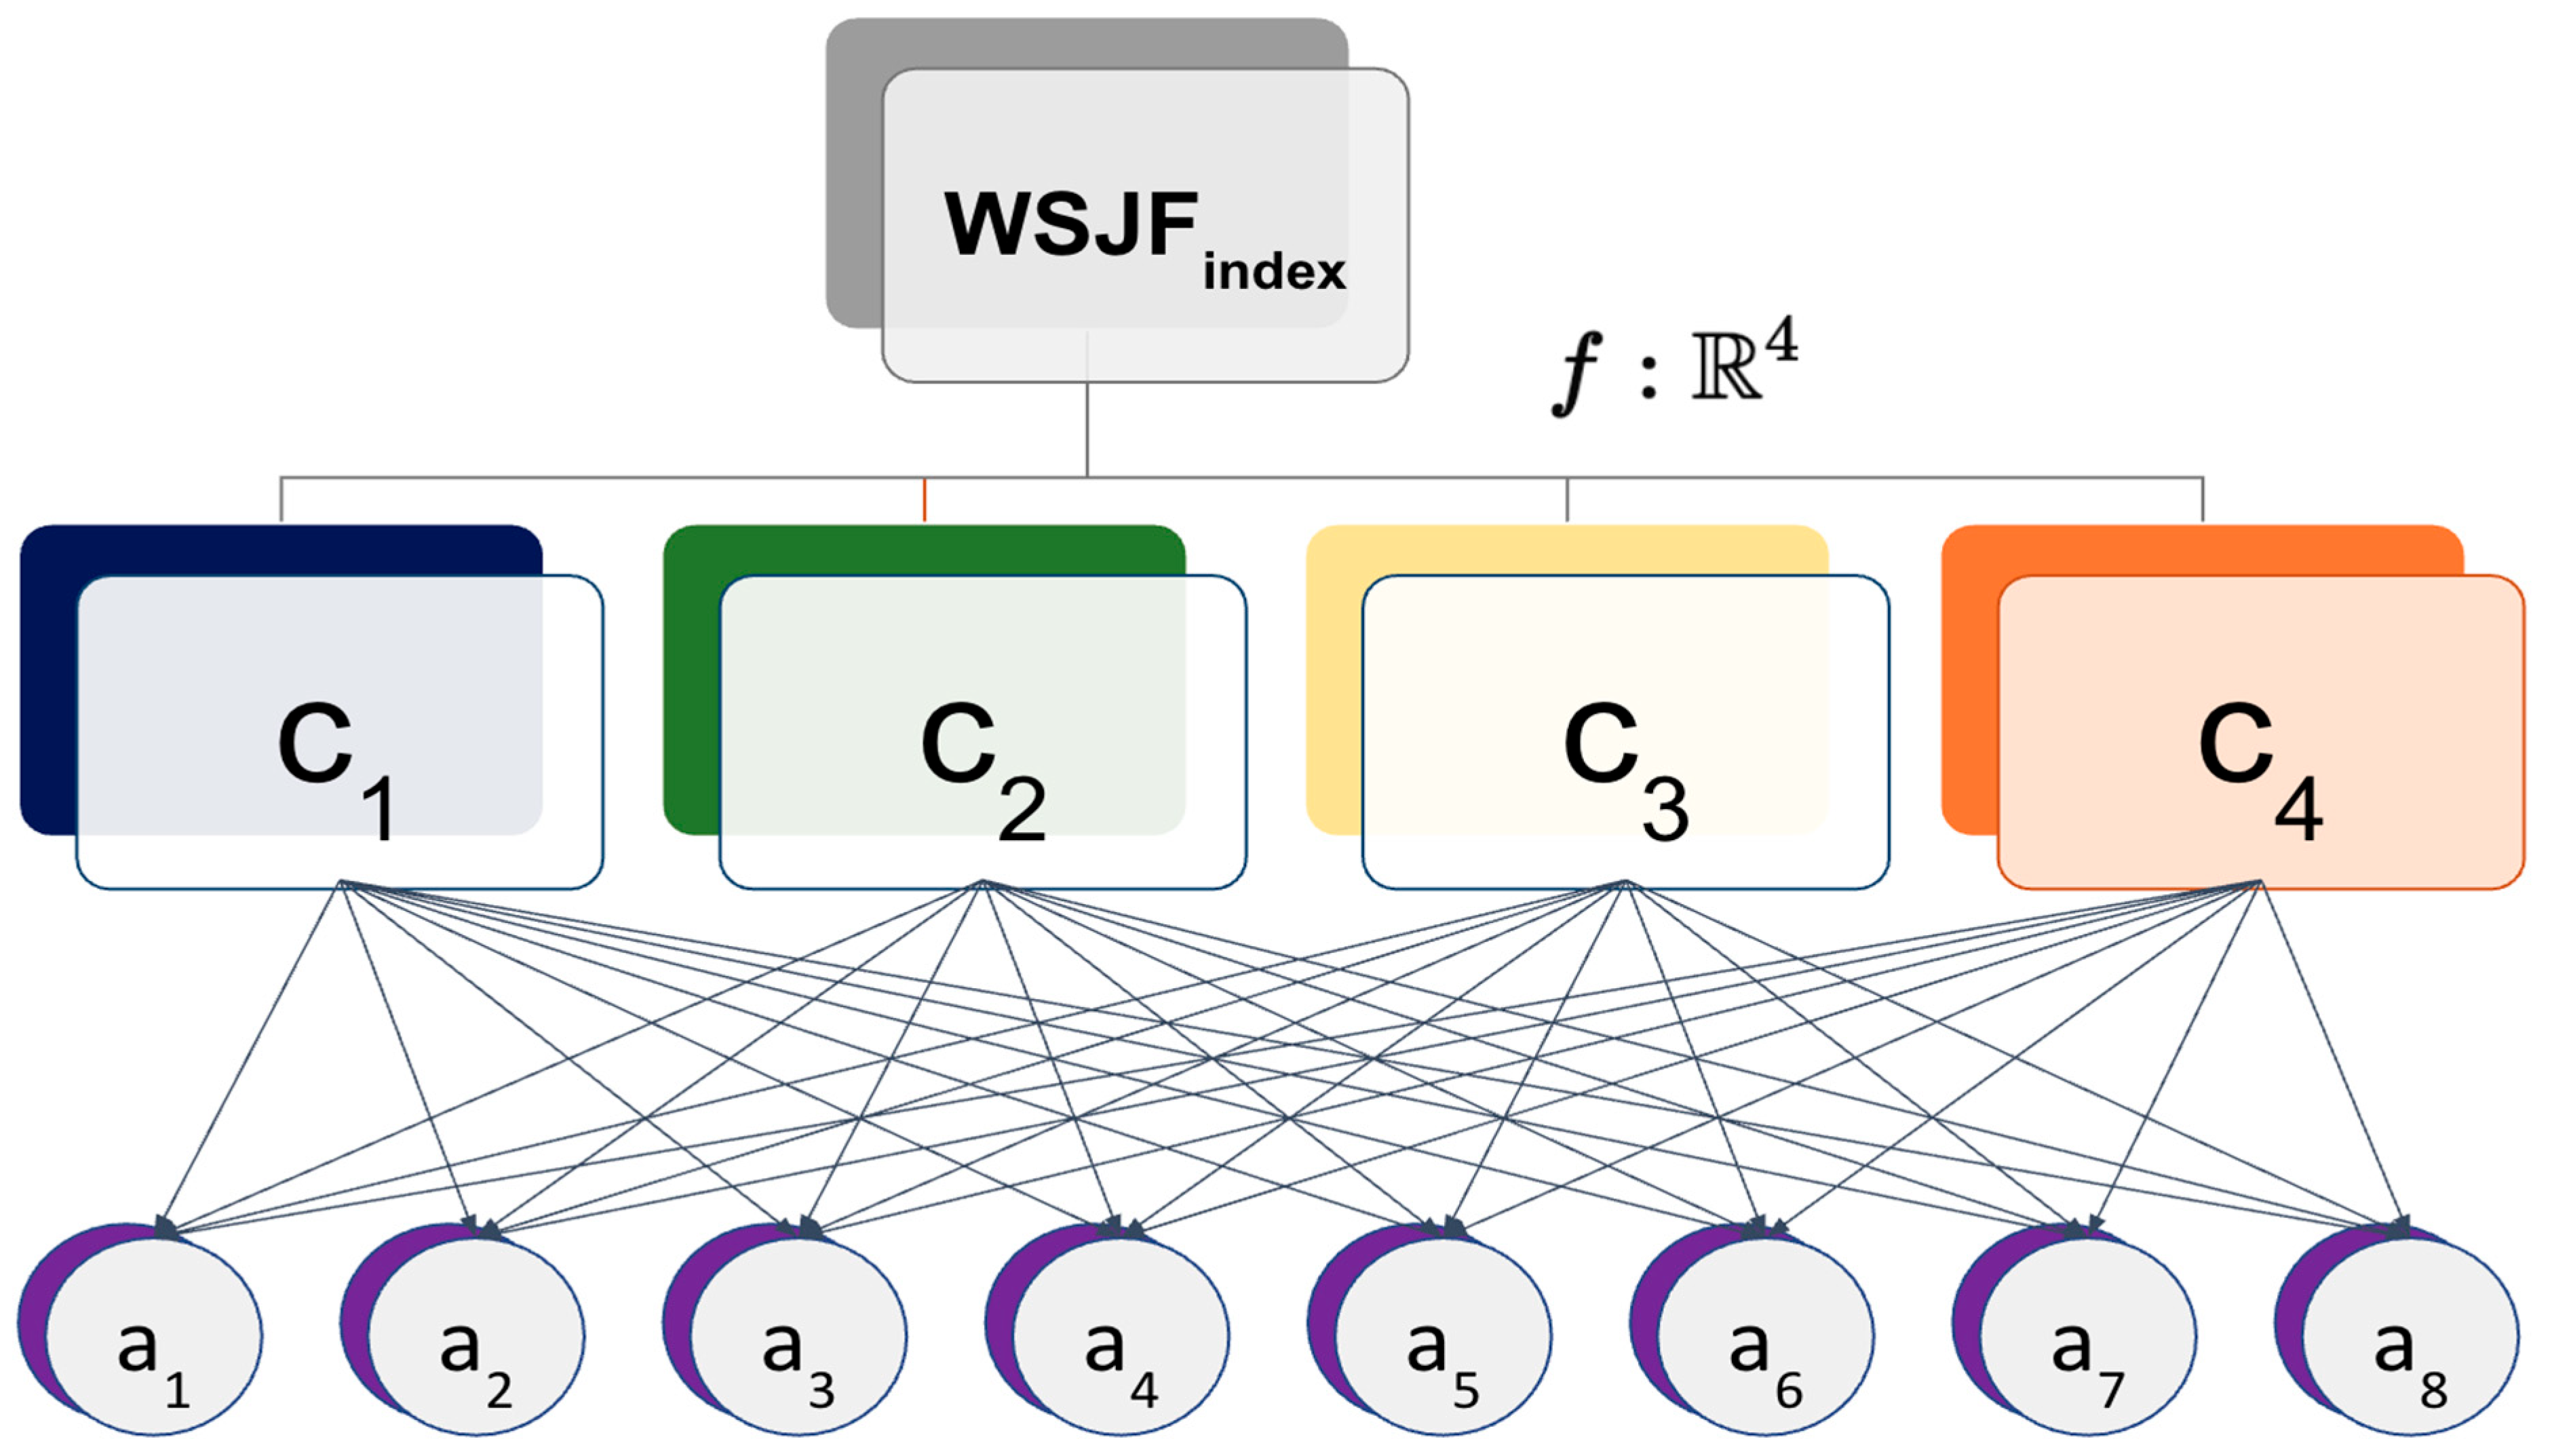
According to the WSJF model presented in Figure 5 and making a relationship with respect to the WSJF prioritization technique, it is important to mention for a better understanding that the criteria that are evaluated are Criterion (C1) represented by the variable User Business Value, Criterion C2 represented by the variable Time Criticality, Criterion C3 represented by the variable Risk Reductions or Opportunity Enablement and finally Criterion C4 represented by the variable Job Size.
In the context of WSJF, the main concepts (nodes) are:
c 1 = User   Business   Value   ( UBV ) ,
c 2 = Time   Criticality   ( TC ) ,
c 3 = Risk   Reduction   ( RR ) ,
and c 4 = Job   Size   ( JS ) .
The WSJF model is developed by three levels: level 0, representing the WSJF index; level 1, the criteria obtained from the experts’ evaluations; and level 2, the set of alternatives to be evaluated. As a summary W S J F i n d e x (Top of diagram):It is the final output of the model, calculated as a function f:Rn→R, which allows it to process multiple input variables and generate a numerical index. At the next level are the different criteria C = c 1 ,   c 2 ,   c 3   , c 4 where n: number of criteria. At the next level are the alternatives that are affected by the criteria are represented by A = a 1 ,   a 2 ,   a 3 ,   , a m where m: number of alternatives.
The vertical links L v , represent arithmetic operation the between criteria to calculate WSFJ index, i.e., W S J F i n d e x = U B V ,   T C ,   R R J S
L h = ( c i ,   c j ,   I i j ) / c i ,   c j C ,   I i j h n ,   l n , w i n f , l p , h p
i j c i ,   c j ,   I i j   L h       c j ,   c i ,   I j i   L h  
The horizontal links L h represent the interdependence between criteria. Each link is presented by a triplet c i ,   c j ,   I i j which means the influence of the criterion c i on the criterion c j with a weight I i j is a linguistic variable, which establishes five labels: high negative (hn), low negative (ln), without influence (winf), low positive (lp) and high positive (hp), defined in the Bucket System Estimation Scale (see Figure 2).
The number of linguistic terms and membership function parameters of the linguistic variable were modeled by human-experts in the context of decision.
The horizontal links are modeled through the Fuzzy Cognitive Maps, discussed in the Section 3. To determine the influence between criteria in the level 1, the FCM is constructed from the information provided by the experts. The relationship between criteria is first analyzed and a FCM is formed. Nodes are criteria and edges represent the influence of one criterion on another.
The resulting FCM is reviewed by each expert and to each edge is associated a value of the variable I i j . The FCM obtained by each expert should be added later, using a technique that allows for consensus. The consensus Fuzzy Cognitive Map (FCMc) is obtained and the adjacency matrix is found. This matrix is called the influence matrix ( I M n x n ).
The evaluation matrix ( M m x n ) is obtained. Subsequently, the relationship between criteria is defined from the information provided by the experts, with the use of FCM (see Figure 2).
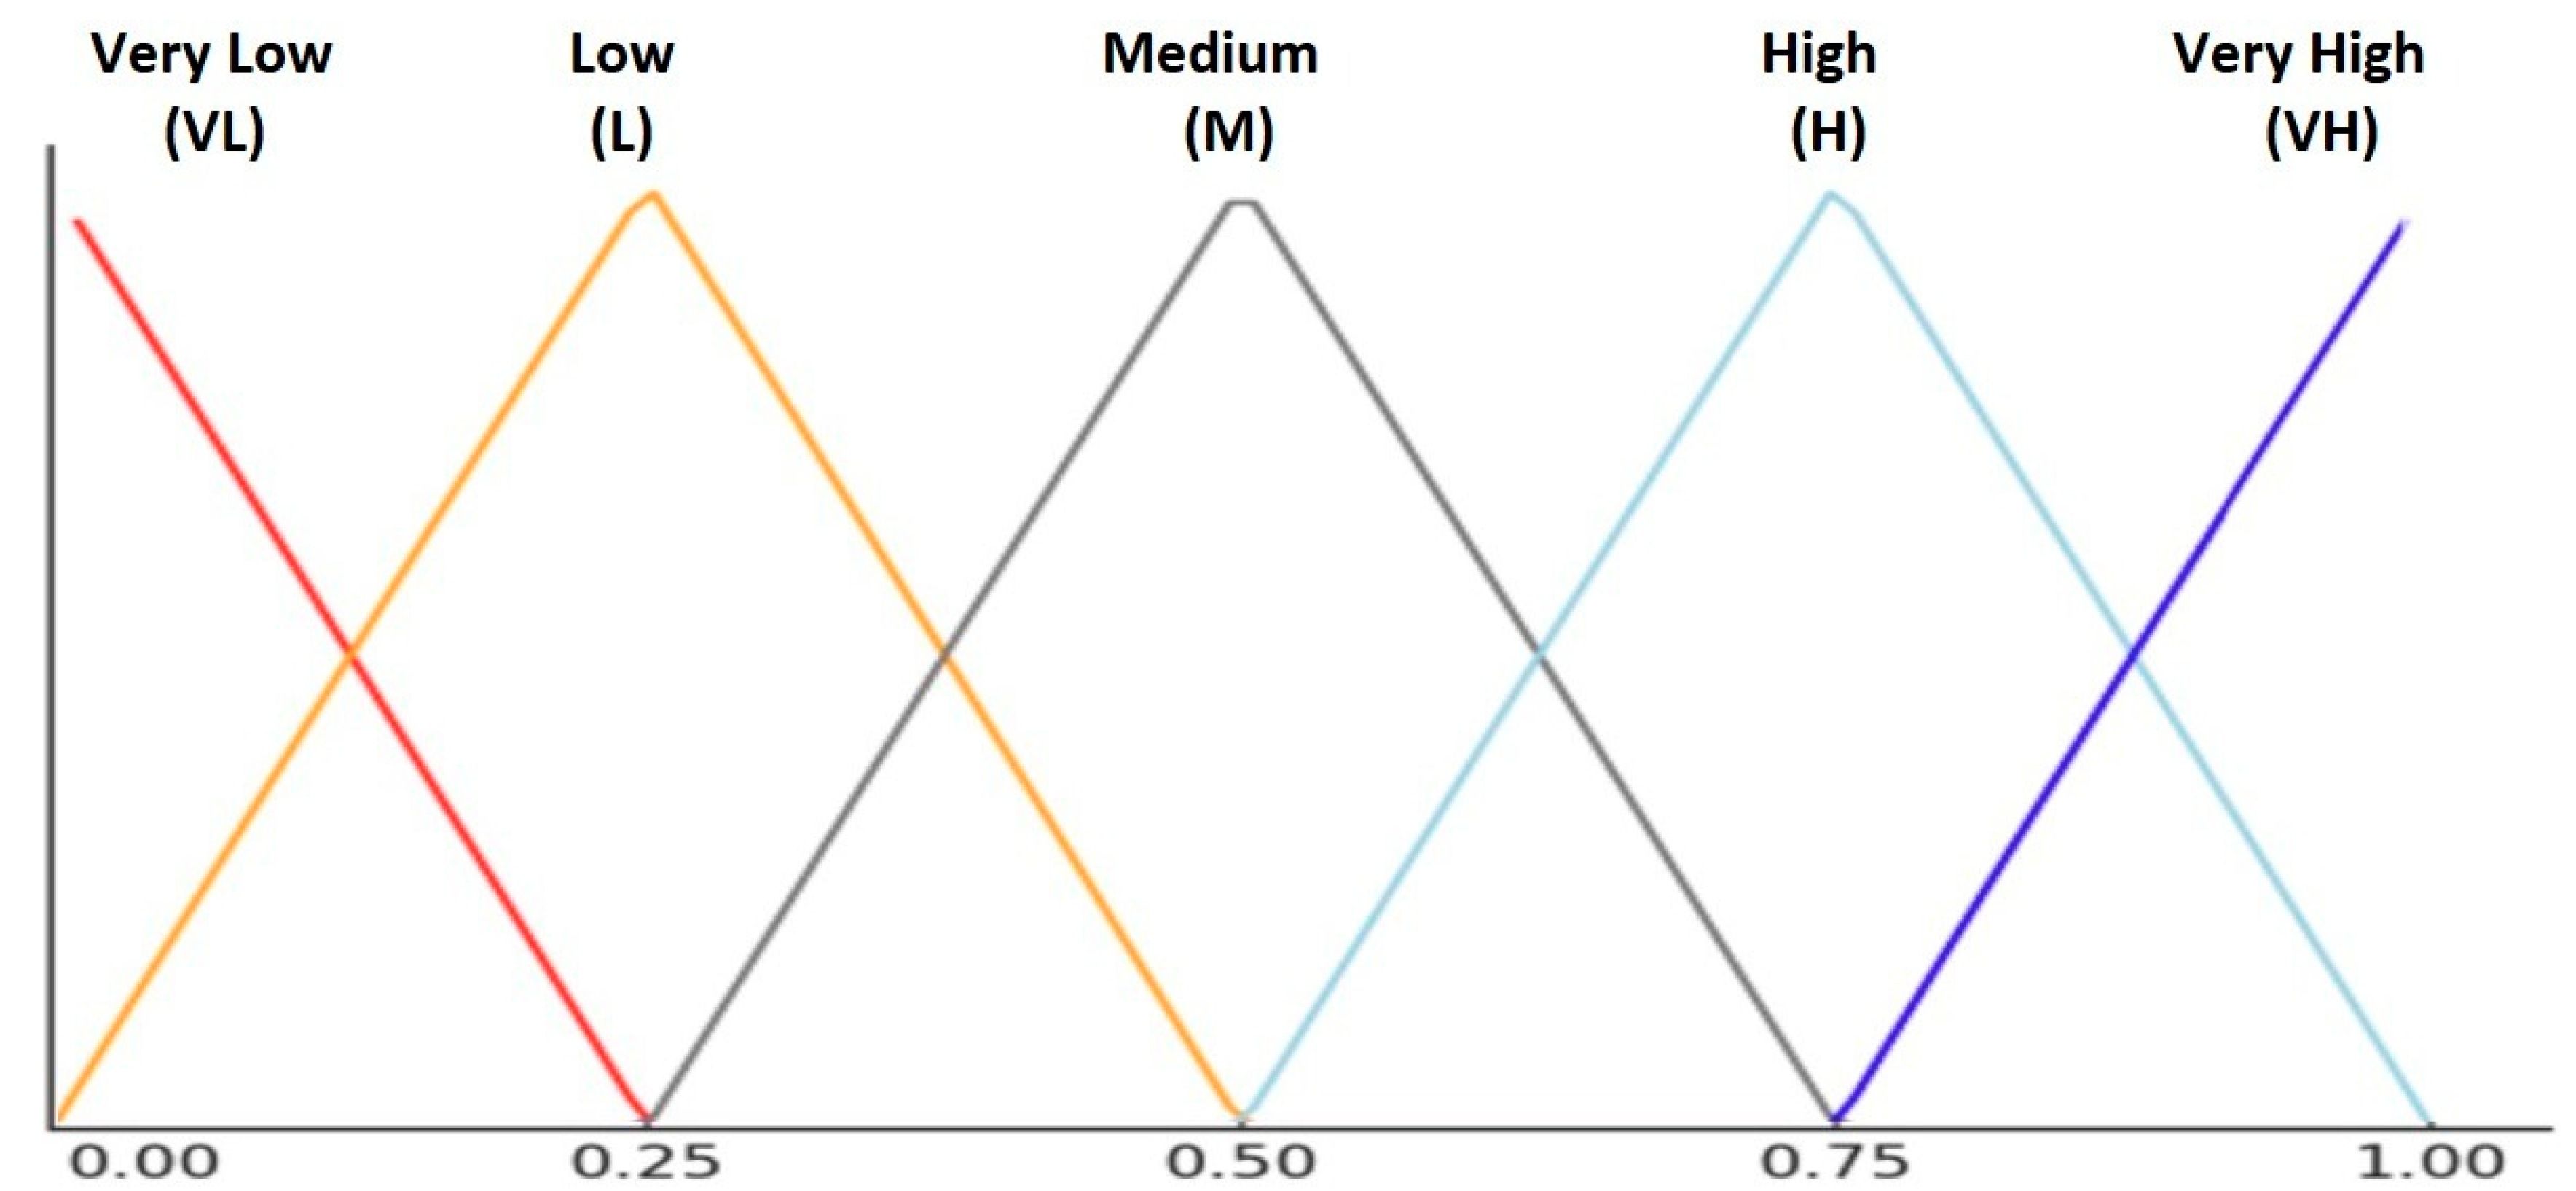
Figure 6 shows the linguistic variable that will be used for the evaluation of the WSJF model represented in Figure 5, where the different ranges of each label can be seen, allowing the model’s performance efficiency to be determined.

4.2. Assessment Method

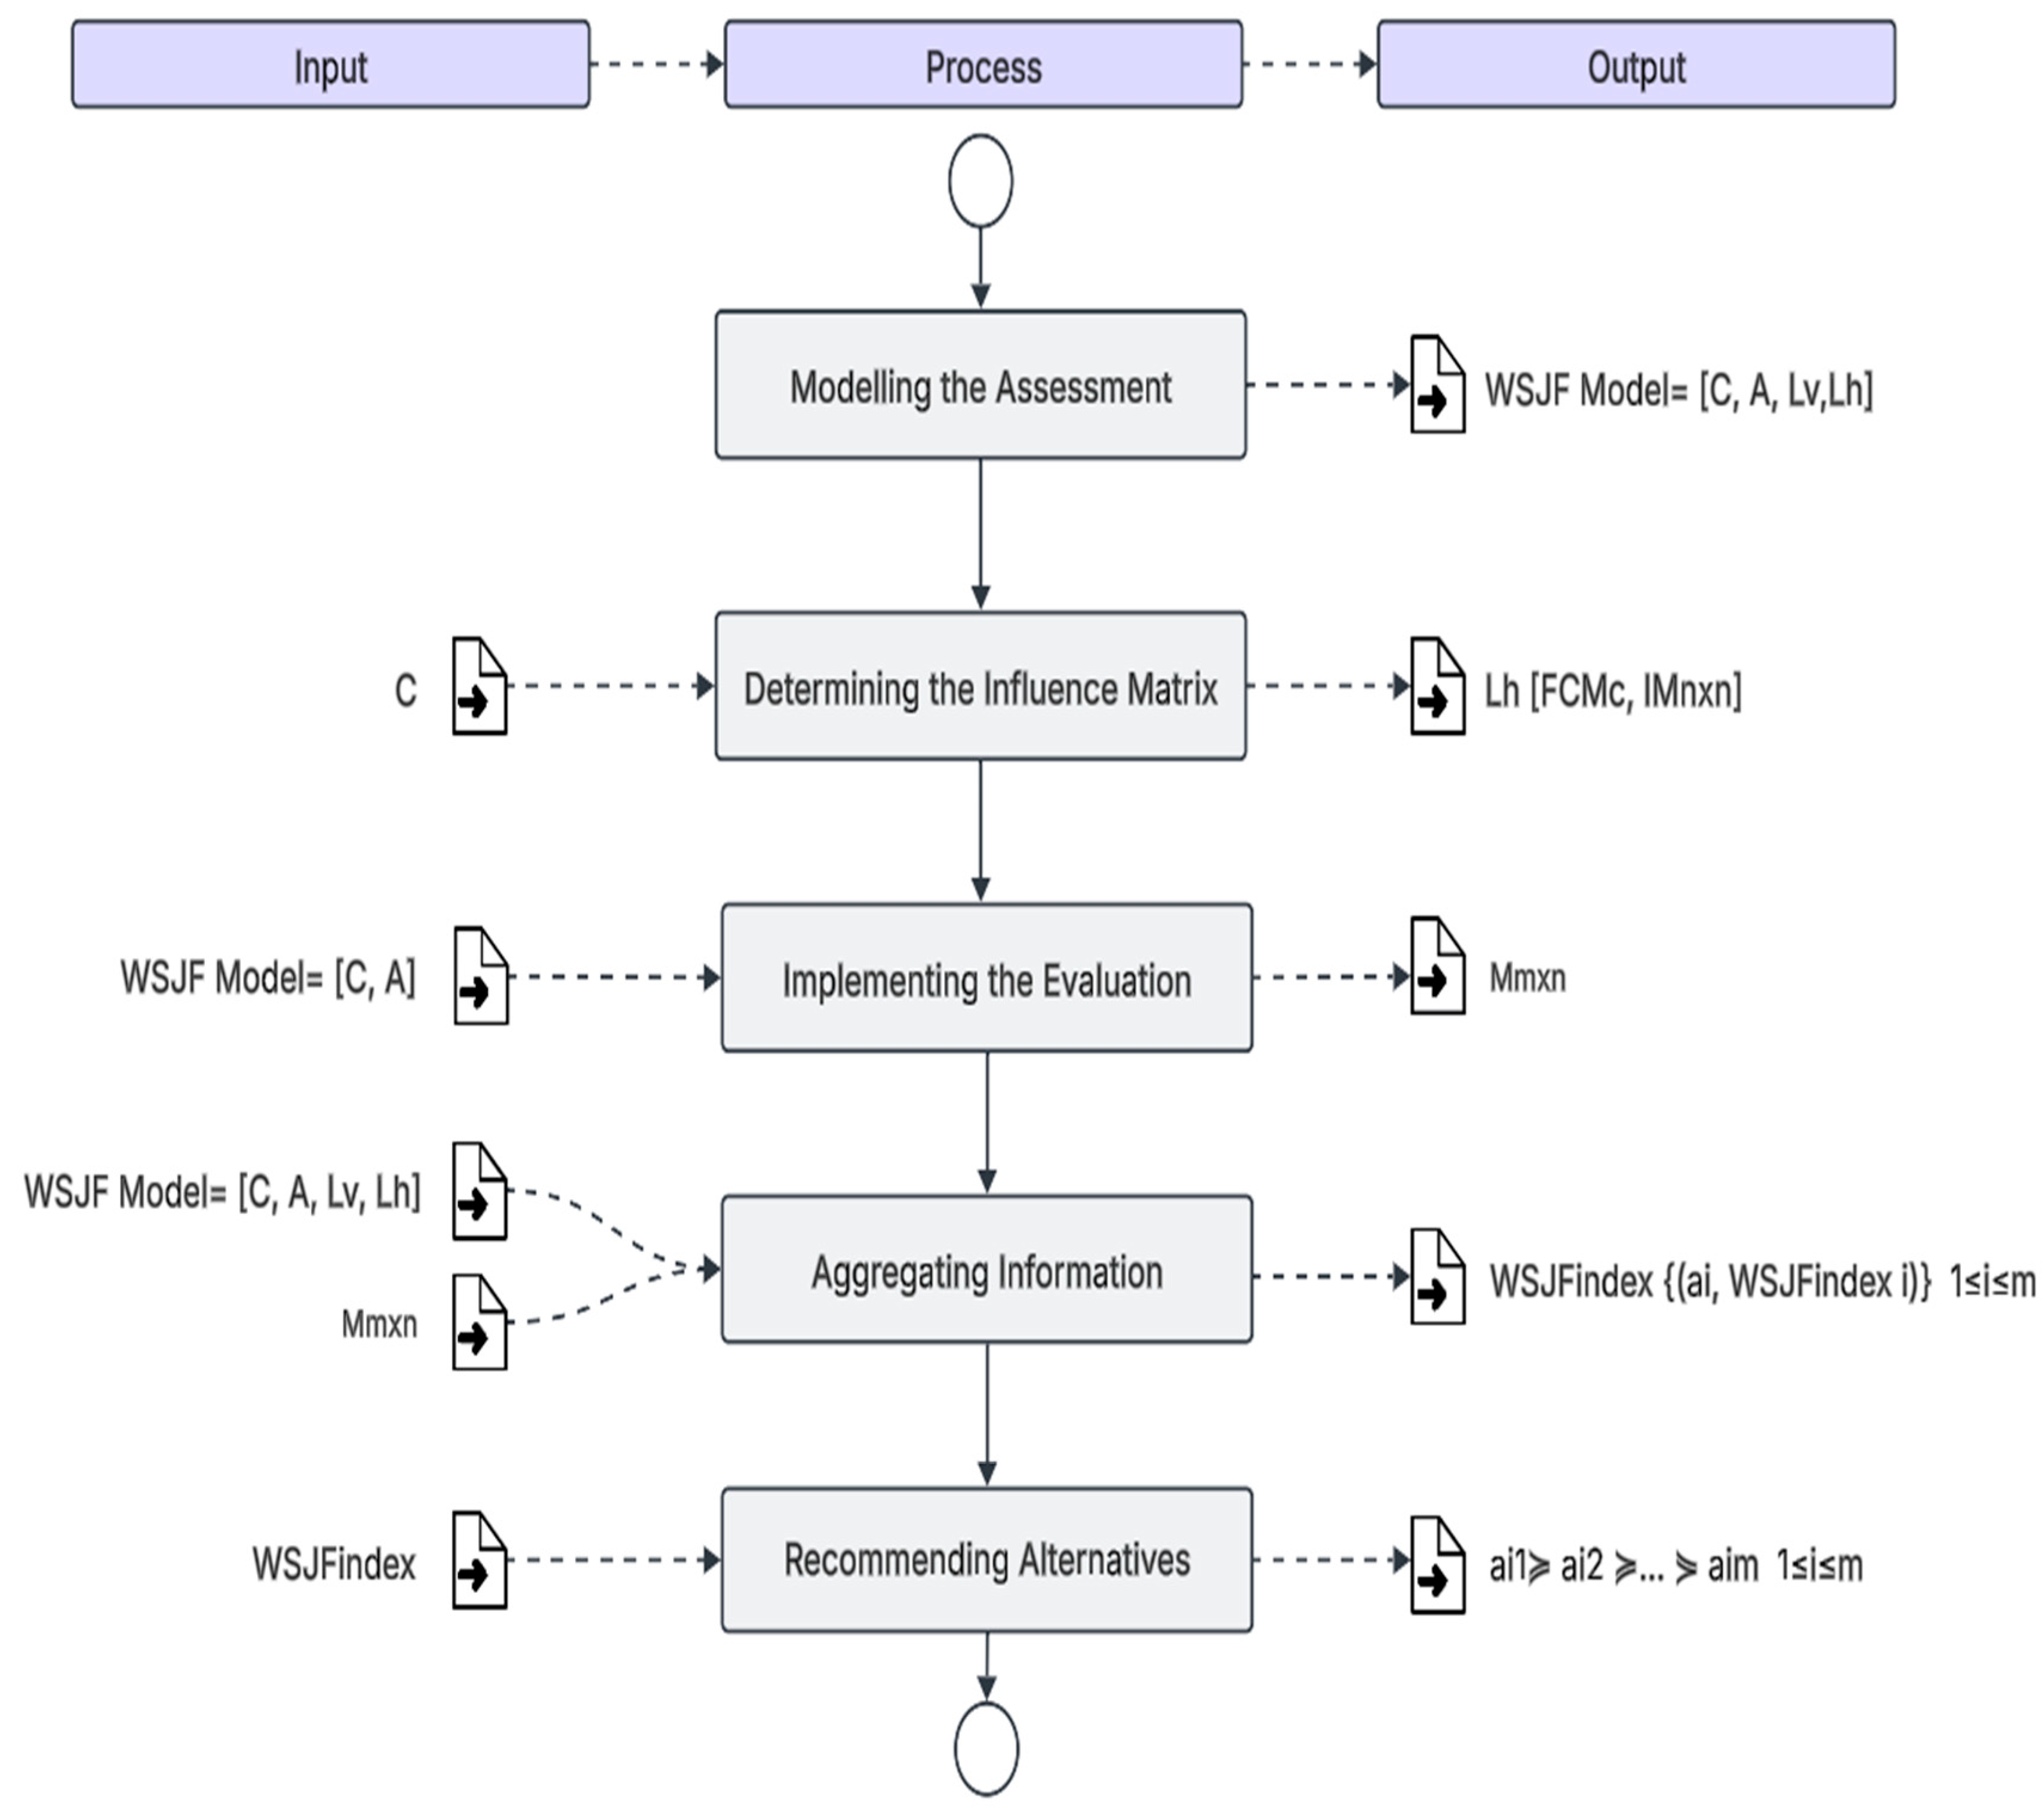
The WSJF assessment method consists of the following steps: modeling the assessment, determining the influence matrix ( I M n x n ), implementing the evaluation, aggregating the information, and recommending the alternatives (see Figure 7).
The Assessment Method within your information process flow for decision-making includes the following steps:
  • Modeling the assessment: The WSJF model, the criteria to be used (C), the set of alternatives (A), and vertical links (Lv) are defined.
  • Determining the influence matrix ( I M n x n ): The relationship between criteria is determined with the use of Fuzzy Cognitive Maps and the influence matrix is derived ( I M n x n ).
  • Implementing the evaluation: The evaluation by experts is performed for the different alternative; the value of each of the criterion is obtained and the evaluation matrix is established ( M m x n ).
  • Aggregating the information: The W S J F i n d e x is calculated using the following Equation:
    W S J F i n d e x = f ( M m x n + ( M m x n I M n x n ) )
    a i ,   W S J F i n d e x   i     1 i m
  • Recommending the alternatives: A ranking is obtained according to W S J F i n d e x
    a i 1   a i 2       a i m   1 i m

4.3. Case Study

This scenario highlights the significant transformation of one of Ecuador’s largest banking institutions, which ranks among the top five in terms of revenue and assets. As the bank embarks on a digital transformation journey, it is prioritizing the development of digital products and services to enhance customer experience and operational efficiency.
A critical challenge faced by the bank was determining which products and services to prioritize amidst this transition. To address this, a multidisciplinary team was established, comprising professionals from nine different departments, including technical, compliance, legal, administrative, psychological sectors, among others.
In total, nine departments were involved in this digital transformation process, each with a team of 9–12 people, led by a single person in charge. This multidisciplinary approach was essential to address the complexity of the project, as each department brought its unique experience and perspective.
Leaders from each area were responsible for compiling and reporting the findings to the Digital Transformation Department committee, which was made up of 15 members, including the organization’s CIO and CISO. This committee played a crucial role in strategic decision-making, ensuring that all initiatives were aligned with the bank’s overall objectives.
The process of reaching a consensus between decision makers and stakeholders was tedious, as it took about seven weeks to reach a satisfactory agreement. During this time, numerous meetings and discussions were held to evaluate the different proposals and priorities. To facilitate this task, the WSJF methodology was implemented, a conventional technique that helps prioritize projects based on their value and the cost of delay.
For the prioritization dynamics among the bank’s collaborators (decision makers), the Bucket System Estimation scale was used with the same criteria for the evaluation scale to weight each of the variables of each alternative, and the criteria used were as follows: {1: very low impact, 2: low impact, 3: moderate impact, 5: high impact and 8: very high impact} represented in Table 4, thus ensuring that all the variables and alternatives of the WSJF were evaluated in a homogeneous manner.
On the other hand, during the prioritization process, eight alternatives were evaluated by the decision makers as possible business opportunities. The final results of the decision-making process using the WSJF prioritization technique with the evaluation criteria in Table 5 are represented in Table 6, i.e., they are the prioritization results of the conventional model. Expert evaluations used a fuzzy rating scale with linguistic terms (ranging from “Null,” to “Very high positive”). Weight variations reflect differing opinions but are normalized, ensuring unbiased simulation results.
Additionally, the Evaluation Method of Section 4.2 was applied to the business alternatives in Table 6, using the adjusted WSJF model (see Figure 8) for the same business alternatives and applying the level of influence in Table 3, in order to verify the result and if a new order in the prioritization of the alternatives is obtained. It is important to mention that a post-mortem analysis will be carried out because the final business results for each evaluated alternative are already known, which will allow analyzing which model had better precision during decision making.
The results in Table 6 illustrate how the conventional WSJF approach organizes priorities when variables are treated independently. Alternatives a2 and a8 emerge as co-leaders (WSJF = 3.00), followed by a4 and a7 (2.25), while a1 falls to the bottom with a score of just 0.40. These outcomes show how the model gives advantage to projects that combine high user business value, time criticality, and risk reduction with relatively small job sizes. However, the identical scores between a2 and a8, as well as between a4 and a7, expose one of the weaknesses of the classical WSJF method: the inability to discriminate between projects when different combinations of criteria produce the same ratio. This creates ambiguity for decision-makers who may not know which initiative to select first when two options appear equally beneficial.
Another important insight is that WSJF in its traditional form emphasizes numerical simplicity over systemic complexity. For instance, a1 and a3 are strongly penalized because their variables score low in isolation, but the model does not capture whether their deployment could create synergies with other initiatives. Likewise, a6, which scores relatively well in cost of delay dimensions, is pushed down the ranking due to job size, without assessing whether this investment could unlock additional benefits in the long term. Overall, Table 6 demonstrates the limitations of a linear evaluation model in complex decision-making environments: it simplifies prioritization but may underrepresent systemic impacts and misguide strategic focus.
C = c 1 ,   c 2 ,   c 3 ,   c 4   where n = 4 .
A = a 1 ,   a 2 ,   a 3 ,   a 4 ,   a 5 ,   a 6 ,   a 7 ,   a 8   where m = 8 .
L V = f :   R 4         R
Table 7 shows the final result of the prioritization of the business alternatives using the WSJF model of Figure 8, that is, with the application of FCM. It is important to mention that the results are consolidated because, as they are fuzzy triangular numbers, independent calculations were performed for each of their matrices and the final result has the defuzzification calculation applying the centroid method to determine the new prioritization of the business alternatives.
When FCM is applied to WSJF, the ranking changes significantly, demonstrating the influence of interdependencies. Alternative a8 rises clearly to the top (5.33), surpassing a2 (4.94), despite both being tied in the traditional WSJF model. This indicates that a8 benefits more from reinforcing feedback effects among user business value, risk reduction, and job size, making it a stronger systemic candidate for prioritization. Similarly, alternatives a4 and a7 climb to joint third place (4.34), reflecting that their value is amplified when interdependencies are modeled. This contrasts with Table 6, where they were ranked only seventh, suggesting that ignoring interdependencies may cause organizations to overlook initiatives with hidden systemic impact.
At the other end, a1 and a3 sink to the lowest ranks, which aligns with their poor standalone scores but now also reflects limited interdependencies with other criteria. Interestingly, a5 and a6 stabilize in middle positions, with scores that better reflect their true contribution once fuzzy influences are considered. The richer discriminatory power of FCM is evident in how it separates previously tied initiatives, reduces artificial equivalence, and provides a clearer hierarchy of priorities. Thus, Table 7 demonstrates the value of using FCM not only to capture nonlinear relationships but also to refine prioritization accuracy, which is critical in environments where misallocating resources can have significant business consequences.
Table 8 shows the comparison of the prioritization of the final results of the business alternatives that were selected using WSJF in a conventional way versus the final results using WSJF with applied FCM, and the last column shows the final business results according to the level of compliance with the business expectation for each alternative. Revenue Compliance (RC) was used as a validation metric, representing the degree to which prioritized items met their forecasted financial impact once deployed.
a 8 1   a 2 2   a 7 3 a 3 4 a 5 5 a 6 6   a 3 7   a 1 8
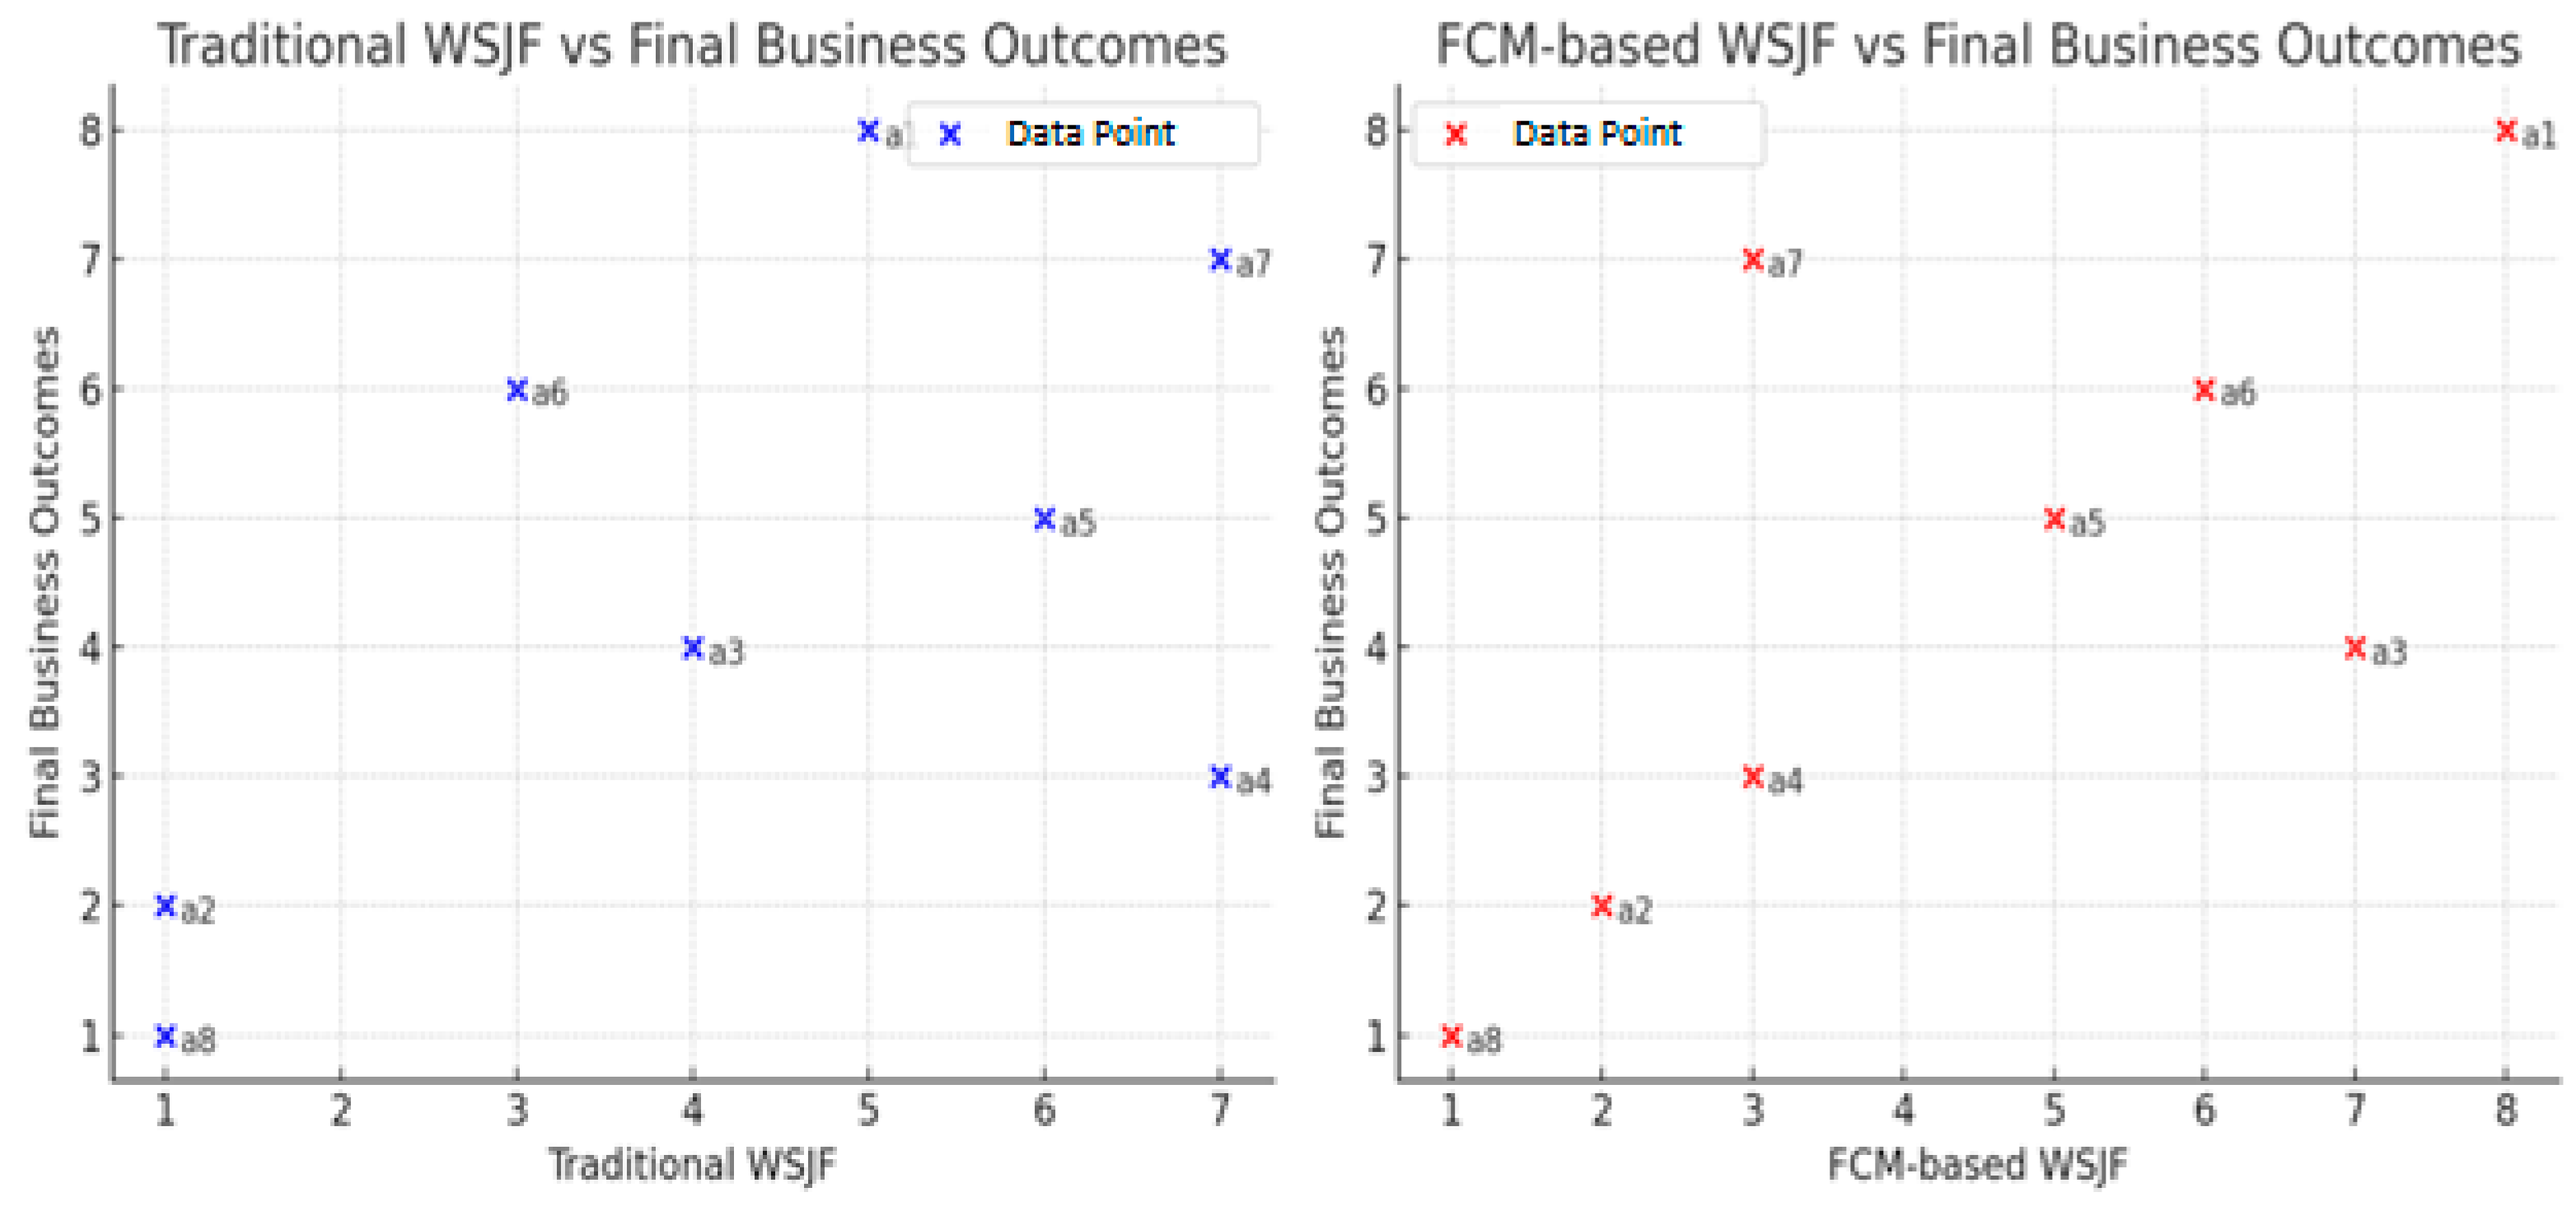
Another key aspect to highlight is the correlation factor between the original WSJF model without applying FCM and the final business results, and the correlation factor with the new WSJF model applying FCM. As can be seen, there is a correlation factor (low positive) of 0.287 with the model without applying FCM, which is not statistically significant; however, compared to the correlation factor of the WSJF model with FCM, a correlation factor of 0.711 is presented, which is statistically significant (moderate-high positive). Finally, in Figure 9, a scatter plot shows the level of accuracy of each model compared to the final business results.
Table 8 provides the definitive test of each model’s effectiveness by comparing prioritization rankings with actual business performance outcomes. The traditional WSJF model shows weak alignment with reality, achieving only a 0.287 correlation with business results—statistically insignificant. This means that relying on conventional WSJF could have led decision-makers to prioritize options like a6 (ranked 3rd) or a3 (ranked 4th), which in practice achieved only 80% and 99% compliance with revenue expectations, respectively. In contrast, the FCM-based WSJF model demonstrates a much stronger and statistically significant correlation of 0.711, highlighting its superior ability to predict which projects would deliver on expectations. Figure 9 shows a stronger positive alignment with final business outcomes than the traditional WSJF, indicating improved prioritization accuracy and better correlation between estimated and actual project value delivery.
The most striking examples of improvement are a4 and a7. Under traditional WSJF, both were relegated to the bottom ranks (7th), but FCM correctly reclassified a4 as 3rd, which aligns with its 122% revenue compliance, and also improved the understanding of a7’s role, though its actual performance (63%) shows some divergence. Equally notable is a8, which both models ranked highly, but whose final outcome (146% revenue compliance) validates its position as the top priority. These findings show that while WSJF can provide a baseline prioritization, the FCM-enhanced version produces a ranking that is significantly closer to business reality, reducing decision-making errors and improving strategic alignment. Table 8 thus confirms the practical value of integrating FCM: it bridges the gap between theoretical prioritization and real-world outcomes.

5. Discussions

The analysis of linear systems in the decision-making process is crucial due to the risks associated with potential interdependencies between variables. The results obtained indicate that the use of evaluation models under these conditions can lead to incorrect decisions if these interdependencies are not properly identified. Therefore, developing the ability to identify such relationships in the evaluated models is essential to ensure the reliability and accuracy of the decision-making process.
The results of this research show that incorporating FCM into WSJF provides a clearer, more accurate prioritization of business alternatives compared to the traditional model. While conventional WSJF produced ambiguous rankings due to identical scores for multiple alternatives, the FCM-based approach successfully differentiated among them, reducing uncertainty for decision-makers. This demonstrates that modeling interdependencies among variables not only improves predictive accuracy but also enhances the robustness of prioritization outcomes in complex organizational settings. Furthermore, the higher correlation between FCM-based WSJF and actual business performance outcomes suggests that this approach bridges the gap between theoretical prioritization methods and real-world organizational needs.
The research highlights the importance of understanding the interdependencies between variables in complex systems, as these relationships can significantly influence model results. In particular, if the interactions between variables are not properly considered, the model could offer erroneous results that affect the final decision and, consequently, business results. Consequently, identifying interdependencies accurately is essential to improving the effectiveness and reliability of the models used in decision-making.
The research findings are consistent with previous studies that have emphasized the need to consider the interdependence of variables in decision making within complex systems [19,27]. However, the approach adopted in this article, which integrates a detailed analysis of interdependencies within an assessment model, offers a more rigorous perspective than previous studies that have focused primarily on systems assessment without exploring these dynamic relationships in depth.
As practical and theoretical implications, identifying and assessing the interdependencies between variables not only improves the accuracy of the assessment model but also contributes to the reliability of decisions made in complex and changing environments. Therefore, from a practical perspective, implementing this approach could be especially valuable in industries such as manufacturing, technology, or project management, where decision-making relies on models involving multiple interrelated variables.
Nevertheless, this study also reveals important limitations. The analysis was conducted on a single banking case study, which restricts the generalizability of the results. Moreover, although FCM enhances interpretive power, the model’s outputs still require translation into actionable managerial guidelines. For example, while the results indicate that project a8 should be prioritized, managers must also understand how to interpret the fuzzy weights and causal influences that underpin this ranking. Without clear frameworks for interpretation, the risk remains that practitioners may treat the model as a “black box,” reducing transparency and stakeholder trust. Addressing these challenges is essential for broader adoption.
Although FCM provides a powerful mathematical representation of interdependencies, its fuzzy weights can be complex to interpret for non-technical practitioners. To enhance usability, this study proposes a managerial interpretation framework based on visual decision-support dashboards. These dashboards translate fuzzy influence weights into intuitive cause–effect diagrams, enabling managers to visually explore how changes in one WSJF criterion (e.g., risk reduction) impact others (e.g., business value). Such visualizations bridge the gap between analytical modeling and executive decision-making, facilitating adoption in agile portfolio management tools.

6. Conclusions and Future Works

The study concludes that the integration of FCM into WSJF significantly improves prioritization accuracy, as evidenced by the stronger correlation (0.711) with actual business outcomes compared to the conventional model (0.287). This reinforces the argument that decision-making frameworks must evolve beyond linear and independent-variable assumptions to remain relevant in complex environments. The case study demonstrates that organizations can achieve more reliable and strategically aligned outcomes when systemic interdependencies are explicitly modeled.
The most relevant conclusion of the research is that, according to the results obtained, a notable improvement is observed in the differences in outcomes between decisions made using linear WSJF and those using WSJF applying FCM, due to the better approximation of results with FCM.
Considering that the research included a post-mortem analysis, the results show that applying FCM to WSJF had a 76% correlation in the prioritization order of the best results; however, a 24% difference was observed in said order, which remains a gap that needs to be investigated. Therefore, this correlation percentage suggests a notable improvement in decision-making efficiency, and the challenge would be to test the model in other industries.
However, the research also highlights critical limitations that must guide future work. First, the validation of the model through a single banking case restricts external validity; expanding the application to diverse industries—such as healthcare, manufacturing, or digital services—would provide evidence of robustness and scalability. Second, while FCM captures interdependencies, interpretability remains a challenge. Future research should focus on developing visualization tools, decision-support dashboards, and practitioner guidelines to help managers translate model outputs into concrete actions. Finally, benchmarking against other state-of-the-art methods such as ANP, ELECTRE, or hybrid fuzzy approaches would provide a stronger comparative foundation for the proposed model’s effectiveness.
Another relevant aspect is that the techniques compiled in this work can be incorporated into a recommendation system that can be developed in several phases: (a) in the initial phases, the system can use this and/or other fuzzy techniques along with 75% human intervention; (b) In the production phases, the recommendation system can have 50% human interaction to guide the decision-making process; (c) subsequently, the recommendation system can have zero human intervention in decision-making, following ethical guidelines.
The enhanced model achieved a 76% correlation between FCM-based WSJF prioritization and actual business results, compared with 24% divergence from the traditional WSJF approach. These figures—derived from the post-mortem case study and visualized in Figure 9—demonstrate that modeling interdependencies among WSJF variables substantially improves predictive validity and prioritization precision.
The correlation values were obtained by comparing the rank-order correlation (Spearman’s ρ = 0.711, p < 0.05) between the FCM-based model and real business outcomes, confirming statistical significance. Conversely, the linear WSJF model yielded ρ = 0.287 (p > 0.05), indicating a weak and non-significant association. Therefore, the 76% concordance refers to the overlap in ranking order, while the 24% residual variation identifies cases where nonlinear dependencies altered prioritization (notably alternatives a4 and a7).
Future work should focus on expanding this approach across multiple sectors and scaling it into real-time decision-support platforms. Moreover, incorporating automated learning mechanisms to update FCM weights from project performance data could further enhance adaptability and predictive reliability. Additionally, future research can be focused on the following, for instance: (1) validating the model across multiple sectors to enhance generalizability, (2) incorporating automated weight learning in FCM to adapt influence matrices from real performance data, (3) comparing computational scalability (O(n2) relationships) with other MCDM techniques such as ANP and ELECTRE, (4) Developing visual decision-support dashboards for intuitive interpretation of fuzzy interactions by managers.
As a conclusion, the application of FCM can be extended to other prioritization techniques to verify whether the behavior is similar to the current model and improve the final decisions.

Limitations

One of the main limitations of this study is that the results obtained are based on a specific set of assessment models. Although these results are relevant, further studies are needed to validate the findings in different contexts and with various methodologies. Furthermore, the applicability of this approach could be influenced by the quality of the available data and decision-makers’ interpretation of interdependencies.
Author Contributions

B.N.Z.M.; methodology, B.N.Z.M.; software, Y.F.; validation, B.N.Z.M. and Y.F.; formal analysis, B.N.Z.M. and F.A.E.B.; investigation, F.A.E.B.; resources, B.N.Z.M.; data curation, Y.F.; writing—original draft preparation, B.N.Z.M. and F.A.E.B.; writing—review and editing, B.N.Z.M. and F.A.E.B.; visualization, F.A.E.B.; supervision, C.C.C.; project administration, B.N.Z.M.; funding acquisition, C.C.C. All authors have read and agreed to the published version of the manuscript.

Funding

This work was developed thanks to the international cooperation project DRUIDA, coordinated by the University of Informatics Sciences, Cuba, and funded by the Spanish Agency for International Development Cooperation (AECID). Thanks to the financial support provided by the project PID2023-146575NB-I00 (Spanish Ministry of Science, Innovation and Universities and ERDF funds from the European Union).

Institutional Review Board Statement

Not applicable.

Informed Consent Statement

Not applicable.

Data Availability Statement

The datasets used and/or analyed during the present study are available upon request from the corresponding author. All data used in the present research are confidential; therefore, no sources have been mentioned.

Conflicts of Interest

The authors declare no conflicts of interest.

References

  1. Johnson, R.; Smith, L. VUCA environment and its impact on business model innovation. Int. J. Bus. Models Innov. 2018, 6, 45–56. [Google Scholar]
  2. Reinertsen, D. The Principles of Product Development Flow: Second Generation Lean Product Development; Celeritas Publishing: Redondo Beach, CA, USA, 2009; p. 194. [Google Scholar]
  3. Hassan, M.A.; Sulaiman, H. Fuzzy cognitive maps in systems risk analysis. Appl. Intell. 2020, 50, 3557–3575. [Google Scholar]
  4. Papageorgiou, E.I. Review study on Fuzzy Cognitive Maps and their applications during the last decade. IEEE Trans. Syst. Man Cybern. Syst. 2012, 42, 150–163. [Google Scholar] [CrossRef]
  5. Project Management Institute. Pulse of the Profession 2024: The Future of Work in Projects: Beyond Office-Centered Models, 15th ed.; Project Management Institute: Newtown Square, PA, USA, 2024. [Google Scholar]
  6. Gonzalez, J.; De la Torre, R. Fuzzy cognitive maps structure for medical decision support systems. In Advances in Soft Computing; Springer: Berlin/Heidelberg, Germany, 2007; pp. 69–80. [Google Scholar]
  7. Kosko, B. Fuzzy Cognitive Maps. Int. J. Man-Mach. Stud. 1986, 24, 65–75. [Google Scholar] [CrossRef]
  8. Papageorgiou, E.I.; Stylios, C.D.; Groumpos, P.P. Active Hebbian Learning Algorithm to Train Fuzzy Cognitive Maps. Int. J. Approx. Reason. 2004, 37, 219–249. [Google Scholar] [CrossRef]
  9. Chen, Y.; Mazlack, L.; Lu, L. Inferring fuzzy cognitive map models for gene regulatory networks from gene expression data. In Proceedings of the IEEE International Conference on Bioinformatics and Biomedicine, Philadelphia, PA, USA, 4–7 October 2012; pp. 1–4. [Google Scholar]
  10. Chen, Y.; Mazlack, L.J.; Minai, A.A.; Lu, L.J. Inferring causal networks using fuzzy cognitive maps and evolutionary algorithms with application to gene regulatory network reconstruction. Appl. Soft Comput. 2015, 37, 667–679. [Google Scholar] [CrossRef]
  11. Chi, Y.; Liu, J. Learning large-scale fuzzy cognitive maps using a hybrid of memetic algorithm and neural network. In Proceedings of the FUZZ-IEEE Conference, Beijing, China, 6–11 July 2014; pp. 1036–1040. [Google Scholar]
  12. De Lima Silva, P.C.; Sadaei, H.J.; Ballini, R.; Guimarães, F.G. Probabilistic forecasting with fuzzy time series. IEEE Trans. Fuzzy Syst. 2019, 28, 1771–1784. [Google Scholar] [CrossRef]
  13. Silva, P.C.D.L.; Alves, M.A.; Junior, C.A.S.; Vieira, G.L.; Guimaraes, F.G.; Sadaei, H.J. Probabilistic forecasting with seasonal ensemble fuzzy time-series. In Proceedings of the Brazilian Congress on Computational Intelligence, Uberlândia, Brazil, 2–5 October 2017. [Google Scholar]
  14. Dickerson, J.A.; Kosko, B. Virtual Worlds as Fuzzy Cognitive Maps. Presence Teleoper. Virtual Environ. 1994, 3, 173–189. [Google Scholar] [CrossRef]
  15. Chunying, Z.; Lu, L.; Dong, O.; Ruitao, L. Research of rough cognitive map model. Commun. Comput. Inf. Sci. 2011, 203, 370–379. [Google Scholar]
  16. Fernández Pérez, Y.; Cruz Corona, C.; Verdegay Galdeano, J.L. A new model based on soft computing for evaluation and selection of software products. IEEE Lat. Am. Trans. 2018, 16, 1186–1192. [Google Scholar] [CrossRef]
  17. Chi, Y.; Liu, J. Learning of Fuzzy Cognitive Maps with Varying Densities Using a Multiobjective Evolutionary Algorithm. IEEE Trans. Fuzzy Syst. 2015, 24, 71–81. [Google Scholar] [CrossRef]
  18. Fernández-Pérez, Y.; Febles-Estrada, A.; Cruz, C.; Verdegay, J.L. Fuzzy multi-criteria decision making methods applied to usability software assessment: An annotated bibliography. In Complex Systems: Solutions and Challenges in Economics, Management and Engineering; Kacprzyk, E.J., Collan, M., Eds.; Springer: Berlin/Heidelberg, Germany, 2018; pp. 165–189. [Google Scholar]
  19. Fernández Pérez, Y.; Cruz Corona, C.; Febles Estrada, A. Fuzzy cognitive maps for evaluating software usability. In Uncertainty Management with Fuzzy and Rough Sets; Bello, E.R., Falcon, R., Verdegay, J.L., Eds.; Springer: Berlin/Heidelberg, Germany, 2019; pp. 141–155. [Google Scholar]
  20. Atre, N.; Sherry, J. SurgeProtector: Mitigating temporal algorithmic complexity attacks using adversarial scheduling. In Proceedings of the ACM SIGCOMM 2022 Conference, Amsterdam, The Netherlands, 22–26 August 2022; pp. 328–342. [Google Scholar]
  21. Chow, C.Y.; Horváth, A.; Veeraraghavan, M. Robust heuristics: Attacks and defenses for job size estimation in WSJF systems. In Proceedings of the ACM SIGCOMM 2022 Conference, Amsterdam, The Netherlands, 22–26 August 2022; pp. 328–342. [Google Scholar]
  22. Vijayakumar, S.; Prasad, K.; Holla, R.M. Assessing the effectiveness of MoSCoW prioritization in software development: A holistic analysis across methodologies. EAI Endorsed Trans. Internet Things 2024, 10, e6515. [Google Scholar]
  23. Alqahtani, F.; Orji, R.; Sun, N. Prioritization of quality principles for health apps using the Kano model: Survey study. JMIR Mhealth Uhealth 2022, 10, e29152. [Google Scholar]
  24. Bansal, A.; Nair, V. Applying Kano’s two-factor theory to prioritize learning analytics dashboard features for learning management systems. CEDTech J. 2022, 4, ep496. [Google Scholar]
  25. Kheybari, S.; Rezaie, F.M.; Farazmand, H. Analytic network process: An overview of applications. Appl. Math. Comput. 2020, 367, 124780. [Google Scholar] [CrossRef]
  26. Khan, S.A.; Abdullah, S. Fuzzy cognitive maps for decision-making in dynamic environments. Cogn. Comput. 2020, 12, 1017–1034. [Google Scholar]
  27. Thakkar, J.J.; Thakkar, J.J. Elimination Et choice translating reality (ELECTRE). In Multi-Criteria Decision Making; Springer: Singapore, 2021; pp. 93–117. [Google Scholar]
  28. Chunmei, L.; Yue, H. Cellular automata learning of fuzzy cognitive map. In Proceedings of the International Conference on System Science and Engineering (ICSSE), Piscataway, NJ, USA, 30 June–2 July 2012; pp. 334–338. [Google Scholar]
  29. Wang, J.; Peng, Z.; Wang, X.; Li, C.; Wu, J. Deep Fuzzy Cognitive Maps for Interpretable Multivariate Time Series Prediction. IEEE Trans. Fuzzy Syst. 2020, 29, 2647–2660. [Google Scholar] [CrossRef]
  30. Case, D.; Stylios, C. Fuzzy Cognitive Map to model project management problems. In Proceedings of the Annual Conference of the North American Fuzzy Information Processing Society (NAFIPS), El Paso, TX, USA, 31 October–4 November 2016; pp. 1–6. [Google Scholar]
  31. Eden, C. Analyzing cognitive maps to help structure issues or problems. Eur. J. Oper. Res. 2004, 159, 673–686. [Google Scholar] [CrossRef]
Figure 1. WSJF Application for prioritization of multiple choices from [2].
Information 16 00944 g001
Figure 2. Fuzzy Cognitive Map representing the relationship between WSJF Variables.
Information 16 00944 g002
Figure 3. Linguistics Label of Influence.
Information 16 00944 g003
Figure 4. Heatmap representing the level of belonging intensity between Variables.
Information 16 00944 g004
Figure 5. WSJF model applied interdependencies and influences from FCM.
Information 16 00944 g005
Figure 6. Linguistic variable evaluation.
Information 16 00944 g006
Figure 7. Assessment Method Flowchart.
Information 16 00944 g007
Figure 8. WSJF Diagram for the case study considering 8 inputs in the cluster.
Information 16 00944 g008
Figure 9. Scatter plots showing model accuracy compared to final business outcomes.
Information 16 00944 g009
Table 1. Comparison between WSJF with other prioritization techniques.
TechniqueAdvantagesDisadvantages
WSJF
-
Focuses on maximizing economic value by prioritizing work that delivers the highest impact relative to its cost.
-
Supports incremental delivery, making it ideal for Agile environments.
-
Uses objective numerical scoring, reducing bias in decision-making.
-
Helps align priorities with business value and urgency.
-
Requires accurate estimation of cost of delay and job size, which can be subjective.
-
May overlook long-term strategic initiatives if they do not provide immediate high value.
-
Not well-suited for projects with high uncertainty or dependencies between tasks.
Kano
-
Helps in identifying customer satisfaction drivers by classifying features into must-haves, performance, and delight factors.
-
Supports customer-centric decision-making.
-
Useful for distinguishing between necessary features and those that provide extra value.
-
Does not consider business urgency or development effort.
-
Requires customer research, making it time-consuming.
-
Subject to misinterpretation if user preferences shift over time.
MoSCoW
-
Simple and easy to use for quick prioritization.
-
Helps in managing stakeholder expectations by defining what will and won’t be delivered.
-
Works well in time-constrained projects like Agile sprints.
-
Lacks a structured approach to measure business value.
-
Can lead to negotiation battles between stakeholders over categorization.
-
Subject to subjective bias, as it does not provide numerical prioritization.
Table 2. Analysis of related research applied to FCM and Prioritization Techniques.
Related ResearchPrioritization TechniqueFuzzy Cognitive MapsDecision-Making Process
WSJFMoSCoWKano
[4]NoNoNoYesYes
[7]NoNoNoYesYes
[8]NoNoNoYesYes
[9]NoNoNoYesYes
[10]NoNoNoYesYes
[11]NoNoNoYesYes
[14]NoNoNoYesYes
[15]NoNoNoYesYes
[16]NoNoNoYesYes
[18]NoNoNoYesYes
[21]YesNoNoNoNo
[22]NoYesNoNoNo
[23]NoNoYesNoNo
[24]NoNoYesNoNo
[25]NoNoNoYesYes
[26]NoNoNoYesYes
[27]NoNoNoYesYes
[28]NoNoNoYesYes
[29]NoNoNoYesYes
[30]NoNoNoYesYes
[31]NoNoNoYesYes
Table 3. Bucket System Estimation scale to represent the relationship using FCM in WSJF.
Linguistic LabelType of InfluenceFuzzy Set DescriptionMembership FunctionBoundaries
hnHigh NegativeInfluence between −1 and up to −0.5μhn(−1, −1, −0.5)
lnLow NegativeInfluence between −3 and up to −1μln(−0.6, −0.3, 0)
winfWithoutInfluence between 0 and up to 0μwinf(0, 0, 0)
lpLow PositiveInfluence between 1 and up to 3μlp(0, 0.3, 0.6)
hpHigh PositiveInfluence between 3 and up to 7μhp(0.5, 1, 1)
Table 4. WSJF Adjacency Matrix Representation.
User Business Value (UBV)Time Criticality (TC)Risk Reduction (RR)
User Business Vale (UBV)(0, 0, 0)(0.5, 1, 1)(0, 0, 0)
Time Criticality (TC)(0, 0, 0)(0, 0, 0)(0, 0, 0)
Risk Reduction (RR)(−1, −1, −0.5)(0, 0, 0)(0, 0, 0)
Table 5. Prioritizing business options with WSJF without using FCM.
Description of Business ImpactRate
Null0
Very low positive1
Low positive2
Moderate positive3
High positive5
Very high positive8
Table 6. Prioritizing business options with WSJF without using FCM.
AlternativeC1 = UBVC2 = TCC3 = RR/OOC4 = JSWSJFRanking
a110150.405
a288883.001
a321251.004
a455882.257
a535581.636
a622251.203
a755882.257
a855553.001
Table 7. Prioritizing business options with WSJF applying FCM with interdependencies.
AlternativeC1 = UBVC2 = TCC3 = RR/OOC4 = JSDefuzzifiedRanking
a1(0, 0, 0.25)(0, 0, 0.25)(0, 0, 0.25)(0.5, 0.75, 1)0.428
a2(0.75, 1, 1)(0.75, 1, 1)(0.75, 1, 1)(0.75, 1, 1)4.942
a3(0, 0.25, 0.25)(0, 0, 0.25)(0, 0.25, 0.25)(0.5, 0.75, 1)1.317
a4(0.5, 0.75, 1(0.5, 0.75, 1)(0.75, 1, 1)(0.75, 1, 1)4.343
a5(0.25, 0.5, 0.75)(0.5, 0.75, 1)(0.5, 0.75, 1)(0.75, 1, 1)3.445
a6(0, 0.25, 0.25)(0, 0.25, 0.25)(0, 0.25, 0.25)(0.5, 0.75, 1)1.536
a7(0.5, 0.75, 1)(0.5, 0.75, 1)(0.75, 1, 1)(0.75, 1, 1)4.343
a8(0.5, 0.75, 1)(0.5, 0.75, 1)(0.5, 0.75, 1)(0.5, 0.75, 1)5.331
Table 8. Comparison between traditional WSJF and FCM-oriented WSJF.
AlternativeTraditional WSJFFCM-Based WSJFFinal Business ResultsRevenue Compliance
a158825%
a2122123%
a347499%
a4733122%
a565590%
a636680%
a773763%
a8111146%
Disclaimer/Publisher’s Note: The statements, opinions and data contained in all publications are solely those of the individual author(s) and contributor(s) and not of MDPI and/or the editor(s). MDPI and/or the editor(s) disclaim responsibility for any injury to people or property resulting from any ideas, methods, instructions or products referred to in the content.