Article

The Impact of Information Layout and Auxiliary Instruction Display Mode on the Usability of Virtual Fitting Interaction Interfaces

by
Xingmin Lin
and
Peiling Pan
*
Xiamen Academy of Arts and Design, Fuzhou University, Xiamen 361024, China
*
Author to whom correspondence should be addressed.
Information 2025, 16(10), 862; https://doi.org/10.3390/info16100862
Submission received: 25 August 2025 / Revised: 26 September 2025 / Accepted: 29 September 2025 / Published: 4 October 2025

Abstract

With the widespread adoption of virtual fitting technology in e-commerce and fashion, optimizing user experience through interface design has become increasingly critical. However, research on the usability of virtual fitting interaction interfaces remains limited. Current interfaces frequently suffer from disorganized information layouts and ambiguous auxiliary instructions, reducing efficiency and immersion. This study systematically investigates the effects of information layout (matrix layout, list layout, horizontal layout) and auxiliary instruction display mode (positive polarity: dark content on light background; negative polarity: light content on dark background) on user task performance and subjective experience. A between-subjects experiment was conducted with 60 participants across six conditions. Participants performed a series of tasks, and data were collected on task completion time, subjective ratings, and Technology Acceptance Model responses. Analyses were conducted using two-way ANOVA. The main findings were as follows: (1) The matrix layout demonstrated higher efficiency in multi-target search and complex decision-making tasks, and also received higher subjective ratings for perceived ease of use. (2) The positive polarity display mode demonstrated better performance in single-information search and cognitively intensive tasks, coupled with higher subjective ratings for interface rationality and information clarity. (3) A significant interaction effect was identified between information layout and display mode. The matrix layout combined with positive polarity improved efficiency, whereas the list layout with negative polarity impaired task performance. The horizontal layout was also rated lower for operational fluency. These findings provide practical guidance for designing virtual fitting interfaces that enhance both performance and subjective user experience.

1. Introduction

1.1. Background

Virtual fitting technology plays an increasingly important role in the digital transformation of the fashion industry. Although immersive technologies have improved realism, the usability of many virtual try-on interfaces remains poor, which can result in high cognitive load and inefficient operation. However, current research has mainly focused on technological innovation and consumer acceptance, while interface usability has received less attention.
Existing research on virtual fitting has primarily focused on technological innovation. In image processing and deep learning, key efforts focus on generating realistic try-on images [1], improving garment deformation [2], mitigating occlusion issues [3], and developing parser-free systems for efficient generation [4]. Meanwhile, augmented reality (AR) and virtual reality research continues to strengthen immersion, examining user acceptance [5], impact on shopping experience [6], and frameworks for retail [7]. The integration of 2D and 3D is further supported by advances in 3D modeling, including statistical models [8], motion capture [9], and single-image reconstruction [10], with reviews helping chart future directions [11].
Consumer acceptance is equally critical, influenced by factors such as privacy, personalization, and perceived value. Studies show that personalized features are crucial for adoption [12], virtual environments can enhance privacy and confidence [13], and perceived usefulness directly affects purchase intention [14]. Shopper engagement mediates the link between AR experience and behavior [15], with social interaction being key for Generation Z [16] and ease of use mattering more for older adults [17]. Applications span diverse areas like luxury fashion [18], e-commerce with mobile scanning [19], smart fitting rooms [20], and AR magic mirrors [21], alongside ongoing work to improve 3D body scanning satisfaction [22].
Future development will likely focus on deeper immersive experiences and more intuitive interaction design. For example, this may involve generative models for multisensory interaction [23] and further studies on how presence in augmented reality affects purchase decisions [24]. With the advancement of artificial intelligence, virtual fitting systems are expected to see broader global use, accelerating the digital transformation of the apparel industry.

1.2. Research Objectives

This study investigates the impact of information layout (matrix layout, list layout, horizontal layout) and auxiliary instruction display mode (positive polarity, negative polarity) within virtual fitting interaction interfaces on user interaction experience. The study aims to determine which design combinations minimize cognitive load, thereby enhancing visual search efficiency and decision-making performance. Building upon existing research on virtual fitting interaction interfaces, this study conducts a systematic evaluation of these two design factors, comparing user task performance and subjective perceptions across different interface combinations.
This study aims to achieve two primary objectives. First, it seeks to quantify objective operational performance by examining the influence of information layout and display mode on users’ visual search efficiency, thereby proposing design recommendations for virtual fitting interfaces that are aligned with users’ cognitive habits. Second, it aims to analyze the subjective interaction experience by investigating the effects of these design factors on users’ subjective evaluations, which will provide crucial insights for optimizing the overall usability of the interface. Therefore, the study aims to reduce the cognitive load on users when using the virtual fitting interface and enhance the usability of virtual fitting systems.

2. Literature Review

Cognitive load is a pivotal factor in interaction, affects user task performance and subjective experience. It is commonly classified into three types: intrinsic cognitive load, extraneous cognitive load, and germane cognitive load [25]. Among these, extraneous cognitive load can be significantly reduced through interface optimization. Studies across domains confirm that poor interface design elevates extraneous load, diverting attention from primary tasks [26].
The regulation of extraneous cognitive load by interface element design exhibits multi-dimensional characteristics. At the visual level, icon color combinations must align with cognitive load levels. Dark-on-light (positive polarity) combinations perform robustly across high, medium, and low-load environments [27]. In news texts, highlighting keywords in red italics was found to reduce perceived cognitive load under high load, but to increase it under low load [28]. In terms of interaction, 3D interfaces reduced blink duration and narrowed fixation dispersion, indicating that spatial interaction can improve information integration efficiency [29].
Furthermore, product information is the most critical factor influencing user loyalty towards shopping websites [30]. However, shopping websites often contain large amounts of product information. While this can facilitate shopping convenience, it may also cause information overload [31]. Information patch overload negatively impacts purchase intention through increased cognitive load, while moderate design enhances user engagement via flow experience [32]. Optimizing cognitive load for special populations requires targeted strategies. For older adults engaged in online learning, simplified layouts and enlarged fonts reduced eye-tracking fixation points [33]. Meanwhile, cognitive load assessment for multimedia information presentation requires calibration using both objective and subjective metrics [34].

2.1. Interface Information Layout

Interface information layout, a core element of interaction, significantly impacts user cognitive efficiency and task performance. Research consistently indicates that spatially structured layouts optimize visual search paths. In geographic information system map interfaces, vertically symmetric layouts significantly reduce reaction times compared to disordered layouts by minimizing saccadic jumps [35]. In mobile applications, card-based layouts enhance user search efficiency due to their block-based information organization [36].
Layout design should be adapted to user group characteristics and environmental constraints. For older adults, public library websites combining image-text matching with top-navigation layouts can reduce information-seeking time, but horizontal layouts should be avoided to prevent visual clutter [37]. In driving scenarios, a center-grouped layout for head-up display interfaces balances road monitoring and information reading, whereas right-side layouts increase operational risk due to visual field deviation [38]. In specific contexts, spatial distribution characteristics become critical variables. Vertical text arrangement on urban signage facilitates spatial representation more easily than horizontal layouts [39]. While linear layouts in social media prolong attention maintenance at the expense of search breadth, matrix layouts are better suited for rapid multi-task switching [40]. Longitudinal sequential layouts in mobile learning platforms enhance learning efficiency compared to transverse layouts by reducing fixation entropy [41]. In VR environments, spatially distributed layouts improve memorization efficacy for scientific charts [42].
Emerging technologies drive paradigm shifts in layout design. Generative artificial intelligence models can synthesize semi-structured document layouts, improving text classification accuracy through boundary box information [43]. Comparative studies reveal that while circular layouts excel, linear layouts reduce attentional switching costs in matrix data comparison tasks [44]. Gender differences also exist, females shopping via mobile apps prefer the linear guidance of list layouts, while males favor the high information density of matrix layouts [45], indicating that layout design must integrate user cognitive characteristics.

2.2. Visual Display Mode

Contrast polarity (i.e., the light-dark relationship between text and background) is a fundamental element of interface visual design [46]. In digital contexts, this property guides user attention through color contrast, directly impacting information acquisition efficiency [47]. Current mainstream display modes are categorized into two types: positive polarity (dark text on a light background, known as “light mode”) and negative polarity (light text on a dark background, known as “dark mode”) [48]. Notably, negative polarity is often perceived as presenting finer-grained visual information due to its white-on-black combination. However, extensive empirical research demonstrates that positive polarity generally offers superior task performance advantages.
Contrast polarity within visual display modes is a critical factor influencing user task performance and visual comfort. Systematic reviews identify high brightness contrast and positive polarity as primary design principles for visual comfort on digital devices [49]. In mixed reality environments, positive polarity significantly enhances text reading speed and response accuracy, and users subjectively prefer it [50]. This superiority stems from higher luminance contrast enhancing visual acuity. In icon recognition tasks, positive polarity combined with 80% saturation reduces visual search time [51], while desktop head-up display using positive polarity cause significantly less visual fatigue and discomfort than negative polarity [52].
However, the polarity effect exhibits sensitivity to individual differences and task types. Cross-age group visualization analysis indicates that approximately 45% of users, especially those over 60, perform better with negative polarity [53], revealing a misalignment between user preference and actual performance. In 360° panoramic shopping interfaces, negative polarity annotations with 25% transparency facilitate information search, yet users still predominantly prefer positive polarity designs, suggesting functional optimization requires balancing user habits with objective needs [54].
In prolonged usage scenarios, polarity choice is crucial for visual health. Both polarities reduce accommodative amplitude and cause visual fatigue, but symptoms are milder with positive polarity [55]. In summary, positive polarity demonstrates performance generality for most tasks, but design should flexibly incorporate transparency, device type and user differences, with dual-mode support being a potential optimization direction.

3. Research Methods

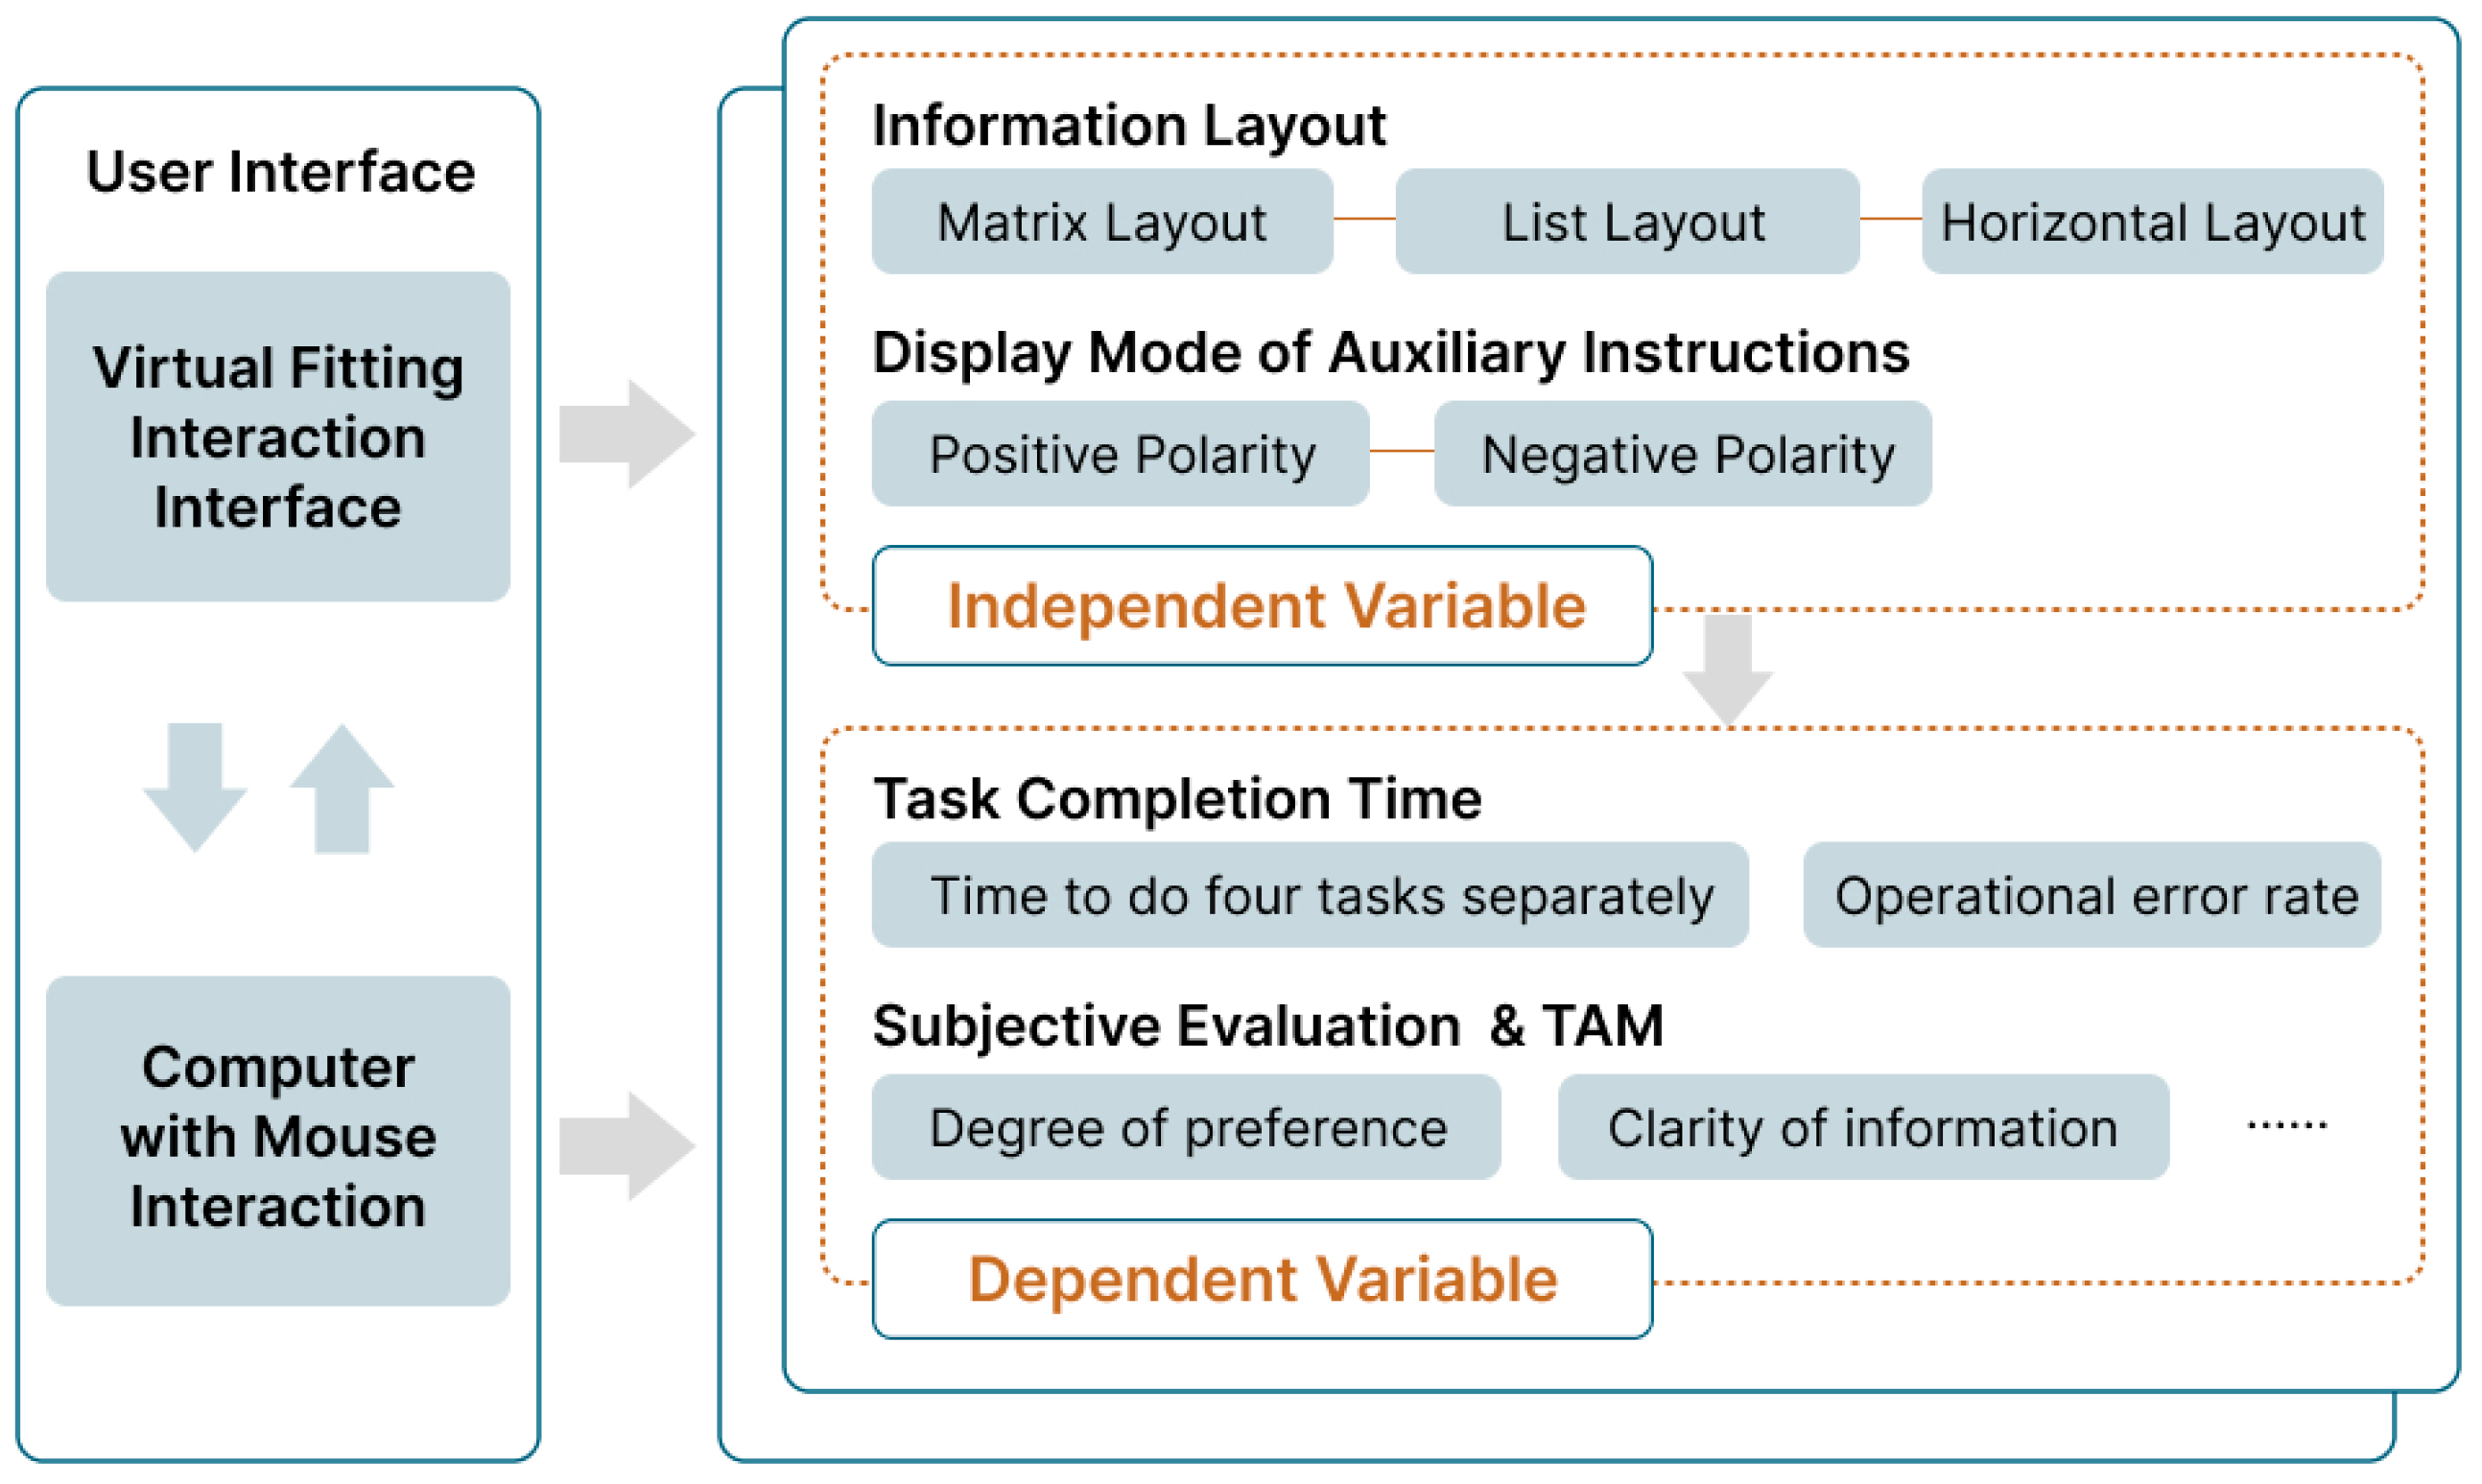
This study investigates the effects of information layout and the auxiliary instruction display mode on participants’ operational performance and subjective experiences when interacting with a virtual try-on system. The interface and interaction paradigm were designed to simulate the experience of using intelligent virture fitting terminals (e.g., large-screen intelligent virtual fitting mirrors or interactive kiosks). A 2 × 3 between-subjects experimental design was employed. The independent variables were information layout (matrix layout, list layout, horizontal layout) and auxiliary instruction display mode (positive polarity, negative polarity). The dependent variables were participants’ operational performance and subjective evaluations.
The study was designed to address the following six research questions. First, from the perspective of objective experimentation, does the information layout have a significant main effect on task completion performance in virtual try-on tasks? Second, also based on objective experimentation, does the auxiliary instruction display mode have a significant main effect on task completion performance in virtual try-on tasks? Third, regarding subjective evaluation, does the information layout have a significant main effect on participants’ subjective evaluations of the virtual try-on experience? Fourth, in terms of subjective evaluation as well, does the auxiliary instruction display mode have a significant main effect on participants’ subjective evaluations of the virtual try-on experience? Fifth, from an objective experimental standpoint, is there a significant interaction effect between information layout and auxiliary instruction display mode on participants’ task completion time? Sixth, focusing on subjective evaluation, is there a significant interaction effect between information layout and auxiliary instruction display mode on participants’ subjective evaluations?

3.1. Participants

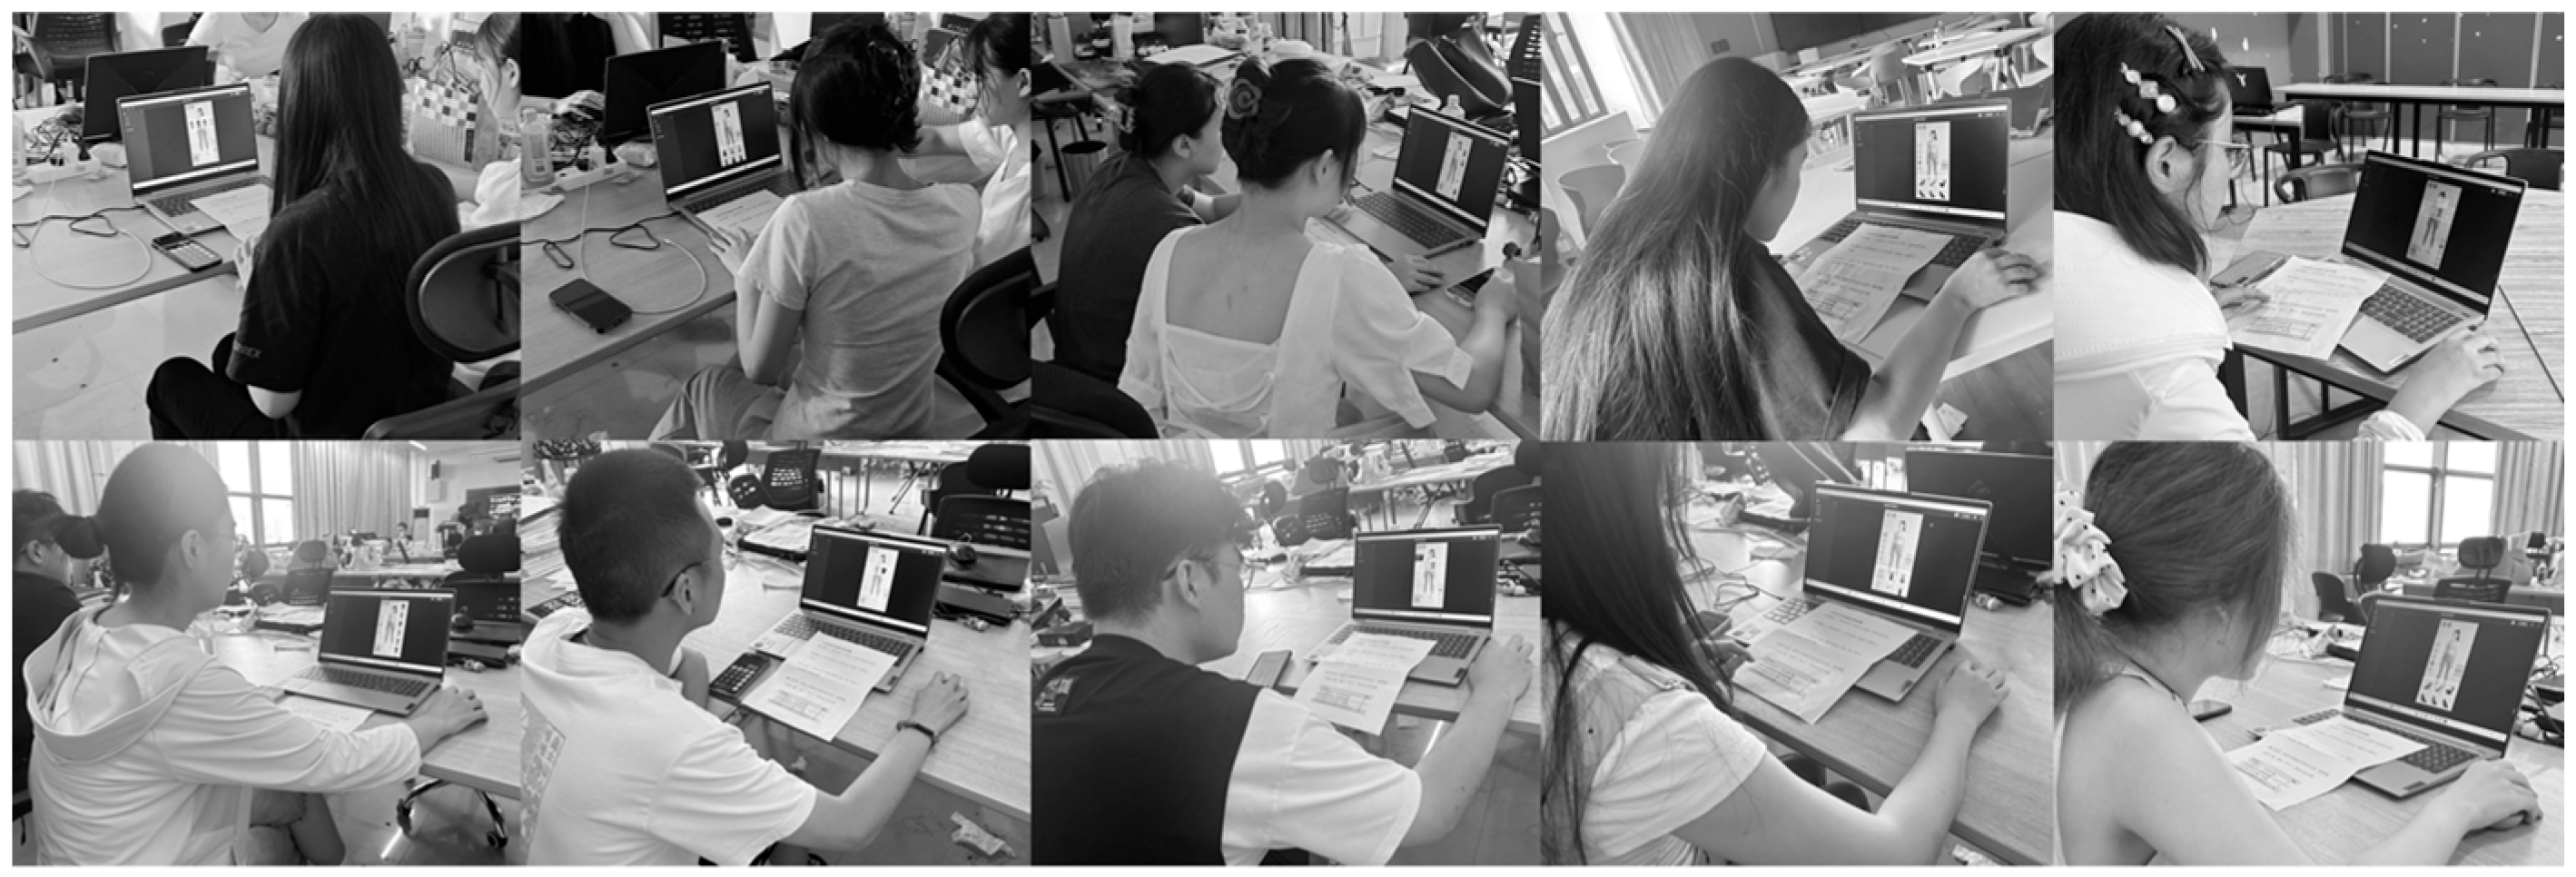
Sixty participants were recruited using a convenience sampling method. All participants completed the experimental tasks independently in a laboratory setting, ensured to be quiet and free from external distractions. The sample consisted of 33 females and 27 males, predominantly aged between 18 and 30 years. Forty-two participants (70%) were undergraduate students, and 18 participants (30%) were Master’s students. All participants possessed basic computer operation skills and internet usage experience. Regarding the virtual try-on experience, 38 participants (63%) reported prior use of virtual try-on interfaces on online shopping platforms, while 22 participants (37%) had no prior experience. However, all participants confirmed understanding the experimental task requirements. All participants had normal or corrected-to-normal vision and no color vision deficiency, enabling them to clearly discern text and graphical information on the interface. Prior to the experiment, participants provided informed consent after being briefed on the purpose, procedures, and data usage. They also completed a basic demographic questionnaire. Participants were randomly assigned to one of six experimental groups with 10 participants in each group. No significant differences existed between groups in terms of demographic characteristics or virtual try-on experience. The experimental procedure is illustrated in Figure 1 and lasted approximately 15 min. Upon completion, each participant received monetary compensation as a token of appreciation for their participation.

3.2. Experimental Design and Prototype

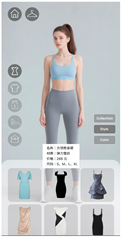
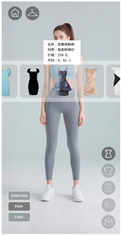
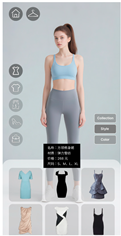
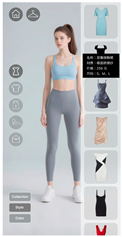
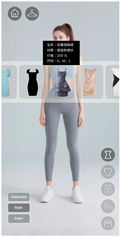
As shown in Table 1, six virtual try-on interaction prototypes were designed in Figma. These prototypes represented all combinations of the three information layouts and the two auxiliary instruction display modes. The three information layouts were: matrix layout, list layout, and horizontal layout. The two levels of the auxiliary instruction display mode were positive polarity (white background with black text) and negative polarity (black background with white text). To control for potential confounding effects, the font size, line spacing, and pop-up window position were kept consistent across the two display modes. The basic interface framework remained uniform across all prototypes, comprising four main modules: top function icons, a side clothing category navigation area, a central try-on preview area, and an auxiliary instructions pop-up window. Differences existed solely in the information layout and the text/background color scheme of the auxiliary instructions pop-up window.
Each prototype included five clothing categories (dresses, tops, pants, shoes, backpacks), with 15 items per category, totaling 75 items. Long-pressing an item triggered the display of an auxiliary instructions pop-up window containing information such as name, material, price, and size.
The prototype interface was designed to simulate the interaction experience of large-screen intelligent virtual fitting terminals, such as smart fitting mirrors. These systems are typically viewed from a distance and operated via indirect methods like a handheld remote control or gesture recognition. The experiment was conducted on standardized laptops to simulate the large display of a smart virture fitting terminal. A standard computer mouse was used to accurately simulate the action of such a remote and gesture recognition, ensuring precise measurement of task performance. All tasks were performed on a computer. The experiment utilized uniform Lenovo Xiaoxin Air 15 laptops running the prototypes on the Windows 11 desktop environment. The screen resolution was standardized to 1920 × 1080 pixels to ensure environmental consistency. Task completion time was recorded using screen recording software during the experiment. Subjective evaluation questionnaires were collected after the tasks.

3.3. Experimental Procedure

A between-subjects experimental design was implemented. Participants were randomly assigned to one of the six groups based on the 2 × 3 factorial combination. Before the experiment commenced, participants received a clear explanation of the research purpose and operational procedures. After signing the informed consent form, participants completed a questionnaire covering demographic information (gender, age, educational background) and prior experience with virtual try-on interfaces. Subsequently, the experimental tasks were explained in detail. Guided by Cognitive Load Theory, the four experimental tasks were designed to form a graded series that systematically increases cognitive demand (see Table 2). Task 1 (Locate material information) served as a low-intrinsic load baseline, assessing basic visual search efficiency. Task 2 (Identify multiple items) increased germane load by requiring a multi-target search and comparison. Task 3 (Calculate total price) introduced high intrinsic load by requiring information location and numerical calculation, heavily taxing working memory. Task 4 (Calculate price of an outfit combination) further escalated demand by requiring information location and complex comparative analysis, simulating high-level decision-making.
During the testing phase, participants operated the virtual try-on interface via the Figma prototype on a computer, using mouse actions (scrolling, clicking) to complete the tasks. Task completion time was recorded using screen recording software. After completing all tasks, participants filled out a subjective evaluation questionnaire regarding the task operation experience, which used a 7-point Likert scale (1 = “Very Dissatisfied”, 7 = “Very Satisfied”). Subsequently, they completed the Technology Acceptance Model scale, which was administered using the standard 5-point Likert format to align with common practice in the literature. The data from these two instruments were analyzed separately. Finally, a semi-structured interview was conducted to gather participants’ operational feelings, encountered problems, and personal suggestions, aiming to delve deeper into the experiential details underlying the quantitative data. The research model is depicted in Figure 2.

4. Results and Discussion

Statistical analysis was conducted using a two-way analysis of variance (Two-way ANOVA). The independent variables were information layout and auxiliary instruction display mode. The dependent variables were participants’ operational performance (task completion time, operation error rate) and subjective evaluations. The main effects and interaction effects of the two independent variables on operational performance and subjective evaluations were examined using IBM SPSS Statistics 27. The significance level (alpha) was set at 0.05.

4.1. Analysis of Objective Performance

This study investigated the impact of different combinations of information layout and auxiliary instruction display mode on user operational efficiency in virtual try-on interactions by comparing participants’ task completion time performance.
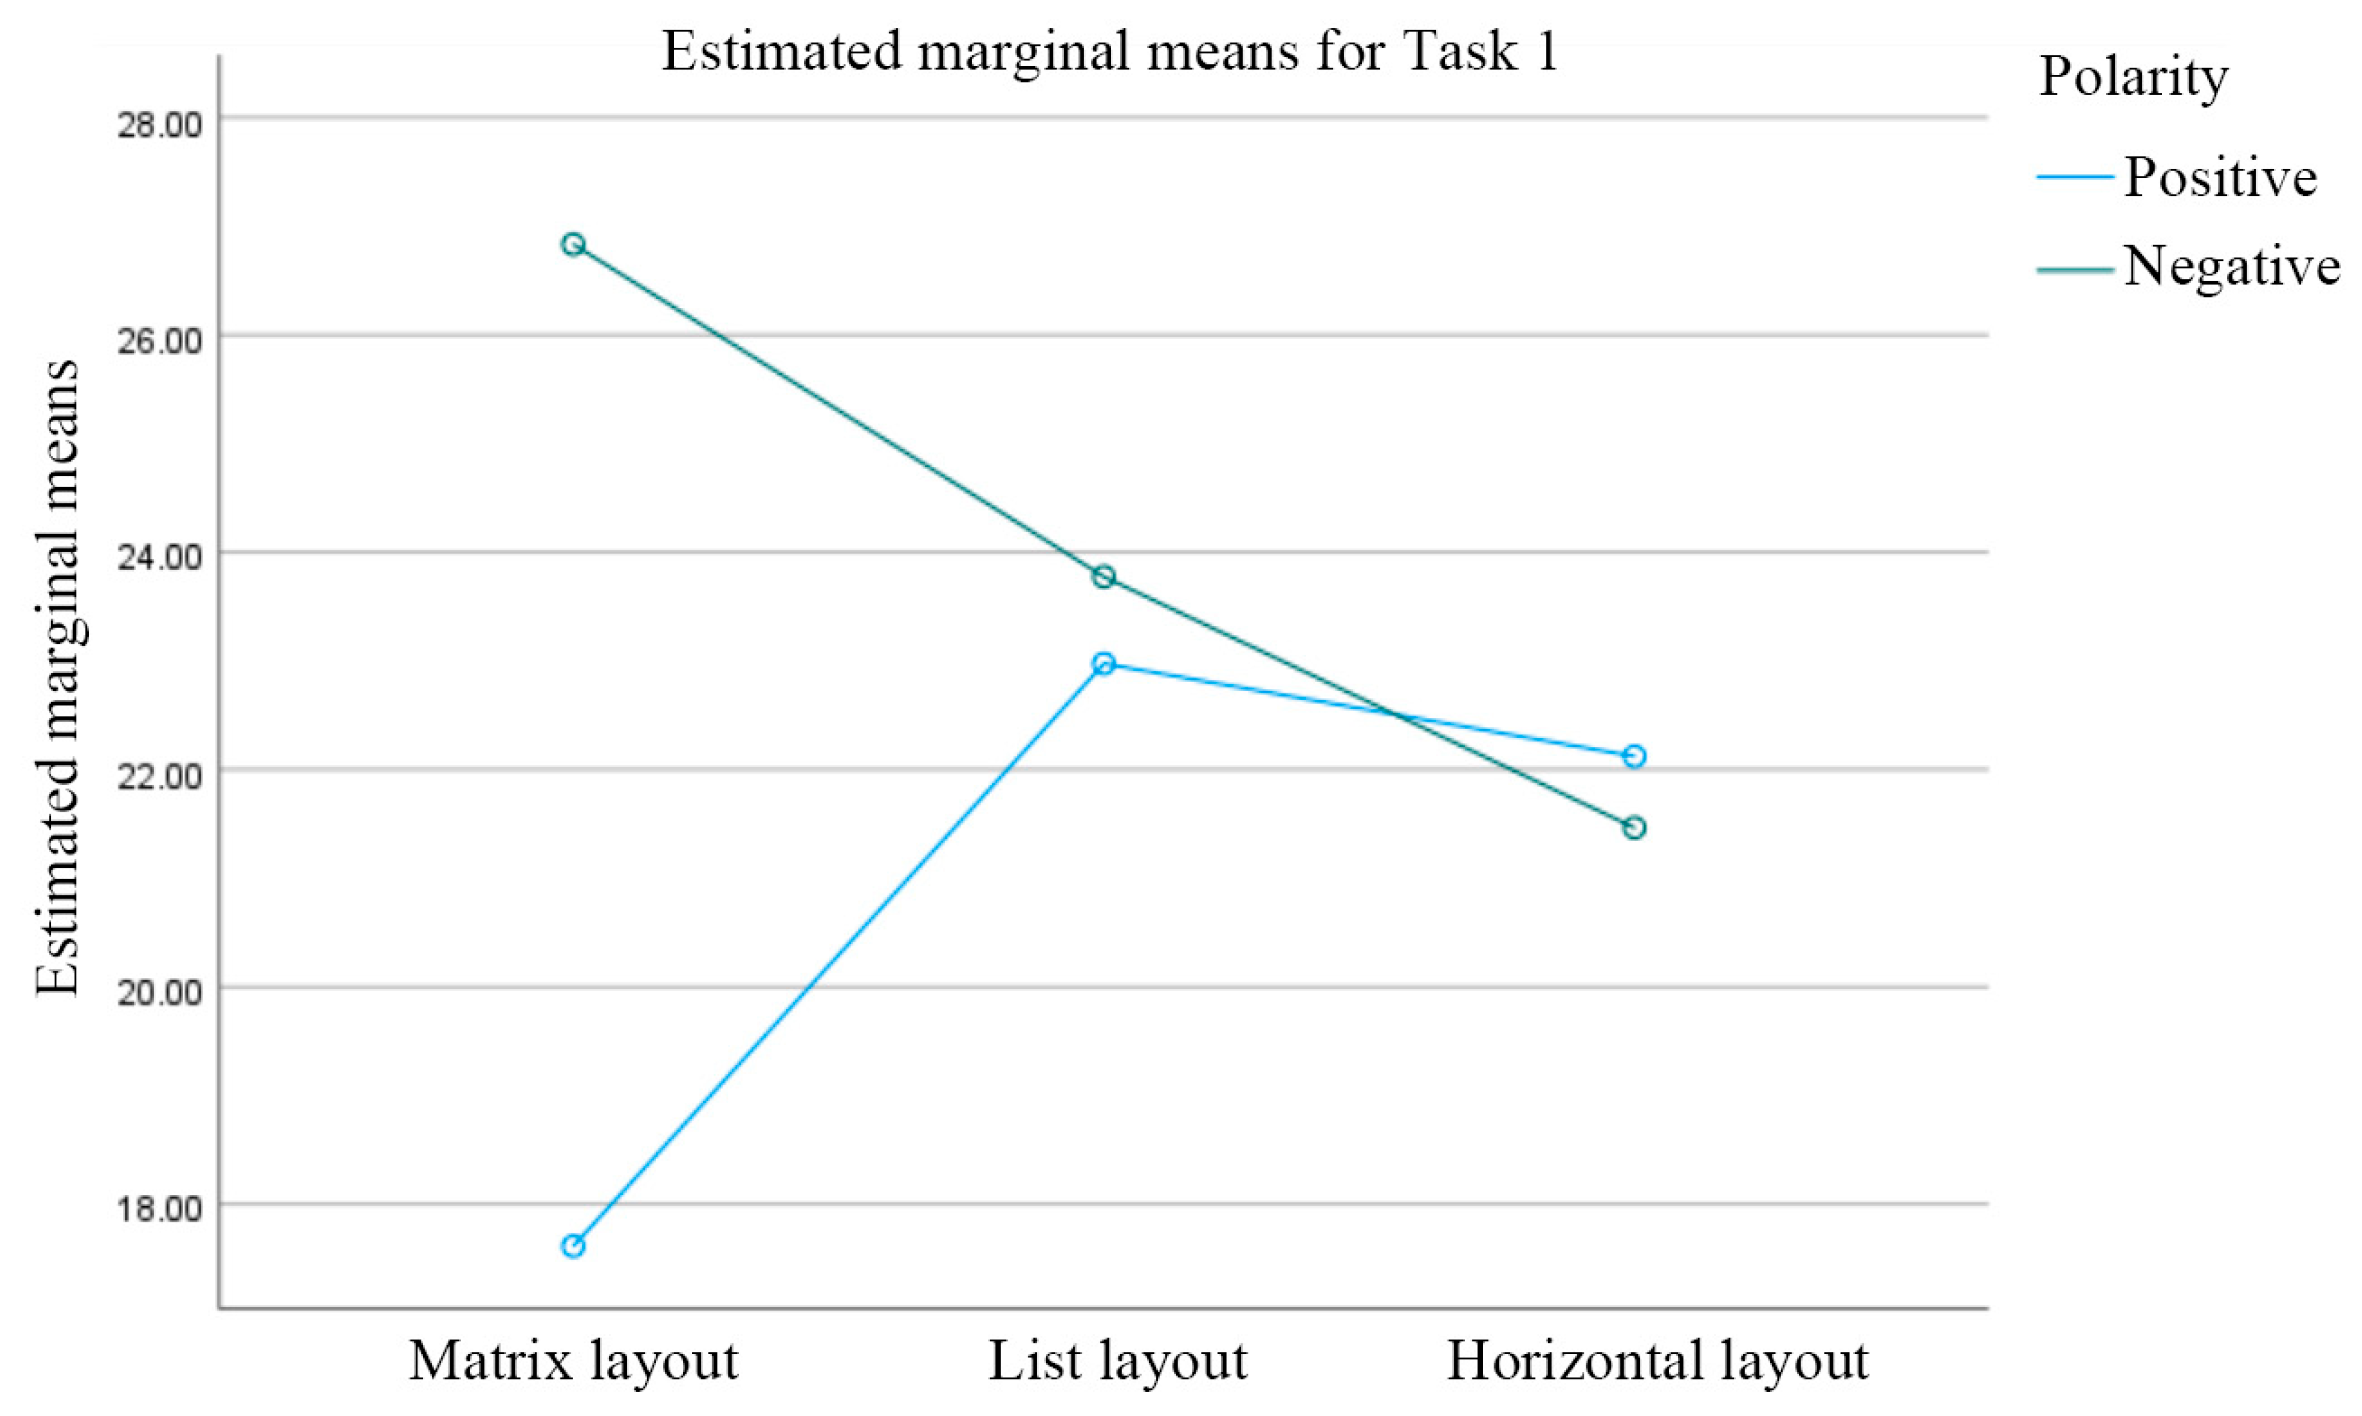
As shown in Table 3, the main effect of information layout on Task 1 completion time was not significant (F(2,54) = 0.401, p = 0.671 > 0.05, η2 = 0.015). However, the main effect of auxiliary instruction display mode was significant (F(1,54) = 4.387, p = 0.041 < 0.05, η2 = 0.075). Completion time was shorter with positive polarity (M = 20.905 s, SD = 6.210) than with negative polarity (M = 24.026 s, SD = 5.846). This suggests that positive polarity facilitates faster capture of single information items. As illustrated in Figure 3, a significant interaction effect was found between information layout and auxiliary instruction display mode on Task 1 completion time (F(2,54) = 4.268, p = 0.019 < 0.05, η2 = 0.136). Simple effects analysis revealed that under the matrix layout, positive polarity (M = 17.615 s, SD = 5.705) led to faster completion times than negative polarity (M = 26.835 s, SD = 7.200). Conversely, under the horizontal layout, there was no significant difference between positive polarity (M = 22.123 s, SD = 6.463) and negative polarity (M = 21.466 s, SD = 5.248). This suggests that positive polarity substantially enhances search efficiency when information is presented in a matrix layout. This may be due to a visual synergy between the layout’s inherent regularity and the text presentation.
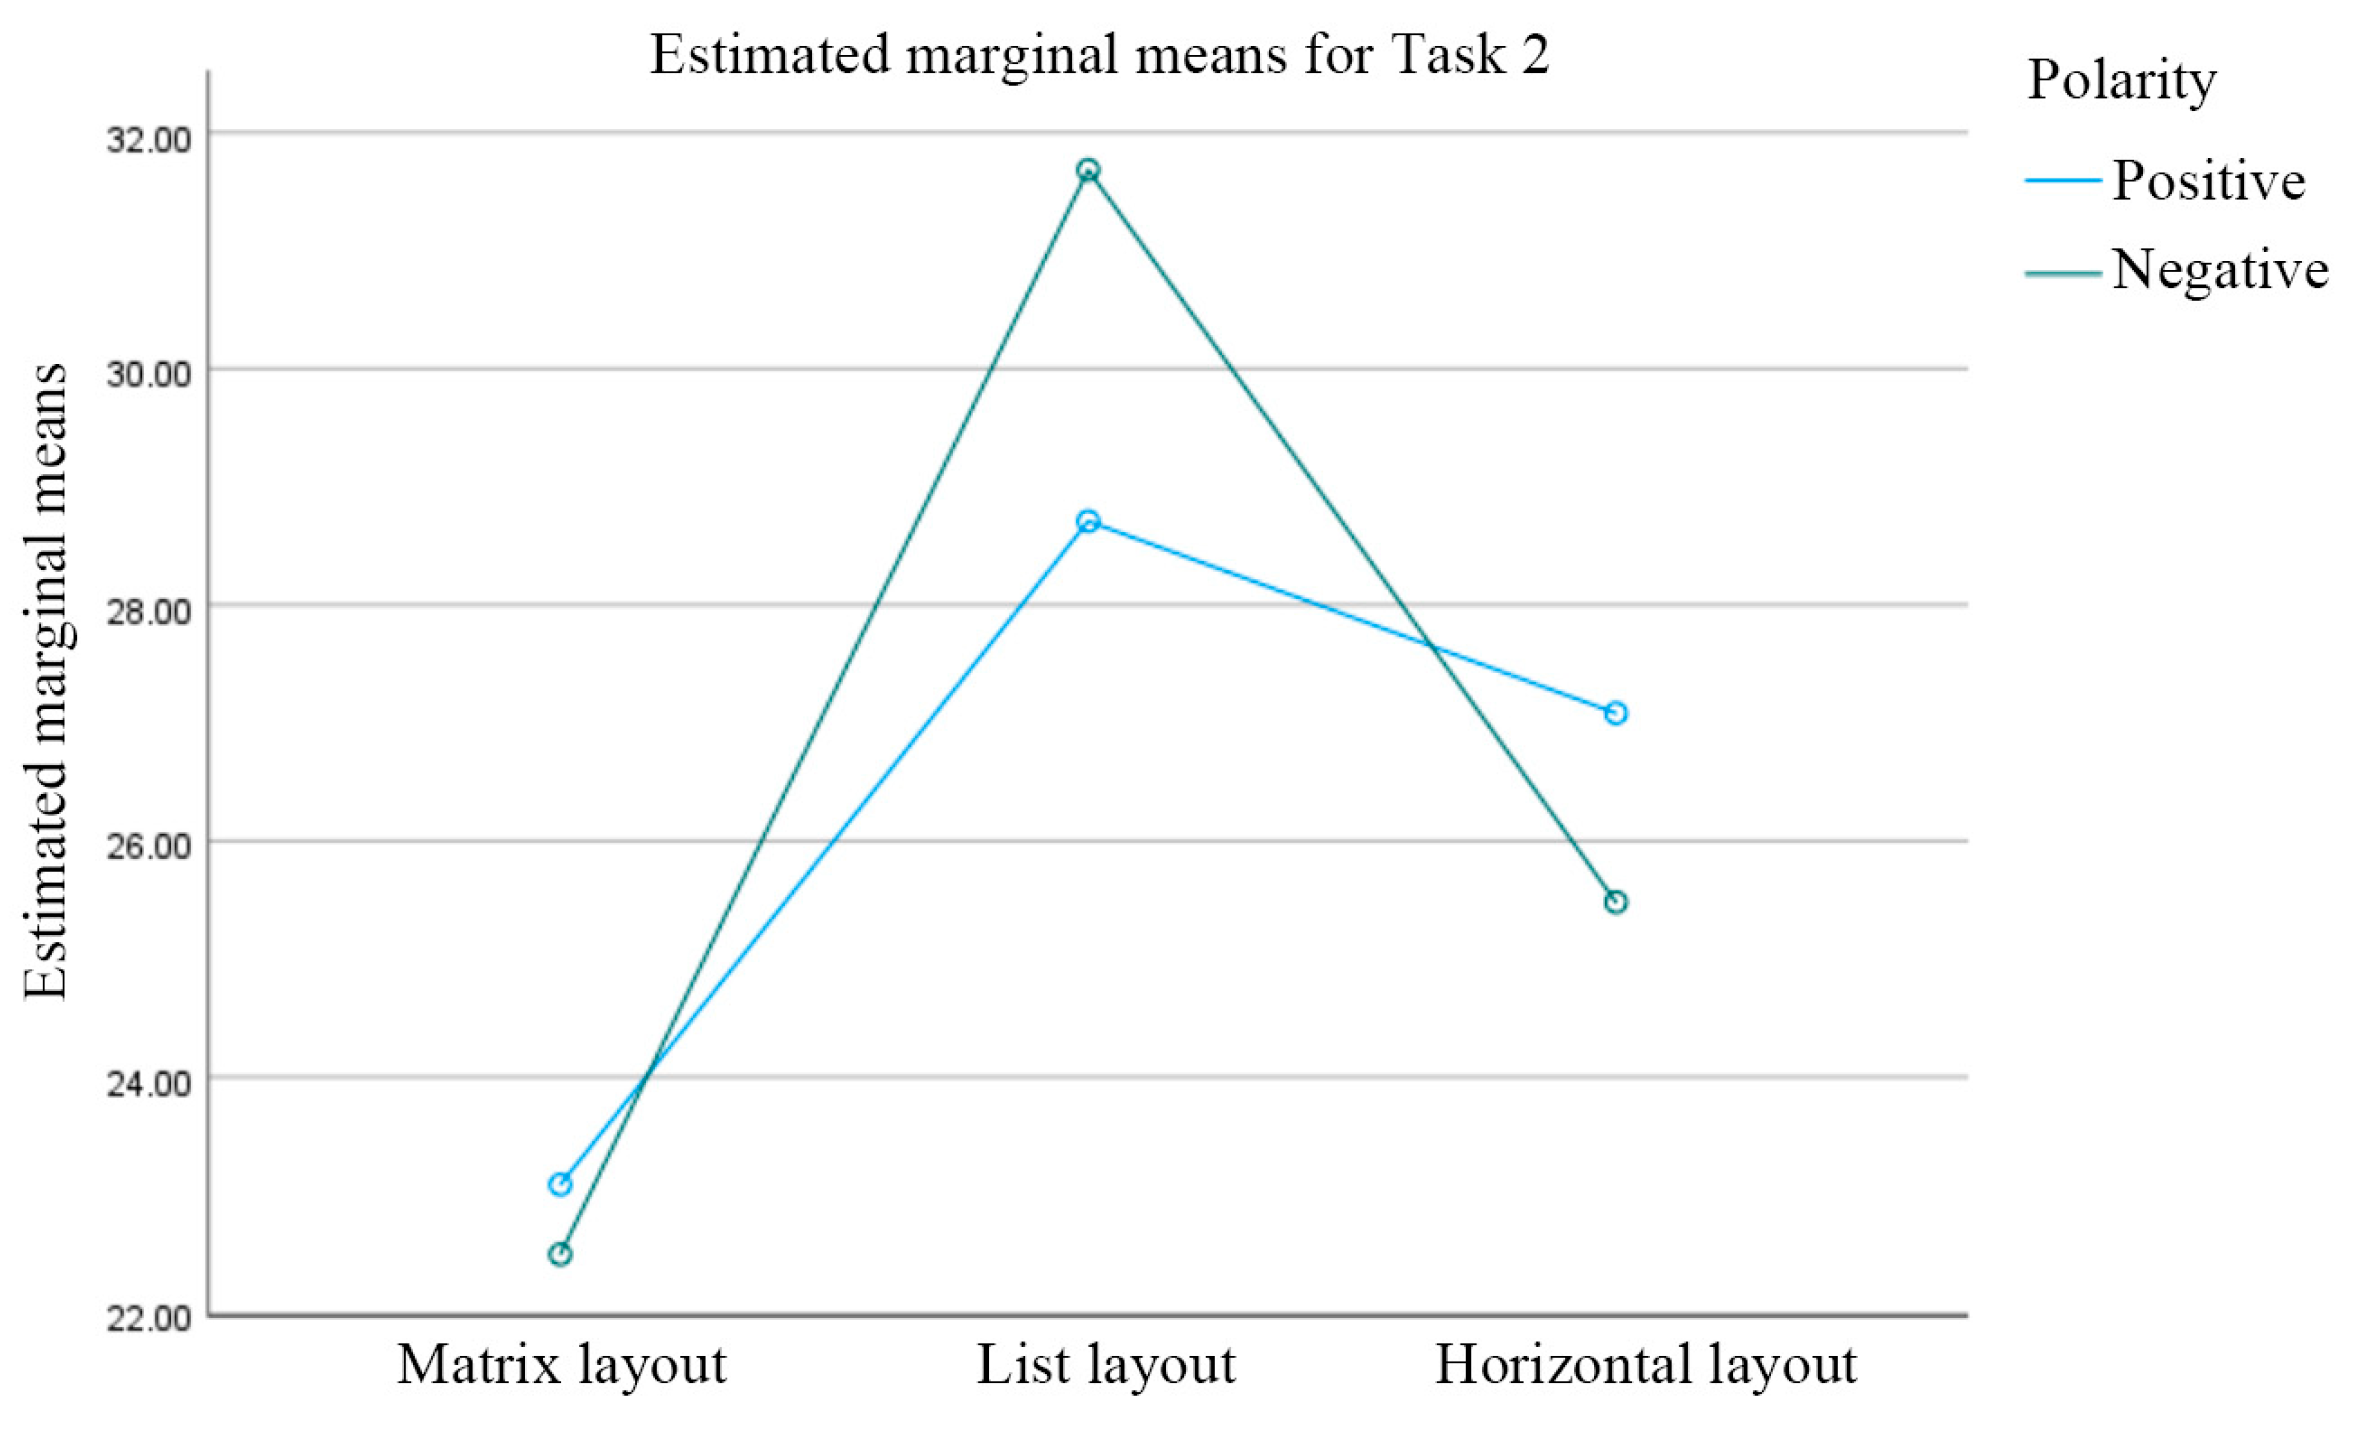
As shown in Table 4, the main effect of information layout on Task 2 completion time was significant (F(2,54) = 9.218, p < 0.001, η2 = 0.255). The matrix layout (M = 22.796 s, SD = 4.169) was 32.5% faster than the list layout (M = 30.198 s, SD = 7.297) and 15.3% faster than the horizontal layout (M = 26.283 s, SD = 4.126). LSD tests indicated a significant difference between the matrix layout and list layout (p < 0.001) and a significant difference between the matrix layout and horizontal layout (p = 0.048). Notably, under the matrix layout, efficiency remained high regardless of display mode (positive polarity: M = 23.091 s, SD = 5.270; negative polarity: M = 22.500 s, SD = 2.955), while the list layout with negative polarity took the longest (M = 31.685 s, SD = 7.294). The main effect of display mode was not significant (F(1,54) = 0.034, p = 0.853 > 0.05, η2 = 0.001). As shown in Figure 4, there was no significant interaction effect between information layout and display mode (F(2,54) = 0.971, p = 0.385 > 0.05, η2 = 0.035). The result indicates that the matrix layout reduces visual search load through spatial grouping. This is particularly beneficial for multi-target information and helps mitigate the linear search limitations of the list layout. The lack of significant main and interaction effects for display mode suggests that its influence may be smaller when the information layout is effective.
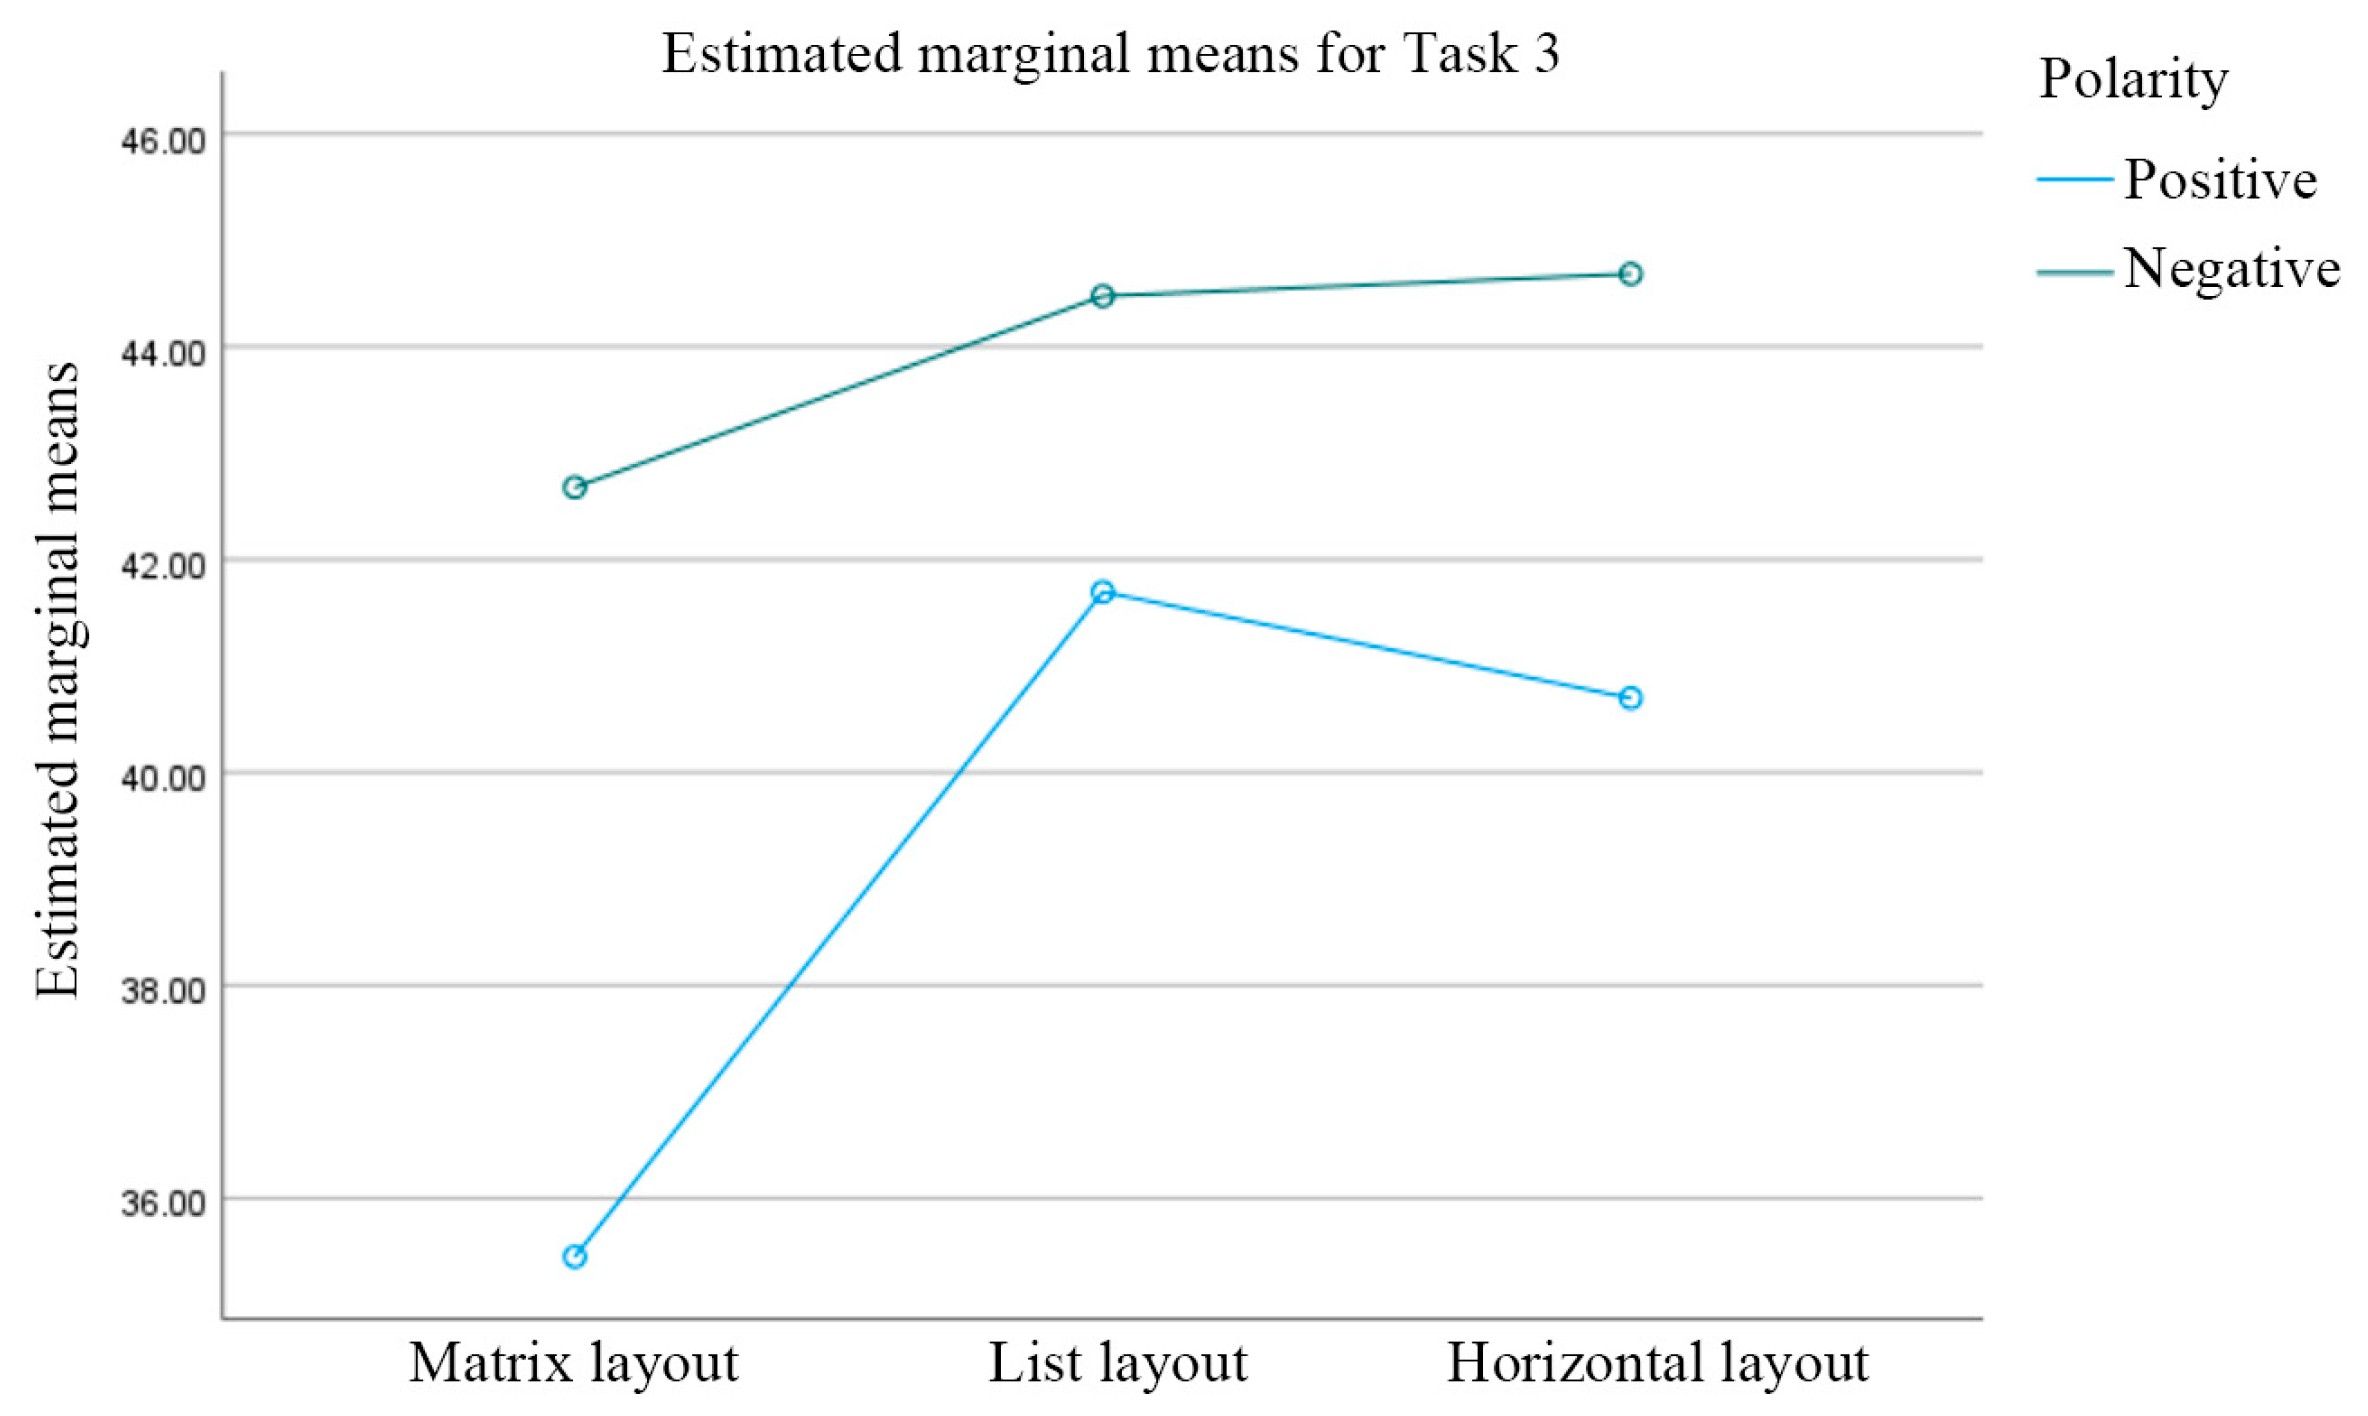
As shown in Table 5, the main effect of information layout on Task 3 completion time was not significant (F(2,54) = 1.265, p = 0.290 > 0.05, η2 = 0.045). The main effect of display mode was significant (F(1,54) = 4.200, p = 0.045 < 0.05, η2 = 0.072). Positive polarity (M = 39.282 s, SD = 10.002) was 11.9% faster than negative polarity (M = 43.946 s, SD = 7.297), indicating a clear advantage for white-on-black text in cognitively demanding calculation tasks. While the main effect of layout was not significant, the horizontal layout with positive polarity performed better (M = 40.699 s, SD = 11.328), and the list layout with negative polarity performed worse (M = 44.476 s, SD = 6.840). As shown in Figure 5, there was no significant interaction effect (F(2,54) = 0.341, p = 0.713 > 0.05, η2 = 0.012). Semi-structured interviews indicated that participants needed to cross-reference multiple pieces of information during calculation tasks. The high contrast of negative polarity (black background, white text), while improving single-text readability, caused visual afterimage effects during frequent gaze shifts, increasing numerical comparison errors. This explains why positive polarity remains more compatible with cognitive processing habits in tasks requiring working memory.
As shown in Table 6, the main effect of information layout on Task 4 completion time was significant (F(2,54) = 5.437, p = 0.007 < 0.05, η2 = 0.168). The matrix layout (M = 84.477 s, SD = 16.023) was 22.7% faster than the list layout (M = 103.805 s, SD = 25.959) and 16.5% faster than the horizontal layout (M = 98.388 s, SD = 17.260). The main effect of display mode was not significant (F(1,54) = 3.066, p = 0.086 > 0.05, η2 = 0.054). As illustrated in Figure 6, a interaction effect was found between information layout and display mode (F(2,54) = 3.383, p = 0.041 < 0.05, η2 = 0.111). Under the list layout, negative polarity took significantly longer (28.1%; M = 116.614 s, SD = 26.024) than positive polarity (M = 90.995 s, SD = 19.512). Conversely, under the horizontal layout, negative polarity (M = 95.669 s, SD = 11.355) was slightly faster (5.7%) than positive polarity (M = 101.106 s, SD = 21.989). This contrast suggests that high-contrast negative polarity exacerbates visual fatigue in vertically scrolling long lists (list layout), whereas the horizontal arrangement (horizontal layout) complements the local high contrast of negative polarity, enhancing information comparison efficiency. This finding supports Cognitive Load Theory, optimizing the match between layout and display mode can reduce working memory burden.

4.2. Analysis of Subjective Evaluations

Subjective evaluations were measured using a 7-point Likert scale (1 = Very Dissatisfied, 7 = Very Satisfied), assessing participants’ subjective feelings towards the virtual try-on interface, including dimensions like perceived reasonableness and preference. A two-way ANOVA was used to test the main effects and interaction effects of information layout (matrix layout, list layout, horizontal layout) and auxiliary instruction display mode (positive polarity, negative polarity), with significance level α = 0.05.
As shown in Table 7, the main effect of information layout on perceived reasonableness was not significant (F(2,54) = 1.172, p = 0.318 > 0.05, η2 = 0.042). The main effect of display mode was significant (F(1,54) = 5.678, p = 0.021 < 0.05, η2 = 0.095). Ratings were significantly higher for positive polarity (M = 5.37, SD = 1.07) than for negative polarity (M = 4.67, SD = 1.18). There was no significant interaction effect (F(2,54) = 0.270, p = 0.764 > 0.05, η2 = 0.010).
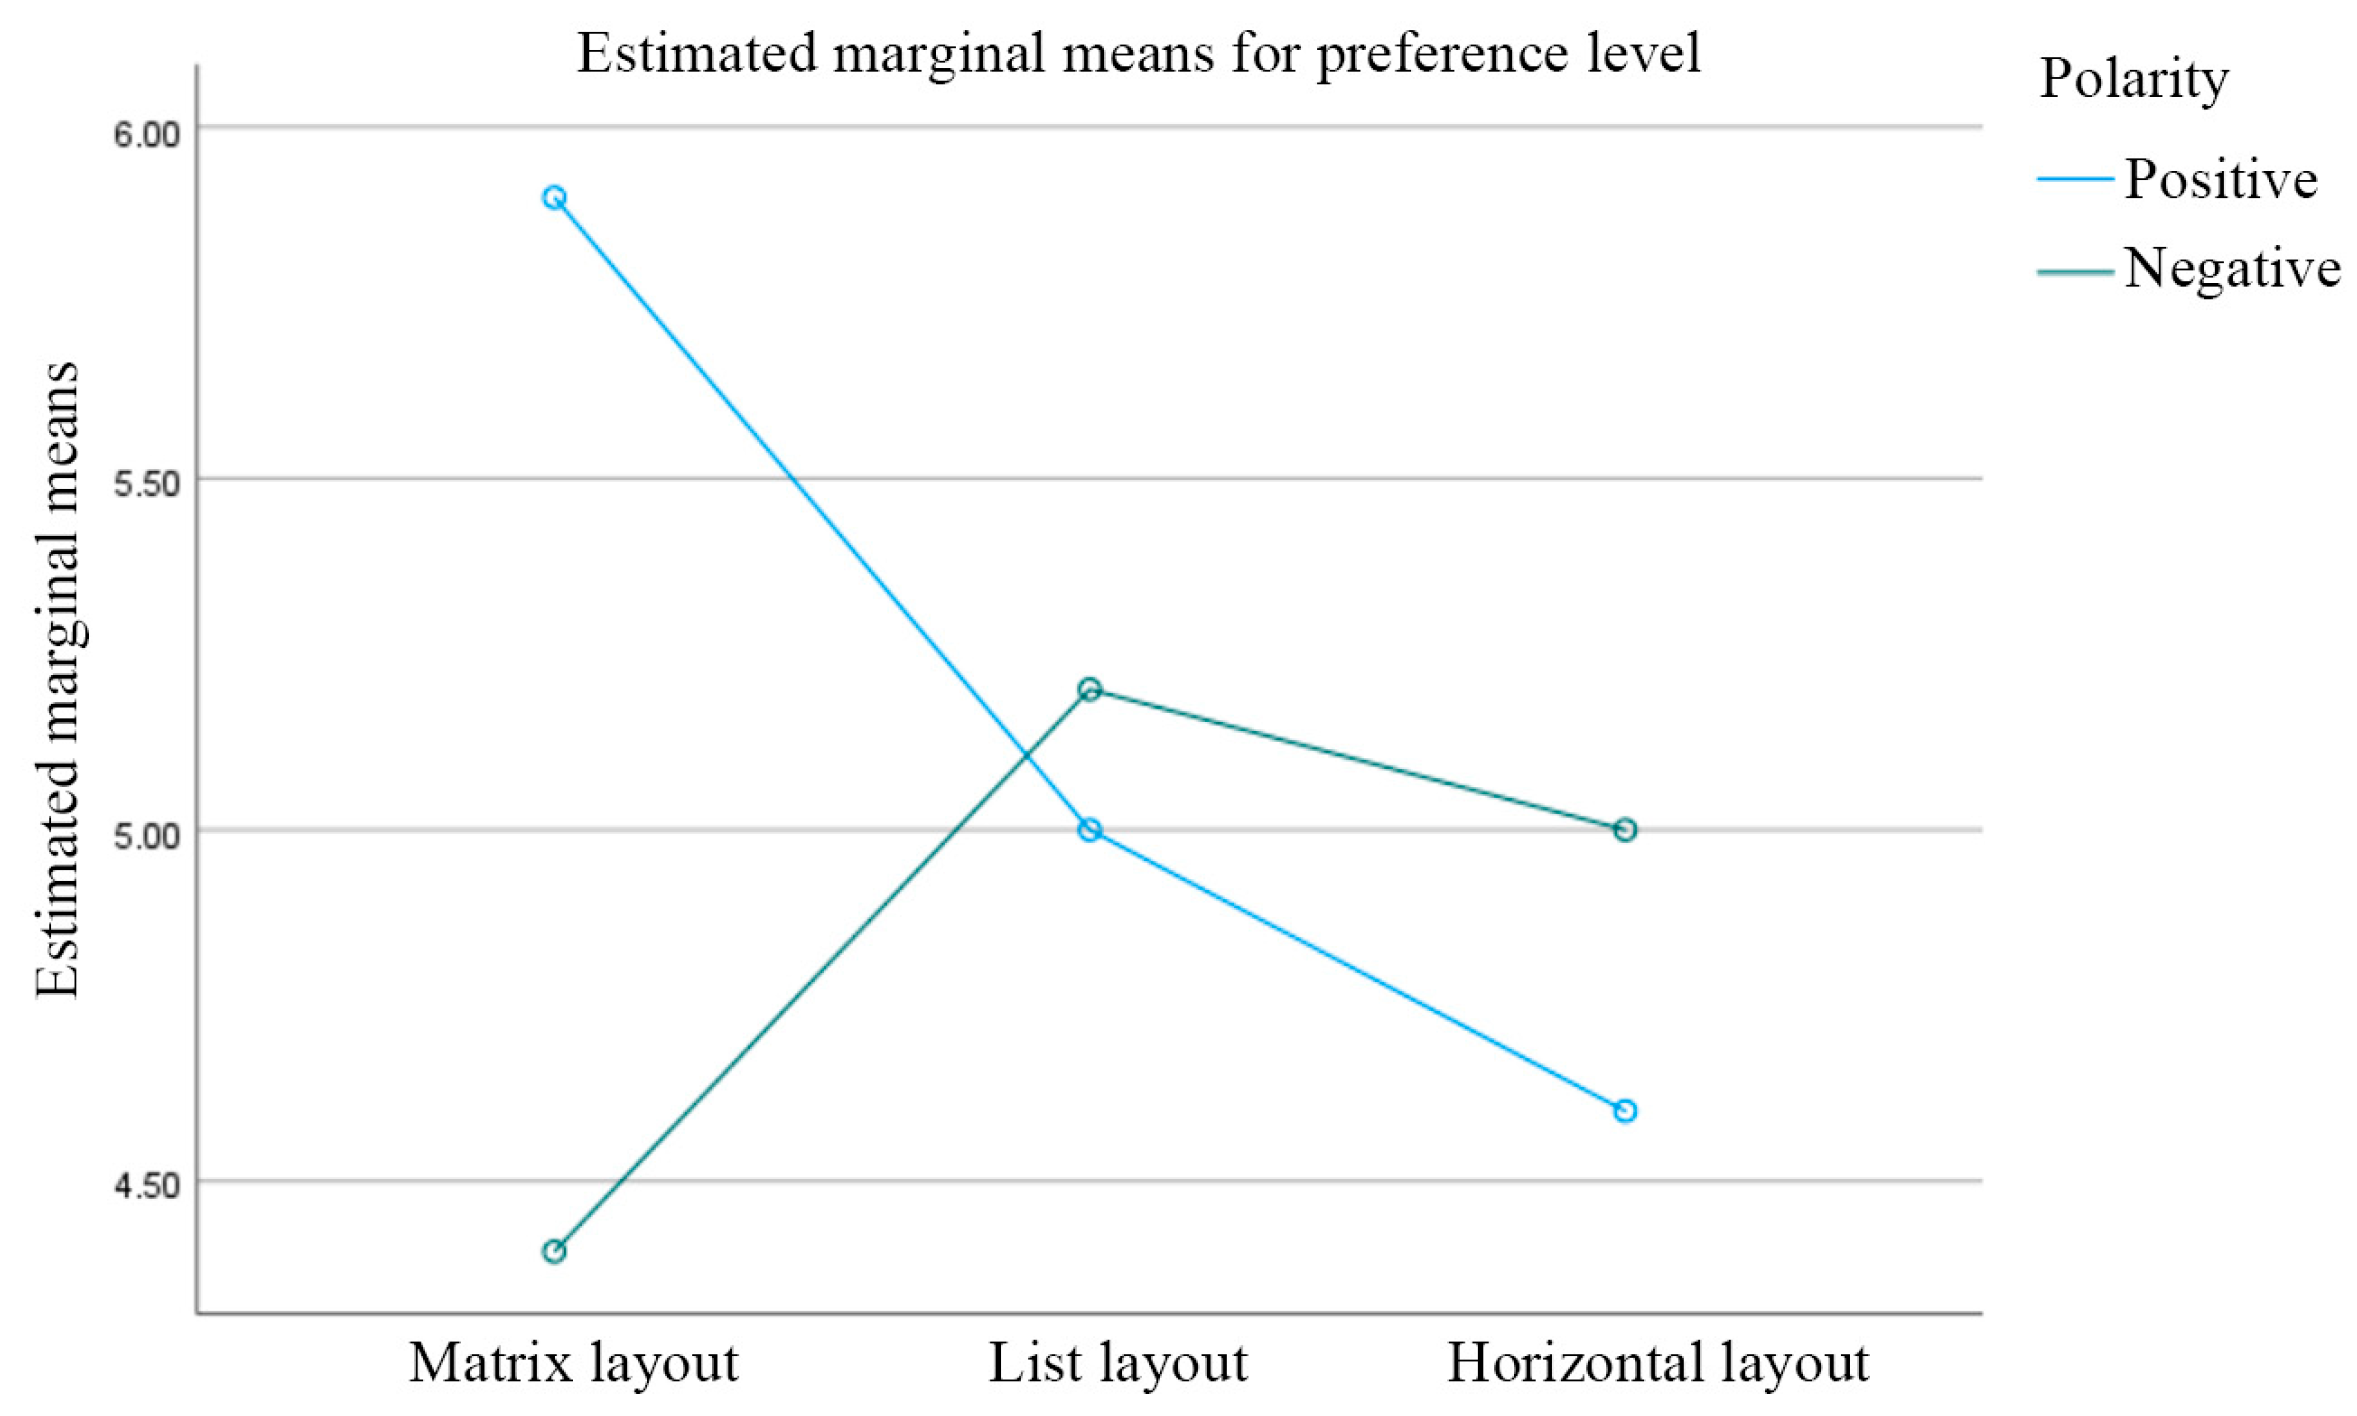
As shown in Table 8, the main effects of information layout (F(2,54) = 0.488, p = 0.617 > 0.05, η2 = 0.018) and display mode (F(1,54) = 0.919, p = 0.342 > 0.05, η2 = 0.017) on preference were not significant. As shown in Figure 7, a significant interaction effect was found (F(2,54) = 3.711, p = 0.031 < 0.05, η2 = 0.121). Under the matrix layout, preference for positive polarity (M = 5.90, SD = 0.876) was significantly higher than for negative polarity (M = 4.40, SD = 1.265). Conversely, under the list layout, preference was slightly higher for negative polarity (M = 5.00, SD = 0.817) than for positive polarity (M = 5.20, SD = 1.476), though this difference was not statistically significant in the simple effects analysis implied by the interaction.
The Technology Acceptance Model, proposed by Davis et al. [56,57], analyzes key factors influencing user acceptance of new technologies. Participants employed a 5-point Likert scale to assess based on Technology Acceptance Model dimensions, including perceived ease of use and information clarity.
As shown in Table 9, the main effect of information layout on perceived ease of use was significant (F(2,54) = 4.693, p = 0.013 < 0.05, η2 = 0.148). The horizontal layout received the lowest ratings (M = 3.35, SD = 0.988), significantly lower than the matrix layout (M = 4.20, SD = 0.951; p = 0.004) and marginally lower than the list layout (M = 3.85, SD = 0.587; p = 0.079). The main effect of display mode (F(1,54) = 0.343, p = 0.561 > 0.05, η2 = 0.006) and the interaction effect (F(2,54) = 0.021, p = 0.979 > 0.05, η2 = 0.001) were not significant.
As shown in Table 10, the main effect of information layout on information clarity approached significance (F(2,54) = 2.682, p = 0.078 > 0.05, η2 = 0.090), with the matrix layout scoring highest (M = 4.15, SD = 0.745) and the horizontal layout lowest (M = 3.65, SD = 0.875). The main effect of display mode was significant (F(1,54) = 12.741, p = 0.001 < 0.05, η2 = 0.191). Positive polarity (M = 4.23, SD = 0.626) was rated significantly higher for comprehension efficiency than negative polarity (M = 3.60, SD = 0.770). The interaction effect was not significant (F(2,54) = 0.565, p = 0.572 > 0.05, η2 = 0.020).

4.3. Discussion

4.3.1. Analysis of Task Completion Time

Analysis of objective performance metrics for task operations revealed that for multi-target search tasks (Task 2) and complex decision-making tasks (Task 4), operational efficiency was higher with the matrix layout than with the list or horizontal layouts. The main effect of information layout had a significant influence on operational efficiency in virtual try-on tasks. This answers the first research question: Different information layouts have a significant main effect on participants’ task completion performance in virtual try-on tasks. In multi-target search tasks, the spatially structured characteristics of the matrix layout appears to reduce the cognitive load associated with visual search for multiple targets. Its operational efficiency was 32.5% higher than the list layout and 15.3% higher than the horizontal layout, supporting the optimization effect of the Gestalt principle of proximity on integrating dispersed information [58]. In complex decision-making tasks involving cross-category price comparisons, the matrix layout continued to demonstrate a 22.7% efficiency advantage, as its two-dimensional spatial mapping capability effectively shortened users’ visual scanning paths during multi-attribute decision-making. Notably, the main effect of layout was not significant in single-target search or numerical calculation tasks, indicating that when task goals are highly focused, the structural benefits of the layout are diluted by target salience. This suggests that the effect of interface design may depend on the type of task.
In single-information search tasks (Task 1) and cognitively intensive tasks (Task 3), positive polarity (white background, black text) for auxiliary instructions significantly outperformed negative polarity (black background, white text), with its high-contrast properties accelerating target acquisition. This answers the second research question: Different display modes of auxiliary instructions have a significant main effect on participants’ task completion performance in virtual try-on tasks. In the single-information search task, the positive polarity interface improved computational efficiency by 11.9%, confirming its role in promoting sustained attention. The main effect of display mode exhibited systematic patterns in specific task contexts. The positive polarity design reduced operation time by 15.1% in single-information capture tasks. The underlying mechanism may relate to pupil size: bright backgrounds induce smaller pupils, thereby enhancing visual acuity [59]. In cognitively intensive price calculation tasks, the positive polarity interface improved efficiency by 11.9%, likely attributable to reduced pupil adjustment frequency in a white background environment, maintaining the continuity of working memory. This objective performance pattern was corroborated by qualitative feedback. Several participants in the negative polarity condition reported visual discomfort and ‘afterimage effects’ during frequent gaze shifts between numerical values, which aligns with the increased error rate and completion time.
Significant interaction effects between information layout and display mode were observed in single-information search tasks (Task 1) and complex decision-making tasks (Task 4), revealing the non-linear characteristics of synergistic effects between design elements. This answers the fifth research question: The interaction between information layout and the visual design of auxiliary instructions has a significant effect on participants’ task completion time. Under the matrix layout, the acceleration effect of positive polarity on single-information search was substantial. This synergy arises because the structured space amplifies the perceptual advantage of the high-contrast text, creating a strong visual focus. The matrix layout confines the target location scope, while positive polarity enhances local salience, reinforcing attentional capture through feedforward neural mechanisms [60]. In contrast, a reversal effect occurred under the list layout: the negative polarity background prolonged operation time by 28.1% in complex decision tasks. The mechanism lies in the black background disrupting interface continuity, and the combination of a dark background with a loosely structured layout causing visual fragmentation. The horizontal layout exhibited a buffering effect on the display mode, showing no significant differences in Tasks 1 and 4. Its fluid, linear visual flow weakens the boundary effects of the display mode.

4.3.2. Analysis of Subjective Perceptions

Experimental data indicated a significant main effect of information layout on the perceived ease of use dimension. This answers the third research question: Different information layouts have a significant main effect on participants’ subjective evaluations of the virtual try-on experience. Within the perceived ease of use dimension, the main effect of information layout was significant. The horizontal layout received significantly lower perceived ease of use ratings than the matrix layout and list layout. This is closely related to the interaction logic of the horizontal layout: horizontal scrolling increases the step cost of information switching. Users frequently need to adjust their viewing angle to obtain complete information, leading to a perception of reduced operational fluency. The spatial organization of the matrix layout and list layout aligns better with users’ cognitive expectations of product information and operational paths; the list layout better supports browsing tasks, while the matrix layout favors search tasks [61]. The matrix layout significantly enhanced users’ perceived operational fluency due to its spatial organization characteristics, consistent with the Gestalt principle of proximity. Visual grouping of adjacent elements reduces the parsing complexity of interface elements. Conversely, the horizontal layout, enforcing a linear browsing mode, caused visual flow discontinuity, leading to cumulative motor load for users. This aligns with predictions from Fitts’ Law in interaction, where frequent direction changes increase operational time costs [62]. Qualitative comments supported this result, with users describing the horizontal layout as ‘requiring more effort to scroll and see everything, which directly reflects higher extraneous cognitive load. Notably, no significant differences were found among the three layouts regarding perceived interface reasonableness and information clarity, suggesting that user acceptance of spatial organization depends more on operational load than cognitive comprehension.
The auxiliary instruction display mode produced significant main effects on both perceived interface reasonableness and information clarity dimensions. This answers the fourth research question: Different visual designs of auxiliary instructions have a significant main effect on participants’ subjective evaluations of the virtual try-on experience. In both reasonableness and information clarity dimensions, ratings were significantly higher for positive polarity than for negative polarity. This is directly related to the visual comfort characteristics of positive polarity. The lower contrast of white-on-black text reduces over-activation of the visual system and minimizes visual fatigue during prolonged reading. Qualitative analysis of semi-structured interviews further revealed that for negative polarity interfaces, small fluctuations in contrast parameters, if not adapted to the subjective perception laws of the human eye, can cause large changes in perceived clarity, leading to visual discomfort [63].
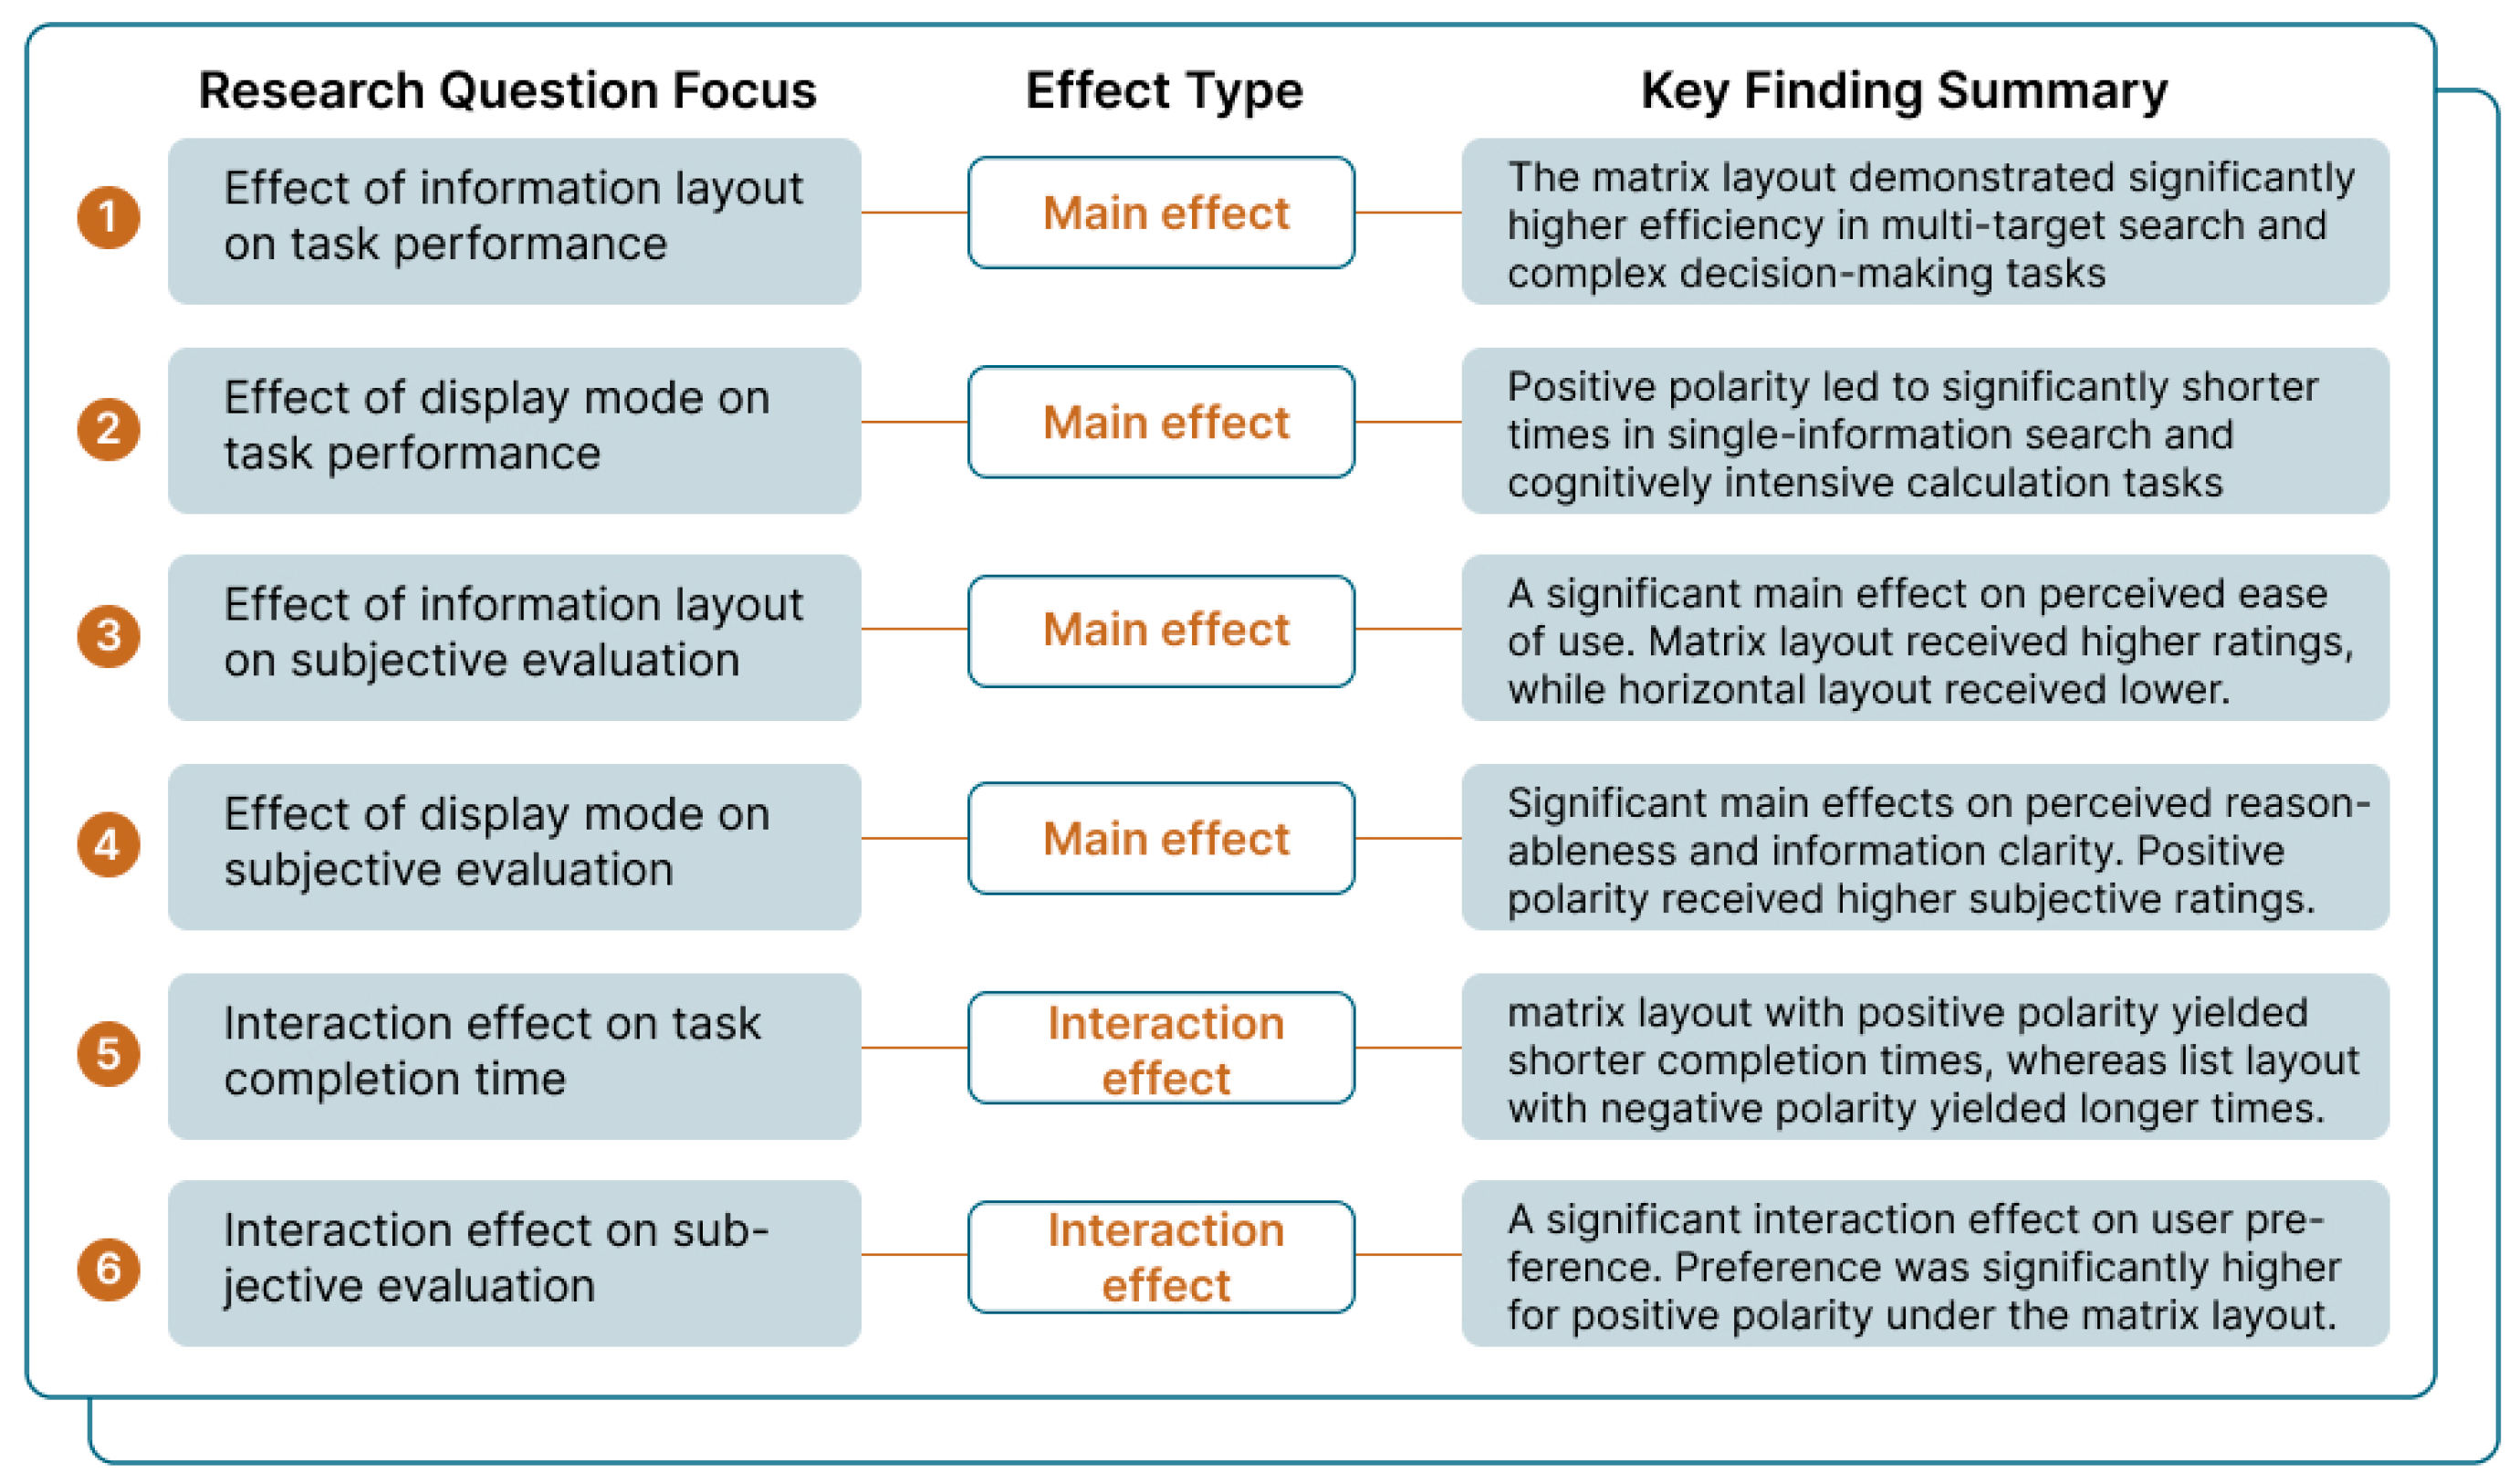
A significant interaction effect was observed between information layout and display mode concerning user preference. This answers the sixth research question: The interaction between information layout and the visual design of auxiliary instructions has a significant effect on participants’ subjective evaluations. Under the matrix layout, user preference for positive polarity was significantly higher than for negative polarity. This stems from the grid structure requiring frequent text reading, where white-on-black maintains visual parsing stability. Under the list layout, user preference for negative polarity was slightly higher than for positive polarity, as strong visual separation between vertically arranged items is needed, and the dark background enhances item discrimination through increased contrast. No interaction effect emerged under the horizontal layout because the sliding operation dominated cognitive resources, masking the differences between display modes under the load of motor actions. A summary of the main research questions and corresponding empirical findings is provided in Figure 8.

5. Conclusions and Recommendation

This study examined the effects of information layout and the auxiliary instruction display mode on user operational performance and subjective experience within virtual try-on interfaces. The analysis yielded three principal findings. First, the matrix layout demonstrated higher efficiency in multi-target search and complex decision-making tasks. Its structural advantages effectively reduce visual search load, and users generally perceive the matrix layout as offering higher perceived ease of use. Second, the positive polarity display mode (white background, black text) demonstrated better performance in single-information search and cognitively intensive tasks. It also consistently receives higher user ratings for perceived interface reasonableness and information clarity. Third, significant interaction effects exist between information layout and display mode. The synergy between the matrix layout and positive polarity improves operational efficiency, while the combination of the list layout and negative polarity leads to reduced efficiency in complex tasks. Perceived operational fluency is relatively lower with the horizontal layout.
These findings provide insights and practical guidance for virtual try-on interface design. Therefore, to optimize the usability of virtual try-on interfaces, it is recommended to adopt the matrix layout as the foundational architecture for core browsing and outfit composition interfaces to leverage its efficiency advantages in handling complex tasks. The positive polarity mode should be used as the default for auxiliary instructions to balance operational speed, information clarity, and user comfort. The combination of the list layout with negative polarity should be avoided, particularly in scenarios requiring information comparison or calculation. Exercise caution when applying the horizontal layout, carefully evaluating its use and focusing on optimizing interaction fluency. Furthermore, this study focused on fundamental layout and display modes within a specific context. The cognitive load-based perspective offered here can serve as a reference for the design of virtual try-on terminals and may also offer insights for other platforms, such as mobile, although application would require adaptation to different interaction models and screen sizes. Future research should explore how these principles translate into these diverse industry contexts.
Despite providing design suggestions, this study has limitations: Participants were predominantly university students, potentially limiting the generalizability of conclusions to users with diverse occupational backgrounds. The relatively small sample size per group (n = 10) may also limit the statistical power for detecting interaction effects. Furthermore, tasks and interface designs covered only basic virtual try-on scenarios, the experimental tasks were simplified and of short duration, which cannot fully capture the complexity of real-world shopping scenarios. Visual design variables focused on information layout and auxiliary instruction display mode. Additionally, experimental setup involved a simplified prototype interaction on a laptop screen within a controlled laboratory environment rather than conducted with a real intelligent virtual fitting terminal. Therefore, future work should involve larger and more diverse samples, and explore these interface designs in longer, more ecologically valid contexts. Future research could expand into dimensions like background transparency, dynamic effects, and incorporate multi-modal experiences (e.g., haptic, auditory) to further enrich the virtual try-on interaction design system. A direction is to validate these findings using actual smart fitting terminals, explore these interface designs in real-world settings to assess their performance amidst typical decision-making risks and distractions. Further research should also explore the usability of these interface design principles on other dominant virtual try-on platforms, such as mobile and desktop e-commerce websites. As digital technology deepens its integration with the fashion industry, virtual try-on presentation formats are becoming increasingly diverse. Future research could focus on emerging scenarios like metaverse try-ons and AI-powered personalized recommendations. Combining user eye-tracking data to optimize design details will provide users with more immersive and efficient virtual try-on experiences.

Author Contributions

Conceptualization, X.L.; methodology, X.L.; investigation, P.P.; data curation, P.P.; formal analysis, P.P.; visualization, P.P.; writing—original draft preparation, P.P.; writing—review and editing, X.L.; supervision, X.L.; funding acquisition, X.L. All authors have read and agreed to the published version of the manuscript.

Funding

This research was funded by the Fujian Province Education Science Fourteenth Five-Year Planning Conventional Project (FJJKBK23-111); the 2024 Fuzhou University Higher Education Teaching Research and Reform Project (03626456); the Fujian Provincial Federation of Social Sciences (FJ2025B220); and the Zhejiang Province Philosophy and Social Sciences Planning Project (23NDJC169YB). The APC was funded by the 2024 Fuzhou University Higher Education Teaching Research and Reform Project (03626456).

Institutional Review Board Statement

The study was conducted in accordance with the Declaration of Helsinki, and approved by the Institutional Review Board of Xiamen Academy of Arts and Design, Fuzhou University (protocol code FZU20250312 and date of approval: 12 March 2025)”.

Informed Consent Statement

Informed consent was obtained from all subjects involved in the study.

Data Availability Statement

The raw data supporting the conclusions of this article will be made available by the authors on request.

Acknowledgments

The authors would like to express their sincere gratitude to Fuzhou University and the Academy of Arts and Crafts for providing academic and research support. Special thanks are extended to colleagues and students who contributed constructive feedback during the course of this study.

Conflicts of Interest

The authors declare no conflicts of interest.

References

  1. Liu, Y.; Zhao, M.; Zhang, Z.; Liu, Y.; Yan, S. Arbitrary virtual try-on network: Characteristics preservation and tradeoff between body and clothing. ACM Trans. Multimed. Comput. Commun. Appl. 2024, 20, 1–23. [Google Scholar] [CrossRef]
  2. Ren, B.; Tang, H.; Meng, F.; Runwei, D.; Torr, P.H.S.; Sebe, N. Cloth interactive transformer for virtual try-on. ACM Trans. Multimed. Comput. Commun. Appl. 2023, 20, 1–20. [Google Scholar] [CrossRef]
  3. Yang, Z.; Chen, J.; Shi, Y.; Li, H.; Chen, T.; Lin, L. OccluMix: Towards de-occlusion virtual try-on by semantically-guided mixup. IEEE Trans. Multimed. 2023, 25, 1477–1488. [Google Scholar] [CrossRef]
  4. Rohil, M.K.; Parikh, A. Fast and robust virtual try-on based on parser-free generative adversarial network. Virtual Real. 2024, 28, 5. [Google Scholar] [CrossRef]
  5. Lee, H.; Xu, Y.; Porterfield, A. Virtual fitting rooms for online apparel shopping: An exploration of consumer perceptions. Fam. Consum. Sci. Res. J. 2022, 50, 189–204. [Google Scholar] [CrossRef]
  6. Ivanov, A.; Head, M.; Biela, C. Mobile shopping decision comfort using augmented reality: The effects of perceived augmentation and haptic imagery. Asia-Pac. J. Mark. Logist. 2023, 35, 1917–1934. [Google Scholar] [CrossRef]
  7. Hoffmann, S.; Mai, R. Consumer behavior in augmented shopping reality: A review, synthesis, and research agenda. Front. Virtual Real. 2022, 3, 961236. [Google Scholar] [CrossRef]
  8. Zhang, J.; Luximon, Y.; Shah, P.; Li, P. 3D statistical head modeling for face/head-related product design: A state-of-the-art review. Comput. Aided Des. 2023, 159, 103483. [Google Scholar] [CrossRef]
  9. Li, C.; Cohen, F. Virtual reconstruction of 3D articulated human shapes applied to garment try-on in a virtual fitting room. Multimed. Tools Appl. 2022, 81, 11071–11085. [Google Scholar] [CrossRef]
  10. Marelli, D.; Bianco, S.; Ciocca, G. Designing an AI-based virtual try-on web application. Sensors 2022, 22, 3832. [Google Scholar] [CrossRef]
  11. Yang, H.; Guo, N. Review of image-based virtual try-on: From deep learning to diffusion models. Comput. Eng. Appl. 2025, 61, 19–35. [Google Scholar] [CrossRef]
  12. Tawira, L.; Ivanov, A. Leveraging personalization and customization affordances of virtual try-on apps for a new model in apparel m-shopping. Asia-Pac. J. Mark. Logist. 2023, 35, 451–471. [Google Scholar] [CrossRef]
  13. Yoon, K.I.; Jeong, T.S.; Kim, S.C.; Lim, S.C. Anonymizing at-home fitness: Enhancing privacy and motivation with virtual reality and try-on. Front. Public Health 2023, 11, 1333776. [Google Scholar] [CrossRef]
  14. Sekri, K.; Bouzaabia, O.; Rzem, H.; Juárez-Varón, D. Effects of virtual try-on technology as an innovative e-commerce tool on consumers’ online purchase intentions. Eur. J. Innov. Manag. 2024, in press. [Google Scholar] [CrossRef]
  15. Recalde, D.; Jai, T.C.; Jones, R.P. I can find the right product with AR! The mediation effects of shopper engagement on intent to purchase beauty products. J. Retail Consum. Serv. 2024, 78, 103764. [Google Scholar] [CrossRef]
  16. Wang, Z.; Jiang, Q. A study on the willingness of “Generation Z” consumers to use online virtual try-on shopping services based on the SOR framework. Systems 2024, 12, 217. [Google Scholar] [CrossRef]
  17. Hwang, C.; Jin, B.; Song, L.; Feng, J. Factors influencing older adults’ intention to use virtual fitting room technology during the COVID-19 pandemic. J. Fash. Mark. Manag. Int. J. 2024, 28, 444–459. [Google Scholar] [CrossRef]
  18. Liu, T.; Tan, C.S.L.; Quintero Rodriguez, C. Virtual reality in the luxury fashion industry: A systematic literature review. Span. J. Mark.-ESIC 2025, 29, 312–329. [Google Scholar] [CrossRef]
  19. Idrees, S.; Gill, S.; Vignali, G. Mobile 3D body scanning applications: A review of contact-free AI body measuring solutions for apparel. J. Text. Inst. 2024, 115, 1161–1172. [Google Scholar] [CrossRef]
  20. Yu, M.; Ma, Y.; Wu, L.; Cheng, K.; Li, X.; Meng, L.; Chua, T.S. Smart fitting room: A one-stop framework for matching-aware virtual try-on. In Proceedings of the 2024 International Conference on Multimedia Retrieval (ICMR 2024), Singapore, 12–15 June 2024; pp. 184–192. [Google Scholar] [CrossRef]
  21. Schultz, C.D.; Gorlas, B. Magic mirror on the wall: Cross-buying at the point of sale. Electron. Commer. Res. 2023, 23, 1677–1700. [Google Scholar] [CrossRef]
  22. Shin, E.; Kincade, D.H.; Han, J. Exploring online consumer reviews of customized apparel products. J. Fash. Mark. Manag. Int. J. 2023, 28, 139–160. [Google Scholar] [CrossRef]
  23. Gao, R.; Yuan, W.; Zhu, J.Y. Controllable visual-tactile synthesis. In Proceedings of the IEEE/CVF International Conference on Computer Vision (ICCV 2023), Paris, France, 2–6 October 2023; pp. 7040–7052. [Google Scholar] [CrossRef]
  24. Lavoye, V.; Tarkiainen, A.; Sipilä, J.; Mero, J. More than skin-deep: The influence of presence dimensions on purchase intentions in augmented reality shopping. J. Bus. Res. 2023, 169, 114247. [Google Scholar] [CrossRef]
  25. He, X.M.; He, S.J.; Jiang, S.H. Research status and development trend of cognitive load in human-computer interaction. Comput. Integr. Manuf. Syst. 2023, 29, 1069. [Google Scholar]
  26. Faudzi, M.A.; Cob, Z.C.; Ghazali, M.; Omar, R.; Sharudin, S.A. User interface design in mobile learning applications: Developing and evaluating a questionnaire for measuring learners’ extraneous cognitive load. Heliyon 2024, 10, e37494. [Google Scholar] [CrossRef] [PubMed]
  27. Yang, L.; Qi, B.; Guo, Q. The effect of icon color combinations in information interfaces on task performance under varying levels of cognitive load. Appl. Sci. 2024, 14, 4212. [Google Scholar] [CrossRef]
  28. Zhou, J.; Miao, X.; He, F.; Miao, Y. Effects of font style and font color in news text on user cognitive load in intelligent user interfaces. IEEE Access 2022, 10, 10719–10730. [Google Scholar] [CrossRef]
  29. Li, X.; Zheng, C.; Pan, Z.; Huang, Z.; Niu, Y.; Wang, P.; Geng, W. Comparative study on 2D and 3D user interface for eliminating cognitive loads in augmented reality repetitive tasks. Int. J. Hum.-Comput. Interact. 2024, 40, 8008–8024. [Google Scholar] [CrossRef]
  30. Yin, W.; Xu, B. Effect of online shopping experience on customer loyalty in apparel business-to-consumer e-commerce. Text. Res. J. 2021, 91, 2882–2895. [Google Scholar] [CrossRef]
  31. Groissberger, T.; Riedl, R. Do online shops support customers’ decision strategies by interactive information management tools? Results of an empirical analysis. Electron. Commer. Res. Appl. 2017, 26, 131–151. [Google Scholar] [CrossRef]
  32. Guo, J.; Zhao, Y.; Zhang, W.; Lu, K.; Feng, X.; Xia, T. The influence of the information richness of interfaces on consumers’ purchase intention: The sequential mediating effects of cognitive load, mental imagery, and flow experience. Behav. Sci. 2025, 15, 673. [Google Scholar] [CrossRef]
  33. Huang, T.; Zhang, J. Study on experience design of elderly online learning interface based on cognitive load. In Proceedings of the International Conference on Human-Computer Interaction (HCII 2022), Cham, Switzerland, 26 June–1 July 2022; Springer: Cham, Switzerland, 2022; pp. 70–86. [Google Scholar] [CrossRef]
  34. Cong, R.; Tago, K.; Jin, Q. Measurement and verification of cognitive load in multimedia presentation using an eye tracker. Multimed. Tools Appl. 2022, 81, 26821–26835. [Google Scholar] [CrossRef]
  35. Shao, J.; Wu, J.; Tang, W.; Xue, C. How dynamic information layout in GIS interface affects users’ search performance: Integrating visual motion cognition into map information design. Behav. Inf. Technol. 2023, 42, 1686–1703. [Google Scholar] [CrossRef]
  36. Zhao, X.; Wu, Z. Research on the impact of mobile terminal information layout on visual search—Taking bookkeeping application as an example. In Proceedings of the International Conference on Human-Computer Interaction (HCII 2024), Cham, Switzerland, 29 June–4 July 2024; Springer: Cham, Switzerland, 2024; pp. 268–281. [Google Scholar] [CrossRef]
  37. Tang, Z.; Xu, X.; Wang, F.; Zhang, L.; Zhu, M. Effect of interface layout design of a public library website on information-seeking experience for elderly people. Libr. Hi Tech 2025, 43, 746–762. [Google Scholar] [CrossRef]
  38. Li, J.; Zhang, W.; Feng, Z.; Wei, L.; Tang, T.; Gu, T. Effects of head-up display information layout design on driver performance: Driving simulator studies. Int. J. Hum.-Comput. Interact. 2025, 41, 8829–8845. [Google Scholar] [CrossRef]
  39. Zhu, J.; Cui, Z.; Yang, Z.; Wang, Q.; Tian, Y.; Wang, D. Vertical is beneficial but volume is irrelevant: Optimization of urban guide signs based on spatial representation of road networks. Heliyon 2024, 10, e32401. [Google Scholar] [CrossRef]
  40. Yang, X.; Yang, B.; Tang, C.; Mo, X.; Hu, B. Visual attention quality research for social media applications: A case study on photo sharing applications. Int. J. Hum.-Comput. Interact. 2024, 40, 3827–3840. [Google Scholar] [CrossRef]
  41. Zhang, M.; Hou, G.; Chen, Y.C. Effects of interface layout design on mobile learning efficiency: A comparison of interface layouts for mobile learning platform. Libr. Hi Tech 2023, 41, 1420–1435. [Google Scholar] [CrossRef]
  42. Şener, E. A Comparison of Memory Performances for Expository Scientific Prose and Diagram in Flat vs. Spatially Distributed Layouts in Virtual Reality. Master’s Thesis, North Carolina State University, Raleigh, NC, USA, 2023. [Google Scholar]
  43. Melendez Abarca, P.; Havas, C. Spatial information integration in small language models for document layout generation and classification. In Proceedings of the 40th ACM/SIGAPP Symposium on Applied Computing, Cagliari, Italy, 31 March–4 April 2025; pp. 1164–1171. [Google Scholar] [CrossRef]
  44. Ståhlbom, E.; Molin, J.; Ynnerman, A.; Lundström, C. Should I make it round? Suitability of circular and linear layouts for comparative tasks with matrix and connective data. Comput. Graph. Forum 2024, 43, e15102. [Google Scholar] [CrossRef]
  45. Chen, C.H.; Zhai, W. The effects of information layout, display mode, and gender difference on the user interface design of mobile shopping applications. IEEE Access 2023, 11, 47024–47039. [Google Scholar] [CrossRef]
  46. Apraiz Iriarte, A.; Lasa Erle, G.; Mazmela Etxabe, M. User preferences and associations with light or dark interfaces. In Proceedings of the 25th International Congress on Project Management and Engineering, Alcoy, Spain, 6–9 July 2021; pp. 1893–1906. [Google Scholar]
  47. Niu, Y.; Zhou, T.; Bai, L. Research on color coding of fighter jet head-up display key information elements in air–sea flight environment based on eye-tracking technology. Proc. Inst. Mech. Eng. G J. Aerosp. Eng. 2022, 236, 2010–2030. [Google Scholar] [CrossRef]
  48. Lin, H.Y.; Chen, C.H. The effects of display size and text-background color type on the Chinese digital reading performance of Taiwan college students. J. Sci. Des. 2021, 5, 2_101–2_110. [Google Scholar]
  49. Muhamad, N.; Amali, N.A.N. Digital display preference of electronic gadgets for visual comfort: A systematic review. Iran. J. Public Health 2023, 52, 1565. [Google Scholar] [CrossRef]
  50. Luzsa, R.; Mayr, S. The polarity effect in virtual and video see-through mixed reality—Better proofreading performance and faster optotype identification with positive display polarity. Ergonomics 2025, 1–15. [Google Scholar] [CrossRef]
  51. Yu, N.; Ouyang, Z. Effects of background colour, polarity, and saturation on digital icon status recognition and visual search performance. Ergonomics 2024, 67, 433–445. [Google Scholar] [CrossRef]
  52. Lin, C.; Ji, Z.; Lin, Y. Optimum display luminance and contrast polarity of desktop head-up display under office lighting level based on visual ergonomic study. Ergonomics 2024, 67, 1491–1503. [Google Scholar] [CrossRef]
  53. While, Z.; Sarvghad, A. Dark mode or light mode? Exploring the impact of contrast polarity on visualization performance between age groups. In Proceedings of the 2024 IEEE Visualization and Visual Analytics (VIS), Tampa, FL, USA, 13–18 October 2024; pp. 211–215. [Google Scholar] [CrossRef]
  54. Zhai, W.; Lin, Z.; Xu, B. Exploring the effects of virtual annotation background display mode and transparency through a 360-degree panorama approach to online shopping. Asia-Pac. J. Mark. Logist. 2024, 36, 1045–1068. [Google Scholar] [CrossRef]
  55. Muhamad, N.; Moktaeffendi, N.H.; Azni, N.S. Effect of display polarity on amplitude of accommodation and visual fatigue. Environ.-Behav. Proc. J. 2023, 8, 207–214. [Google Scholar] [CrossRef]
  56. Kemp, A.; Palmer, E.; Strelan, P.; Thompson, H. Testing a novel extended educational technology acceptance model using student attitudes towards virtual classrooms. Br. J. Educ. Technol. 2024, 55, 2110–2131. [Google Scholar] [CrossRef]
  57. Tetik, G.; Türkeli, S.; Pinar, S.; Tarim, M. Health information systems with technology acceptance model approach: A systematic review. Int. J. Med. Inform. 2024, 190, 105556. [Google Scholar] [CrossRef]
  58. Lin, J.; Cai, Y.; Wu, X.; Lu, J. Graph-based information block detection in infographic with gestalt organization principles. IEEE Trans. Vis. Comput. Graph. 2021, 29, 1705–1718. [Google Scholar] [CrossRef]
  59. Mathôt, S.; Ivanov, Y. The effect of pupil size and peripheral brightness on detection and discrimination performance. PeerJ 2019, 7, e8220. [Google Scholar] [CrossRef]
  60. Manca, V. Artificial neural network learning, attention, and memory. Information 2024, 15, 387. [Google Scholar] [CrossRef]
  61. Hong, W. The Impact of Web Interface Characteristics on Consumers’ Online Shopping Behavior. Ph.D. Thesis, Hong Kong University of Science and Technology, Hong Kong, China, 2002. [Google Scholar]
  62. Xiao, H.; Sun, Y.; Duan, Z.; Huo, Y.; Liu, J.; Luo, M.; Zhang, Y. A study of model iterations of Fitts’ law and its application to human–computer interactions. Appl. Sci. 2024, 14, 7386. [Google Scholar] [CrossRef]
  63. Liu, Y.; Zhang, S.Y.; Xin, H.J. Research on the impact of the contrast between the white text and black background to visual sharpness. Appl. Mech. Mater. 2014, 469, 282–285. [Google Scholar] [CrossRef]
Figure 1. Experimental process of the subjects.
Information 16 00862 g001
Figure 2. Relevant research models.
Information 16 00862 g002
Figure 3. Interaction effect between information layout and auxiliary instruction display mode on task 1 completion time.
Information 16 00862 g003
Figure 4. Interaction effect between information layout and auxiliary instruction display mode on task 2 completion time.
Information 16 00862 g004
Figure 5. Interaction effect between information layout and auxiliary instruction display mode on task 3 completion time.
Information 16 00862 g005
Figure 6. Interaction effect between information layout and auxiliary instruction display mode on task 4 completion time.
Information 16 00862 g006
Figure 7. Interaction effect between information layout and auxiliary instruction display mode on participants’ preference level.
Information 16 00862 g007
Figure 8. Summary of Research Questions and Empirical Findings.
Information 16 00862 g008
Table 1. Prototype Design of the Virtual Dressing Room Interaction Interface for the 6 Experimental Groups.
Independent VariableInformation Layout
Matrix LayoutList LayoutHorizontal Layout
Auxiliary Instruction Display Modepositive polarityInformation 16 00862 i001Information 16 00862 i002Information 16 00862 i003
negative polarityInformation 16 00862 i004Information 16 00862 i005Information 16 00862 i006
Table 2. Experimental task description.
TaskTask ContentTask CharacteristicsDifficulty
Task 1Locate material information for “Classic A-line skirt”Requires perception of single target information locationLow
Task 2Identify names of three shoes with “Patent leather” materialRequires perception of multiple target information locationsMedium
Task 3Calculate total price of “Color-block round-neck T-shirt” and “Vintage washed jeans”Requires information location perception and numerical calculationHigh
Task 4Calculate total price of the most cost-effective outfit combination (including T-shirt, pants, shoes, and backpack)Requires information location perception and comparative analysisHigh
Table 3. Two-way ANOVA Results for Task 1 Completion Time.
SourceType III SSdfMSFSig.Partial η2Post Hoc
Information Layout26.742213.3710.4010.6710.015
Display Mode146.1101146.1104.3870.041 *0.075Positive < Negative
Information Layout × Display Mode284.2912142.1454.2680.019 *0.136Matrix: Positive advantage
* Significant at α = 0.05 level (* p < 0.05).
Table 4. Two-way ANOVA Results for Task 2 Completion Time.
SourceType III SSdfMSFSig.Partial η2Post Hoc
Information Layout548.5042274.2529.2180.000 *0.255matrix < horizontal < list
Display Mode1.02411.0240.0340.8530.001
Information Layout × Display Mode57.775228.8880.9710.3850.035
* Significant at α = 0.05 level (* p < 0.05).
Table 5. Two-way ANOVA Results for Task 3 Completion Time.
SourceType III SSdfMSFSig.Partial η2Post Hoc
Information Layout196.584298.2921.2650.2900.045
Display Mode326.3401326.3404.2000.045 *0.072positive < negative
Information Layout × Display Mode52.967226.4840.3410.7130.012
* Significant at α = 0.05 level (* p < 0.05).
Table 6. Two-way ANOVA Results for Task 4 Completion Time.
SourceType III SSdfMSFSig.Partial η2Post Hoc
Information Layout3976.20921988.1055.4370.007 *0.168matrix < horizontal < list
Display Mode1121.21311121.2133.0660.0860.054positive < negative
Information Layout × Display Mode2473.85721236.9293.3830.041 *0.111list: negative disadvantage
* Significant at α = 0.05 level (* p < 0.05).
Table 7. Two-way ANOVA Results for Subjective Perceived Reasonableness.
SourceType III SSdfMSFSig.Partial η2Post Hoc
Information Layout3.03321.5171.1720.3180.042
Display Mode7.35017.3505.6780.021 *0.095Positive > Negative
Information Layout × Display Mode0.70020.3500.2700.7640.010
* Significant at α = 0.05 level (* p < 0.05).
Table 8. Two-way ANOVA Results for Subjective Preference.
SourceType III SSdfMSFSig.Partial η2Post Hoc
Information Layout1.43320.7170.4880.6170.018
Display Mode1.35011.3500.9190.3420.017
Information Layout × Display Mode10.90025.4503.7110.031 *0.121Matrix: Positive advantage
* Significant at α = 0.05 level (* p < 0.05).
Table 9. Two-way ANOVA Results for Perceived Ease of Use.
SourceType III SSdfMSFSig.Partial η2Post Hoc
Information Layout7.30023.6504.6930.013 *0.148Matrix > List > Horizontal
Display Mode0.26710.2670.3430.5610.006
Information Layout × Display Mode0.03320.0170.0210.9790.001
* Significant at α = 0.05 level (* p < 0.05).
Table 10. Two-way ANOVA Results for Information Clarity.
SourceType III SSdfMSFSig.Partial η2Post Hoc
Information Layout2.53321.2672.6820.0780.090
Display Mode6.01716.01712.7410.001 *0.191Positive > Negative
Information Layout × Display Mode0.53320.2670.5650.5720.020
* Significant at α = 0.05 level (* p < 0.05).
Disclaimer/Publisher’s Note: The statements, opinions and data contained in all publications are solely those of the individual author(s) and contributor(s) and not of MDPI and/or the editor(s). MDPI and/or the editor(s) disclaim responsibility for any injury to people or property resulting from any ideas, methods, instructions or products referred to in the content.