Article

Speaking like Humans, Spreading like Machines: A Study on Opinion Manipulation by Artificial-Intelligence-Generated Content Driving the Internet Water Army on Social Media

1
School of Information Management, Wuhan University, Wuhan 430072, China
2
School of Information Management, Zhengzhou University, Zhengzhou 450001, China
*
Author to whom correspondence should be addressed.
Information 2025, 16(10), 850; https://doi.org/10.3390/info16100850
Submission received: 24 August 2025 / Revised: 28 September 2025 / Accepted: 29 September 2025 / Published: 1 October 2025
(This article belongs to the Section Artificial Intelligence)

Abstract

This study focuses on the evolution of the Internet Water Army on social media, identifying a novel form known as artificial-intelligence-generated-content-enhanced social bots (AESBs), and compares their structural influence with traditional social bots in the context of public opinion guidance. Based on 3 years of real-world data from Weibo, this study develops a comprehensive framework integrating bot account detection, AESB content identification, and quantitative assessments of opinion guidance. A large-scale opinion propagation network is constructed to examine the structural roles of traditional social bots and AESB across three analytical levels: the node, community, and overall network. The results reveal substantial differences between AESB and traditional social bots. Social bots play a limited guiding role but help maintain network connectivity. In contrast, AESBs produce highly consistent and human-like content that demonstrates a significant capacity to reinforce topic focus, amplify emotional homogeneity, and deepen diffusion pathways, indicating a shift toward strategic content manipulation. These results suggest that AESBs are not merely passive generators but active agents of structural opinion control, capable of combining human mimicry with machine-level efficiency. This study advances theoretical understanding of IWA manipulation mechanisms, provides a replicable methodological approach, and offers practical implications for platform governance.

Graphical Abstract

1. Introduction

With the rapid advancement of information technology, social media has become a vital platform for disseminating information and shaping public opinion. Through transcending temporal and spatial boundaries, these platforms enable users to quickly gather and exchange viewpoints [1]. However, their openness and interactivity have also turned them into key instruments for manipulating public discourse, particularly with the emergence of the Internet Water Army (IWA) [2,3]. The term “Water Army” originates from the metaphor of low-cost laborers deployed in large numbers, resembling soldiers flooding into digital spaces to overwhelm authentic discourse. The IWA refers to organized online groups that influence public sentiment and disrupt the online environment through clandestine means. They often deploy software bots or botnet accounts to fabricate and disseminate false opinions and spam content [4]. For example, they may post fabricated product reviews to boost sales or generate coordinated comments to sway public sentiment during political campaigns. Unlike broader strategic information operations, which may be driven by state or ideological agendas, IWAs are typically characterized by their organized employment of online participants to deliver uniform and oriented statements about specific issues. Through large-scale account manipulation and flooding tactics, IWAs distort online discussions and undermine the integrity of the digital public sphere, posing significant challenges to the governance of social media environments.
As artificial intelligence continues to advance, the boundary between Artificial Intelligence-Generated Content (AIGC) and human-created content has become increasingly blurred. This rapid development has created an unprecedented environment for the evolution of the IWA. Its manipulation model has shifted from account-driven approaches, in which social bots are automated or semi-automated accounts that post, comment, or interact on social media under human supervision and maintain posts primarily through individual accounts, to content-driven strategies, where AI-generated material itself drives dissemination and interaction across social platforms [5,6]. In line with these trends, we define AIGC-Enhanced Social Bots (AESBs) as automated accounts that generate and disseminate AI-created content on social platforms with the aim of steering discussions or manipulating public opinion. AESBs represent a new form of IWA, which are distinct from earlier-generation social bots that required human operators to maintain posts and comments. By leveraging high-quality AIGC, AESB infiltrates social platforms, simulating human emotions and reactions to engage with the public in ways that appear authentic yet deceptive [7,8]. This emerging form of IWA not only enhances the precision and stealth of opinion manipulation but also significantly lowers its operational costs.
Overall, the technological leap of AIGC has disrupted the manipulation patterns of the IWA, driving its evolution from manual or semi-automated operations toward automated models capable of independently generating content. This technological shift has given rise to two distinct forms of IWA: one based on traditional social bots, and the other relying on new AIGC-Enhanced Social Bots (AESBs). This new type of IWA continuously learns and optimizes its behavior to more closely resemble genuine users, posing a challenge to conventional detection methods that rely on account behavior patterns. As AIGC increasingly approximates human-created content in terms of language style and emotional expression, it remains unclear whether its effectiveness in guiding public opinion differs from that of traditional IWA, warranting systematic investigation. To address these gaps, this study focuses on the evolution of forms of IWA in the context of widespread AIGC, identifying the key features of AESB and comparatively analyzing its effectiveness at opinion manipulation against that of social bots. The main contributions of this study are as follows:
(1)
It focuses on the core characteristics of the new IWA (AESB) and deeply analyzes its published content to detect AIGC, thereby broadening the dimensions for identifying such groups.
(2)
It systematically evaluates the opinion manipulation effects of AESB at the node, community, and network levels, and examines the differences in manipulation effectiveness between the two forms of IWA, offering deeper insights into the dissemination patterns and profound impacts of these actors within the online public opinion ecosystem.

2. Related Work

The rise in the IWA dates back to the early days of modern social media [2,9]. At that time, such groups primarily relied on large numbers of fake accounts and labor-intensive tactics, such as mass posting and thread flooding, to fabricate a sense of popularity. However, their manipulation was limited in both scope and precision. As social media platforms matured, the IWA evolved into more organized and commercialized operations [10], extending its presence into areas such as brand marketing and public opinion management [11,12]. On one hand, they began employing auxiliary tools to facilitate bulk account registration, automated posting, and topic monitoring. On the other hand, their tactics expanded beyond simple posts to include likes, shares, and comments, thereby increasing both the complexity and subtlety of manipulation. In this trajectory, social bots have become emblematic of the IWA’s technological advancement [13]. These bots, programmed to automatically generate and forward content, have significantly improved the efficiency and concealment of opinion manipulation.
Based on differences in operational strategies, the mechanisms by which the IWA manipulates public opinion can be categorized into two main types. The first involves influencing public views by strategically publishing content and engaging in coordinated interactions to rapidly shift the focus of online discourse [14]. Research has shown that even when social bots constitute only 5–10% of users, they can still dominate the opinions of genuine users [15,16]. The second mechanism focuses on influencing public emotions. The IWA often disseminates content embedded with negative sentiment to distort public perception and emotional expression [17]. For instance, in response to controversial events, these groups frequently use emotional and inflammatory language to attract attention and create confusion and emotional conflict in online spaces [18]. In response to such manipulations, scholars have developed various detection methods. Ferrara et al. [13], in a comprehensive review of social bots, classified detection techniques into three categories: graph-based, crowd-sourcing-based, and feature-based methods. Later, Orabi et al. [19] systematically reviewed related studies and emphasized the growing use of machine learning for detection. For example, Feng et al. [20] designed a new LLM-based bot detector that integrates a heterogeneous expert framework, significantly improving detection accuracy and efficiency.
Although existing studies have proposed various detection approaches from different dimensions and technical perspectives, most current methods focus primarily on account behavior and superficial linguistic features. These approaches face clear limitations against technological advances and evolving IWA forms. AESB’s core opinion manipulation relies on covert cognitive infiltration, requiring detection that targets content attributes. Notably, AIGC adapts flexibly to topics and contexts, effectively mimicking human behavior, making traditional feature extraction and account behavior analysis insufficient [8]. Moreover, the characteristics and impacts of AIGC-driven IWA remain underexplored, as do differences in opinion manipulation effectiveness compared to traditional IWA.

3. Methodology

To systematically identify social bots and AESB and examine their differences in opinion manipulation, this study proposes a three-stage analytical framework (Figure 1): detection of social bot accounts, identification of AESB content, and quantification of their manipulation effects. (1) In the account detection stage, an indicator system combining static attributes and dynamic behavioral features is constructed. Multiple machine learning models are trained based on these features, and the best-performing model is used to detect automated accounts. (2) For AIGC identification, the BERT variant BertForSequenceClassification is applied to detect manipulative or false content generated by AESB. (3) In the opinion manipulation quantification stage, a user interaction network is constructed using social network analysis. Metrics such as node influence, community structure, and overall network properties are used to evaluate the structural roles and guiding capabilities of social bots and AESB in opinion dissemination.

3.1. Detection of Social Bot Accounts

Social bot accounts exhibit marked differences from genuine users in both basic attributes and behavioral patterns. Their profiles are often incomplete, with unintelligible usernames, skewed follower-to-following ratios, or irregular follower distributions, reflecting limited social interaction capacity [15,21]. Behaviorally, bots deviate from human norms by frequently posting repetitive or irrelevant content, lacking contextual coherence and meaningful engagement, and operating in rigid, programmed patterns [22,23]. Based on these distinctions and drawing on validated features from prior studies, this study develops an identification system encompassing both static attributes and dynamic behaviors. This system is further specified through twelve indicators, as presented in Table 1.
To detect social bots, this study applies machine learning methods following these steps: First, the Bot Finder tool identifies social bot accounts, while genuine user accounts are collected from the Weibo platform to construct a labeled dataset containing both types. Simultaneously, posts and comments related to the keyword “Russia–Ukraine War” are gathered to build the identification dataset. Second, based on the indicator system, twelve features are extracted and vectorized. Categorical features are one-hot encoded, and numerical features are standardized, producing feature vectors for model input. Third, the labeled dataset is split into training and testing sets at an 8:2 ratio. Machine learning models, including K-Nearest Neighbors (KNN), Support Vector Machine (SVM), Naive Bayes, Decision Tree, and XGBoost, are trained on the training set. Model performance is evaluated through cross-validation, and the best-performing model is selected. Finally, numerical features from the identification dataset are input into the optimal model, which outputs classifications distinguishing genuine users from social bots, enabling precise identification.

3.2. Identification of AESB Content

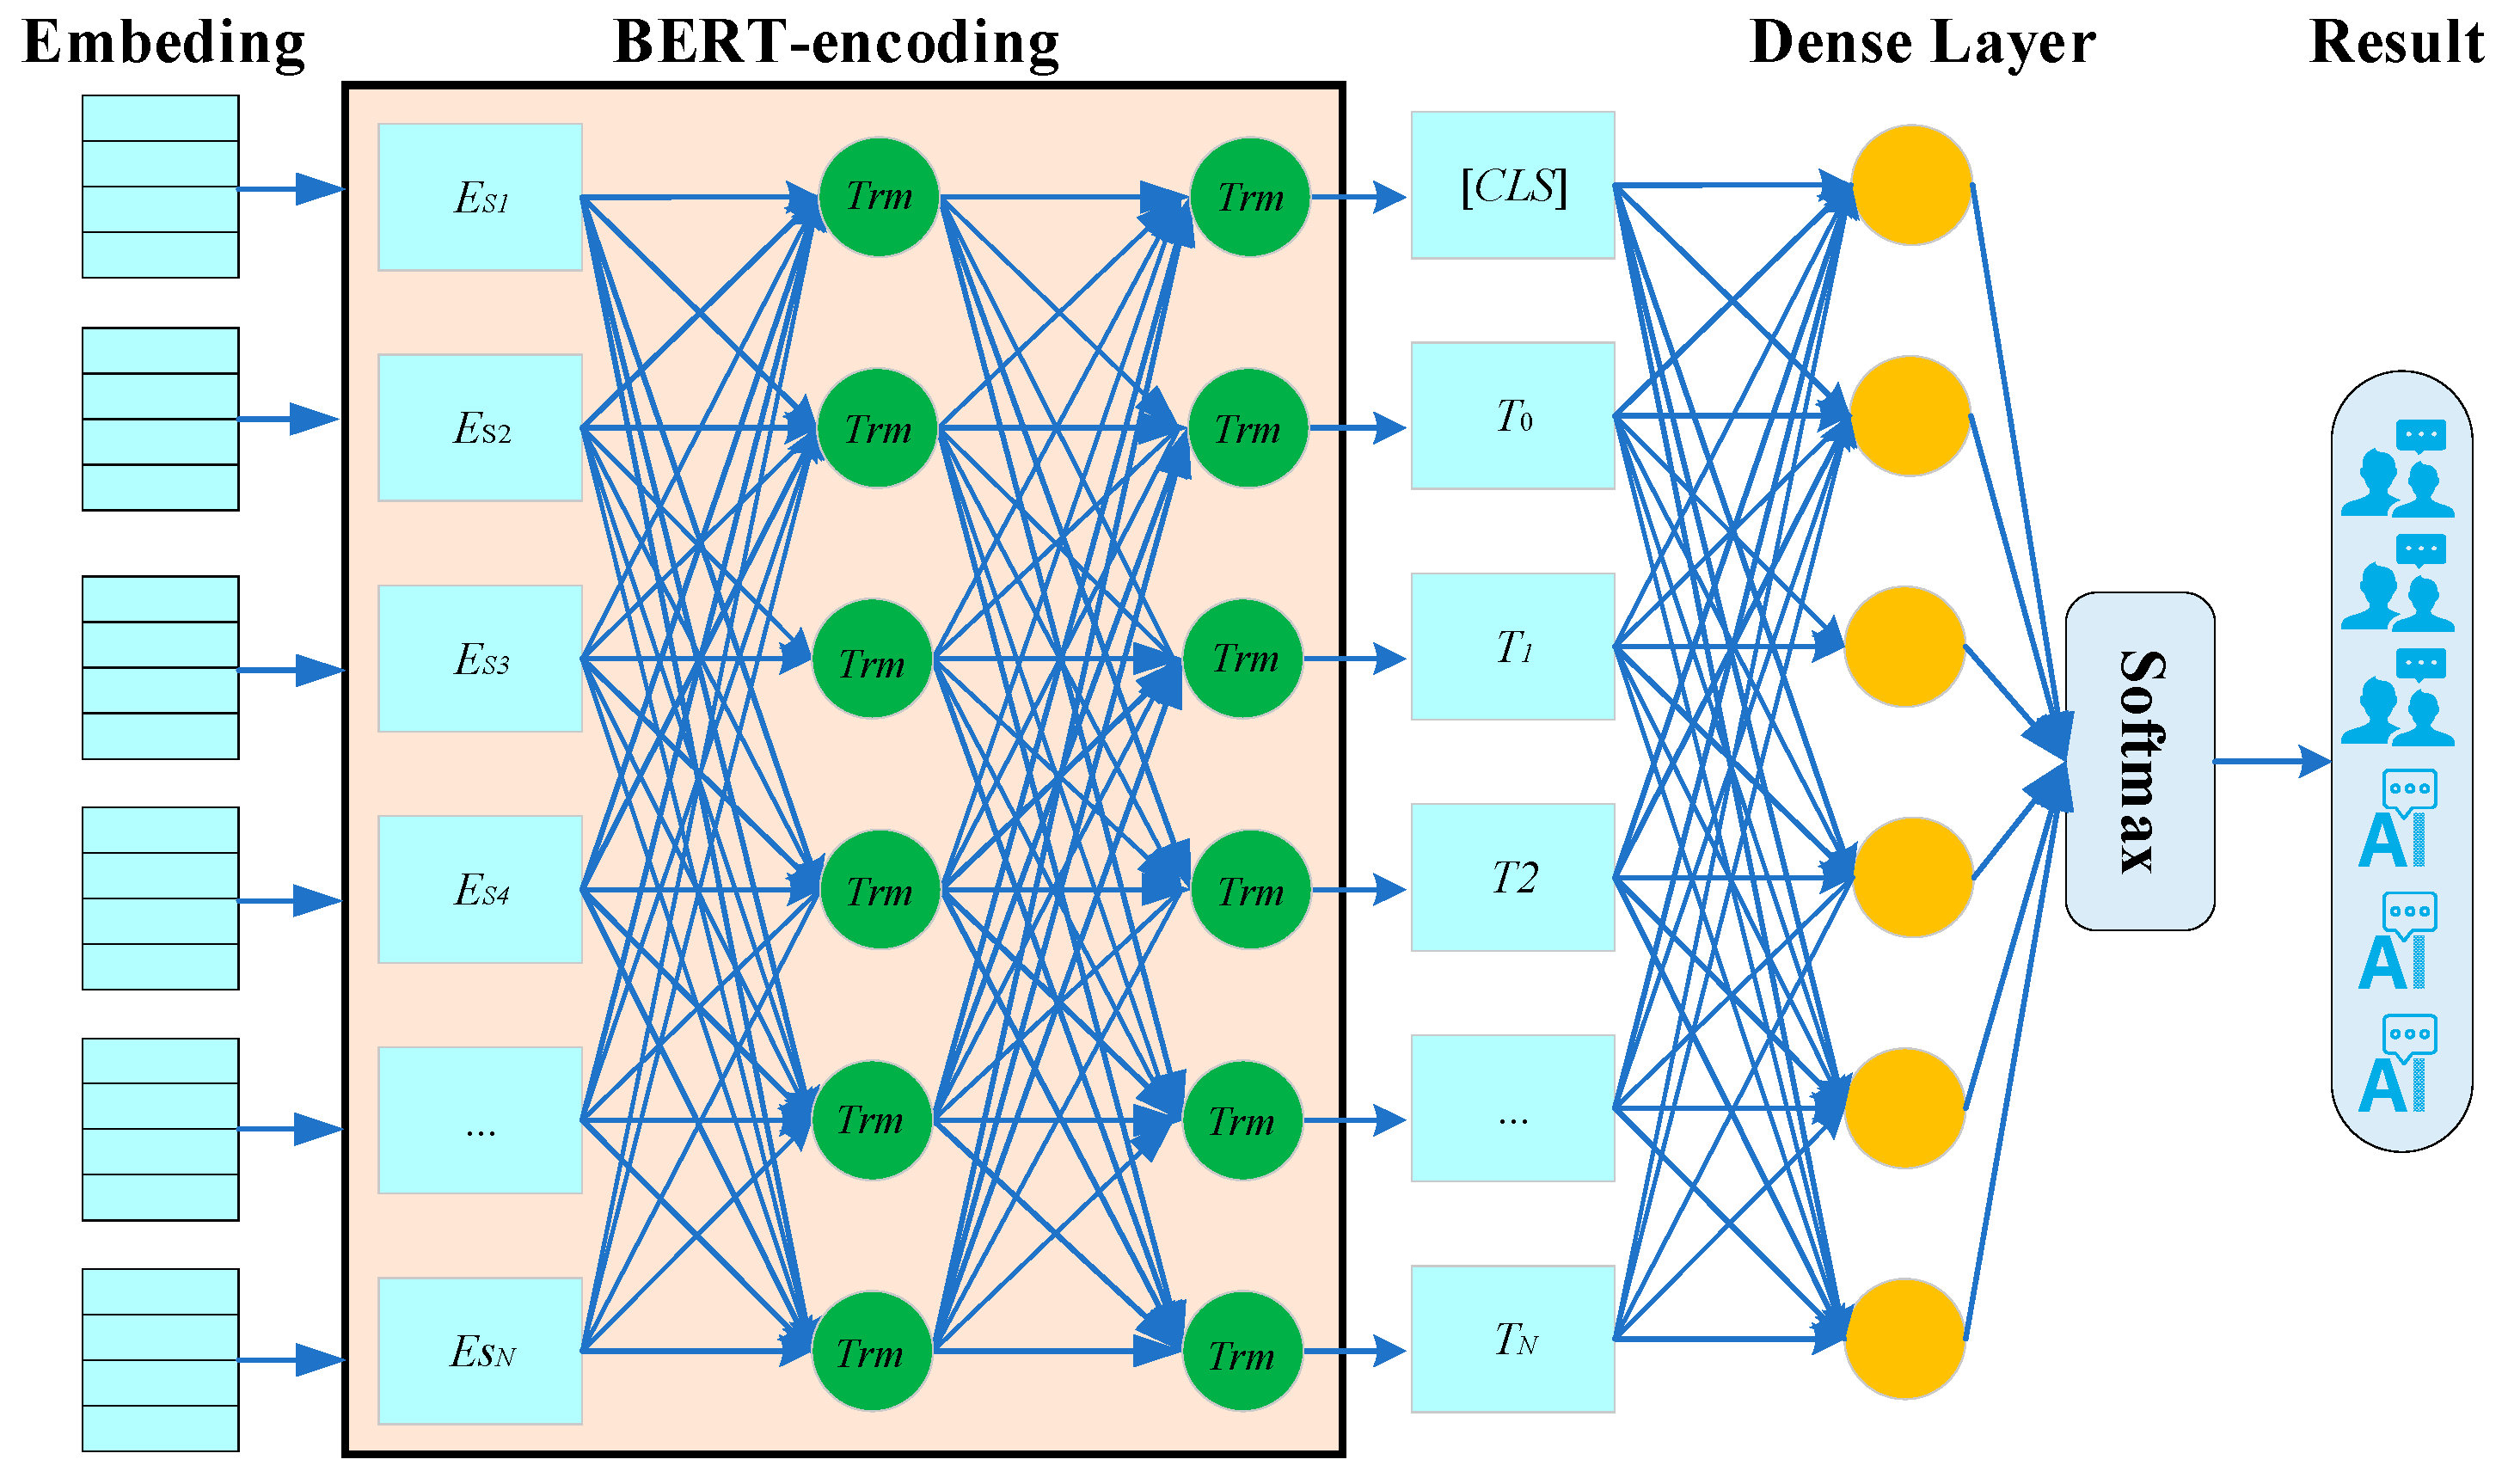
This study adopts a fine-tuned BERT-based model for AIGC identification due to BERT’s significant advantages in handling text semantics and writing style. Compared with traditional static word embedding methods such as Word2Vec and GloVe, BERT dynamically generates context-sensitive word vectors that fully integrate semantic and positional information, substantially enhancing its ability to model fine-grained semantic differences in text. This capability is particularly crucial for identifying complex content generated by AIGC. Therefore, this study utilizes the open-source BertForSequenceClassification framework (hereafter BFSC), which loads the Chinese pretrained weights “bert-base-Chinese” and performs end-to-end fine-tuning for downstream classification tasks, as illustrated in Figure 2. This framework effectively captures subtle differences in semantic generation, style imitation, and modes of expression in AIGC, enabling precise detection of manipulative information produced by AIGC.
At the model input stage, the raw text is first tokenized to generate a sequence of tokens. Each token is then encoded through word embeddings, positional embeddings, and segment embeddings to form an input embedding matrix, which serves as input to the BERT encoder. The embedding matrix passes through multiple Transformer layers, where the self-attention mechanism models contextual dependencies among tokens and progressively extracts deep semantic features. At the end of encoding, the hidden state corresponding to the [CLS] token in BERT’s final layer is extracted as the overall semantic representation of the input sentence. This [CLS] vector is then fed into a linear layer to map features to a new space. Finally, a Softmax activation function maps the output to a probability distribution over two classes, corresponding to the classification of user-generated content (UGC) and AIGC.

3.3. Quantifying the Degree of Opinion Manipulation

User interactions on social media, such as retweets and comments related to specific topics, constitute a dynamic process of information dissemination. The complex relational networks formed by these interactions reflect not only individual opinions but also evolving patterns of collective cognition. However, traditional public opinion analysis often focuses on textual semantics, making it difficult to uncover users’ structural roles in information diffusion or to quantify relationships among nodes. Social network analysis [34,35] addresses this limitation by modeling users as nodes and interactions as weighted edges, allowing for effective examination of structural features. Accordingly, this study constructs a social network using node attributes and edge relationships to systematically quantify the degree of opinion manipulation.

3.3.1. Construction of the Opinion Diffusion Network

The opinion dissemination network consists of nodes and edges. In this study, nodes refer to user entities involved in opinion dissemination, including genuine users, social bots, and AESB. Edges represent interactions between users, specifically post–reply interactions and comment co-occurrence. Each interaction carries a time and weight attribute. The time attribute records when the interaction occurred, while the weight is initialized to 1 and increases with repeated interactions. The edge type is determined by the identity of the post’s author and is categorized as one of the following: genuine user post interaction edge, social bots post interaction edge, and AESB post interaction edge.
This study constructs local interaction networks based on individual posts and integrates them to build a global opinion dissemination network [22]. The process involves the following steps: (1) Local network construction. Each local network centers on the post author and extends to commenters. For example, when node A publishes a post and commenter D replies, a post–reply edge is created between A and D with an initial weight of 1, which increases with subsequent interactions. (2) User ID-based association integration. The node lists of all local networks are scanned to record the user ID for each node. These lists are compared across networks to identify nodes with the same ID, which are merged into a single node in the global network to unify user identities. (3) Edge aggregation and dynamic weight updating. A global edge weight matrix stores edges between user pairs and their weights. All edges from local networks are examined, and for each edge, the matrix is checked for an existing counterpart. If present, the weight is systematically updated according to an accumulation rule; otherwise, the edge and its initial weight are added. This ensures that edge weights dynamically reflect interaction strength. (4) Network pruning and layout optimization. Duplicate nodes and edges are removed, retaining only core interactions. The global network is then optimized in layout to ensure structural clarity, providing a solid foundation for visualization and further analysis.

3.3.2. Definition of Quantitative Indicator System

To systematically assess the guiding capabilities of different actors in opinion dissemination, this study develops an “individual–group–system” quantitative indicator system across three levels: node, community, and overall network (see Table 2). The aim of this system is to reveal the differences in the guiding roles of genuine users, social bots, and AESB in the evolution of online public opinion.
At the node level, based on social network analysis and social psychology theory [34], this study selects three key indicators to measure a node’s influence potential: degree centrality, sentiment deviation, and topic focus degree. Specifically, degree centrality assesses a node’s activity within the local network, reflecting its influence in the early stages of opinion dissemination. Sentiment deviation captures variation in a node’s emotional expressions, helping identify its tendency to guide the emotional direction of public opinion. Topic focus degree evaluates the concentration of topics in a node’s content, indicating its ability to shape the focus or spread of discussions.
At the community level, drawing on community structure theory and the information cocoon effect [36,37], this study defines three indicators: modularity, community polarization index, and cross-community penetration rate. Modularity reflects the cohesiveness of internal community structures, indicating internal consistency and opinion convergence. The community polarization index measures the degree of extremity in viewpoints, revealing how emotional and positional guidance by nodes shape opinion alignment. Cross-community penetration rate captures the efficiency of information dissemination across communities, reflecting the capacity to break information silos and promote viewpoint diversity.
At the network level, grounded in information diffusion theory [38,39], this study selects three indicators: spread speed, diffusion breadth, and diffusion depth. Specifically, spread speed measures how efficiently information spreads from the source node, highlighting differences in distribution capabilities across node types. Diffusion breadth refers to the range of users reached during dissemination, assessing influence coverage at the network level. Diffusion depth captures the hierarchical penetration of information within user groups, reflecting the depth and persistence of opinion influence.
Table 2. Quantitative indicators for opinion guidance level.
Primary IndicatorSecondary IndicatorIndicator DescriptionReference
Node
Influence
Degree CentralityMeasures the activity of nodes based on the number of comments.[22,40]
Sentiment DeviationAssesses sentiment guidance based on sentiment deviation differences.[41,42]
Topic Focus DegreeMeasures the similarity between comments and main topics.[43]
Community
Influence
ModularityMeasures cohesion within communities and reflects structural compactness.[44]
Community Polarization IndexQuantifies intra-community consensus by combining sentiment and topic factors.[45]
Cross-Community Penetration RateMeasures the ability of content to break through information cocoons.[46]
Network
Influence
Spread SpeedCalculates the number of comments disseminated per unit of time.[47]
Diffusion BreadthMeasures the overall spread scope of information within the network.[48]
Diffusion DepthReflects the penetration capability of information, based on comment time intervals.[49,50]
The above quantitative indicator system provides a multidimensional evaluation of the guiding capabilities of different actors in opinion dissemination. Building on this system, the study further explores the corresponding quantitative methods.
(1)
Node Influence
Node influence is measured through degree centrality, sentiment deviation, and topic focus degree, quantitatively capturing a user’s individual impact in opinion dissemination from multiple dimensions. Among them, the specific measurement methods for secondary indicators such as degree centrality are presented in Equations (1)–(3).
D e g r e e   C e n t r a l i t y = K v N 1 ,
In the equations, Degree Centrality represents the degree centrality of node v; K v denotes the degree of the node, that is, the number of edges currently connected to node v; and N is the total number of nodes in the network. In this study, the indicator is calculated using normalization rather than raw degree values. Normalization eliminates biases introduced by differences in network size, thereby ensuring that node centrality is comparable across subnetworks of varying scales. By dividing by the theoretical maximum number of possible connections, the centrality values are constrained within the [0, 1] range, which facilitates cross-node comparisons and threshold determination. Degree centrality for each user is computed using Python’s (v3.8) NetworkX library. If an account’s degree centrality is significantly higher than the average level of genuine users, it likely gains structural influence through an abnormal follower base and thus functions as a critical hub node in opinion dissemination.
S e n t i m e n t   D e v i a t i o n = 1 n i = 1 n e v i + j = 1 n m 0 = 1 n i = 1 m e v i ,
In the equation, Sentiment Deviation represents the sentiment deviation degree of node v , e v i denotes the sentiment score of the i-th valid comment by node v. For invalid comments (those for which sentiment scores cannot be calculated), the sentiment score is set to zero. Here, n is the total number of comments made by node v (including invalid comments), and m is the number of valid comments (those with calculable sentiment scores). In this study, sentiment analysis is conducted using SnowNLP, with results normalized to the range of [−1, 1]. SnowNLP is an open-source toolkit specifically designed for Chinese language processing; compared with general-purpose tools, it is better adapted to the syntactic and affective expression patterns of Chinese online discourse. To evaluate the reliability of sentiment computation in this study, manual validation was conducted by randomly sampling 500 posts for human sentiment annotation. Based on this benchmark, SnowNLP achieved a classification accuracy of 93.6% on this dataset, demonstrating that its outputs are sufficiently reliable to support subsequent quantitative analyses. A higher sentiment deviation value indicates that the account may guide audience emotions through extreme or contradictory sentiment expressions. In addition, since sentiment deviation is a statistical measure derived from a large corpus of texts, it naturally smooths out errors from individual sentiment analyses, thereby ensuring the overall robustness of the metric.
T o p i c   F o c u s = 1 n i = 1 n 1 m j = 1 n s i m t v i , b v j ,
In the equation, Topic Focus represents the topic focus degree of node v; n is the total number of comments by node v; m is the number of posts by node v; t v i denotes the i-th comment of node v; b v j denotes the j-th post of node v; and s i m t v i , b v j is the semantic similarity between comment t v i and post b v j , calculated as the cosine similarity of their TF-IDF vector representations. In this study, semantic similarity is computed using TF-IDF–based cosine similarity. To validate its suitability compared with alternatives such as BERTScore, a comparative experiment was conducted: 500 post–comment pairs were randomly sampled and manually rated for semantic relevance on a 1–5 scale by three researchers. Spearman rank correlations were calculated between these human ratings and the outputs of TF-IDF–Cosine, BERTScore, and Jaccard. TF-IDF achieved the highest correlation (ρ = 0.735, p < 0.001), outperforming BERTScore (ρ = 0.642, p < 0.005) and Jaccard (ρ = 0.551, p < 0.005). Accordingly, TF-IDF was adopted as the basis for this metric, striking an optimal balance between performance and efficiency. TF-IDF effectively extracts key textual features while down-weighting common words, and cosine similarity is well-suited for measuring similarity between high-dimensional sparse vectors. The combination of these methods offers both computational efficiency and strong interpretability in topic consistency detection. If an account consistently publishes negative content about a certain event, and the majority of user comments focus on the negative aspects of that event, then the account’s topic focus degree will be high, indicating it plays a significant role in guiding the topic focus of public opinion.
(2)
Community Influence
This study focuses on community influence through three dimensions: modularity, community polarization index, and cross-community penetration rate, revealing patterns of group discussion intervention and the capacity for information breakthrough. Specifically, the measurement methods for secondary indicators such as modularity are detailed in Equations (4)–(6).
M o d u l a r i t y = m c m k c 2 m 2 ,
This formula is based on the classical modularity definition proposed by Newman and serves as a benchmark metric for evaluating the strength of network community structures, widely used in social network analysis. Its core idea is to quantify the significance of a community by comparing the actual internal connectivity with the expected connectivity in a random network under the same conditions. In the equation, Modularity represents the modularity of community c; m c denotes the number of edges inside community c; m is the total number of edges in the entire network; and k c is the sum of the degrees of all nodes within community c. In this study, community detection was performed using the Louvain algorithm implemented in the NetworkX library. This algorithm does not require a predefined number of communities and automatically identifies community structures via modularity optimization, with the resolution parameter γ set to the default value of 1.0. Once communities were detected, the contribution of each community was calculated using the formula above. This measurement effectively captures the tightness of internal community connections and reflects the reinforcement effect of information within homogeneous groups. A higher modularity value for certain accounts indicates that the community exhibits denser internal connections and stronger information flow, thereby making it easier for extreme viewpoints to evolve into echo chamber effects within the group.
P o l a r i z a t i o n   I n d e x = 1 n c v c E D v E D c + 1 2 n c v c 1 s i m t v , T c ,
In the equation, Polarization Index represents the polarization index of community c; E D v denotes the sentiment deviation of node v; E D c is the average sentiment deviation within community c; s i m t v , T c measures the semantic similarity between the comment topic of node v and the dominant topic of community c; and n c is the number of users in community c. This metric quantifies group polarization by integrating the dispersion of sentiment distribution with topic consistency. Its theoretical framework has been widely validated in sociophysics research, indicating that the degree of polarization is jointly determined by the strength of opinion alignment within the group and the concentration of opinion distribution. The first part of the formula represents the mean absolute deviation in the sentiment dimension, quantifying the extent to which members deviate from the community’s average sentiment; smaller values indicate higher sentiment homogeneity. The second part measures concentration in the topic dimension. This study employs this composite metric to simultaneously capture the homogeneity of communities across both sentiment and topic dimensions. Compared with single-dimension measures, it more accurately reflects the intrinsic characteristics of group polarization. A higher polarization index indicates that members within a community exhibit a strong alignment in sentiment and a concentrated focus on topic discussion, a condition typically driven by a small number of accounts that consistently post emotionally extreme and topically focused content.
C o m m u n i t y   P e n e t r a t i o n = 1 n c v c n v n v ,
In the equation, Community Penetration represents the cross-community penetration rate of community c; n v denotes the number of valid comments made by comment node v’s content in all other communities; n v is the total number of valid comments posted by comment node v across the entire network; and n c is the number of commenters in community c. The calculation of this metric is based on the community structure detected previously using the Louvain algorithm, where each user is assigned to a community according to the partitioning results. By iterating through the comment dataset, the total number of comments for each user is counted, and the community of the commented user is determined using their user ID, enabling precise calculation of the number of comments a user directs to other communities. Finally, the individual penetration rates of all users within a community are averaged to obtain the community’s overall cross-community penetration rate. Measuring this indicator in the manner described effectively quantifies the capacity of information to break through “information cocoons,” reflecting the effectiveness of accounts in disseminating specific viewpoints across diverse interest groups. A higher cross-community penetration rate indicates that an account can transcend its original community boundaries and influence public opinion across a broader network space. By combining community partitioning with user-level data, calculating the cross-community penetration rate of each account enables the identification of key nodes that are capable of strategically steering opinion trends across multiple communities.
(3)
Network Influence
Network influence is assessed from three dimensions: spread speed, diffusion breadth, and diffusion depth, to evaluate the disruptive impact of information within the global public opinion ecosystem. The specific measurement methods for secondary indicators, such as propagation speed, are detailed in Formulas (7)–(9).
S p r e a d   S p e e d = N c t t ,
In the formula, Spread Speed represents the propagation speed; N c t denotes the total number of comments within time t; and t is the time unit. This metric is calculated at the level of individual original posts. The publication time of each post is first recorded, and all related comments and their timestamps are collected. The key parameter t represents the observation time window, which is uniformly set to 24 h in this study to ensure comparability across different information units. The linear computation model is chosen for the following reasons: (i) it has a clear physical interpretation, intuitively reflecting the rate of information diffusion; (ii) it offers high computational transparency, avoiding the bias and complexity associated with estimating multiple parameters in complex models such as SIR or SEIZ; and (iii) it is highly efficient, making it suitable for large-scale social media datasets and enabling rapid measurement and cross-sectional comparison of massive information flows. In practice, some accounts may post multiple comments consecutively within minutes on certain social hotspot events. These comments are quickly noticed, shared, and replied to by other users, thereby accelerating the spread of information across the network. The propagation speed is calculated as the ratio of the total number of comments to time, where a higher value indicates faster dissemination of information.
D i f f u s i o n   B r e a d t h = n m a x N ,
In the formula, Diffusion Breadth represents the breadth of diffusion; n m a x is the maximum number of comments replying to a specific post within a layer; and N is the total number of nodes in the network. This metric is calculated based on diffusion trees constructed from Weibo reply relationships, using the seed post as the root node (layer 0), with direct commenters as layer 1, and subsequent layers determined accordingly. By traversing each layer, the maximum number of comments within that layer is identified. This calculation method effectively quantifies the penetration of information across the layers of a diffusion network. It accounts not only for the horizontal diffusion scale, represented by the maximum number of comments within each layer, but also normalizes for network size, enabling the comparison of diffusion breadth across different networks. This indicator focuses on capturing “bottleneck” or “peak” effects during the diffusion process; higher values indicate that a particular layer has elicited extremely high group attention, typically triggered by influential key accounts. Therefore, based on propagation tree structures constructed from Weibo post–reply data, computing the proportion of maximum comments within each layer and taking the average allows for the identification of key accounts capable of extensively disseminating information across multiple hierarchical levels.
D i f f u s i o n   D e p t h = 1 D i = 1 D t c , i t b , i ,
In the formula, Diffusion Depth represents the depth of diffusion; D denotes the set of valid comments; t c , i represent the timestamps of the i-th valid comment and the original post by the blogger, respectively. This metric is calculated at the level of individual original posts. The publication timestamp of the blogger’s original post is recorded, all valid comments under the post are collected, and the exact timestamp of each comment is noted. The metric is then obtained by calculating the mean of the time differences between all comments and the original post. Calculating this metric using the mean time difference directly reflects the persistence and penetration efficiency of information diffusion. Higher values indicate that comments are temporally dispersed, suggesting longer-lasting and deeper information propagation, whereas lower values indicate concentrated commenting times, corresponding to rapid but short-lived dissemination. Based on these timestamp data, this indicator effectively captures the temporal penetration characteristics of information diffusion, providing a quantitative basis for analyzing the long-term evolution of public opinion.

4. Experiment

4.1. Data Collection and Preprocessing

This study uses the Russia–Ukraine War as its research context, primarily due to its high public attention, extended duration, and prominent information manipulation on social media platforms [51,52]. The Chinese social media platform Weibo is chosen as the main data source. As one of China’s most representative public opinion platforms, Weibo features a strong topic aggregation mechanism and a large user base, providing a relatively comprehensive view of opinion dissemination within the Chinese linguistic environment. Specifically, the study uses high-frequency search terms such as “Russia-Ukraine War,” “Russia,” “Ukraine,” “NATO,” “Zelensky,” and “Putin.” Using Python-based web crawlers, related posts and comments were collected from 1 February 2022, to 1 March 2025. In total, 289,351 original posts and 6,018,045 comments were obtained, forming a multidimensional opinion dataset including post content, user attributes, interaction behaviors, timestamps, and related features. After data collection, the data underwent multilevel preprocessing to ensure quality and effective model training. For example, at the text level, a unified encoding format was applied, and regular expressions were used to remove elements such as “#topic#” tags, “@username” patterns, emojis, hyperlinks, and other special characters. Non-Chinese text and duplicate or highly similar content were also removed.
To ensure effective training and validation of the detection models for social bots and AIGC, the study also constructed relevant labeled datasets. (1) For the social bot dataset, 161 bot accounts were selected using the bot-finder platform, along with 178 verified genuine user accounts as a control group. For these accounts, twelve-dimensional behavioral features described above were collected to capture key attributes of social behavior. And outliers and missing values were removed, ensuring fairness and accuracy in model training. (2) For AIGC data, 28,436 AI-generated texts were collected from mainstream generative platforms such as ChatGPT (GPT-4o), Kimi (Kimi K1), and Doubao (v2.2.9). During the content generation phase, various prompt templates were applied to produce AI-generated texts covering diverse topics and styles. Examples include the following: “Describe an experience or feeling in [a specific scenario] from the perspective of [a specific identity],” and “Write a brief opinion post on [a specific topic].” In contrast, 24,745 user-generated content (UGC) samples were gathered from public platforms, including Weibo, Zhihu, and news comment sections. Multiple rounds of filtering and manual verification were conducted to ensure the authenticity of the control group samples.

4.2. Social Bot Detection

To evaluate model performance in the social bot detection task, the study trained several machine learning models on the labeled dataset and compared them across key metrics, including accuracy, precision, recall, and F1 score [53]. As shown in Table 3, XGBoost outperformed the others, demonstrating strong generalization and stability. To further investigate the discriminative basis of the XGBoost model, a feature importance analysis was conducted. The results indicate that verification status (importance score: 0.401), activity abnormality (importance score: 0.151), follower–following ratio (importance score: 0.086), and content length (importance score: 0.074) are the four primary features relied upon by the model, highlighting the decisive roles of account authenticity, behavioral regularity, social relationship rationality, and content generation patterns in identifying social bots. In contrast, features such as information completeness and nickname autonomy contributed relatively little. This analysis provides data-driven evidence that social bots may guide public opinion primarily through falsified identities and manipulated behaviors rather than content generation strategies. Based on its advantages in both overall performance and interpretability, XGBoost was therefore selected as the final model for social bot detection.
Based on the optimized model, the study extracted features from 38,121 accounts and their 289,084 associated Weibo posts, identifying 24,635 social bot accounts. To better reveal the behavioral evolution of social bots, data from genuine human users (Human) were used as a reference, and a systematic analysis was conducted along three dimensions: account activity, posted content, and social behavior.
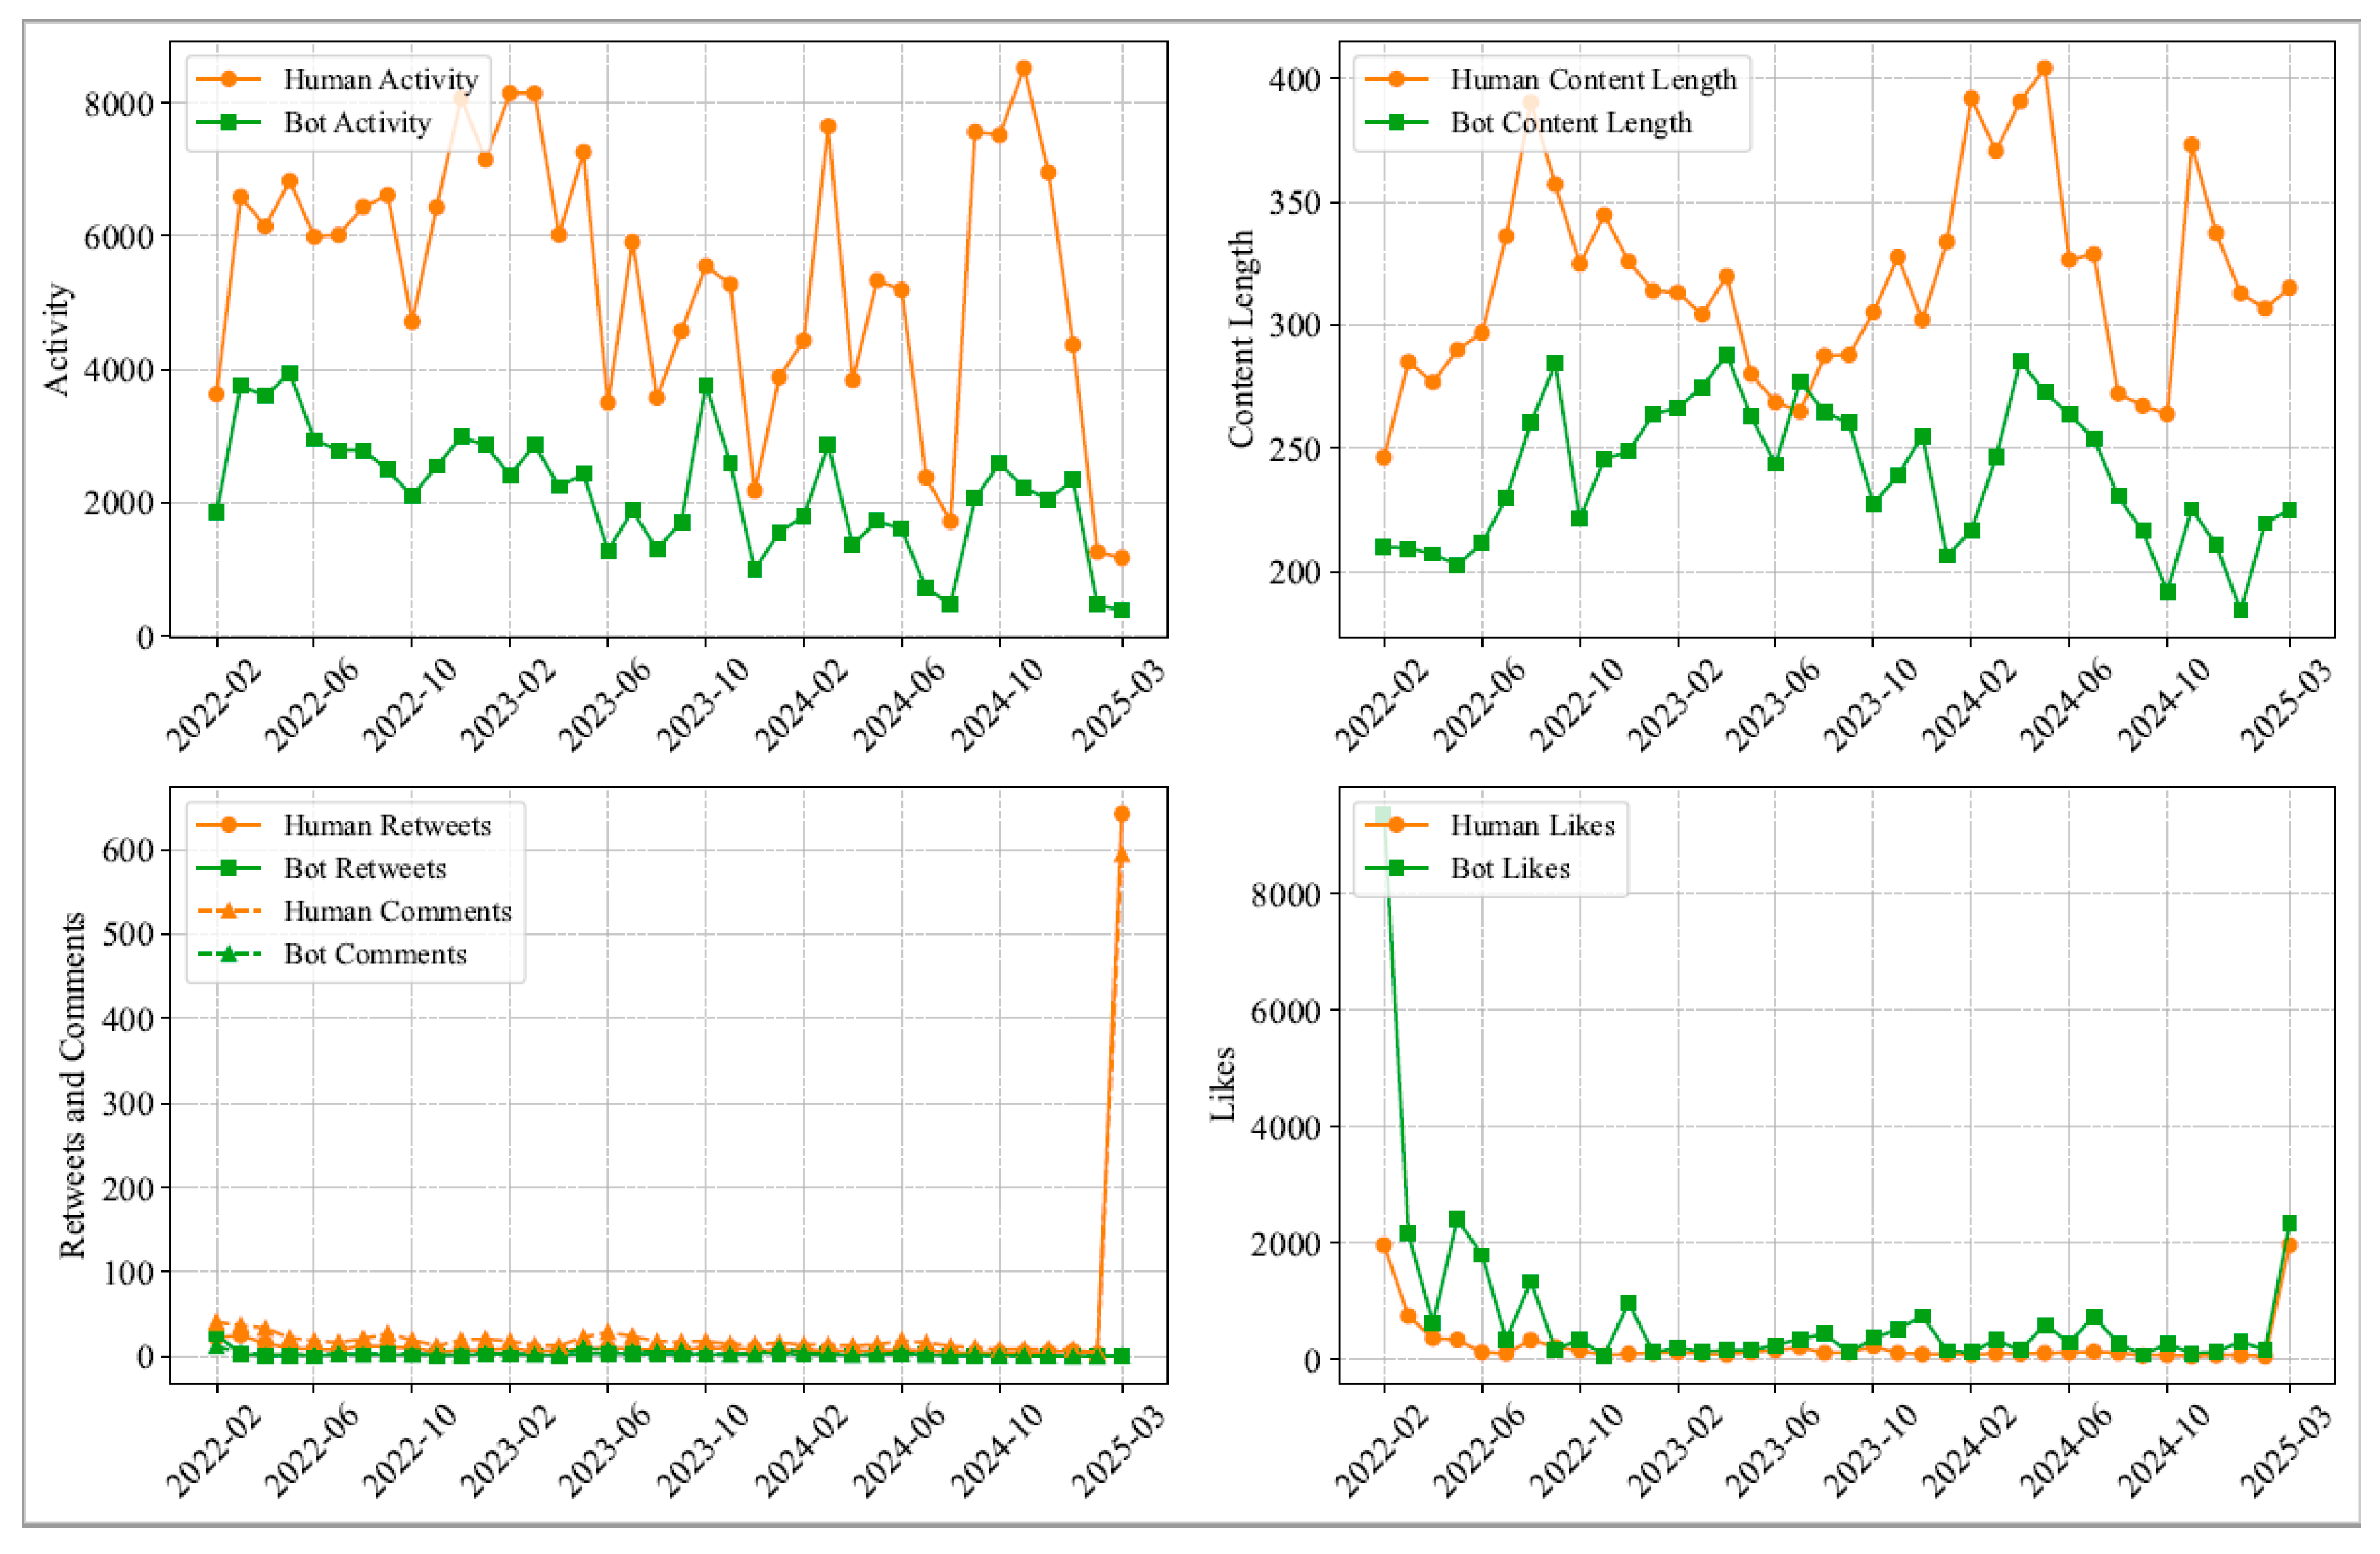
Figure 3 presents the behavioral dynamics of social bots and human users across three aspects. First, account activity showed a synchronized surge in both groups at the onset of the war, especially around key public opinion events. As the conflict progressed into a protracted phase and public attention declined, user activity dropped significantly, with bots following a similar downward trend. This pattern reflects the event-driven nature of engagement and the staged influence of the war on discourse dynamics. Second, content characteristics, measured by the average length of posts, also fluctuated in parallel. In most cases, bots mirrored human users in text length during both high and low attention periods. This suggests a deliberate imitation strategy designed to increase concealment and integrate more seamlessly into human discourse. Third, social interaction patterns revealed an early spike in retweets, comments, and likes, followed by stabilization. Bots maintained lower and more consistent interaction levels, while human users reacted more actively and emotionally to unfolding events. This contrast highlights bots’ consistent, rule-based behavior versus the emotionally driven and context-sensitive responses of human users.

4.3. AESB Content Identification

4.3.1. AIGC Model Training

To identify AIGC effectively, the study employed a full fine-tuning strategy, updating both the BERT backbone and the classification layer to adapt the model to the task-specific characteristics. During preprocessing, the BertTokenizer was used for tokenization, with input sequences padded or truncated to a fixed length of 512 tokens to meet BERT’s requirements. In the fine-tuning process, lower encoder layers were frozen, while higher Transformer layers and the classification head were updated to balance training efficiency and model generalization. During training, the model generated logits through forward propagation, which were compared with true labels to compute cross-entropy loss. Parameters were optimized using the AdamW algorithm.
After training, the fine-tuned BERT model was evaluated on validation and test sets. The results show that the model achieved high accuracy and robust classification performance for both UGC and AIGC texts. It maintained balanced precision and recall across categories, effectively identifying AI-generated content while accurately distinguishing human-written texts. Notably, the model achieved a higher recall rate for AIGC detection, indicating its strong sensitivity to AI-generated features. Both macro-F1 and weighted-F1 scores exceeded 0.97, confirming that the fine-tuning strategy significantly improved generalization and stability, meeting practical needs for AIGC detection.

4.3.2. Misclassification Causes

To understand the limitations of the model’s decision-making mechanisms and identify systematic biases, this study conducted an in-depth analysis of classification errors. In the training set, 2816 human-generated texts were misclassified as AIGC, whereas only 91 AIGC samples were misclassified as human-generated; in the validation set, the corresponding errors were 419 and 13, respectively; and in the test set, they were 853 and 31. This pattern is highly consistent across datasets, indicating that the model exhibits an over-sensitivity to AIGC features while demonstrating relatively limited ability to discriminate highly human-like AIGC texts.
Human texts misclassified as AIGC primarily result from a mismatch between their formal features and the model’s inherent “AIGC patterns,” often occurring in human creations with distinctive stylistic characteristics and structural complexity. First, formal and standardized writing typically exhibits an objective and rigorous argumentative style, well-structured sentences, and high information density; the model may erroneously associate such highly regularized and depersonalized language with AIGC characteristics. Second, misclassified human texts generally have greater length and higher syntactic variability, indicating that the model tends to interpret long texts, complex sentences, and diverse expressive structures naturally produced by humans when addressing complex topics as indicative of AIGC. Finally, when human texts involve technical concepts, abstract reasoning, or adopt an objective and neutral tone, their surface-level similarity to AIGC texts generated on similar topics increases, making it difficult for the model to effectively distinguish between them.
Conversely, AIGC texts that are misclassified as human-generated primarily do so due to their highly human-like language style and effective use of short-text formats. First, through large-scale language model training and prompt optimization, AIGC can successfully emulate the creativity and diversity of human language, thereby achieving a form of “camouflage” in surface-level linguistic features. Second, misclassified AIGC texts are generally shorter in length, which significantly reduces the signals available for the model to identify statistical features characteristic of AIGC, diminishing classification performance on short-text tasks. Finally, by mimicking subtle imperfections, human-like expressions, and platform-adapted language styles, many AIGC texts are erroneously recognized as human-generated.

4.3.3. AIGC Identification

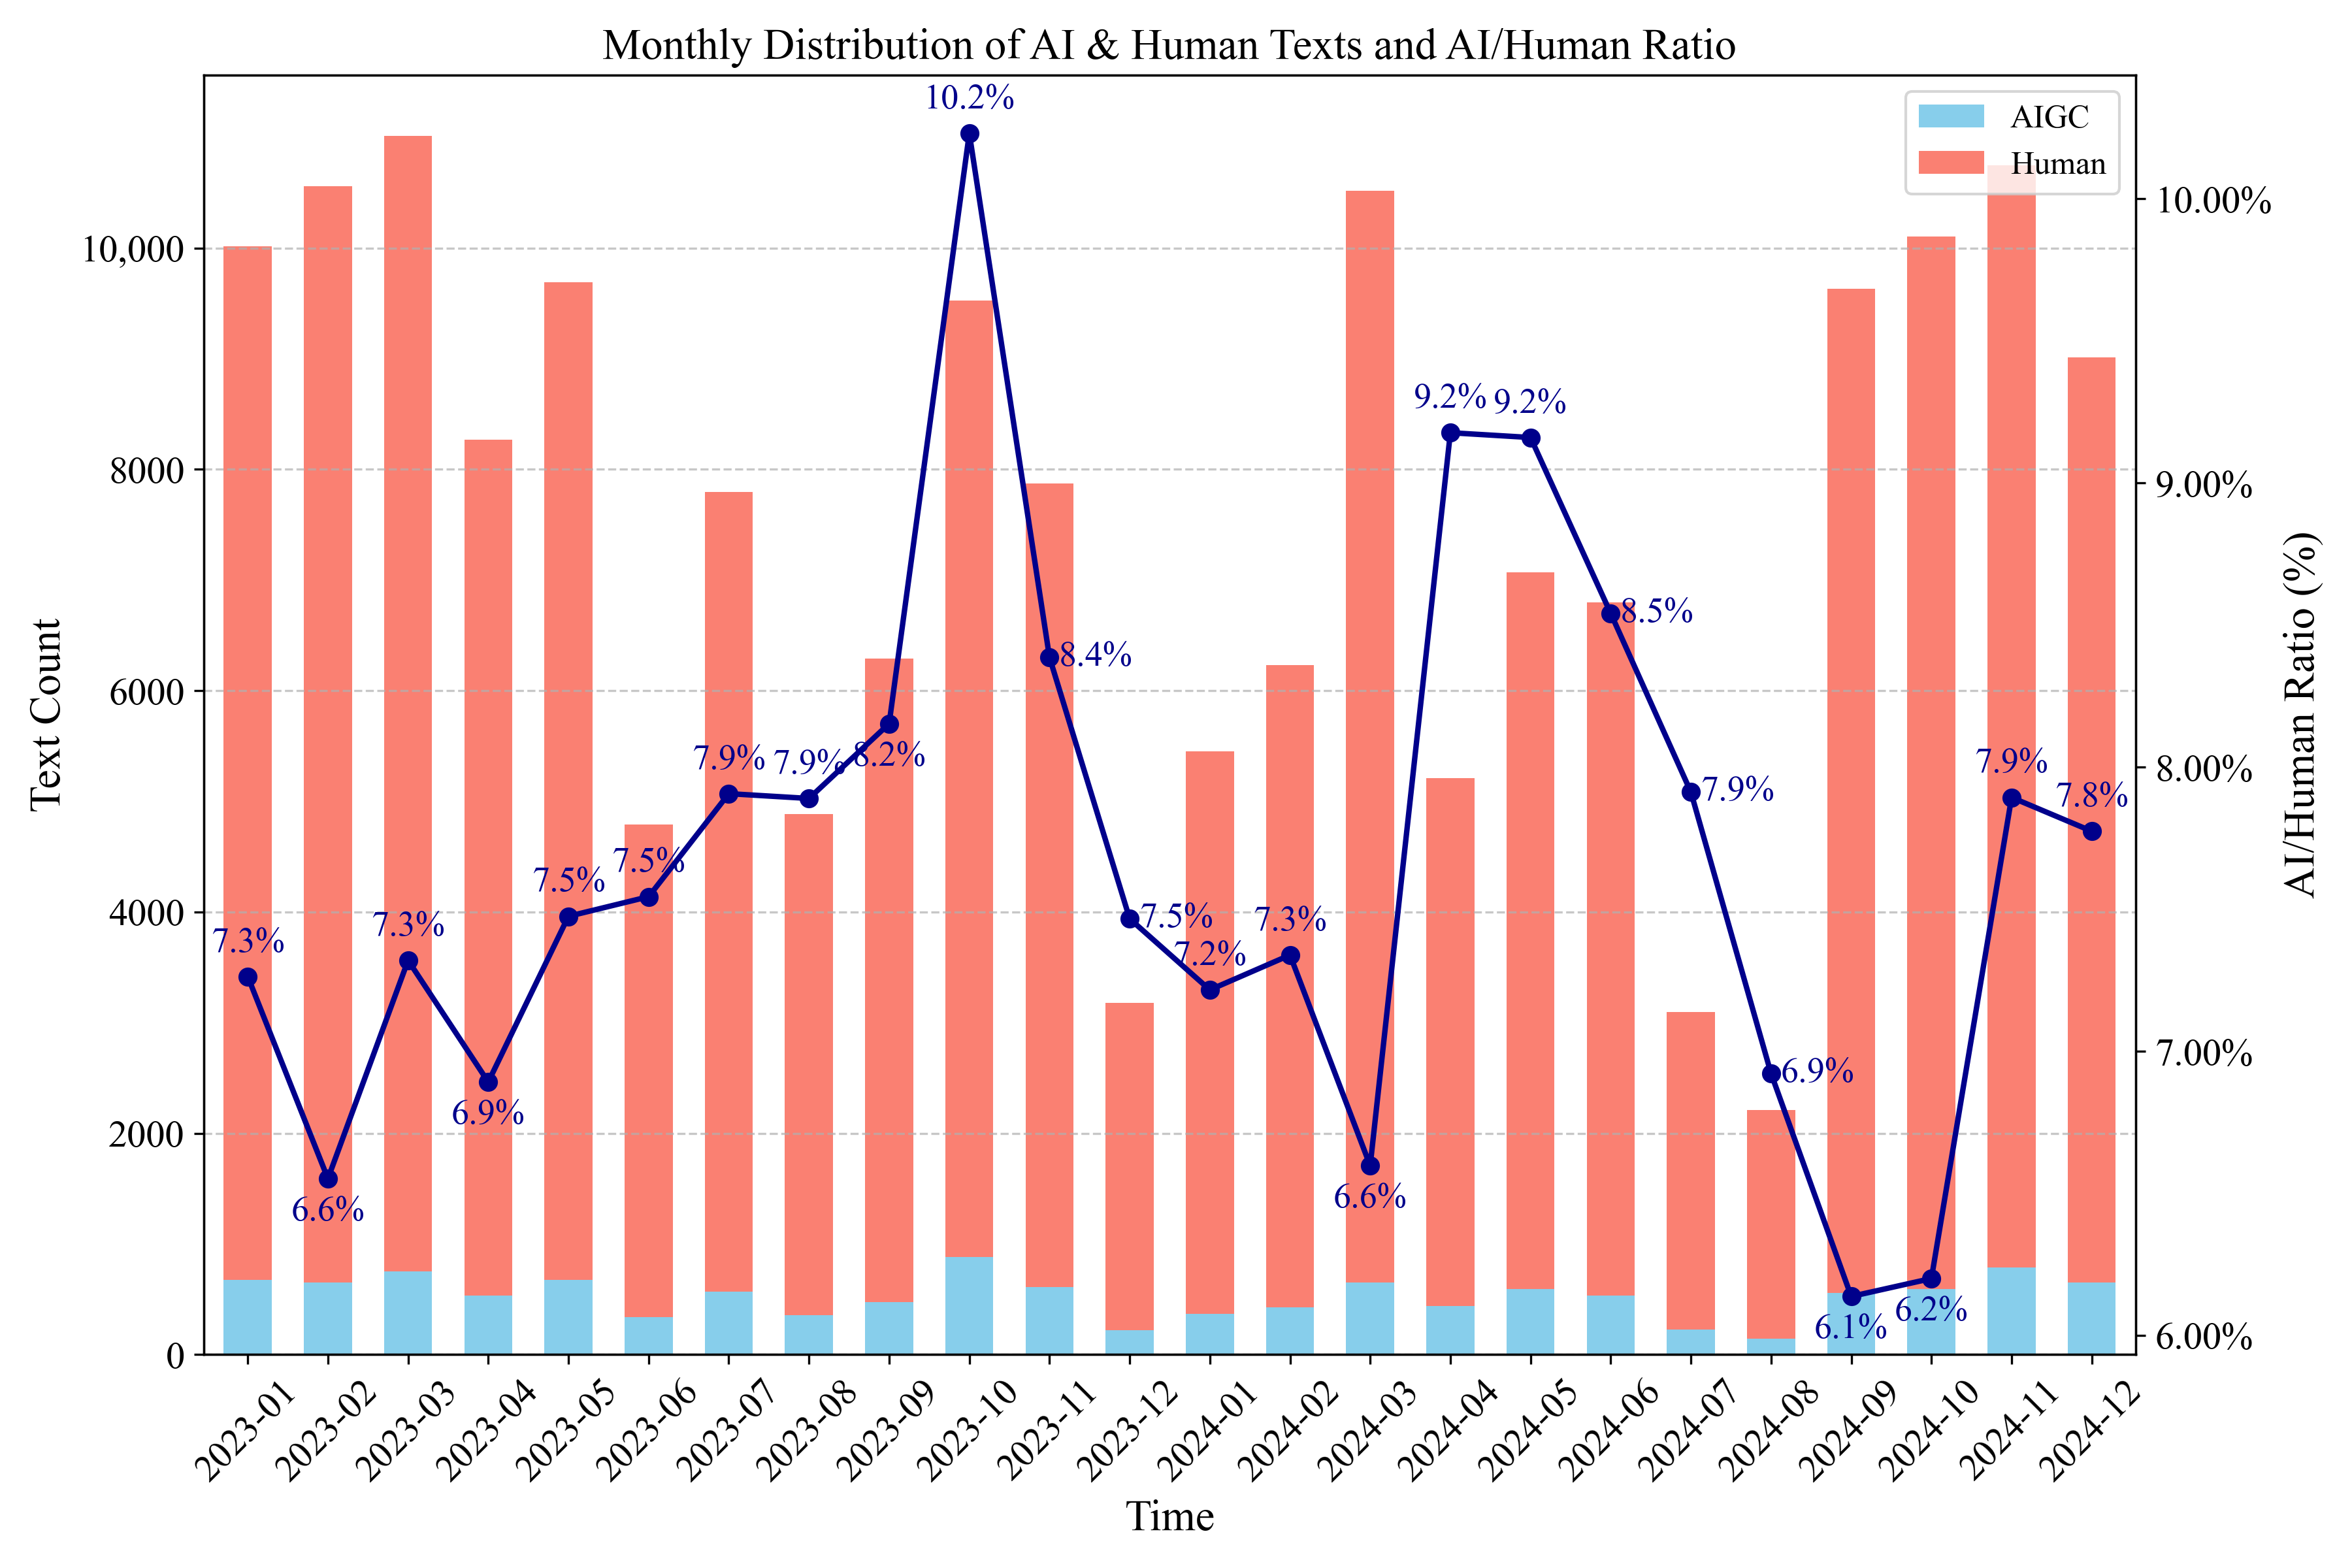
Using the trained BFSC model, the study conducted automated identification on the collected data. As shown in Figure 4, taking data from 2023 to 2024 as an example, the proportion of texts identified as AIGC remained relatively stable over the 24-month period, ranging from 6% to 9%, with an average of 7.66% and minimal fluctuation. This suggests that although AIGC has not become the dominant form of text generation on social platforms, it has maintained a stable, low-frequency presence within real-world social discourse. To further investigate differences in expression characteristics, the study compared AIGC texts with UGC samples in terms of topic distribution and language style.
(1)
Topic distribution trends. Using perplexity-based LDA topic modeling, the optimal number of topics was determined to be 8 for AIGC and 12 for UGC. As shown in Figure 5, both text types exhibited similar coverage of general themes such as the “Trend of the Russia–Ukraine Conflict” and “Global Impact,” indicating shared attention to core events. However, AIGC texts concentrated on more structured themes (e.g., “Global Leaders’ Attention” and “Economic Impact”), while UGC texts reflected more interactive and contextual concerns (e.g., “Territorial Dispute”, “Peace Talks” and “Trump’s Involvement”). This suggests that AIGC tends to exhibit greater topical focus and structural coherence, whereas human-generated content is more diverse and sensitive to event-specific details and social sentiment.
(2)
Language style differences. Four linguistic features were examined: type-token ratio for lexical diversity, sentiment score, average character count, and average word count. Independent samples t-tests were conducted, with results summarized in Table 4. AIGC texts displayed significantly lower lexical diversity than UGC, suggesting a tendency toward more standardized vocabulary. No significant difference was found in sentiment scores (p = 0.359), indicating similar emotional expression between the two. In terms of length, AIGC texts showed higher average character and word counts, with greater variance, suggesting that AI tends to generate more structured and information-rich content.

4.4. Opinion Manipulation Analysis

Building on the previously established quantitative methods, this study constructed a large-scale opinion dissemination social network comprising 256,165 nodes, 10,914 bloggers, 249,395 commenters, and 4144 users acting as both. Edges were formed following the “actor–relation” paradigm [54], including 729,549 post reply interactions and 4,825,448 comment co-occurrence relationships. To comprehensively identify potential manipulation structures, the analysis was conducted progressively at the node, community, and overall network levels.
(1)
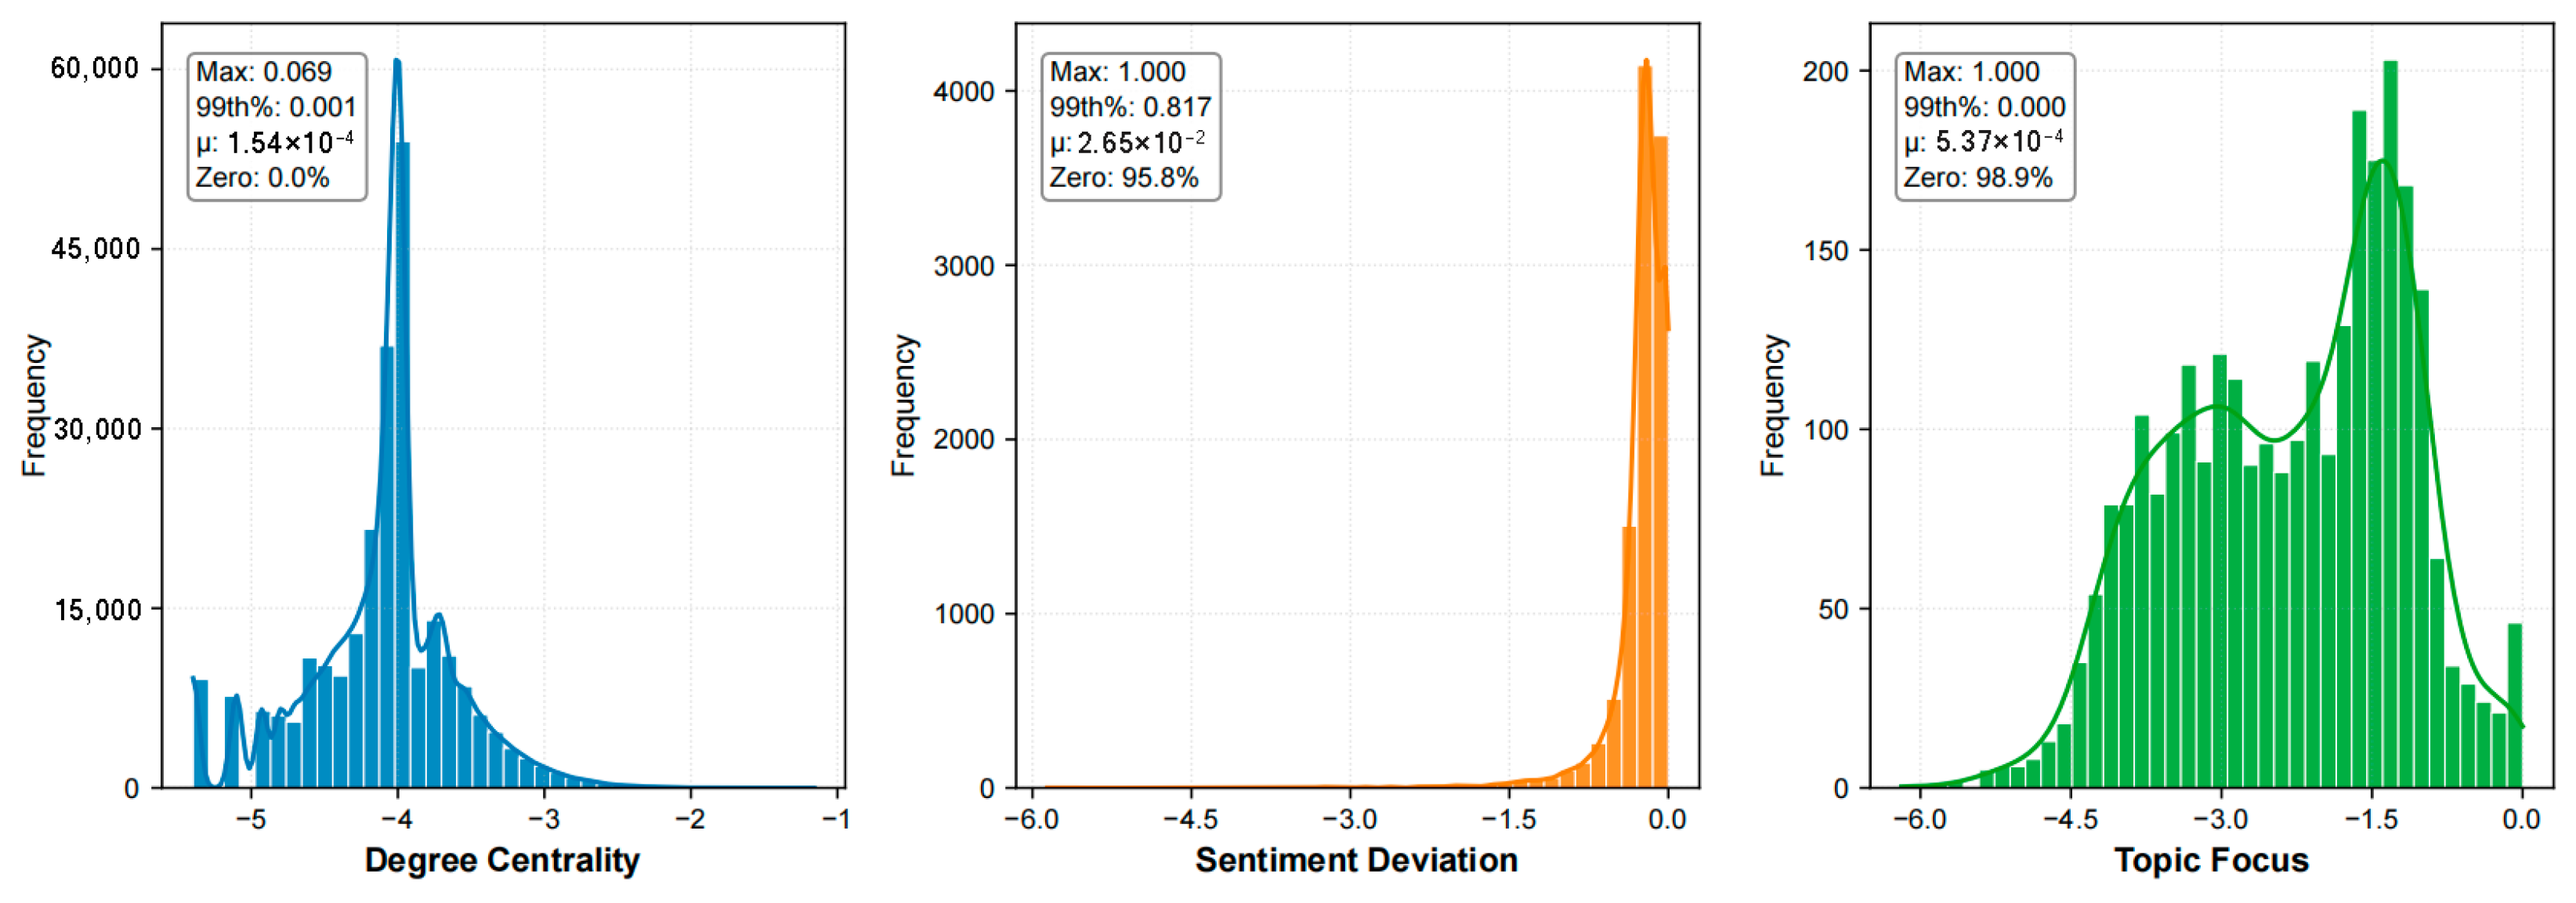
At the node level, Figure 6 visually presents the distribution and interrelationships of three metrics: degree centrality, sentiment deviation, and topic focus. The horizontal axis shows the range of metric values, while the vertical axis indicates frequency. First, the markedly right-skewed distribution of degree centrality indicates extreme inequality in network connectivity. The vast majority of nodes occupy peripheral positions with minimal influence, whereas a small number of nodes possess exceptionally high connectivity, serving as core hubs within the network. These core hubs are likely key nodes that guide information flow and amplify specific content; identifying and monitoring them is crucial for understanding and intercepting malicious opinion manipulation. Second, the distribution of sentiment deviation shows that most nodes (95.8%) have values near zero, suggesting that their content tends to be sentimentally neutral. A minority of nodes exhibit strong positive or negative sentiment deviations. Although few in number, these nodes play a critical role, potentially setting the emotional tone of public discussions through the dissemination of highly polarized content, thereby intensifying conflicts and steering the emotional trajectory of public opinion. Finally, the distribution of topic focus is also skewed to the right. Most nodes discuss a diverse range of topics, which may reflect a camouflage strategy or indicate dispersed guiding intentions. In contrast, nodes with high topic focus consistently concentrate on a limited set of topics. These nodes may shape public discourse effectively by producing dense and repetitive content that directs network discussion toward specific issues, thereby enhancing the coherence and impact of their opinion-guiding actions.
(2)
At the community level, Figure 7 presents the distribution patterns and relationships among modularity, community polarization index, and cross-community penetration rate. First, the distribution of modularity indicates that most communities exhibit relatively loose internal connections and lack tightly cohesive structures, while a few communities display extremely high modularity values. This suggests that internal connectivity within these high-modularity communities far exceeds their random connections with external communities. Such tightly knit communities form the core layers of the network, where their dense internal structures facilitate the formation of highly unified group opinions, accelerate internal information propagation, and reinforce group identity, thereby serving as strategic bases for coordinated manipulative actions. Second, the distribution of the community polarization index shows that most communities maintain relatively balanced opinion distributions, whereas a subset exhibits high polarization. These highly polarized communities may continuously reinforce their members’ preexisting viewpoints through algorithmic recommendations or selective attention, ultimately driving group attitudes toward extremity. Finally, the generally low values of cross-community penetration rate indicate that most communities remain relatively isolated, with limited ability for internal information to spread outward. A minority of communities, however, demonstrate high cross-community penetration capabilities. These communities act as crucial channels connecting different groups, enabling agendas or polarized viewpoints established within core layers to penetrate and disseminate to other communities and real user groups, thereby amplifying influence over public opinion on a broader scale.
(3)
At the network level, the global network is analyzed quantitatively using three key indicators: spread Speed, diffusion Breadth, and diffusion Depth. The results show that information spreads with high speed, low breadth, and high depth. Specifically, the average spread speed reaches 25.51 posts per hour, reflecting efficient public opinion diffusion on social media. However, diffusion breadth is low, as the average comments per post account for only a small fraction of total nodes. This suggests a strong centralization trend, where most comments and attention focus on a few popular posts, while many ordinary posts have limited influence and attract little discussion. Despite this, diffusion depth is relatively high, with an average comment time lag of 34.4 h, indicating sustained penetration of information within specific groups. Overall, these characteristics demonstrate that online opinion diffusion is marked by concentrated spread and lasting influence. Highly active nodes and specific communities amplify opinion guidance, while structures with strong cross-community penetration serve as key channels to break information silos and promote diverse discussions.

5. Results

To systematically evaluate the structural roles of different actor types within the opinion network, this study employs an edge removal strategy to construct three subnetworks. Specifically, interactions involving humans, social bots, and AESB with other users are, respectively, removed, resulting in three edge-removed networks: Human-Excluded, Social Bot-Excluded, and AESB-Excluded. Based on these subnetworks, the study examines the structural impact of the absence of each actor type on overall opinion guidance capacity from three levels: node influence, community structure, and network diffusion.

5.1. Node-Level Structural Influence

At the node influence level, the Human-Excluded subnetwork contains 69,363 nodes, with 116,433 post reply edges and 694,541 comment co-occurrence edges. The Social Bot-Excluded subnetwork includes 237,761 nodes, 667,514 post reply edges, and 4,504,318 comment co-occurrence edges. The AESB-Excluded subnetwork comprises 242,236 nodes, 675,151 post reply edges, and 4,452,037 comment co-occurrence edges. A comparative analysis of node influence metrics across these edge-removed subnetworks was conducted, with the results detailed below.
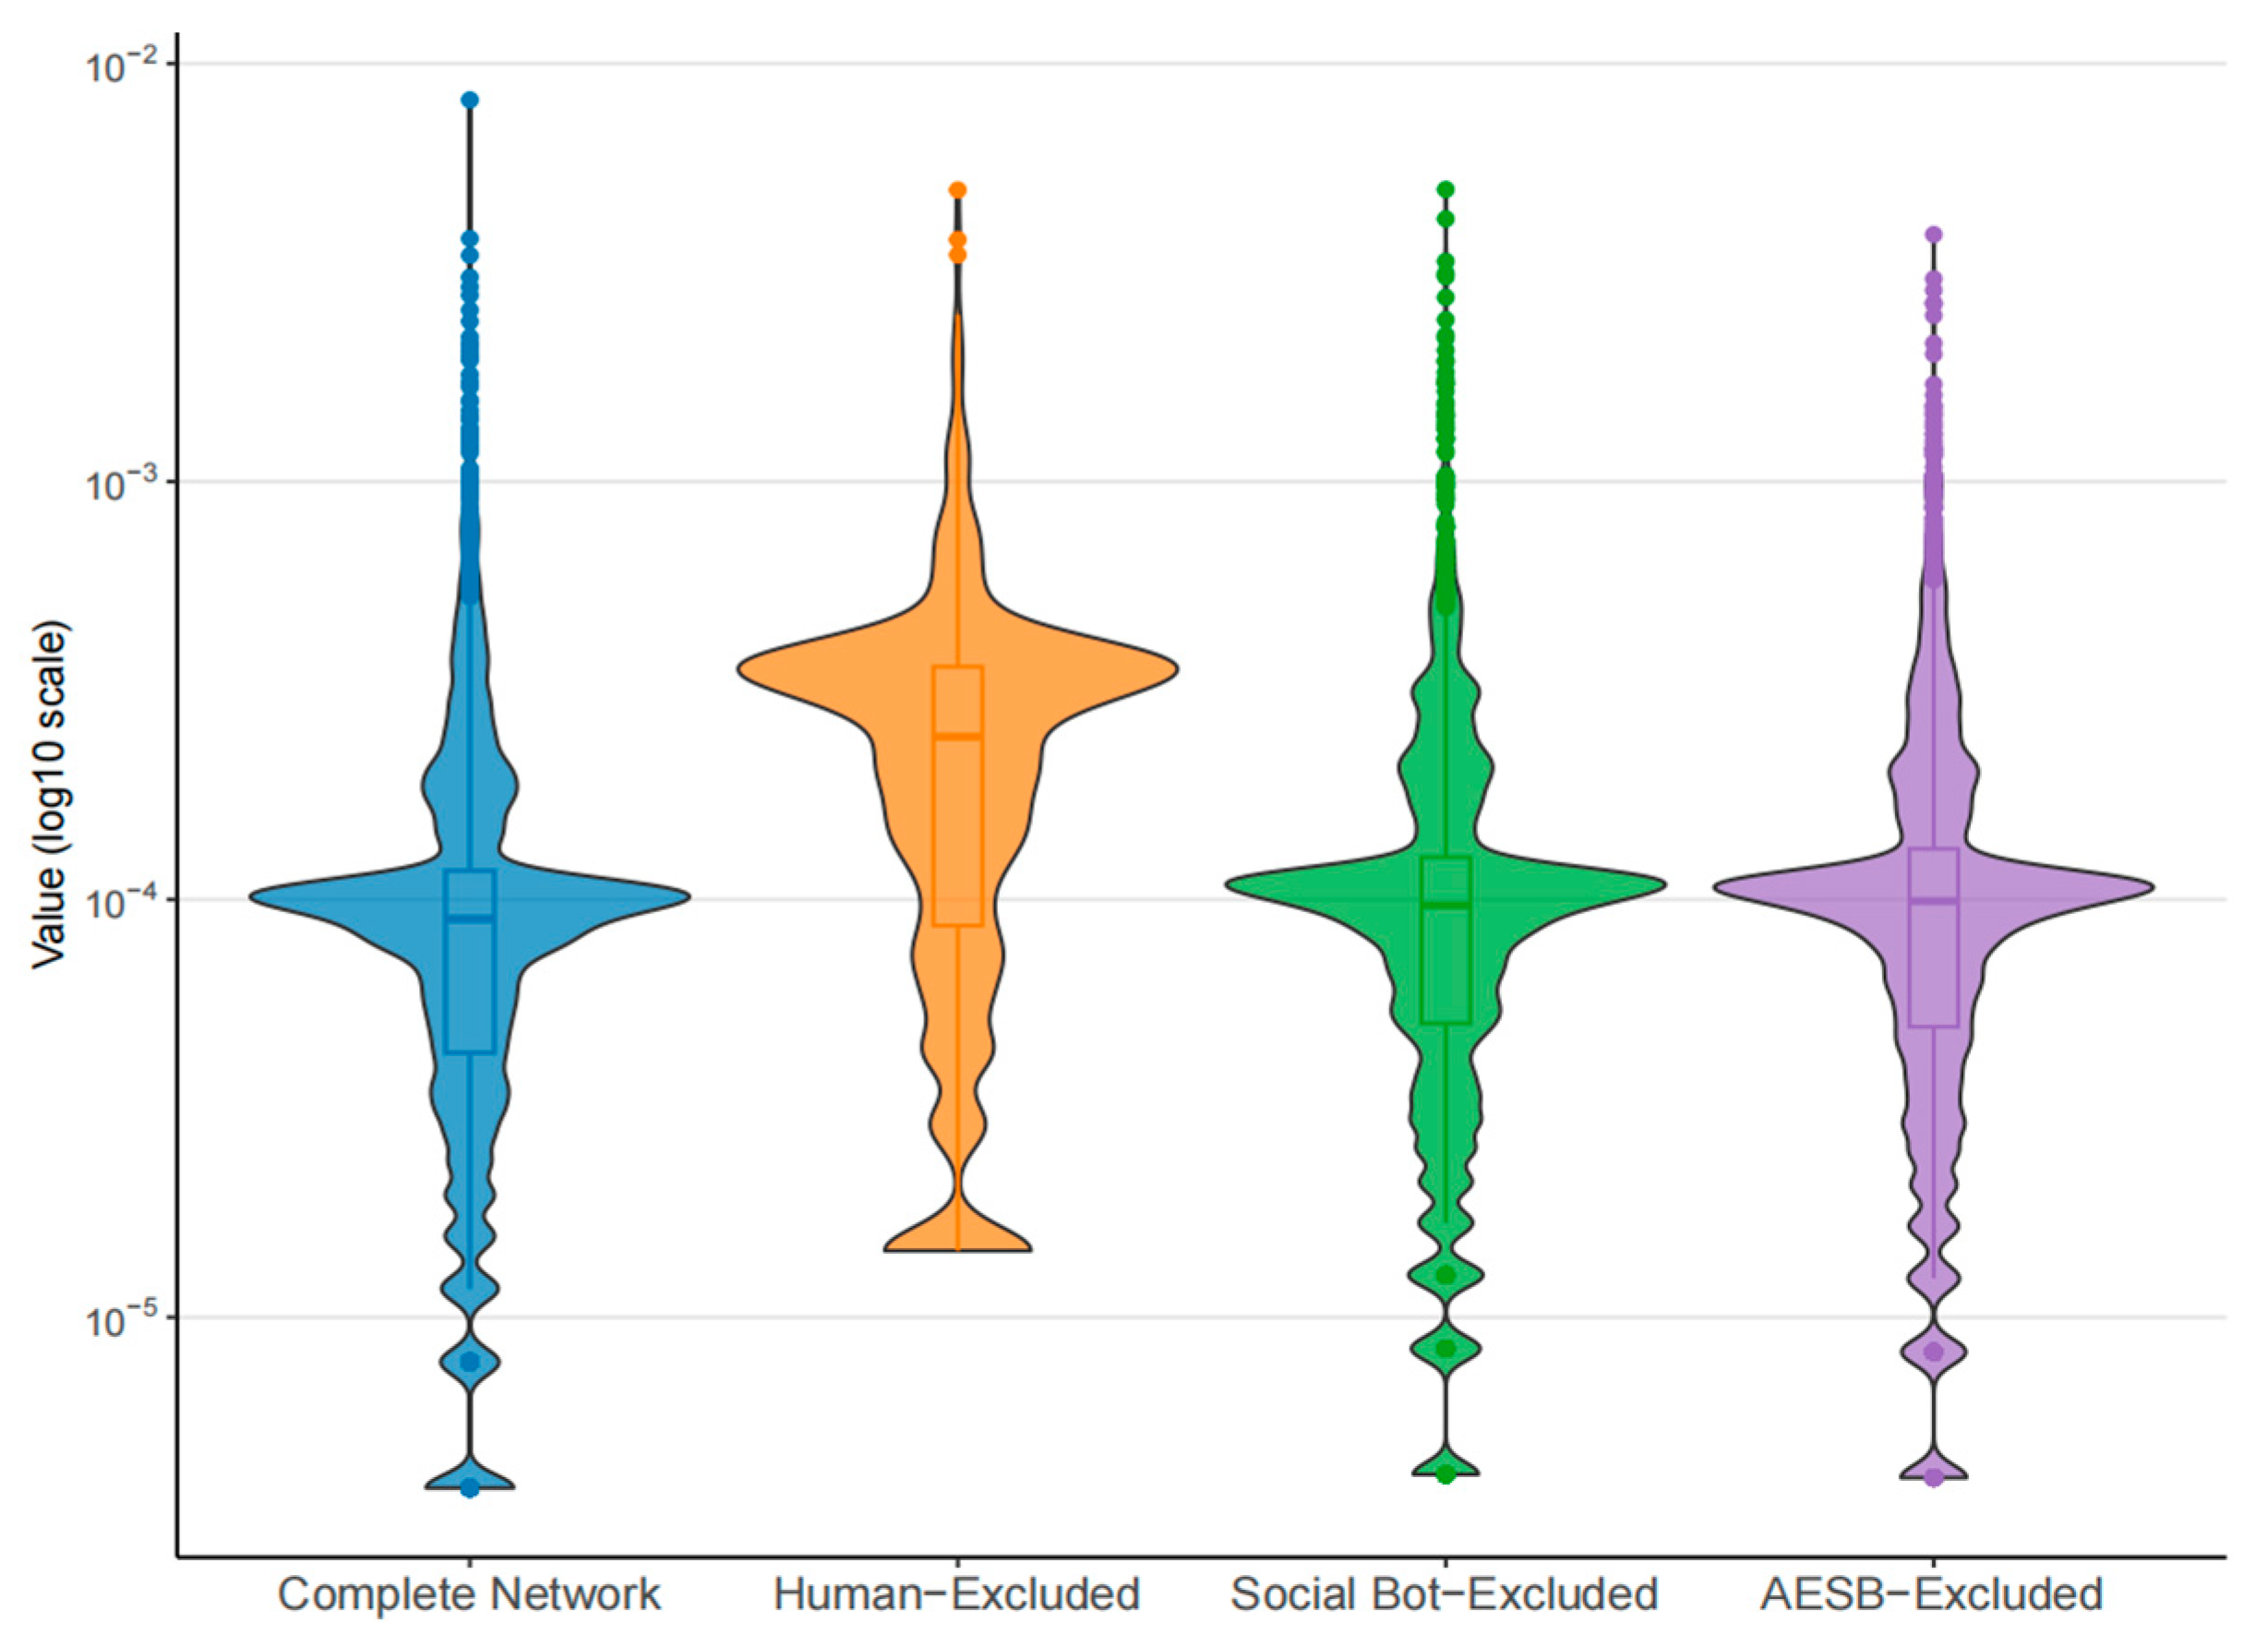
For degree centrality, Figure 8 illustrates its distribution across four network types. The horizontal axis shows the network types (Complete network, Human-Excluded, Social Bot-Excluded, AESB-Excluded), while the vertical axis displays degree centrality values on a logarithmic scale, reflecting node activity. Compared with the complete network, interactions between Social Bots and AESB in the Human-Excluded subnetwork become more concentrated, with a marked increase in degree centrality. This likely results from higher interaction frequency and clustered patterns among these bots, boosting local propagation. Conversely, in the Social Bot-Excluded and AESB-Excluded subnetworks, degree centrality remains largely unchanged, suggesting that while human nodes are broadly connected, their links are sparse and contribute little to structural centrality.
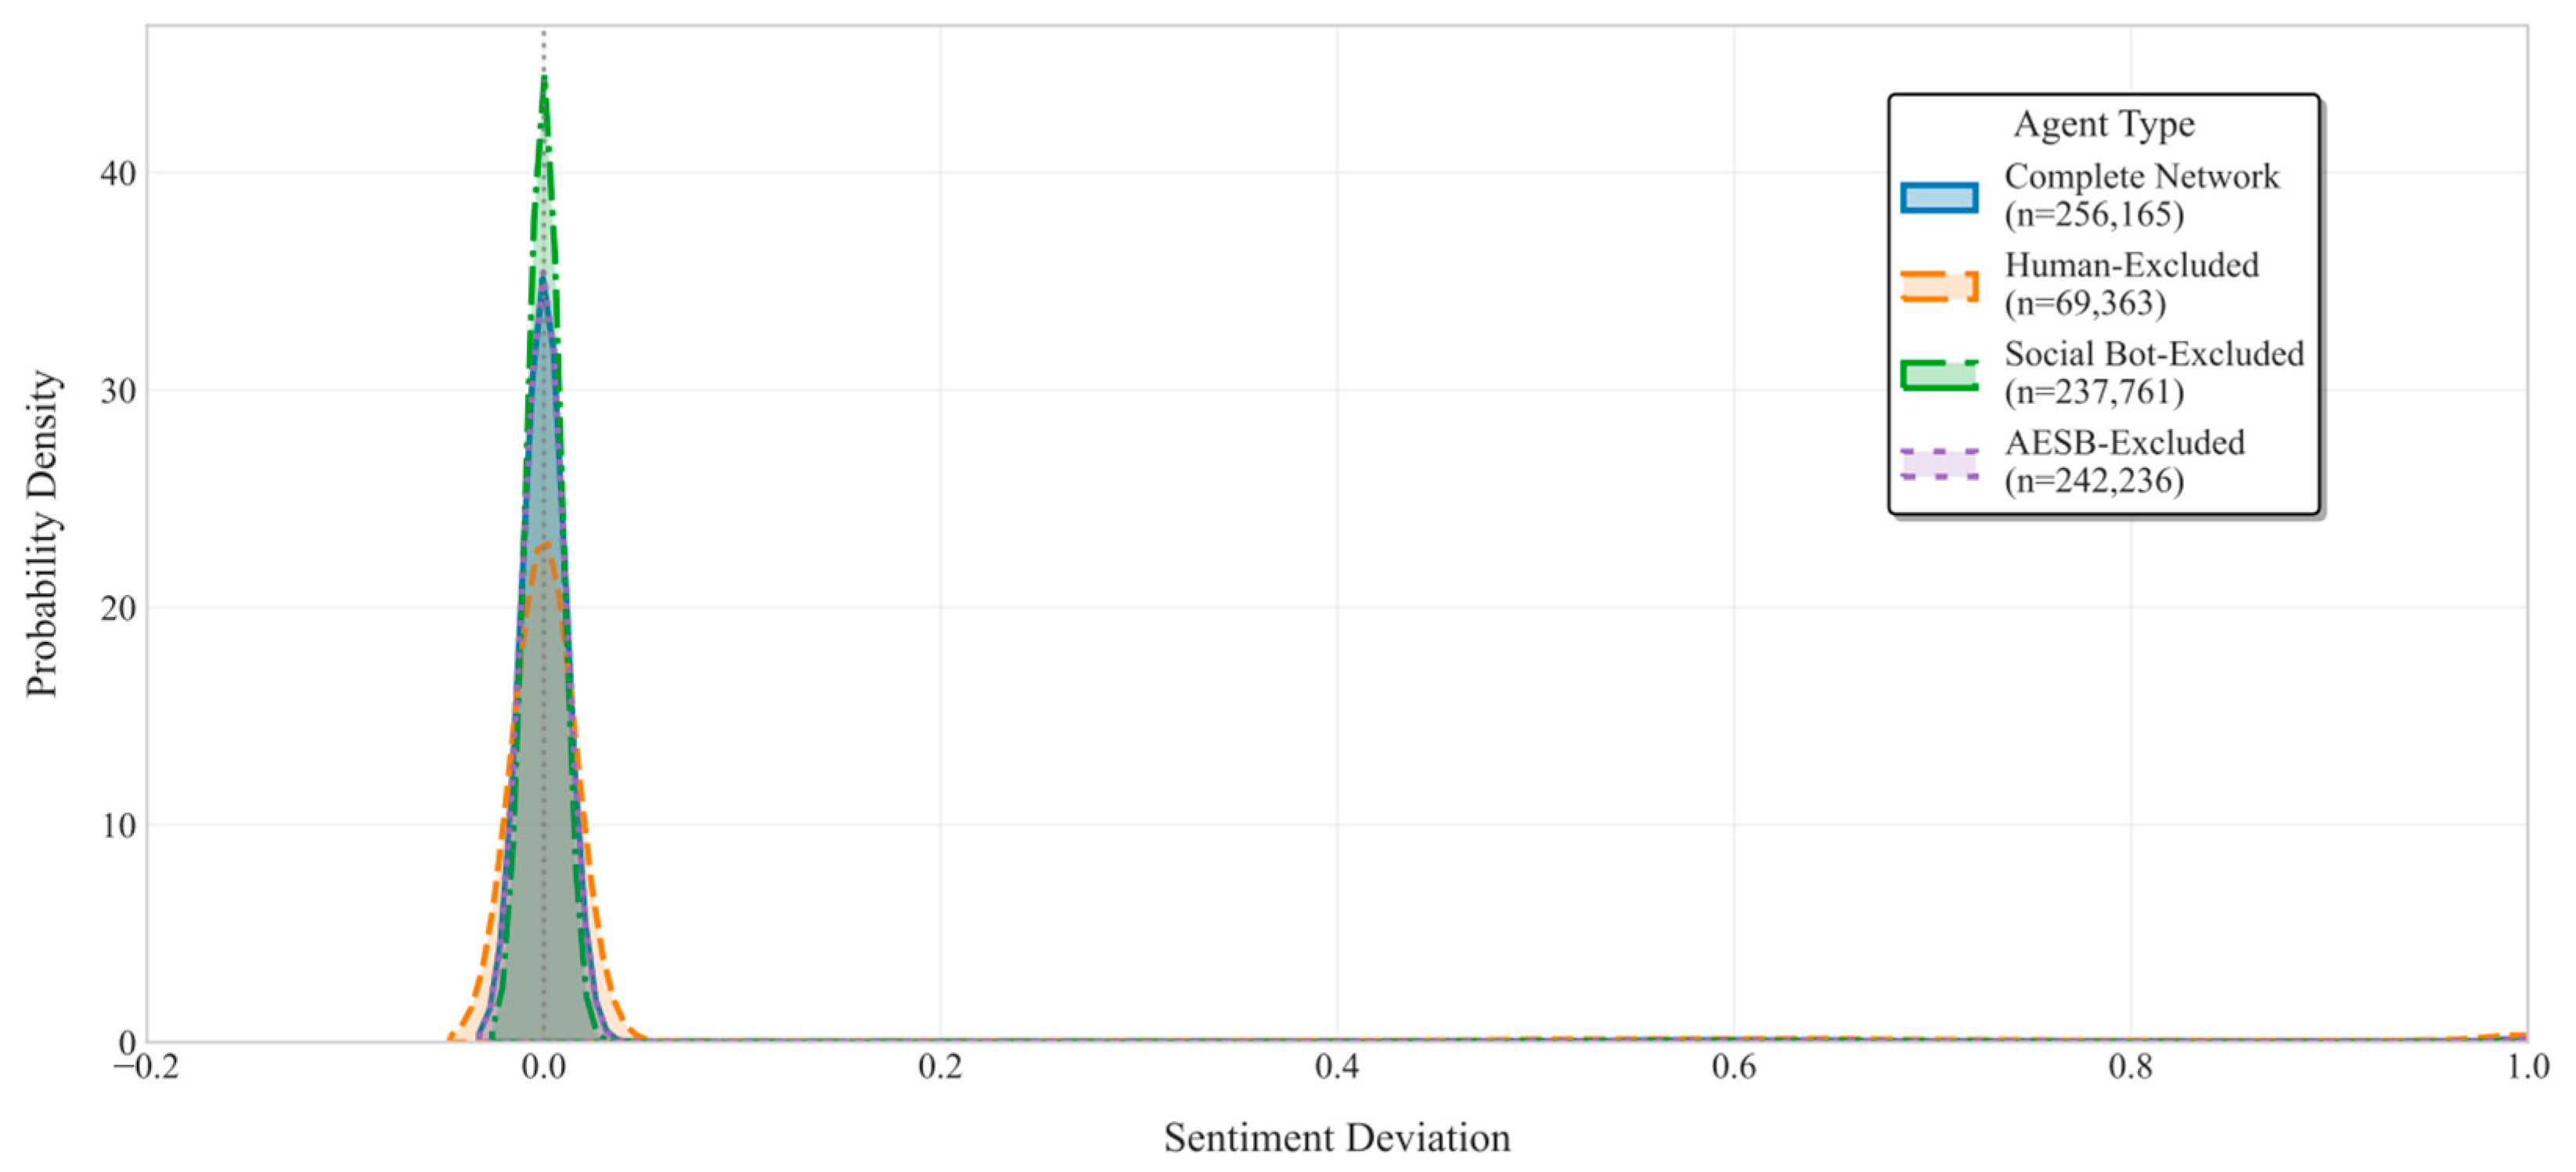
Sentiment deviation is shown in Figure 9, where the vertical axis indicates probability density across the four networks. The Social Bot-Excluded network exhibits the highest sentiment deviation, followed by AESB-Excluded, while the Human-Excluded network shows the lowest. This implies that social bots may function as a form of “balancing noise”; their absence increases emotional consistency, resulting in greater deviation. Further analysis reveals that emotional differences between Humans and AESB intensify in the Social Bot-Excluded network, indicating stronger polarization. Conversely, these differences diminish in the Human-Excluded network, suggesting that human users, with their diverse expression styles and complex stances, serve as an “emotional buffer” in the full network. In the AESB-Excluded network, although overall deviation is not pronounced, the emotional gap between humans and social bots slightly widens, indicating AESB’s moderating role in emotional guidance.
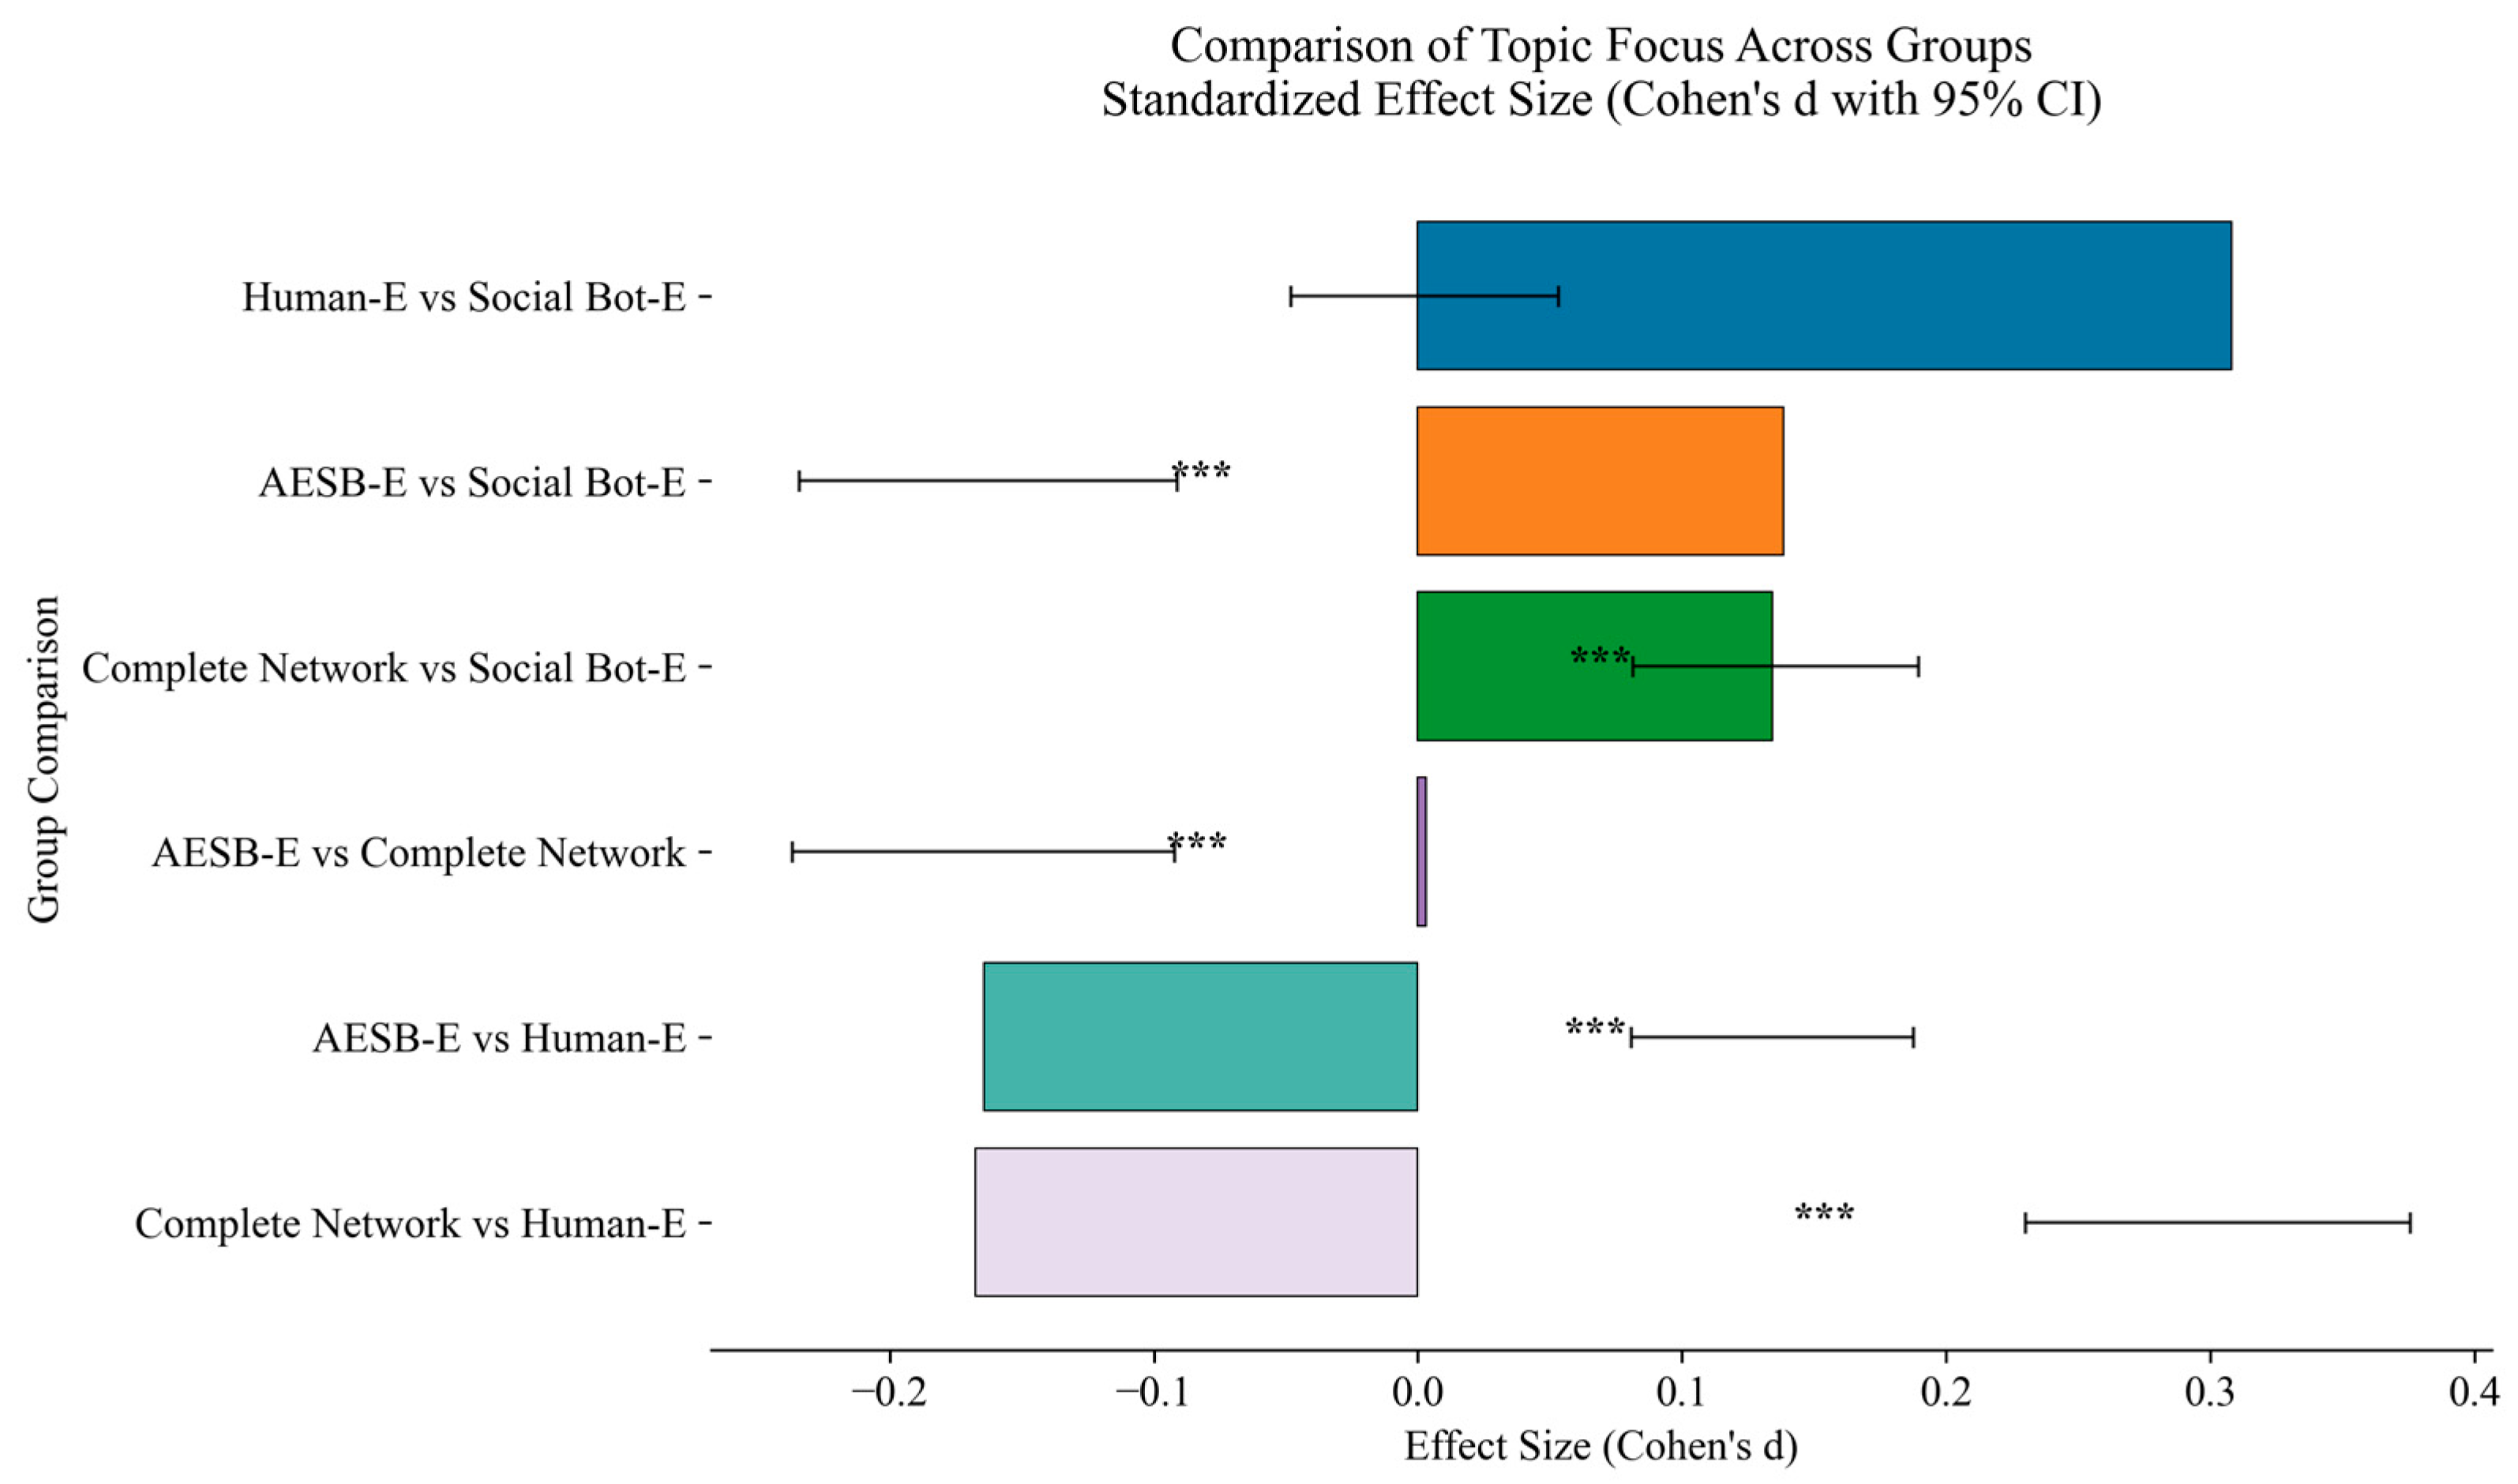
Regarding topic focus, Figure 10 presents the standardized effect sizes (Cohen’s d) and 95% confidence intervals for each subnetwork relative to the complete network. The horizontal axis shows effect size, where positive values indicate increased topic focus and negative values indicate decreases. Significance levels are marked with asterisks (*** p < 0.001). In the Human-Excluded (Human-E) network, topic focus significantly decreased (d = −0.25, *), a small-to-moderate negative effect. This indicates that the removal of human users leads to more dispersed discussion topics, directly confirming that the spontaneous and diverse participation of human users is a key force in enriching the opinion ecosystem and preventing excessive topic concentration. In contrast, the Social Bot-Excluded (Social Bot-E) network exhibited the most pronounced increase in topic focus (d = 0.28, ***), a small-to-moderate positive effect. This suggests that social bots’ core strategy involves high-frequency, repetitive posting around a limited set of popular topics, thereby creating an “echo chamber” effect. Removing these bots dissipates this artificial intensity, allowing discussions to return to more concentrated and authentic focal points. The AESB-Excluded (AESB-E) network also showed a significant decrease in topic focus (d = −0.15, ***), a small negative effect that highlights the unique role of AESB. They can intelligently guide and reinforce specific narratives, actively narrowing the discussion space and steering public opinion in predetermined directions. Consequently, removing AESB reduces this highly efficient “guiding force,” weakening overall topic concentration. Further comparisons reveal that the topic focus in the Human-E network is significantly higher than in the AESB-E network (d = 0.18, *), indicating that the removal of AESB has a stronger effect on diminishing topic focus than the removal of human users, underscoring AESB’s superior capability in concentrating discussion topics. Moreover, the topic focus in the AESB-E network is significantly lower than in the Social Bot-E network (d = −0.12, *), demonstrating that AESB plays a more critical and effective role than social bots in directing topic trajectories and controlling discussion space, highlighting the enhanced opinion-guiding capacity enabled by AIGC technologies.

5.2. Community-Level Structural Influence

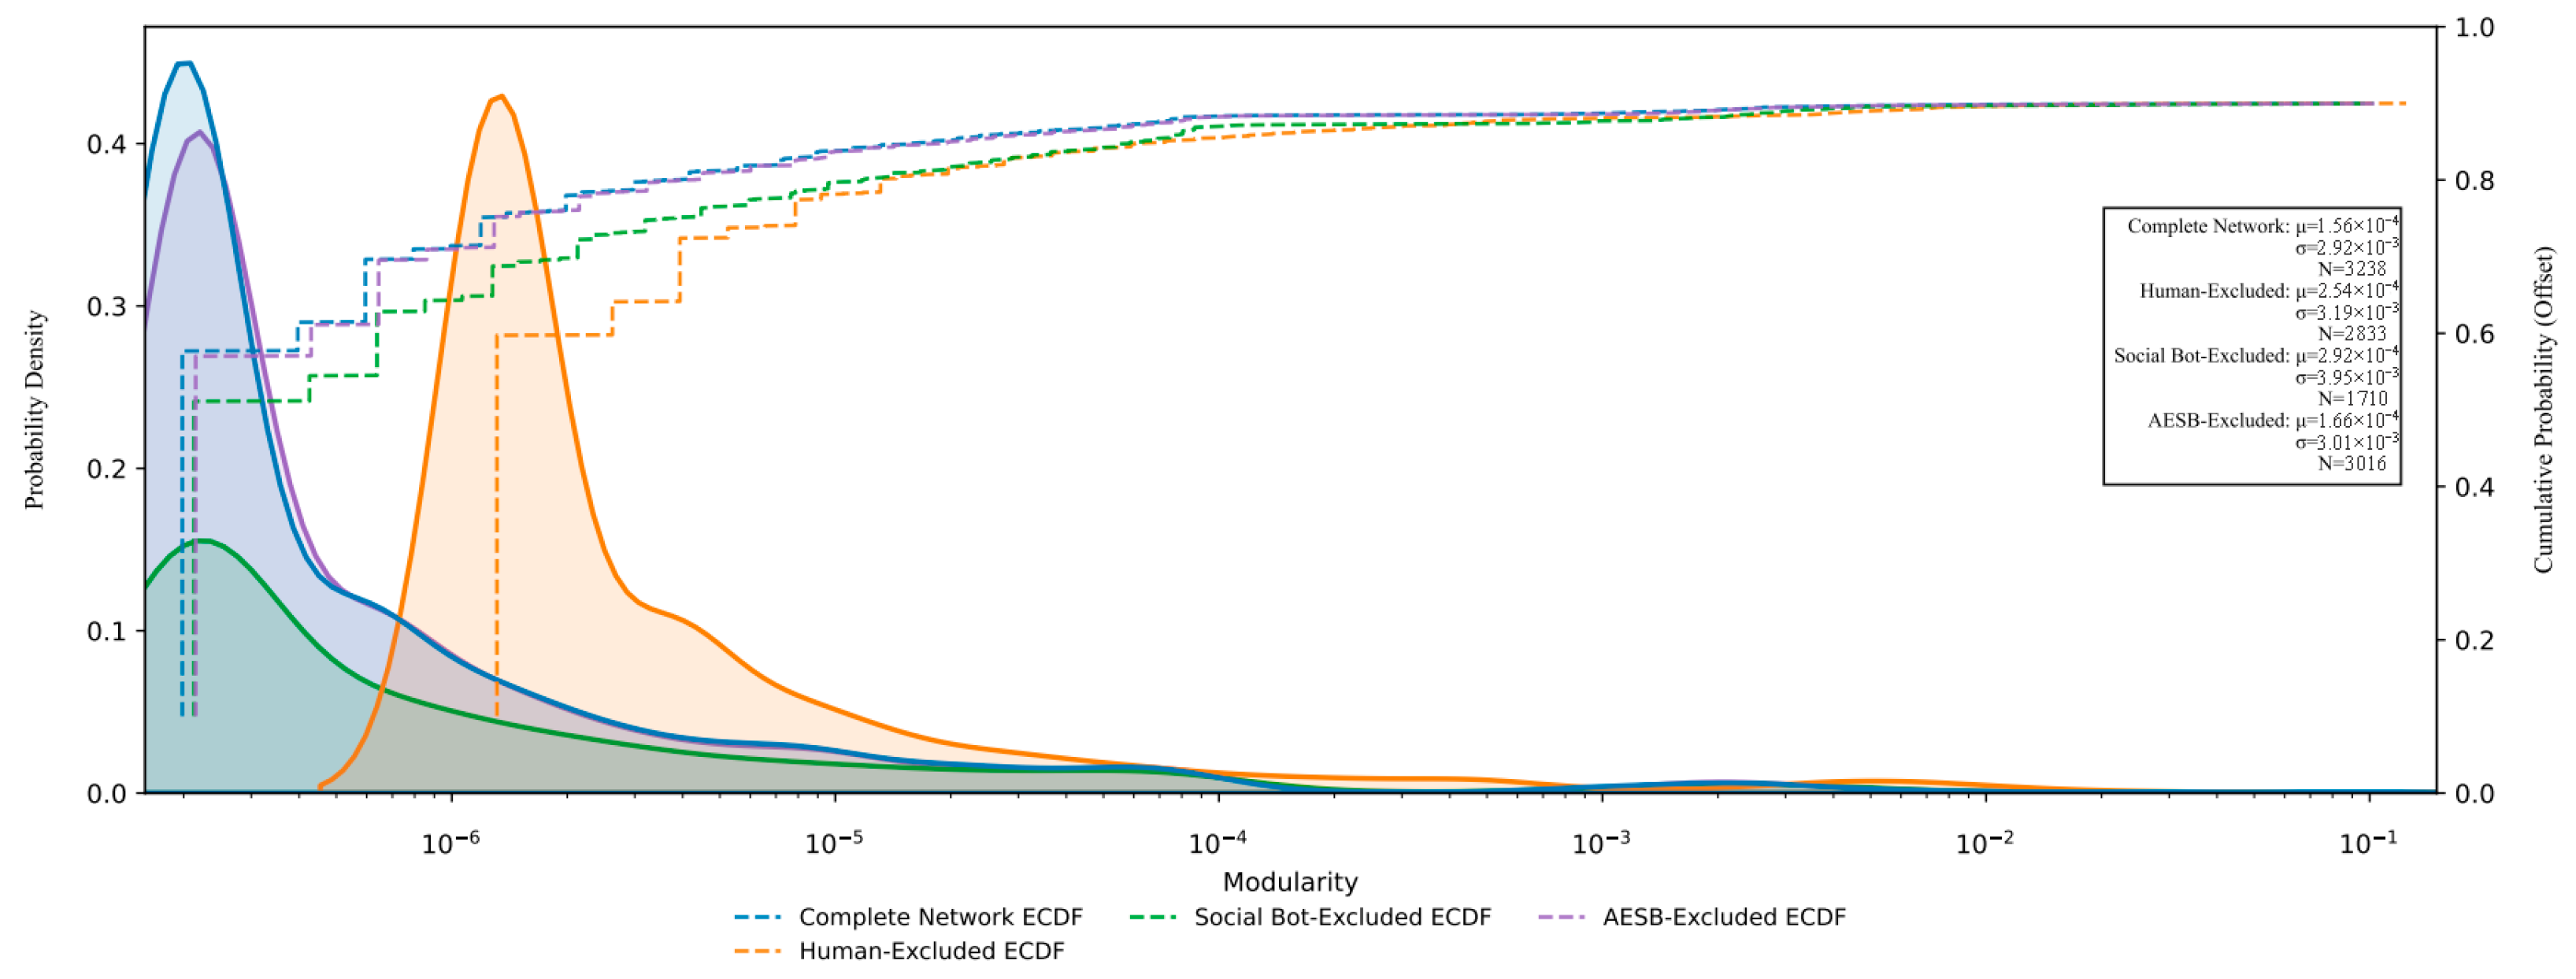
At the community influence level, the removal of the three types of actors led to notable differences. Figure 11 compares the modularity distributions across the four network types. The vertical axis indicates probability density, with each network accompanied by its empirical cumulative distribution function (ECDF) and kernel density estimation (KDE). The Human-Excluded network exhibits a rightward shift in modularity, with a marked peak increase, suggesting that human participation fosters greater diversity in community structures; their absence leads to more distinct and compartmentalized communities. In contrast, the Social Bot-Excluded network shows the lowest modularity peak, indicating that removing social bots weakens community cohesion and results in a looser network structure. The AESB-Excluded network falls between these extremes, implying that AESB helps stabilize community structure, likely by subtly enhancing topic consistency and maintaining community compactness.
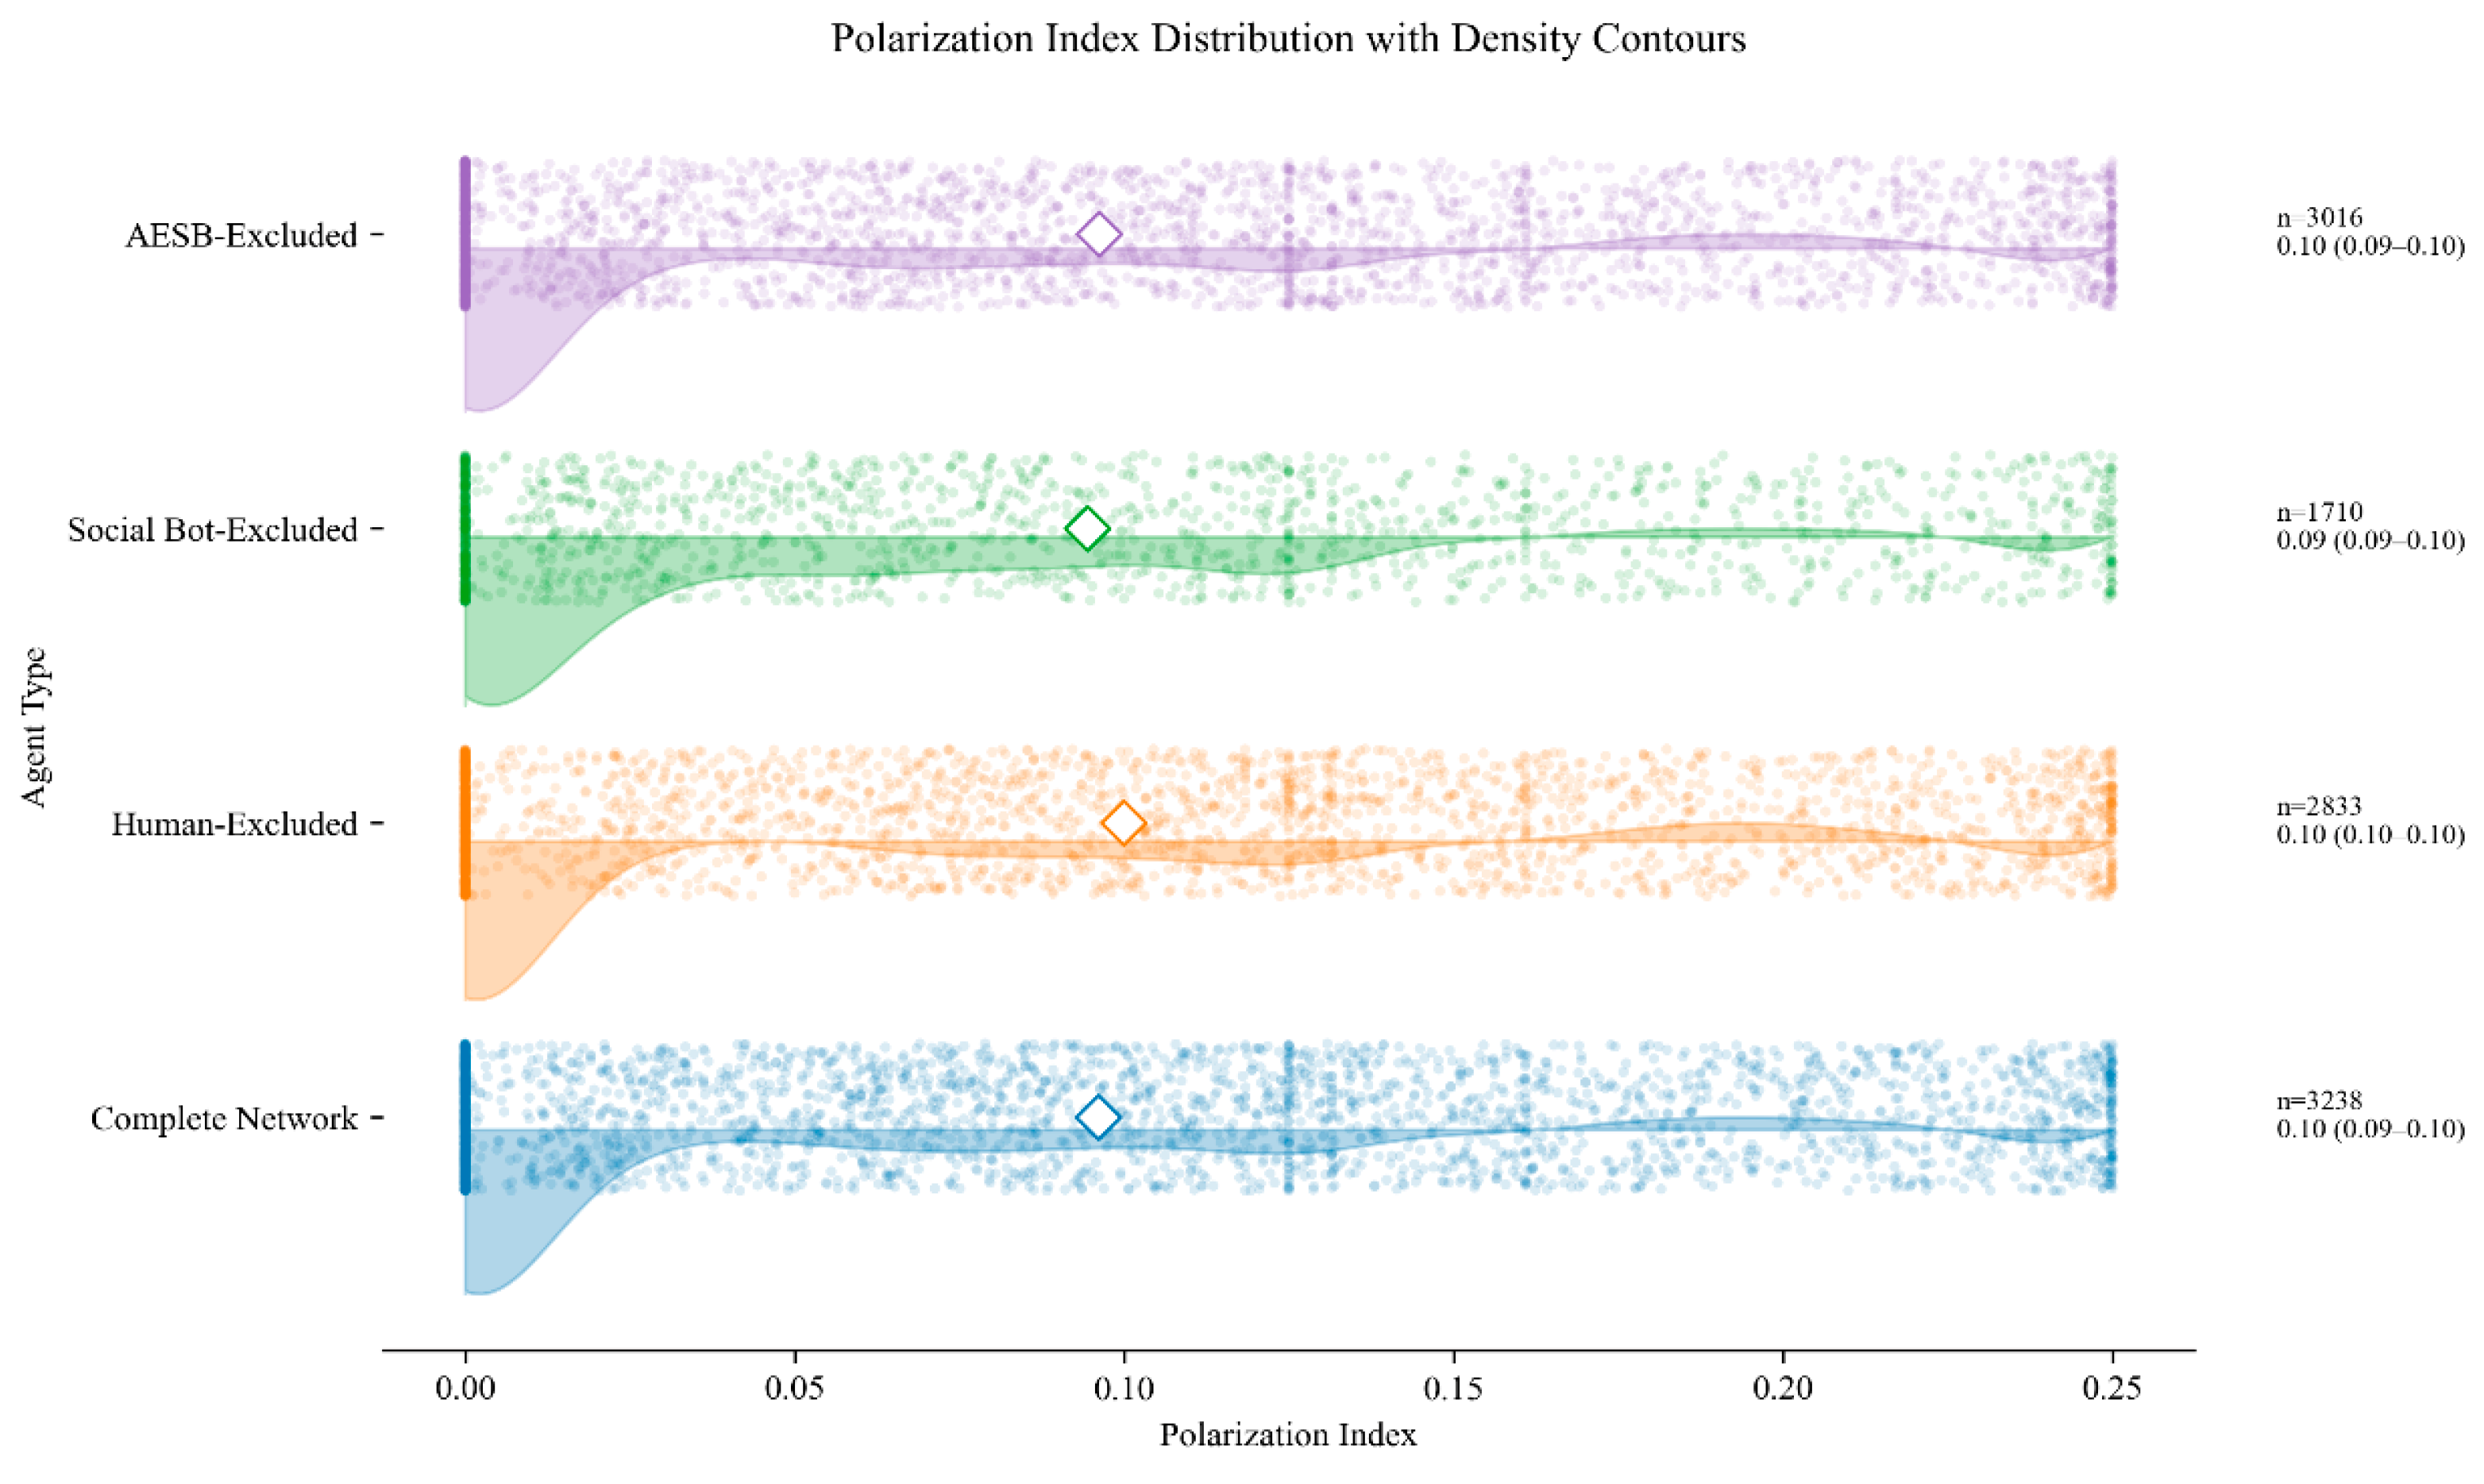
Regarding the community polarization index, Figure 12 presents the distributions for each network type. The vertical axis lists the network types, with density contour plots visualizing polarization levels. The Human-Excluded network closely mirrors the complete network, both peaking around 0.10. This suggests that the diversity and broad participation of human users may serve as a buffer against polarization, and their absence has a limited impact on overall levels. The Social Bot-Excluded network shows a slightly lower polarization peak, indicating that social bots often promote content with specific stances, and their removal dampens the spread of extreme views. The AESB-Excluded network largely aligns with the full network, implying that AESB content is relatively neutral and exerts limited influence on community polarization.
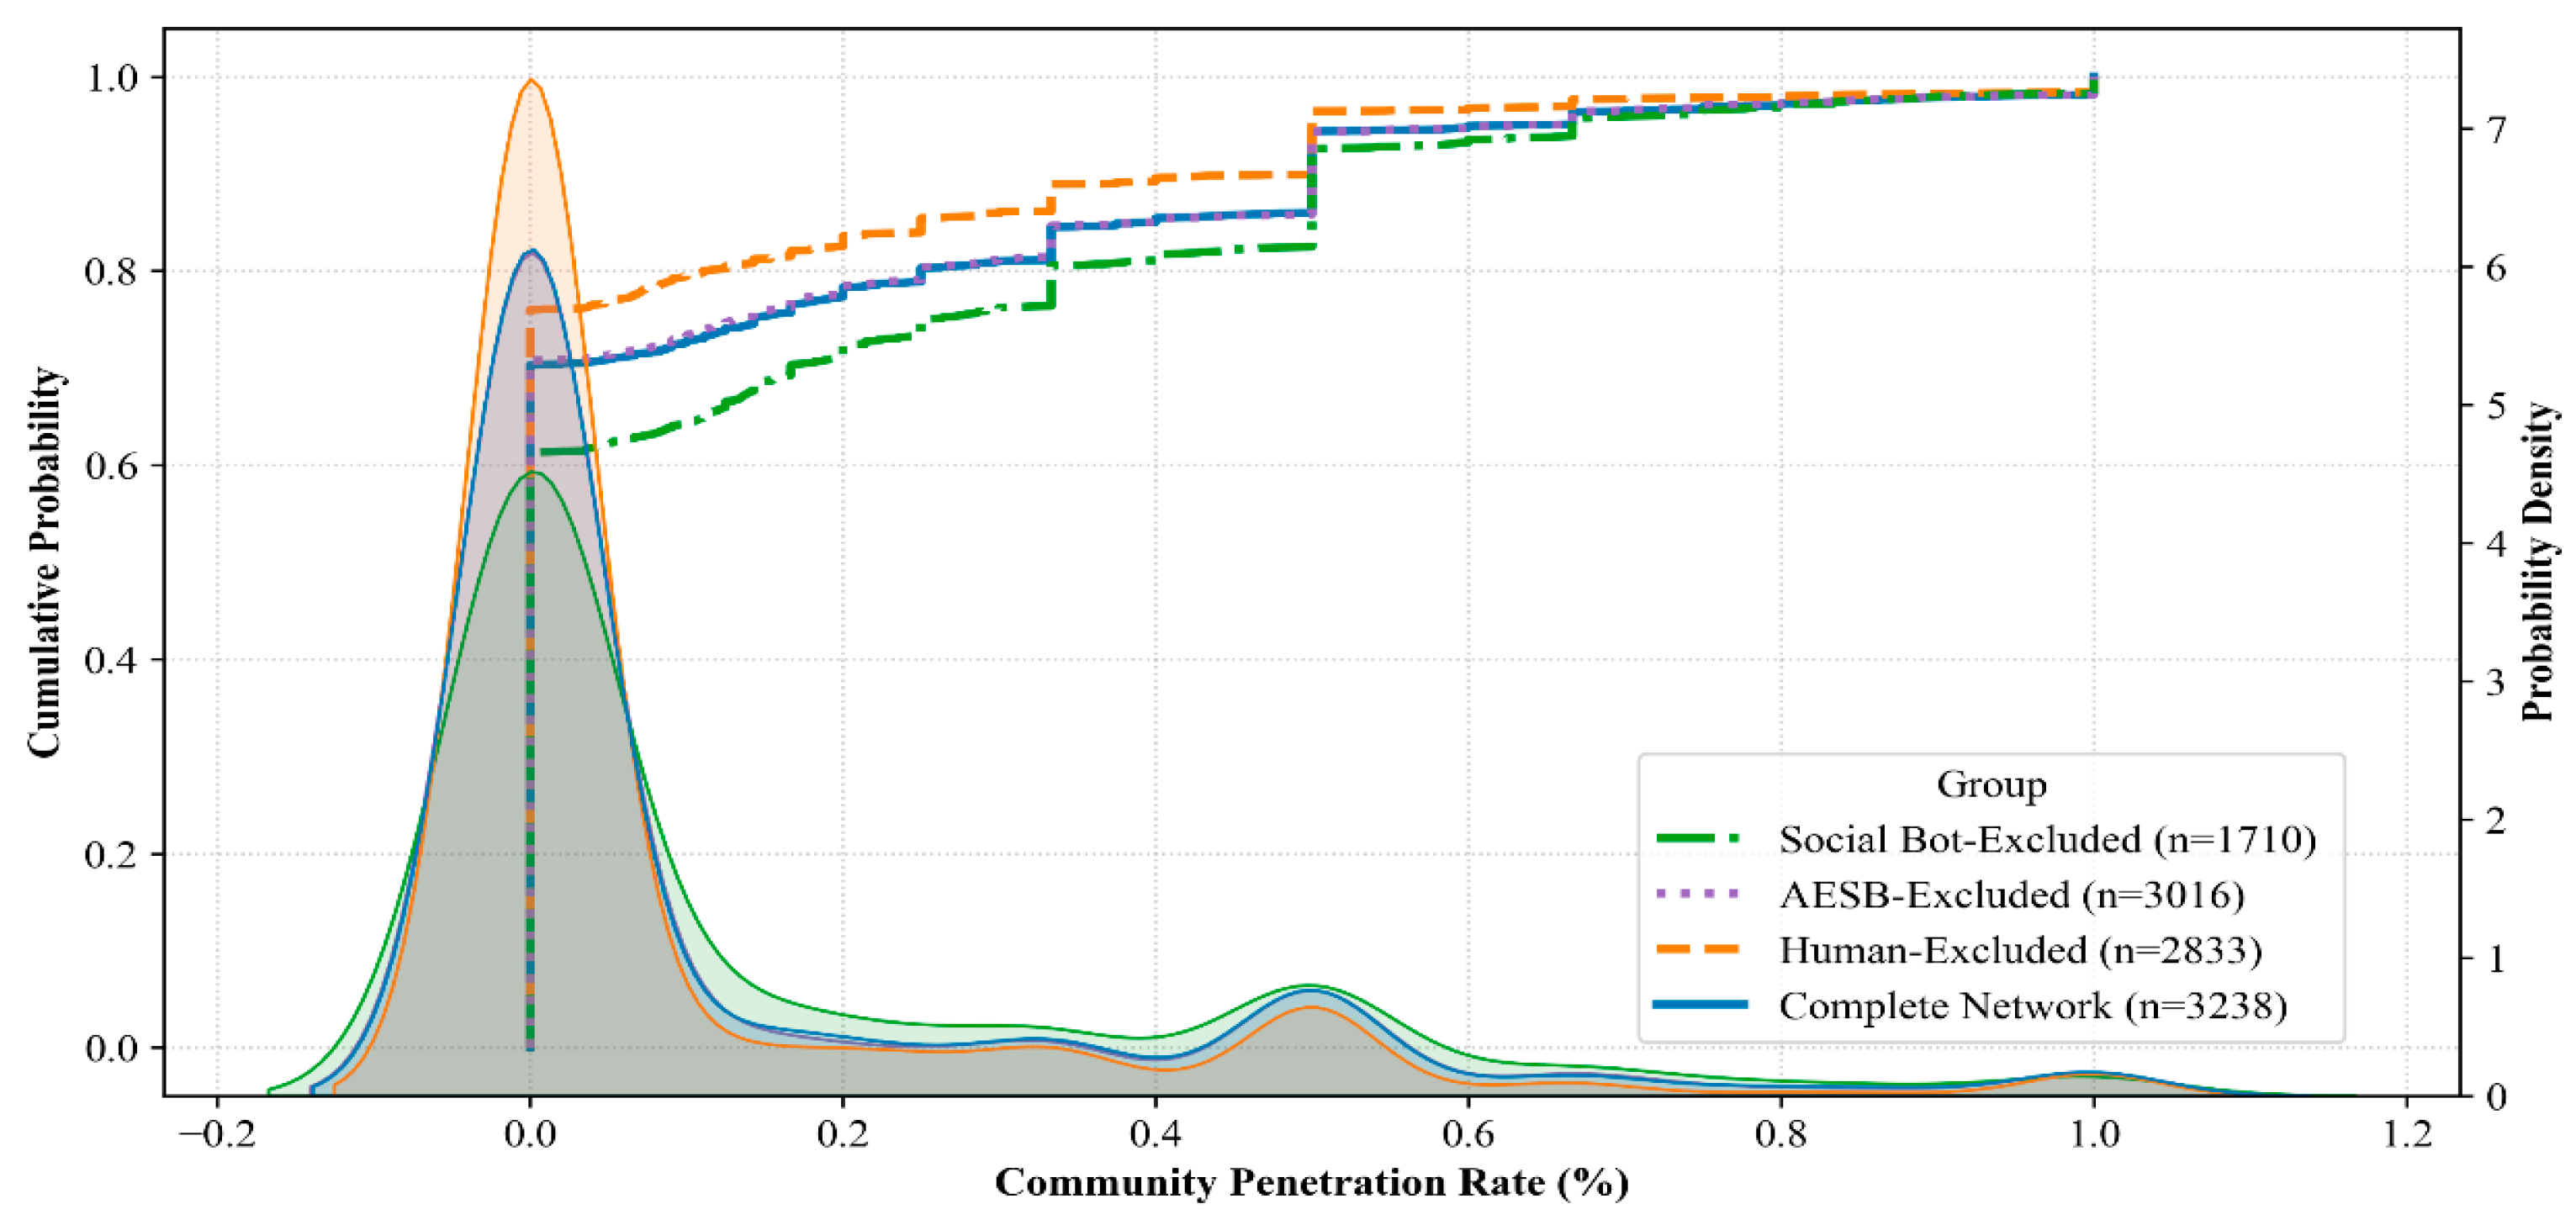
For the cross-community penetration rate, Figure 13 presents the comparison. The left vertical axis shows cumulative probability, and the right shows probability density. Results indicate that the Human-Excluded network has the highest penetration rate, suggesting that human users may restrict cross-community information flow, while their absence enhances interactions between social bots and AESBs. The Social Bot-Excluded network exhibits the lowest rate, underscoring the critical role of social bots in bridging communities and facilitating information diffusion. The AESB-Excluded network closely aligns with the complete network, implying that removing AESB links has minimal effect on cross-community interaction. Overall, human users’ diverse behaviors may unintentionally reinforce community boundaries; social bots, with high activity and broad connectivity, enhance inter-community engagement, while AESB, despite its content generation capabilities, contributes less to structural cross-community penetration.

5.3. Network-Level Structural Influence

At the network influence level, Figure 14 compares the spread speeds of the three actor types. The results indicate that the propagation speed in the complete network is 25.5, whereas the Human-Excluded network shows a significant decrease to 4.1. In contrast, the Social Bot-Excluded (23.3) and AESB-Excluded (23.6) networks exhibit propagation speeds very close to that of the complete network. These findings suggest that human users are not the primary accelerators of information diffusion. Instead, social bots and AESB, through their highly coordinated and automated forwarding behaviors, substantially increase the rate of information spread and serve as key drivers of “viral” dissemination.
Regarding diffusion breadth, the complete network (2.17 × 10⁻⁴) significantly exceeds the Human-Excluded (6.29 × 10⁻⁴), Social Bot-Excluded (2.31 × 10⁻⁴), and AESB-Excluded (2.29 × 10⁻⁴) networks. This indicates that, although bots play a prominent role in accelerating diffusion speed, reaching the diverse and widespread corners of the network ultimately depends on the spontaneous and heterogeneous social connections maintained by human users. The absence of human users markedly constrains the ultimate coverage of information.
In terms of diffusion depth, the Human-Excluded network exhibits the highest value (48.1), significantly exceeding the complete network (34.4), Social Bot-Excluded (31.8), and AESB-Excluded (34.5) networks. This result suggests that, although human interactions are extensive, they may partially hinder information from penetrating deeply into the network. In contrast, social bots and AESB, by constructing tight, looped forwarding chains, can effectively extend the propagation pathway, allowing information to circulate and deepen within specific subgroups over a longer period, thereby enhancing diffusion depth.
In summary, analyses across node, community, and network levels reveal distinct structural roles and guiding mechanisms among the three actor types. Human users maintain broad connections and diverse viewpoints, serving as vital agents for information diversity and cross-community linkage. Social bots contribute modestly to the overall dissemination structure but help moderate emotional fluctuations. AESBs, however, show stronger guiding power through structural concentration, topic focus, and diffusion depth. Their role extends beyond content creation, strategically integrating into the network and intervening in its structure to manipulate public opinion. By “mimicking humans” for expressive camouflage and employing “machine-driven strategies” for structural control, AESB have evolved from mere content generators to potent agents capable of orchestrating public discourse, marking a defining feature of the new generation of IWA.

6. Conclusions

In this study, we focus on the evolving forms of the IWA in the online public opinion ecosystem and introduce a new actor type: AIGC-Enhanced Social Bots (AESBs), distinct from traditional social bots. Our findings show that traditional bots, although limited in influence, contribute to dissemination pathways and bridge heterogeneous communities. AESBs, by contrast, leverage consistent, human-like AI-generated content to enhance community cohesion, emotional alignment, and deep propagation. Unlike the superficial, account-centric diffusion of traditional bots, AESBs represent a new pattern of manipulation characterized by content-driven, deep intervention. In essence, they achieve expressive mimicry while executing machine-based structural control, speaking like humans and spreading like machines, demonstrating strong structural penetration and opinion leadership potential.
Theoretically, this study expands the identification framework for IWA by highlighting the influence of new manipulative agents. Methodologically, it integrates account detection, content recognition, and multi-level network metrics to offer a scalable analytical model for studying automated opinion manipulation. Practically, the findings offer valuable implications for improving content regulation, public opinion governance, and early warning mechanisms in the AIGC era. The results of this study suggest that, in order for platform operators to combat IWA, it may be effective to implement algorithms to suppress the spread of content with specific structures, such as those generated by AESB, in addition to traditional account suspensions. For example, LLM-based detection can serve as one component of a heterogeneous expert framework but should be complemented with network-based and multimodal detectors to enhance robustness against adversarial AIGC. Moreover, human-in-the-loop review remains indispensable for handling borderline cases.
Several limitations should be acknowledged. First, the analysis was restricted to China’s Weibo platform and may be influenced by its unique censorship and information-control environment, raising concerns about the generalizability of the findings. It, thus, remains uncertain whether the AESB behaviors observed here would also emerge on platforms with freer speech environments (e.g., Twitter, Reddit, and TikTok). Second, although the study effectively distinguished between traditional bots and AESBs, it did not fully explore AESBs’ strategic motivations or their specific impacts on public opinion, emotional contagion, and information uptake. Third, while the proposed framework integrates account, content, and network dimensions, the empirical results would be further strengthened through closer alignment with established theories of opinion manipulation and information diffusion. Future research should, therefore, be extended to cross-platform and multimodal contexts, investigate the cognitive and emotional mechanisms through which AESB interventions shape public discourse, and pursue deeper theoretical integration. Linking computational evidence with broader communication and social science perspectives will provide a more comprehensive understanding of AIGC-driven opinion manipulation and support the development of more targeted governance strategies.

Author Contributions

Conceptualization, J.Z. (Jinghong Zhou); methodology, D.Z.; software, J.Z. (Jiawei Zhu) and F.W.; validation, F.W.; formal analysis, J.Z. (Jinghong Zhou), D.Z. and J.Z. (Jiawei Zhu); investigation, J.Z. (Jiawei Zhu) and F.W.; resources, J.Z. (Jinghong Zhou) and C.B.; data curation, J.Z. (Jiawei Zhu) and F.W.; writing—original draft preparation, D.Z.; writing—review and editing, J.Z. (Jinghong Zhou) and C.B.; visualization, J.Z. (Jiawei Zhu); supervision, C.B. and D.Z.; project administration, C.B.; funding acquisition, C.B.; All authors have read and agreed to the published version of the manuscript.

Funding

This research was funded by the National Social Science Fund of China (grant number 23CTQ015), entitled “Research on Panoramic Governance Model of Online Public Opinion in Emergencies Empowered by Data Profiling”.

Institutional Review Board Statement

Not applicable.

Informed Consent Statement

Not applicable.

Data Availability Statement

The raw data supporting the conclusions of this article will be made available by the authors on request.

Conflicts of Interest

The authors declare no conflicts of interest. The funders had no role in the design of the study; in the collection, analyses, or interpretation of data; in the writing of the manuscript; or in the decision to publish the results.

References

  1. Skoric, M.M.; Liu, J.; Jaidka, K. Electoral and public opinion forecasts with social media data: A meta-analysis. Information 2020, 11, 187. [Google Scholar] [CrossRef]
  2. Chen, C.; Wu, K.; Srinivasan, V.; Zhang, X. Battling the internet water army: Detection of hidden paid posters. In Proceedings of the IEEE/ACM International Conference on Advances in Social Networks Analysis and Mining (ASONAM), Niagara, ON, Canada, 25–28 August 2013. [Google Scholar]
  3. Wang, K.; Xiao, Y.; Xiao, Z. Detection of internet water army in social network. In Proceedings of the 2014 International Conference on Computer, Communications and Information Technology (CCIT 2014), Beijing, China, 15–17 October 2014. [Google Scholar]
  4. Chen, L.; Chen, J.; Xia, C. Social network behavior and public opinion manipulation. J. Inf. Secur. Appl. 2022, 64, 103060. [Google Scholar] [CrossRef]
  5. Hajli, N.; Saeed, U.; Tajvidi, M.; Shirazi, F. Social bots and the spread of disinformation in social media: The challenges of artificial intelligence. Br. J. Manag. 2022, 33, 1238–1253. [Google Scholar] [CrossRef]
  6. Lopez-Joya, S.; Diaz-Garcia, J.A.; Ruiz, M.D.; Martin-Bautista, M.J. Dissecting a social bot powered by generative AI: Anatomy, new trends and challenges. Soc. Netw. Anal. Min. 2025, 15, 7. [Google Scholar] [CrossRef]
  7. Xie, Z. Who is spreading AI-generated health rumors? A study on the association between AIGC interaction types and the willingness to share health rumors. Soc. Media Soc. 2025, 11, 20563051251323391. [Google Scholar] [CrossRef]
  8. Ferrara, E. Social bot detection in the age of ChatGPT: Challenges and opportunities. First Monday 2023, 28, 13185. [Google Scholar] [CrossRef]
  9. Zeng, K.; Wang, X.; Zhang, Q.; Zhang, X.; Wang, F.Y. Behavior modeling of internet water army in online forums. In Proceedings of the 19th IFAC World Congress, Cape Town, South Africa, 24–29 August 2014. [Google Scholar]
  10. Zhao, B.; Ren, W.; Zhu, Y.; Zhang, H. Manufacturing conflict or advocating peace? A study of social bots agenda building in the Twitter discussion of the Russia-Ukraine war. J. Inf. Technol. Polit. 2024, 21, 176–194. [Google Scholar] [CrossRef]
  11. Al-Rawi, A.; Shukla, V. Bots as active news promoters: A digital analysis of COVID-19 tweets. Information 2020, 11, 461. [Google Scholar] [CrossRef]
  12. Gong, X.; Cai, M.; Meng, X.; Yang, M.; Wang, T. How Social Bots Affect Government-Public Interactions in Emerging Science and Technology Communication. Int. J. Hum.-Comput. Interact. 2025, 41, 1–16. [Google Scholar] [CrossRef]
  13. Ferrara, E.; Varol, O.; Davis, C.; Menczer, F.; Flammini, A. The rise of social bots. Commun. ACM 2016, 59, 96–104. [Google Scholar] [CrossRef]
  14. Ross, B.; Pilz, L.; Cabrera, B.; Brachten, F.; Neubaum, G.; Stieglitz, S. Are social bots a real threat? An agent-based model of the spiral of silence to analyse the impact of manipulative actors in social networks. Eur. J. Inf. Syst. 2019, 28, 394–412. [Google Scholar] [CrossRef]
  15. Luo, H.; Meng, X.; Zhao, Y.; Cai, M. Rise of social bots: The impact of social bots on public opinion dynamics in public health emergencies from an information ecology perspective. Telemat. Inform. 2023, 85, 102051. [Google Scholar] [CrossRef]
  16. Cheng, C.; Luo, Y.; Yu, C. Dynamic mechanism of social bots interfering with public opinion in network. Physica A 2020, 551, 124163. [Google Scholar] [CrossRef]
  17. Cai, M.; Luo, H.; Meng, X.; Cui, Y.; Wang, W. Network distribution and sentiment interaction: Information diffusion mechanisms between social bots and human users on social media. Inf. Process. Manag. 2023, 60, 103197. [Google Scholar] [CrossRef]
  18. Stella, M.; Ferrara, E.; De Domenico, M. Bots increase exposure to negative and inflammatory content in online social systems. Proc. Natl. Acad. Sci. USA 2018, 115, 12435–12440. [Google Scholar] [CrossRef]
  19. Orabi, M.; Mouheb, D.; Al Aghbari, Z.; Kamel, I. Detection of bots in social media: A systematic review. Inf. Process. Manag. 2020, 57, 102250. [Google Scholar] [CrossRef]
  20. Feng, S.; Wan, H.; Wang, N.; Tan, Z.; Luo, M.; Tsvetkov, Y. What does the bot say? Opportunities and risks of large language models in social media bot detection. arXiv 2024, arXiv:2402.00371. [Google Scholar] [CrossRef]
  21. Gurajala, S.; White, J.S.; Hudson, B.; Voter, B.R.; Matthews, J.N. Profile characteristics of fake Twitter accounts. Big Data Soc. 2016, 3, 2053951716674236. [Google Scholar] [CrossRef]
  22. Cai, M.; Luo, H.; Meng, X.; Cui, Y.; Wang, W. Differences in behavioral characteristics and diffusion mechanisms: A comparative analysis based on social bots and human users. Front. Phys. 2022, 10, 875574. [Google Scholar] [CrossRef]
  23. Pozzana, I.; Ferrara, E. Measuring bot and human behavioral dynamics. Front. Phys. 2020, 8, 125. [Google Scholar] [CrossRef]
  24. Subrahmanian, V.S.; Azaria, A.; Durst, S.; Kagan, V.; Galstyan, A.; Lerman, K.; Zhu, L.; Ferrara, E.; Flammini, A.; Menczer, F. The DARPA Twitter Bot Challenge. Computer 2016, 49, 38–46. [Google Scholar] [CrossRef]
  25. Kudugunta, S.; Ferrara, E. Deep neural networks for bot detection. Inf. Sci. 2018, 467, 312–322. [Google Scholar] [CrossRef]
  26. Chu, Z.; Gianvecchio, S.; Wang, H.; Jajodia, S. Detecting automation of Twitter accounts: Are you a human, bot, or cyborg? IEEE Trans. Dependable Secur. Comput. 2012, 9, 811–824. [Google Scholar] [CrossRef]
  27. Mazza, M.; Avvenuti, M.; Cresci, S.; Tesconi, M. Investigating the difference between trolls, social bots, and humans on Twitter. Comput. Commun. 2022, 196, 23–36. [Google Scholar] [CrossRef]
  28. Gilani, Z.; Farahbakhsh, R.; Tyson, G.; Wang, L.; Crowcroft, J. An in-depth characterisation of bots and humans on Twitter. arXiv 2017, arXiv:1704.01508. [Google Scholar] [CrossRef]
  29. Chavoshi, N.; Hamooni, H.; Mueen, A. DeBot: Twitter bot detection via warped correlation. In Proceedings of the IEEE International Conference on Data Mining (ICDM), Barcelona, Spain, 12–15 December 2016. [Google Scholar]
  30. Varol, O.; Ferrara, E.; Davis, C.; Menczer, F.; Flammini, A. Online human-bot interactions: Detection, estimation, and characterization. In Proceedings of the International AAAI Conference on Web and Social Media (ICWSM), Montréal, QC, Canada, 15–18 May 2017. [Google Scholar]
  31. Dickerson, J.P.; Kagan, V.; Subrahmanian, V.S. Using Sentiment to Detect Bots on Twitter: Are Humans More Opinionated Than Bots? In Proceedings of the IEEE/ACM International Conference on Advances in Social Networks Analysis and Mining, Beijing, China, 17–20 August 2014. [Google Scholar]
  32. Ilias, L.; Kazelidis, I.M.; Askounis, D. Multimodal detection of bots on X (Twitter) using transformers. IEEE Trans. Inf. Forensics Secur. 2024, 19, 7320–7334. [Google Scholar] [CrossRef]
  33. Benjamin, V.; Raghu, T.S. Augmenting social bot detection with crowd-generated labels. Inf. Syst. Res. 2023, 34, 487–507. [Google Scholar] [CrossRef]
  34. Wasserman, S.; Faust, K. Social Network Analysis: Methods and Applications; Cambridge University Press: Cambridge, UK, 1994. [Google Scholar]
  35. Gardasevic, S.; Jaiswal, A.; Lamba, M.; Funakoshi, J.; Chu, K.-H.; Shah, A.; Sun, Y.; Pokhrel, P.; Washington, P. Public health using social network analysis during the COVID-19 era: A systematic review. Information 2024, 15, 690. [Google Scholar] [CrossRef]
  36. Peng, Y.; Zhao, Y.; Hu, J. On the role of community structure in evolution of opinion formation: A new bounded confidence opinion dynamics. Inf. Sci. 2023, 621, 672–690. [Google Scholar] [CrossRef]
  37. Xiong, M.; Wang, Y.; Cheng, Z. Research on modeling and simulation of information cocoon based on opinion dynamics. In Proceedings of the 2021 9th International Conference on Information Technology: IoT and Smart City, Guangzhou, China, 22–25 December 2021. [Google Scholar]
  38. Zhang, Z.-K.; Liu, C.; Zhan, X.-X.; Lu, X.; Zhang, C.-X.; Zhang, Y.-C. Dynamics of information diffusion and its applications on complex networks. Phys. Rep. 2016, 651, 1–34. [Google Scholar] [CrossRef]
  39. Zhang, L.; Peng, T.-Q. Breadth, depth, and speed: Diffusion of advertising messages on microblogging sites. Internet Res. 2015, 25, 453–470. [Google Scholar] [CrossRef]
  40. Zhang, J.; Luo, Y. Degree Centrality, Betweenness Centrality, and Closeness Centrality in Social Network. In Proceedings of the 2nd International Conference on Modelling, Simulation and Applied Mathematics, Bangkok, Thailand, 26–27 February 2017. [Google Scholar]
  41. Del Vicario, M.; Zollo, F.; Caldarelli, G.; Scala, A.; Quattrociocchi, W. Mapping social dynamics on Facebook: The Brexit debate. Soc. Netw. 2017, 50, 6–16. [Google Scholar] [CrossRef]
  42. Zannettou, S.; Sirivianos, M.; Blackburn, J.; Kourtellis, N. The web of false information: Rumors, fake news, hoaxes, clickbait, and various other shenanigans. J. Data Inf. Qual. 2019, 11, 1–37. [Google Scholar] [CrossRef]
  43. Matsubara, Y.; Sakurai, Y.; Prakash, B.A.; Li, L.; Faloutsos, C. Rise and Fall Patterns of Information Diffusion: Model and Implications. In Proceedings of the 18th ACM SIGKDD International Conference on Knowledge Discovery and Data Mining, Beijing, China, 12–16 August 2012. [Google Scholar]
  44. Newman, M.E. Modularity and community structure in networks. Proc. Natl. Acad. Sci. USA 2006, 103, 8577–8582. [Google Scholar] [CrossRef]
  45. Conover, M.; Ratkiewicz, J.; Francisco, M.; Gonçalves, B.; Menczer, F.; Flammini, A. Political Polarization on Twitter. In Proceedings of the International AAAI Conference on Web and Social Media, Barcelona, Spain, 17–21 July 2011. [Google Scholar]
  46. Centola, D. The spread of behavior in an online social network experiment. Science 2010, 329, 1194–1197. [Google Scholar] [CrossRef]
  47. Liben-Nowell, D.; Kleinberg, J. Tracing information flow on a global scale using Internet chain-letter data. Proc. Natl. Acad. Sci. USA 2008, 105, 4633–4638. [Google Scholar] [CrossRef]
  48. Glik, D.; Prelip, M.; Myerson, A.; Eilers, K. Fetal alcohol syndrome prevention using community-based narrowcasting campaigns. Health Promot. Pract. 2008, 9, 93. [Google Scholar] [CrossRef] [PubMed]
  49. Del Vicario, M.; Bessi, A.; Zollo, F.; Petroni, F.; Scala, A.; Caldarelli, G.; Stanley, H.E.; Quattrociocchi, W. The spreading of misinformation online. Proc. Natl. Acad. Sci. USA 2016, 113, 554–559. [Google Scholar] [CrossRef] [PubMed]
  50. Lobel, I.; Sadler, E. Information diffusion in networks through social learning. Theor. Econ. 2015, 10, 807–851. [Google Scholar] [CrossRef]
  51. Sufi, F. Social media analytics on Russia–Ukraine cyber war with natural language processing: Perspectives and challenges. Information 2023, 14, 485. [Google Scholar] [CrossRef]
  52. Marigliano, R.; Ng, L.H.X.; Carley, K.M. Analyzing digital propaganda and conflict rhetoric: A study on Russia’s bot-driven campaigns and counter-narratives during the Ukraine crisis. Soc. Netw. Anal. Min. 2024, 14, 170. [Google Scholar] [CrossRef]
  53. Chen, H.; Wu, L.; Chen, J.; Lu, W.; Ding, J. A comparative study of automated legal text classification using random forests and deep learning. Inf. Process. Manag. 2022, 59, 102798. [Google Scholar] [CrossRef]
  54. Borgatti, S.P.; Mehra, A.; Brass, D.J.; Labianca, G. Network analysis in the social sciences. Science 2009, 323, 892–895. [Google Scholar] [CrossRef] [PubMed]
Figure 1. Research framework.
Information 16 00850 g001
Figure 2. BFSC model for AIGC identification.
Information 16 00850 g002
Figure 3. The behavioral dynamics of social bots and human users.
Information 16 00850 g003
Figure 4. Text distribution of AIGC and UGC.
Information 16 00850 g004
Figure 5. LDA topic modeling results for AIGC and UGC texts. (a) Distribution of 8 UGC themes; (b) distribution of 12 UGC themes; (c) AIGC text topic distribution ratio; (d) UGC text topic distribution ratio.
Information 16 00850 g005
Figure 6. Node influence level.
Information 16 00850 g006
Figure 7. Community influence level.
Information 16 00850 g007
Figure 8. Degree centrality comparison.
Information 16 00850 g008
Figure 9. Sentiment deviation comparison.
Information 16 00850 g009
Figure 10. Topic focus comparison (*** p < 0.001).
Information 16 00850 g010
Figure 11. Modularity comparison.
Information 16 00850 g011
Figure 12. Community polarization index comparison.
Information 16 00850 g012
Figure 13. Cross-community penetration rates comparison.
Information 16 00850 g013
Figure 14. Network influence level comparison.
Information 16 00850 g014
Table 1. Indicator system for social bot detection.
AttributeDimensionIndicatorMeasurement MethodReference
Static
Attribute
Account ProfileInformation CompletenessIndicates whether the account profile is fully completed. Judged by the “profile description” field: 1 if non-empty, 0 otherwise.[15]
Nickname AutonomyRatio of non-standard characters in nickname to total characters. Computed by analyzing composition, special characters, length, and AI pattern conformity (0–1).[15]
Avatar ConsistencyAssesses frequency of avatar changes across posts. Represented by the ratio of unique avatars to total posts.[24]
InfluenceVerification StatusWhether the account is officially verified by the platform. Judged by “blogger verification” field: 1 if non-empty, 0 otherwise.[15,25]
Follower-Following RatioRatio of followers to followers. Represented by dividing follower count by total follower count.[13,26]
Interaction AbnormalityWhether repost, comment, and like frequencies are abnormal. Abnormal thresholds determined via median absolute deviation (MAD).[24]
Dynamic BehaviorBehavior PatternPosting FrequencyAverage daily posts. Calculated as total posts divided by active days.[26]
Post Editing DegreeDegree of post modification. Ratio of edited posts to total posts.[27,28]
Activity
Abnormality
Degree of abnormal posting activity (e.g., late-night posting). Ratio of late-night posts to total posts.[23,29]
Behavior QualityContent LengthAverage post length in characters. Calculated as average characters per post.[15,24,30]
Topic DiversityRange and diversity of topics. Calculated as number of unique topic tags in posts.[30,31]
MultimodalityRichness of media forms (e.g., images, videos). Ratio of multimodal posts to total posts.[32,33]
Table 3. Detection performance of various machine learning models.
ModelAccuracyPrecisionRecallF1 ScoreAUCBrier Score
KNN0.9120.9120.9120.9110.9750.058
SVM0.9410.9470.9410.9400.9280.066
Naive Bayes0.9410.9470.9410.9400.9520.059
Decision Tree0.9260.9270.9260.9260.9230.074
XGBoost0.9560.9590.9560.9550.9680.047
Table 4. Statistical analysis of language styles in AIGC and UGC texts.
FeatureAIGC MeanUGC MeanAIGC StdUGC Stdp-Value
Type-Token0.6860.7140.1720.1440.000
Sentimental score0.7860.7660.3590.3720.359
Average Characters5532957414750.000
Average Words3121664172710.000
Disclaimer/Publisher’s Note: The statements, opinions and data contained in all publications are solely those of the individual author(s) and contributor(s) and not of MDPI and/or the editor(s). MDPI and/or the editor(s) disclaim responsibility for any injury to people or property resulting from any ideas, methods, instructions or products referred to in the content.