Article

Multivariate Hydrological Modeling Based on Long Short-Term Memory Networks for Water Level Forecasting †

by
Jackson B. Renteria-Mena
1,*,
Douglas Plaza
2 and
Eduardo Giraldo
3
1
Facultad de Ingeniería, Universidad Tecnológica del Chocó, Quibdó 270001, Colombia
2
Facultad de Ingeniería en Electricidad y Computación, Escuela Superior Politecnica del Litoral, Guayaquil 090902, Ecuador
3
Research Group in Automatic Control, Electrical Engineering Department, Universidad Tecnologica de Pereira, Pereira 660003, Colombia
*
Author to whom correspondence should be addressed.
This article is a revised and expanded version of a paper entitled Multivariable NARX based Neural Networks Models for Short-Term Water Level Forecasting, which was presented at International Conference on Time Series and Forecasting (ITISE-2023), Gran Canaria, Spain, 12–14 July 2023.
Information 2024, 15(6), 358; https://doi.org/10.3390/info15060358
Submission received: 27 March 2024 / Revised: 3 June 2024 / Accepted: 13 June 2024 / Published: 15 June 2024
(This article belongs to the Special Issue Real-World Applications of Machine Learning Techniques)

Abstract

:
In the Department of Chocó, flooding poses a recurrent and significant challenge due to heavy rainfall and the dense network of rivers characterizing the region. However, the lack of adequate infrastructure to prevent and predict floods exacerbates this situation. The absence of early warning systems, the scarcity of meteorological and hydrological monitoring stations, and deficiencies in urban planning contribute to the vulnerability of communities to these phenomena. It is imperative to invest in flood prediction and prevention infrastructure, including advanced monitoring systems, the development of hydrological prediction models, and the construction of hydraulic infrastructure, to reduce risk and protect vulnerable communities in Chocó. Additionally, raising public awareness of the associated risks and encouraging the adoption of mitigation and preparedness measures throughout the population are essential. This study introduces a novel approach for the multivariate prediction of hydrological variables, specifically focusing on water level forecasts for two hydrological stations along the Atrato River in Colombia. The model, utilizing a specialized type of recurrent neural network (RNN) called the long short-term memory (LSTM) network, integrates data from hydrological variables, such as the flow, precipitation, and level. With a model architecture featuring four inputs and two outputs, where flow and precipitation serve as inputs and the level serves as the output for each station, the LSTM model is adept at capturing the complex dynamics and cross-correlations among these variables. Validation involves comparing the LSTM model’s performance with linear and nonlinear Autoregressive with Exogenous Input (NARX) models, considering factors such as the estimation error and computational time. Furthermore, this study explores different scenarios for water level prediction, aiming to utilize the proposed approach as an effective flood early warning system.

1. Introduction

Accurately modeling hydrological variables is pivotal for successful flood forecasting and the planning and operation of water resource systems, as Brass and Rodriguez emphasize in their book Random Functions and Hydrology [1], which indicates that an adequate hydrological model is essential to assess and manage water effectively, allowing the simulation and anticipation of hydrological events such as floods, droughts, and changes in water flows. It also contributes to informed decision making in the planning and management of water resources, which is crucial for the sustainability and resilience of communities and the environment in the face of present and future hydrological challenges. For this purpose, two main techniques are usually employed: white-box [2] algorithms, such as the Autoregressive with Exogenous Variables (ARX) model, and black-box [2] algorithms, such as nonlinear recurrent neural networks. The ARX model, through the implementation of nonlinear least squares techniques, predicts the water levels of two outlets using four inputs corresponding to the flow and precipitation of two hydrological stations. On the other hand, black-box algorithms, such as the LSTM algorithm and the nonlinear forward neural network (NARX), use advanced neural network techniques. The NARX model, in particular, has four inputs (flow and precipitation from the two hydrological stations), two outputs (water levels at the two stations), and a hidden layer of 64 nodes with a learning rate of 0.02; it is capable of analyzing sequences of input data and generating predictions [3]. As a type of recurrent neural network (RNN), LSTM can capture both long-term and short-term dependencies among time units in sequential data [4]. The importance of LSTM neural networks in predicting future time instants is highlighted by Xuan et al. [5], who suggest an LSTM model for flood forecasting while utilizing daily flow and rainfall as input data; their application promises to improve the accuracy of hydrological models and strengthen natural disaster management. Therefore, it can be observed that Zhang et al. [6] evaluate the performance of various models, including LSTM, a convolutional neural network with LSTM (CNN-LSTM), convolutional LSTM (ConvLSTM), and spatiotemporal attention LSTM (STA-LSTM), in flood prediction. Additionally, Won et al. [7] present the development of an urban flood forecasting and warning system in South Korea’s main flood risk area. This system utilizes a rainfall–runoff model and a deep learning model incorporating LSTM recurrent neural networks to mitigate potential damage.
The Department of Chocó in Colombia is known for having one of the highest annual rainfall averages in the world. The region is crossed by three main rivers: the Atrato, the Baudó, and the San Juan [8]. Because of its importance, it is crucial to have an early warning system for short- and long-term floods that consists of technologically updated equipment, embedded systems, and accurate short- and long-term prediction algorithms, as allowed by the recurrent neural network methodology. At the initial stage, an LSTM recurrent neural network (RNN) model is able to identify the crucial characteristics of both the input and output of a system with four inputs and two outputs, corresponding to two hydrological stations under study. This model has the ability to retain knowledge of these essential characteristics over time. Because of this ability, the model can learn complex and hidden long-term relationships, allowing it to make accurate predictions about the water level at output 1 for hydrological station 1 and the water level at output 2 for hydrological station 2.
The following are some relevant studies that have contributed to the object of study of the proposed LSTM neural network model.
The study of Asanjan et al. [9] proposes a precipitation prediction model that uses deep neural networks to extrapolate the cloud-top brightness temperature (CTBT), followed by an efficient precipitation retrieval algorithm. This approach combines long short-term memory (LSTM) and Precipitation Estimation from Remotely Sensed Information using Artificial Neural Networks (PERSIANN). In a recent study, the authors compared three rainfall forecasting approaches: LSTM, CNN, and a hybrid PSO-SVR model [10]. They used data from the Niavaran meteorological station in Tehran, Iran to develop short-term forecast models. The results provide useful insights for water resource management and urban planning in rainfall-prone areas.
Moreover, several studies focus on combining deep learning models to address the simultaneous prediction of multiple water-related variables. For instance, Baek et al. [11] propose a hybrid approach that utilizes a CNN-LSTM model to predict both the water level and water quality at a specific location. This model leverages the capabilities of convolutional neural networks to extract spatial features and LSTM networks to capture temporal dependencies in the data. Similarly, Barzegar et al. [12] integrated a CNN-LSTM model with a discrete wavelet transform for the multiscale prediction of the water level in lakes, capitalizing on the ability of these networks to capture both temporal and spatial variability in the data.
Lastly, studies also explore various techniques with artificial neural networks to enhance the accuracy of flood prediction models. It should be noted that in [13], the bias correction of real-time precipitation data using artificial neural network methods is evaluated to improve the accuracy of hydrological models and flood forecasting. Additionally, Tabbussum et al. [14] conducted a comparative analysis of five artificial neural network models for flood prediction, demonstrating the effectiveness of these techniques in different contexts. These studies underscore the diversity and effectiveness of machine learning and artificial intelligence techniques in predicting and monitoring hydrological events [15]. For example, Ruma et al. [16] use LSTM networks optimized with the particle swarm optimization (PSO) algorithm. The results demonstrate the effectiveness of the methodology in improving the predictive capabilities and the reliability of water level predictions in a flood-prone region. Herath et al. [17] used historical water level data and hydrological characteristics to accurately predict future water levels in a flood retention zone. Dai et al. [18] introduced a hydrological data prediction model that incorporates long short-term memory (LSTM) with an attention mechanism. The LSTM architecture is enhanced with an attention mechanism, allowing the model to focus on the most relevant parts of the input data when making predictions. Wang et al. [19] present a novel approach for medium- to long-term prediction of water levels using an enhanced spatiotemporal attention mechanism in long short-term memory (LSTM) networks. By incorporating both spatial and temporal attention mechanisms, the model can effectively capture complex patterns and dependencies in hydrological data over extended periods. Another innovative study is presented in [20], which addresses the challenge of forecasting flood events in areas where there is a lack of hydrological data or gauging stations. Advanced hydrologic modeling and machine learning techniques are used to estimate the probability and magnitude of extreme floods.
Looking at these studies related to the object of this research, we can observe that the LSTM methodology is commonly used in time-series forecasting applications, such as stock price forecasting, energy demand forecasting, and water level forecasting. An LSTM network is trained with historical data, and the model parameters are adjusted to minimize the error between the predictions and actual values [21]. Once trained, the LSTM network can be used to make future predictions based on new temporal data inputs. It is noteworthy that the long short-term memory (LSTM) recurrent neural network plays a pivotal role in deep learning, particularly in modeling sequences and temporal dependencies. In hydrology, LSTM is applied to predict river water levels, as implemented in this study. LSTM addresses the challenge of capturing short- and long-term patterns in data, which is crucial for understanding the dynamics of hydrological variables over time. In this approach, LSTM [22] is trained to forecast in both the short term, considering immediate patterns, and in the long term, considering dependencies across extensive sequences. LSTM’s ability to retain relevant information over time makes it a valuable tool in modeling complex hydrological systems. LSTM’s network structure comprises a hidden layer with 64 units, featuring the ability to remember previous states by introducing loops in the network diagram. The rectified linear unit (ReLU) activation function is opted for in the proposed methodology, as it generates the input directly if it is positive or becomes zero otherwise. This methodology has proven effective in a wide range of applications and continues to be an active area of research in the field of machine learning and artificial intelligence.
This study explores and evaluates the implementation of a multivariate LSTM model based on recurrent neural networks (RNNs) for predicting water levels in the Atrato River, located in the Department of Chocó, Colombia, over both short- and long-term periods. The research utilizes data from two hydrological stations on the Atrato River, monitored by the Institute of Hydrology, Meteorology, and Environmental Studies (IDEAM). These data include measurements of the flow rate, precipitation, and water level sampled every 12 h over a span of 789 days with a data sample of 1578 units. The proposed model makes predictions every 12 h, since the flow, precipitation, and level data from the two hydrological stations are recorded every 12 h due to the limited memory of the embedded systems of the early warning system under study.
The primary contribution of this research involves the formulation of a multivariate LSTM model based on recurrent neural networks for short- and long-term water level prediction. It is noteworthy that LSTM networks have the ability to “remember” relevant information from the sequence and retain it over multiple time steps, resembling the way our brain analyzes sequences. For instance, when reading a buyer’s review to make decisions, an LSTM network mimics our approach by focusing on words deemed relevant and discarding non-essential information, therefore highlighting that these networks have the ability to remember and process sequences of hydrological data over time, making them particularly useful for predicting hydrological variables, such as water levels, flows, or precipitation. As in other contexts, LSTMs can capture complex temporal dependencies in hydrological data, making them a valuable tool for improving the accuracy of hydrological models and the prediction of extreme events, such as floods. Another important aspect of the LSTM model is that, in the study of solutions to problems with early warning systems, it is the method that has achieved the highest accuracy compared to other models, such as ARX and NARX, as indicated in a study by Atashi et al. [23]. This is crucial for finding optimal algorithms in terms of computational time and estimation accuracy for flood early warning systems using memory-limited embedded systems. This study also compares the computational time of the proposed NARX, ARX, and LSTM models, showing that although LSTM requires more computational time, it provides the highest accuracy among these models, as indicated in a study by Muñoz et al. [24]. This will be added to the article for better understanding.

2. Theoretical Framework

2.1. Study Area

The Department of Chocó, crossed by the Atrato River, faces a constant challenge with flooding, with Belén de Bajirá and Quibdó being two of the most affected areas. During the rainy season, the overflowing of the Atrato River wreaks havoc [25], with material damage, displacement of communities, and human losses. Despite prevention and mitigation efforts, such as the construction of dams and early warning systems, communities in these areas remain vulnerable due to deforestation, lack of urban planning, and climate change. A comprehensive risk management strategy that combines preparedness, response, and recovery measures is needed, along with a focus on sustainable development that protects ecosystems and ensures the safety of local communities.
The Department of Chocó, on Colombia’s Pacific coast, is distinguished by its complex interaction among hydrology, geology, and climate [26]. The region has an extensive river network, headed by the Atrato River, which, while vital to the local ecosystem and communities, also represents a flood risk during the rainy season due to its fast flow and heavy rainfall. Geologically, Chocó has a diverse geology influenced by seismic and volcanic activity, with mountainous formations, valleys, and alluvial plains. All of this is framed by a rainy tropical climate, which, while favoring the region’s exceptional biodiversity, also poses challenges in terms of infrastructure and management of natural hazards [27], such as floods and landslides. This complex interaction among the natural elements of the Department of Chocó defines its uniqueness and highlights the need for integrated and sustainable approaches to its management and development.
Figure 1 shows the location of the hydrological stations and the exact place where the data collection of the proposed case study was carried out. Hydrological stations are located in the Department of Chocó, Colombia.

2.2. Experimental Setup

The Atrato River, situated in Colombia, ranks as the third most navigable river in the country, following the Magdalena River and the Cauca River. Originating in Cerro del Plateado, it traverses the Department of Chocó, serving as a vital means of transportation in the region and forming a natural border between Chocó and Antioquia. With a length of 750 km and a width fluctuating between 150 and 500 m, the river is a crucial component of the biogeography of Chocó, which is recognized for its remarkable biodiversity and considerable rainfall. Flowing into the Gulf of Urabá, it boasts 18 mouths forming the river delta and is acknowledged by the World Wildlife Fund as one of the world’s richest genetic banks. To verify the proposed methodology, actual data from two hydrological stations located along the Atrato River in Colombia are employed. The recorded variables include the water level, water flow, and water precipitation. The Atrato River, with a length of 750 km and a width varying between 150 m and 500 m, has depths ranging from 31 m to 38 m. The dataset covers 789 days, corresponding to 1578 data sampled every 12 h, starting on 1 January 2021. The recurrent neural network LSTM model is validated against a nonlinear NARX model and a linear ARX model. It should be noted that the level 1 output corresponds to station 1, located in the city of Belén de Bajirá, and the level 2 output corresponds to station 2, located in the city of Quibdó.
To validate the proposed approach, two analyses are conducted in this study. The first involves comparing the short- and long-term recurrent neural network (LSTM) approach for a 4th-order system. This validation includes a visual comparison of real and estimated signals using the NARX and ARX methods, along with a quantitative evaluation based on the root mean squared error (RMSE) and the Nash–Sutcliffe model efficiency coefficient (NSE). The second aspect relates to a forecasting approach for future time steps based on predictions and measurements. It is important to note that, for this analysis, 90% of the data sample is chosen to train the LSTM recurrent neural network (RNN), corresponding to 1417 out of the total of 1578 data points. This training is validated through a test using the remaining 10%, equivalent to 158 data points from the total sample. It is imperative to expose the data partitioning process to ensure the transparency and reproducibility of the study results. Based on established methodologies, such as those outlined by Smith et al. [28], 90 % of the dataset is allocated to LSTM model training, while the remaining 10 % is allocated to model validation and testing. This partitioning strategy adheres to best practices in machine learning research, aiming to strike a balance between adequately training the model on a substantial portion of the dataset to capture underlying patterns and relationships and retaining a separate subset for a robust evaluation of the model’s performance on unseen data.
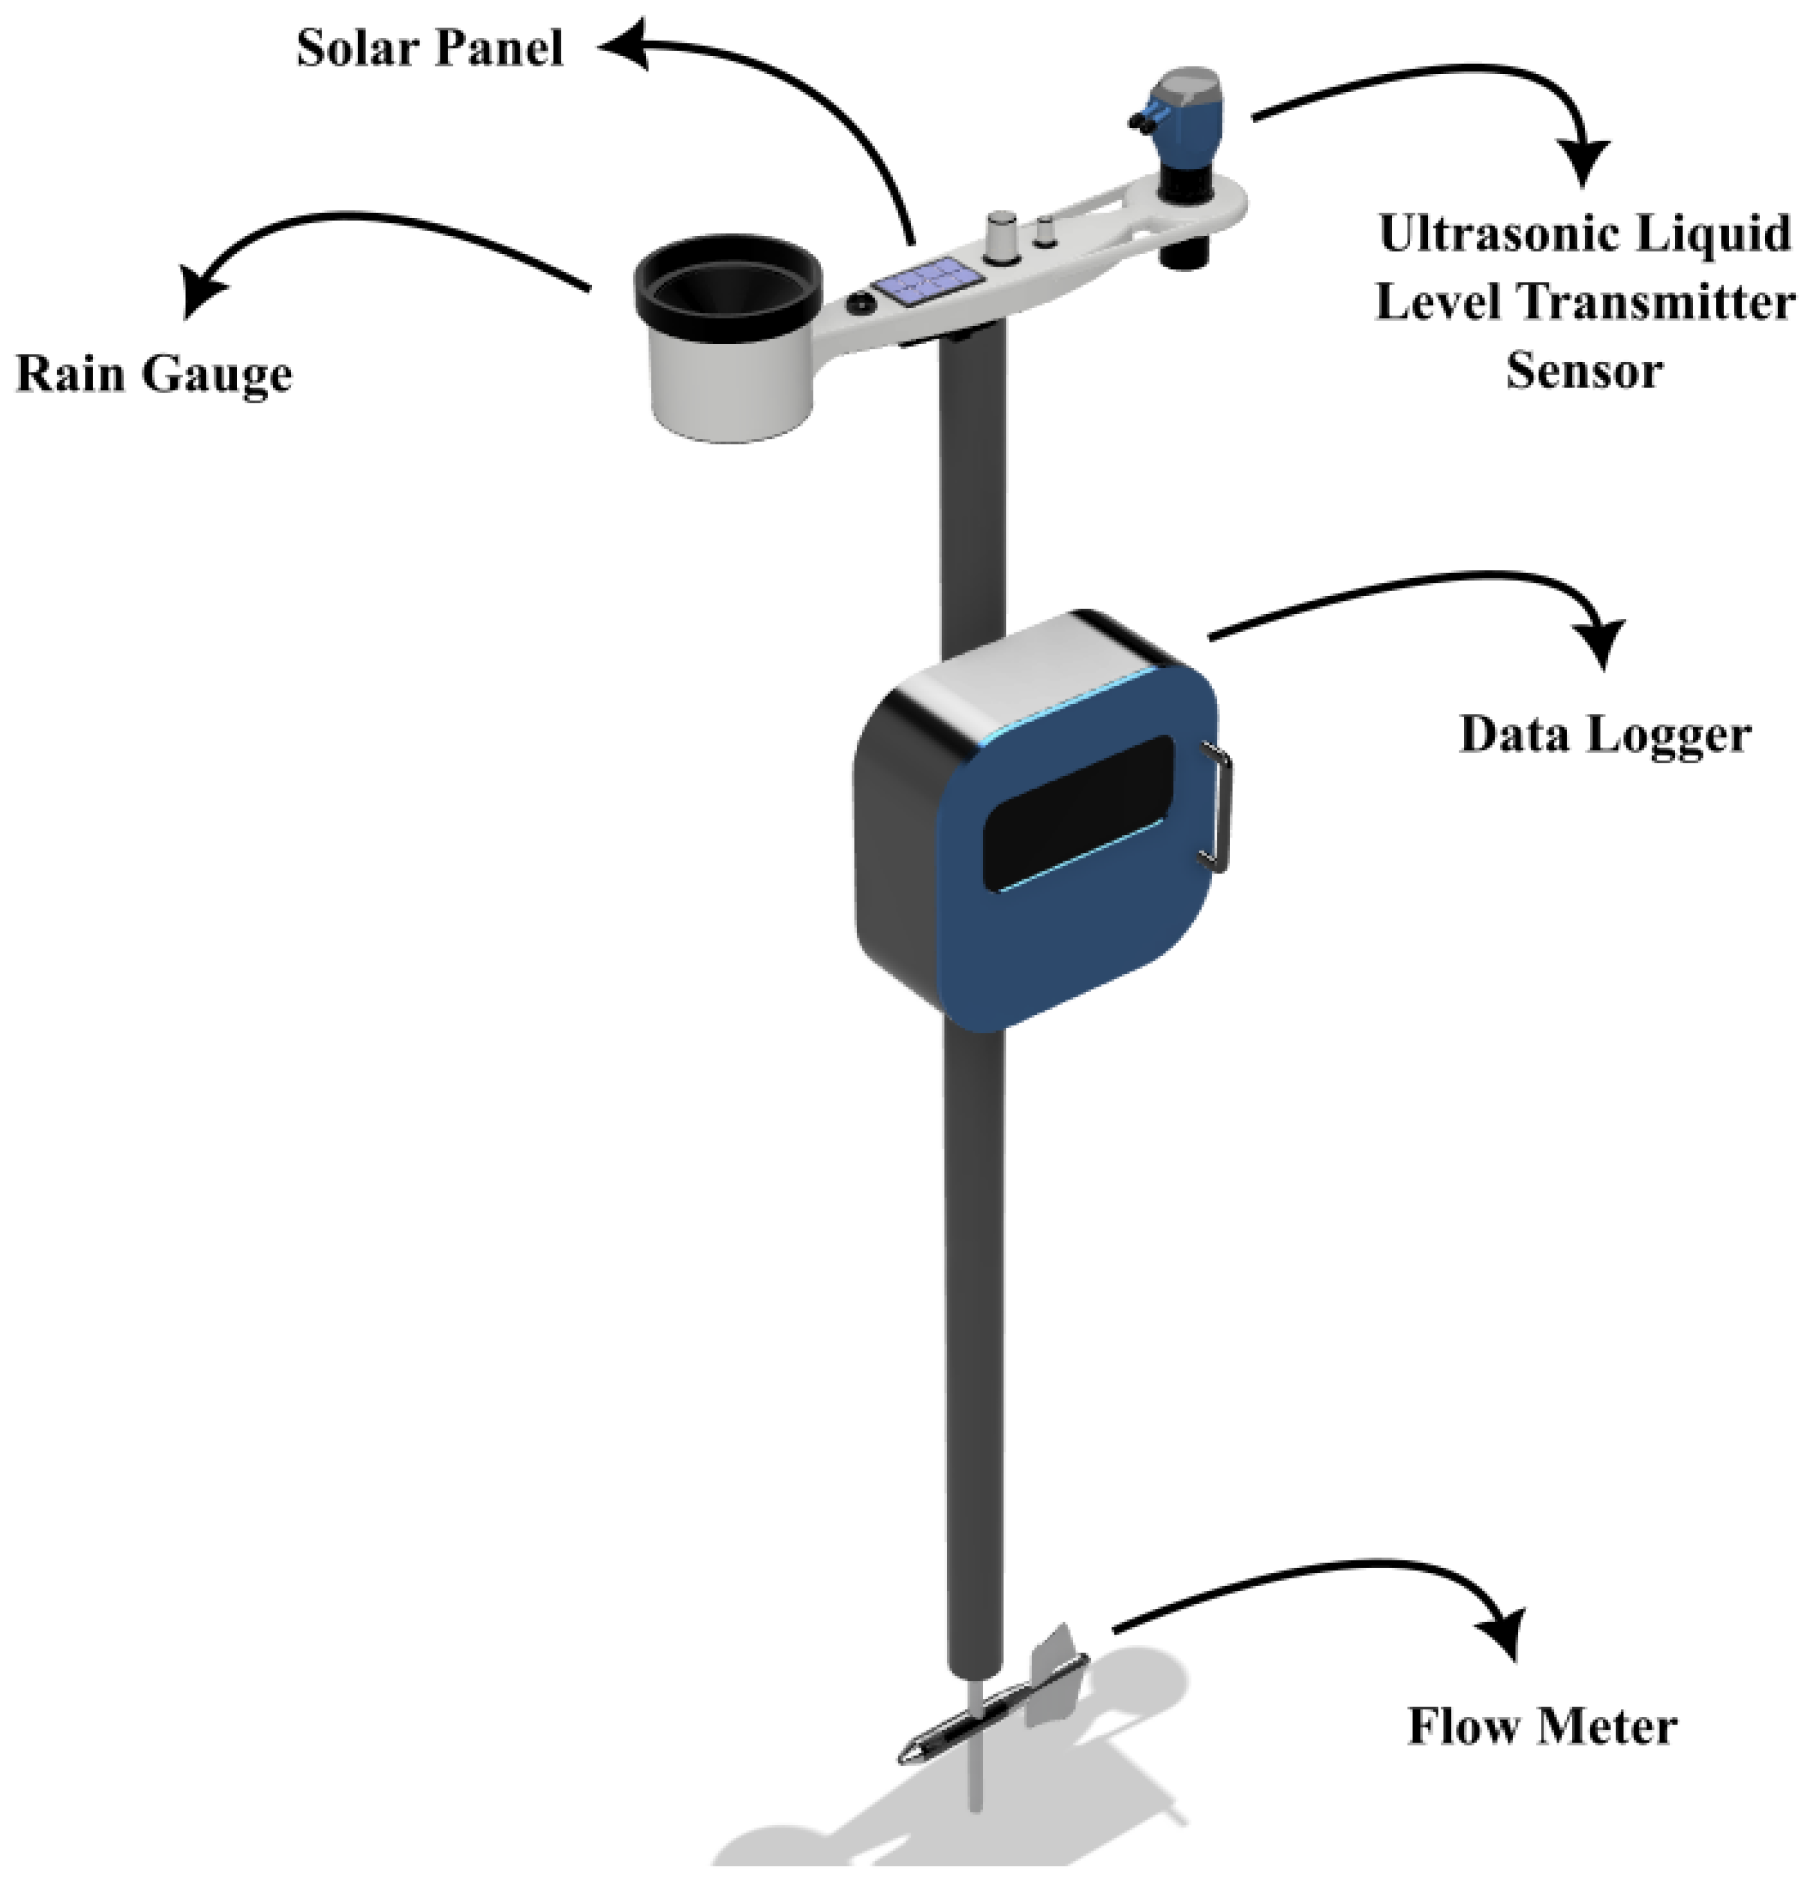
Figure 2, depicts the prototype station considered in the case study of this article, consisting of an ultrasonic level sensor, a water flow sensor, and a precipitation sensor.
Figure 2. Graphic description of the two hydrological stations installed in the two cities described in Table 1.
Information 15 00358 g002
Multiple measurement stations strategically placed along the river enable the tracking of variable dynamics at various locations, leading to the establishment of a multivariable coupled model due to the inherent interdependence of measured variables. Hydrological data from the two stations, namely, the water flow and precipitation in the Atrato River, serve as input for the training model. Water level data from the two hydrological stations are used as the predicted output, resulting in a short- and long-term system with a training model structure comprising 4 inputs and 2 outputs for a fourth-order system.

2.3. LSTM (Long Short-Term Memory) Network

LSTM is a special functional block of recurrent neural networks (RNNs) with short-term to long-term memory [29]. It is an evolution of RNNs and helps to solve the evanescent gradient problem, where, during training, the gradients of the weights become smaller and smaller; thus, the network stops storing useful information [30]. LSTM cells have three types of gates—an input gate, a memory and forgetting gate, and an output gate—for storing memories of past experiences. Short-term memory is retained for a long time, and network behavior [31] is encoded in the weights. LSTM networks are particularly well suited for making predictions based on time-series data, such as in handwritten text recognition and speech recognition.
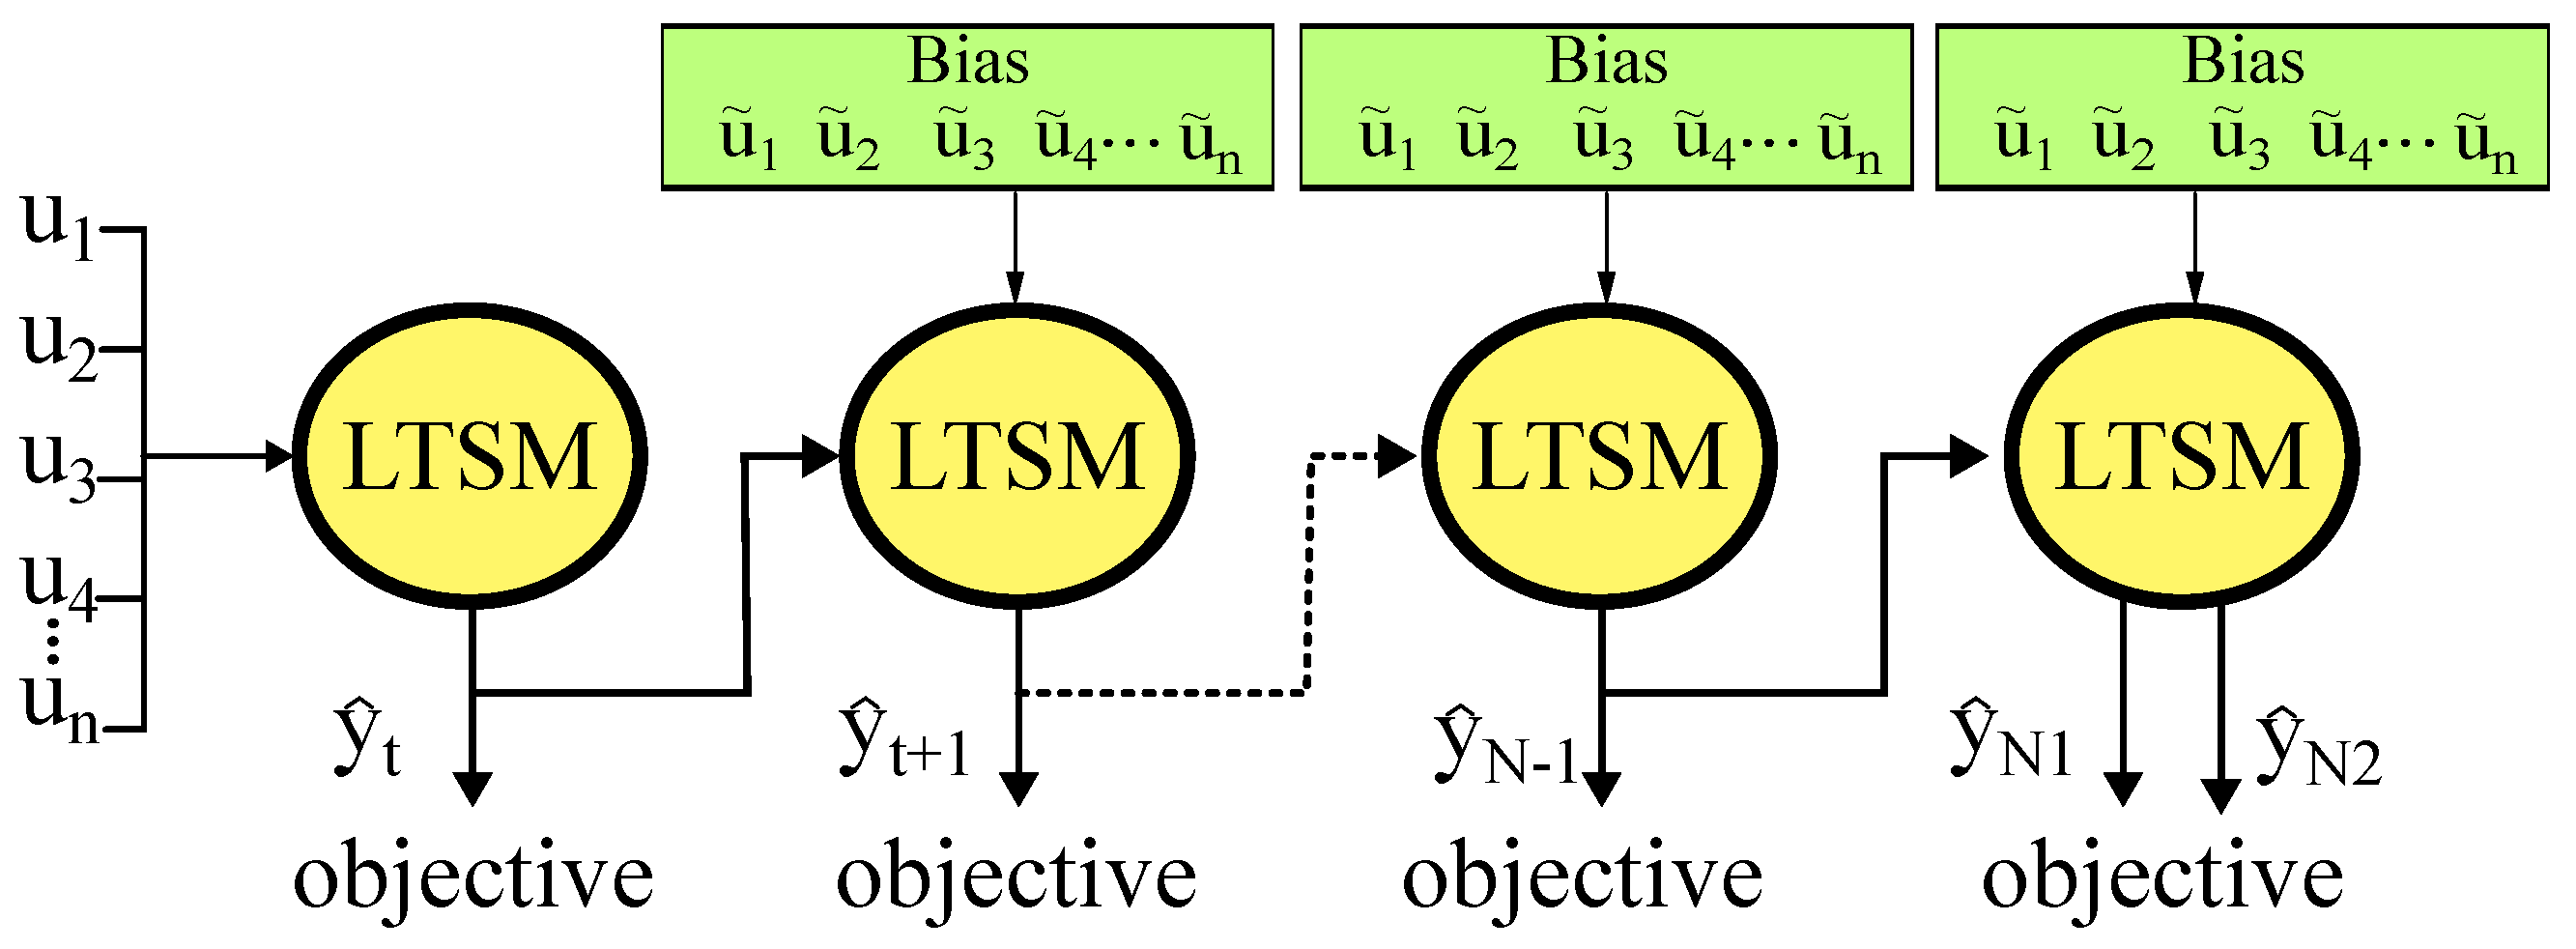
Moreover, LSTM is an architecture that emerged to alleviate these problems because, in RNNs, there is the problem that past data cannot be remembered for a long time; there are six parameters in total. Through the four-gate structure, not only short-term memory but also long-term memory can be solved. In our multivariable model, we employ the structure shown in Figure 3.
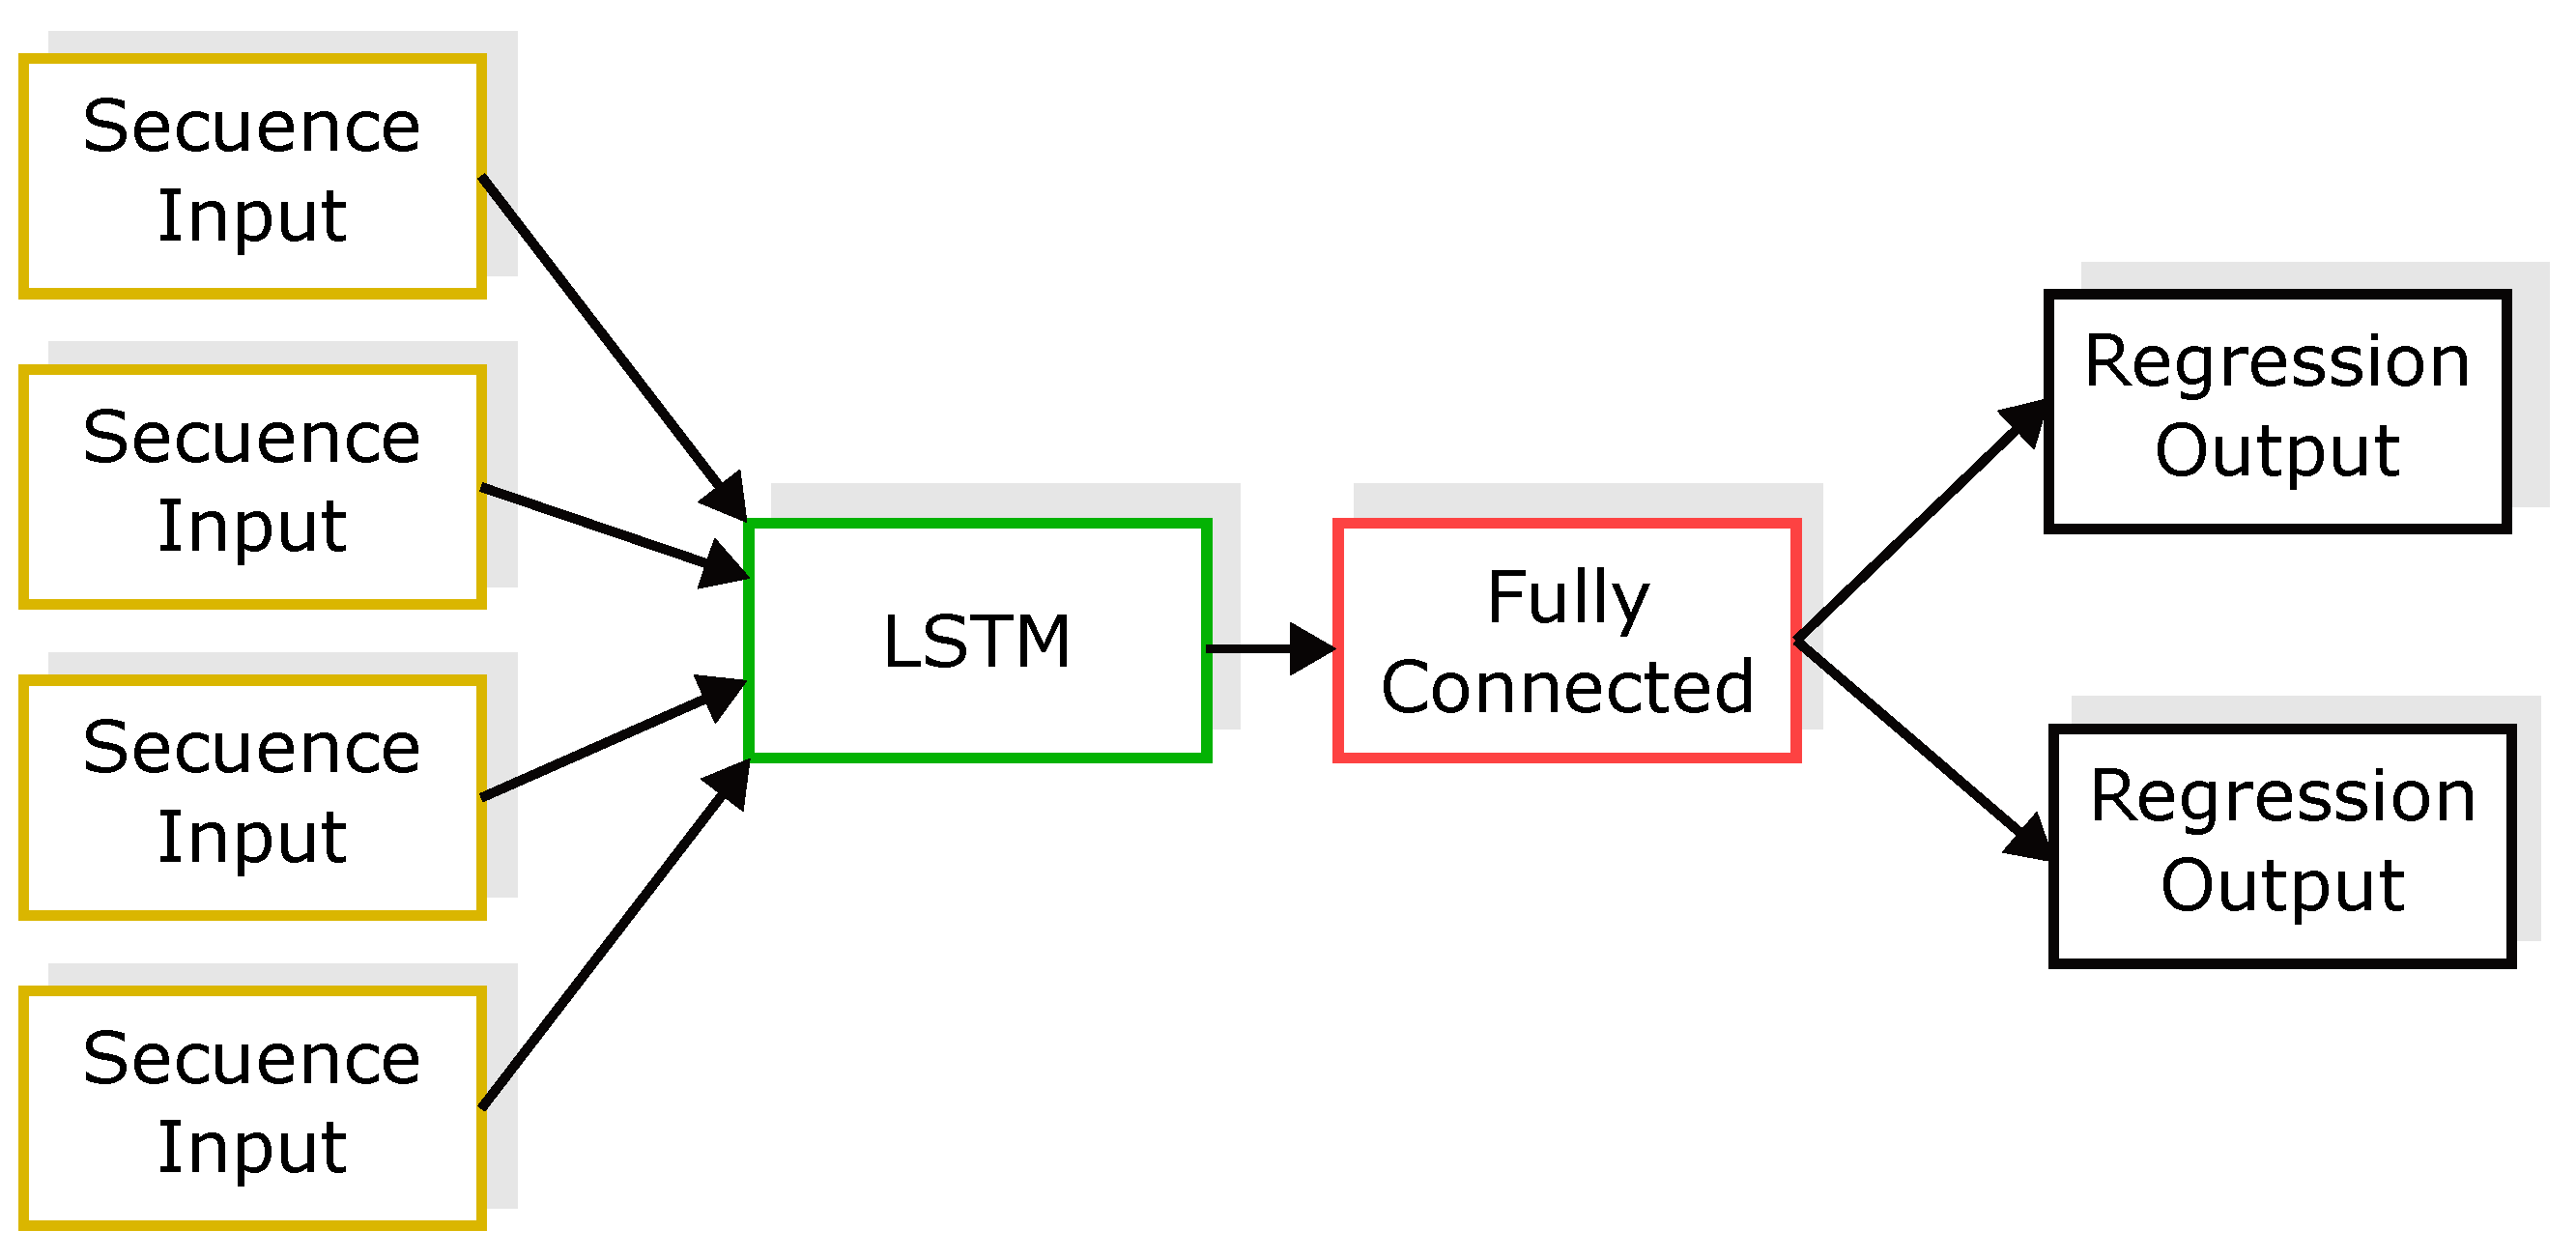
In Figure 4, the neural network starts with an input layer of sequences, followed by an LSTM layer. The neural network ends with a fully connected layer and an output regression layer.
In Figure 5, the diagram shows how the gates forget, update, and generate the cell and hidden states. These components control the state of the cell and the hidden state of the layer; among these are the entry gate (i), forgetting gate (f), cell candidate (g), and exit gate (o).
The weights that can be learned from the LSTM layer are the input weights W (InputWeights), recurrence weights R (RecurrentWeights), and bias b (Bias). The matrices W, R, and b are the combinations of input weights, cycle weights, and offsets for each component, respectively. This layer connects matrices according to the following Equation (1):
W = W i W f W g W 0 , R = R i R f R g R 0 , b = b i b f b g b o
where f, g, i, and o determine the entry gate, forgetting gate, cell candidate, and exit gate, respectively.
The cell state at time unit t is given by Equation (2).
C t = f t C t 1 + i t g t ,
where ⊙ determines the Hadamard product (element-level vector multiplication).
The hidden state at time unit t is given by Equation (3).
h t = o t σ c + C t ,
where σ c determines the state activation function. By default, the lstmLayer function uses the hyperbolic tangent function (tanh) to calculate the state activation function.
The equations of the components in time unit t are described below.
In Equation (4), we describe the gateway equation of the entrance gate; in Equation (5), is described that of the forgetting gate, in Equation (6), is also described that of the cell candidate, and in Equation (7), describe that of the exit gate.
i t = σ g ( W i u t [ k ] + R i h t 1 + b i )
f t = σ g ( W f u t [ k ] + R f h t 1 + b f )
g t = σ c ( W g u t [ k ] + R g h t 1 + b g )
o t = σ g ( W o u t [ k ] + R o h t 1 + b o )

2.4. Hydrological Variables

To forecast water levels based on river dynamics, two hydrological stations are strategically positioned along the river. To address the correlation among all system variables and their respective nonlinearities, a suggested nonlinear dynamical model is introduced. Equation (8) illustrates the inputs and outputs of the proposed model.
y [ k ] = y L 1 [ k ] y L 2 [ k ] , u [ k ] = u F 1 [ k ] u P T 1 [ k ] u F 2 [ k ] u P T 2 [ k ]
Therefore, y L 1 [ k ] and y L 2 [ k ] respond to the two level outputs of the model, while u F 1 [ k ] , u F 2 [ k ] , u P T 1 [ k ] , and u P T 2 [ k ] set the four inputs of the LSTM recurrent neural network system.
The dynamics of hydrological variables are modeled by employing a recurrent neural network (RNN), a type of artificial neural network designed for sequential or time-series data, while utilizing a long short-term memory (LSTM) architecture, as expressed below.
y [ k ] = f ( y [ k 1 ] , , y [ k n ] , u [ k 1 ] , , u [ k n ] ) + η [ k ]
where n is the order of the LSTM model, f ( . ) is a nonlinear function, and η [ k ] is additive noise at time instant k.

2.5. NARX-Based Neural Network Structure

The NARX model (Equation (9)) has u [ k j ] and y [ k j ] as inputs, representing a 4th-order model ( n = 4 ) based on an analysis of the NARX and ARX models [32]. This choice, which is supported by research, entails 24 inputs and 2 outputs to account for the variables in Equation (8).
To approximate the nonlinear function in Equation (9), a neural network structure f * ( . ) is used as an approximation for the nonlinear function f ( . ) , as depicted in Figure 6.
The NARX model is defined as follows:
y [ k ] = f * ( y [ k 1 ] , , y [ k n ] , u [ k 1 ] , , u [ k n ] ) + η [ k ]
A linear Autoregressive with Exogenous Input (ARX) structure can be derived by omitting the hidden layer, as illustrated in Figure 7.
The ARX model can be defined as follows.
Consider an ARX multivariable model that is described as follows:
y [ k ] + j = 1 p A j y [ k j ] = j = 1 p B j u [ k j ] + e [ k ]
The equation involves parameters A j and B j for the model matrix, where y represents the outputs, p represents the order of the system, u signifies the inputs, and j = 1 denotes the system order. The variable p indicates the system order, while e [ k ] denotes noise, with m being the system’s number of outputs and inputs ( y [ k ] R m × 1 and u [ k ] R m × 1 ).

2.6. Regression Metrics for the Estimation of the Quadratic Error

In this study, assessing prediction performance is crucial for gauging the model’s quality and optimizing its efficiency [33]. Two indicators are employed to evaluate the prediction performance of the outputs from the LSTM recurrent neural network model, further validating the proposed model against the nonlinear NARX and linear ARX models. Regression metrics, including RMSE and NSE [34], are utilized to quantify the error in the predictions.

3. Results

3.1. Estimation Results

This subsection showcases the outcomes of short- and long-term forecasting using the multivariate LSTM model for a system of the fourth order. Additionally, it examines the short-term response of the multivariate NARX and ARX models.
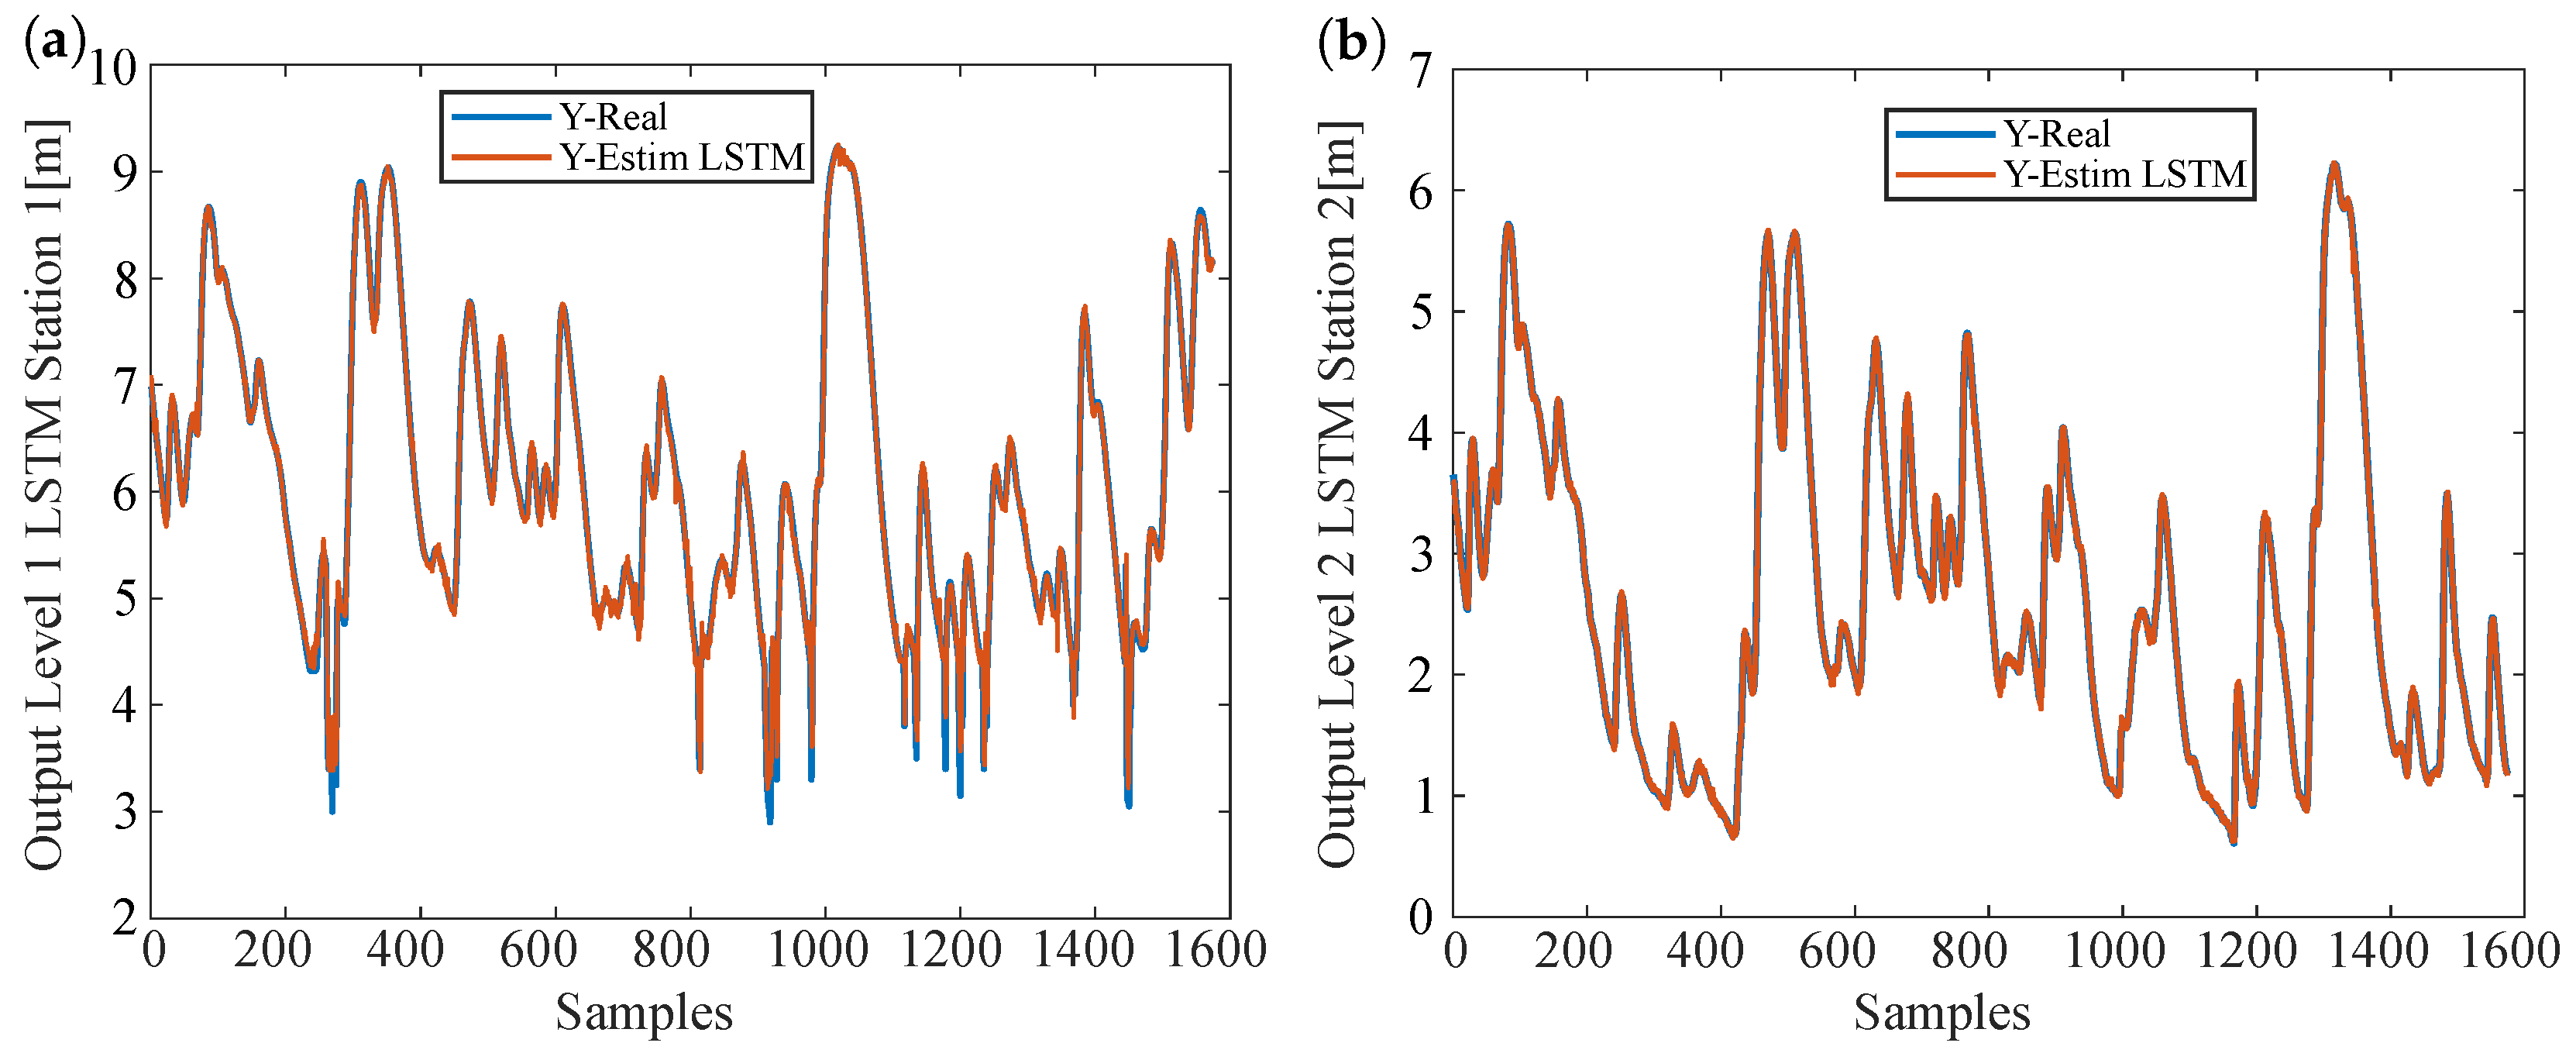
The outcomes of the LSTM method for both water level outputs are depicted in Figure 8. Specifically, Figure 8a displays the short-term estimation results for the first water level output juxtaposed with the actual measurements. Similarly, Figure 8b exhibits the short-term forecasting outcomes for the second water level output accompanied by the corresponding real measurements.
Figure 8a,b demonstrate that the real measurements are effectively estimated through the utilization of the multivariate LSTM model.
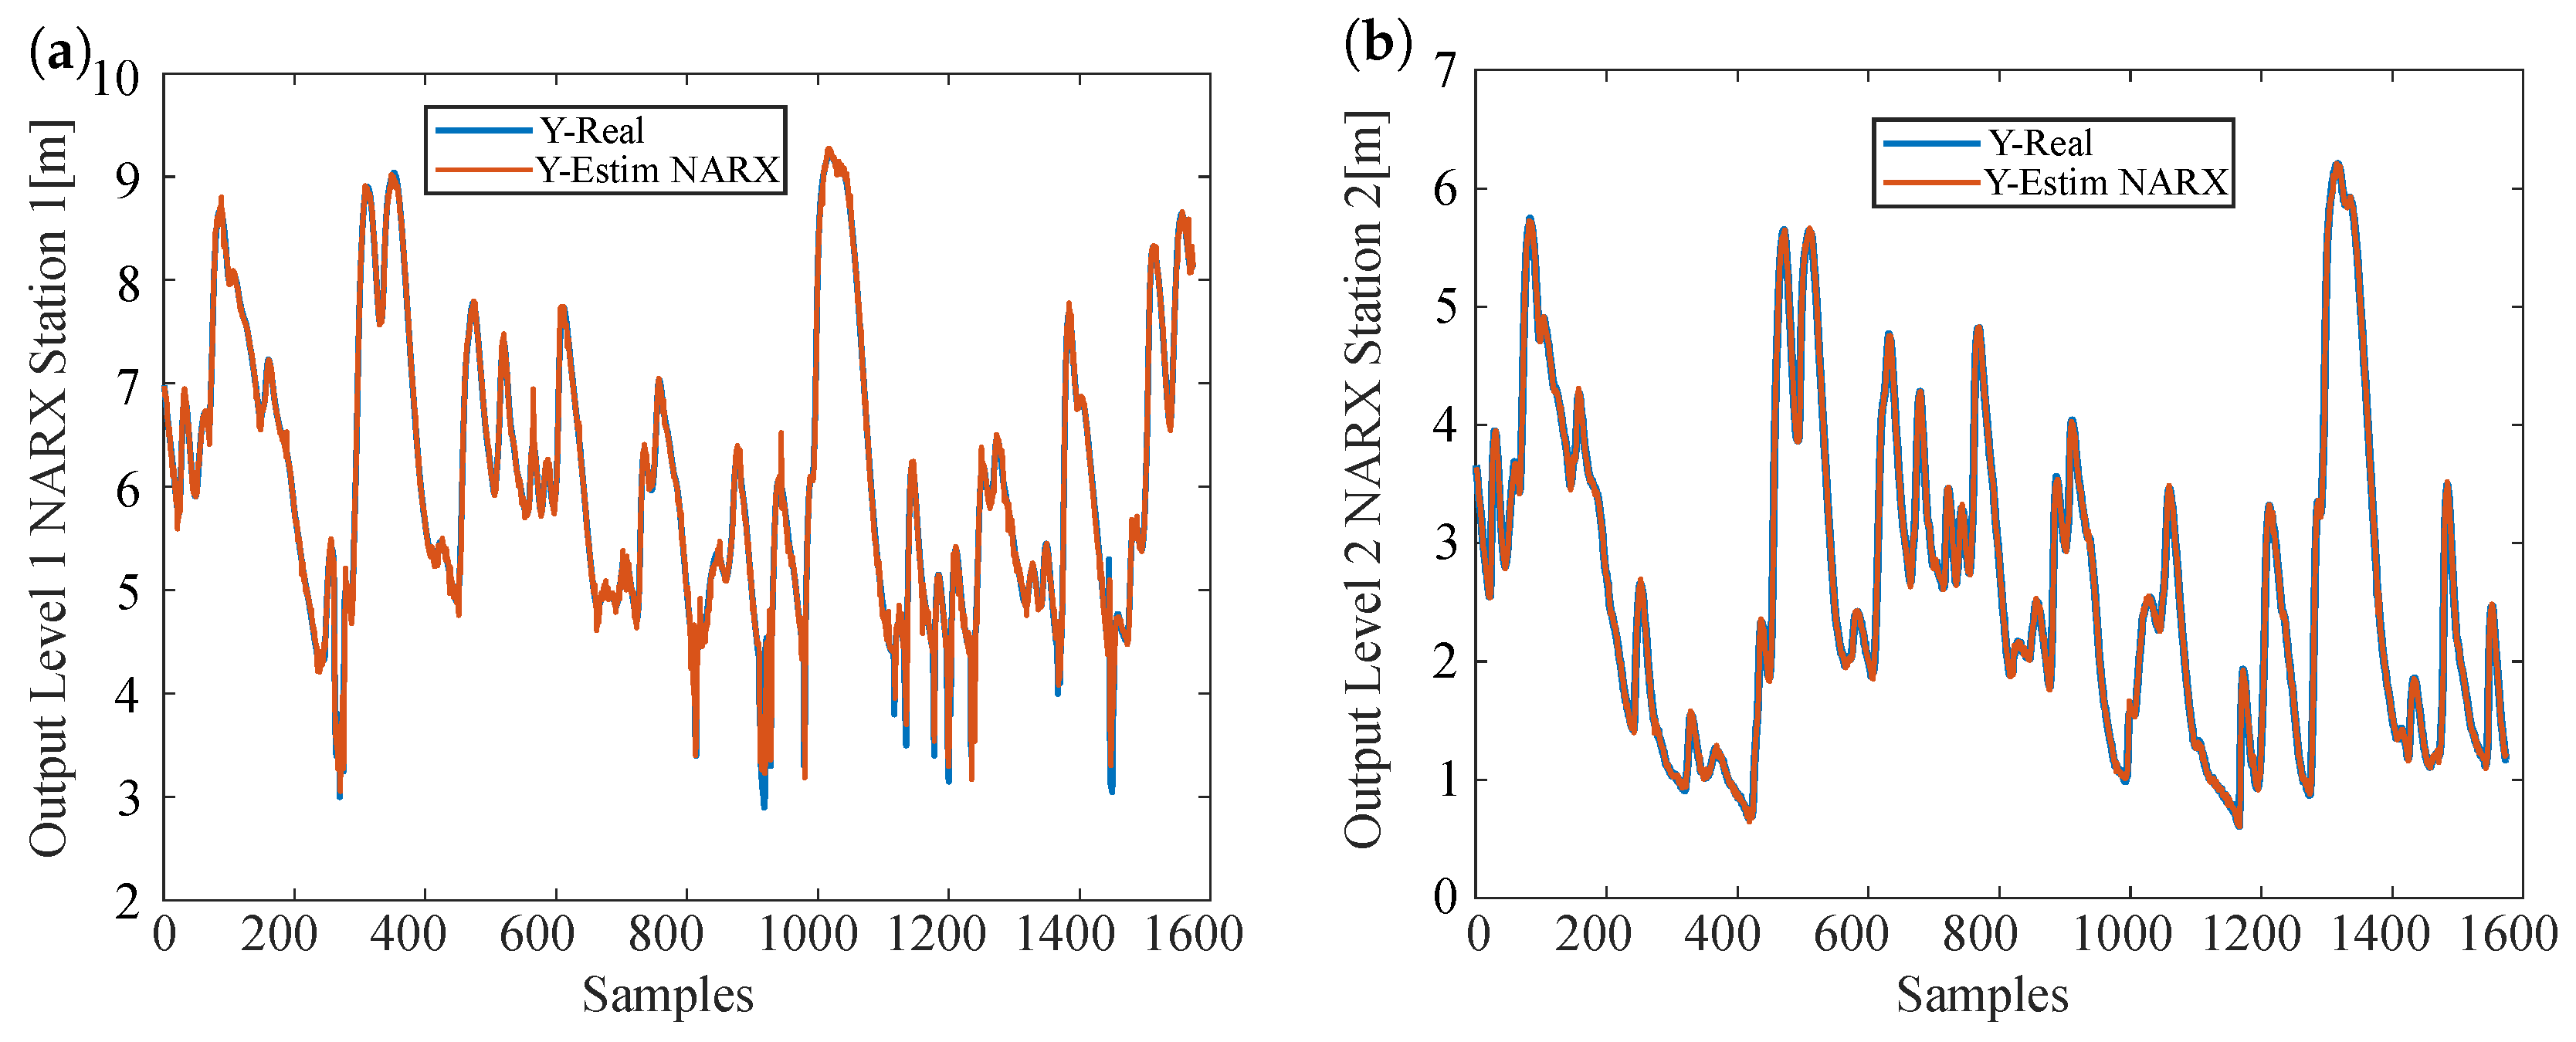
The outcomes of the multivariate NARX method for both water level outputs are presented in Figure 9, employing 64 nodes in the hidden layer, as specified in Table 2. Specifically, Figure 9a exhibits the short-term estimation of the first water level output in comparison with the actual measurements. Additionally, Figure 9b illustrates the short-term water level forecasting for the second output along with the corresponding real measurements.
The results of the multivariate ARX method for both water level outputs are displayed in Figure 10, utilizing 64 nodes in the hidden layer according to the details in Table 3. Specifically, Figure 10a shows the short-term estimation of the first water level output compared to the actual measurements. Furthermore, Figure 10b presents the short-term water level forecasting for the second output along with the corresponding real measurements.
Evaluating the prediction outcomes depicted in Figure 8, Figure 9 and Figure 10, the proposed LSTM multivariate nonlinear neural network (NNN) exhibits satisfactory performance according to visual inspection, the mathematical computation of the data analysis technique, and the computational runtime of the algorithm. To discern which approach most accurately captures the dynamics of the proposed model, a quantitative assessment is conducted. The mean square error is calculated for each considered method to compare the actual measurements with their corresponding forecasts. The results of the mean square error for the multivariate LSTM approach are presented in the table. It is evident that the estimation error of the proposed LSTM model is lower than that of the other models. Furthermore, the NSE coefficient value is closest to 1, aligning with the proposed theory that estimation is excellent when its value approaches 1.
Table 2 shows an analysis of the regression metric data for the most relevant squared error estimates of the nonlinear recurrent neural network LSTM and the nonlinear neural network NARX. In addition, it shows the computational execution time of the nonlinear neural network algorithm in order to show that the LSTM recurrent neural network (RNN) model validated with the NARX and ARX neural networks does not require much computational work from the machine’s memory.
In Table 2, the analysis reveals that the RMSE of the estimation of both outputs from the LSTM recurrent neural network, corresponding to hydrological stations 1 and 2, is lower than that of the NARX neural network and the ARX model with a nonlinear structure. Specifically, the RMSE for the water level output from the LSTM model for station 2 is 0.0028, compared to 0.0060 for the NARX model and 0.0071 for the ARX model. This indicates an improvement in the RMSE of 53.4% of the water level in meters compared to the NARX model and 60.5% of the water level in meters compared to the ARX model. Moreover, the Nash–Sutcliffe efficiency coefficient for both outputs of the LSTM recurrent neural network approaches 1, suggesting superior performance compared to the other models considered. This coefficient signifies that the closer it is to 1, the more accurate the estimation provided by the proposed LSTM neural network model. It also illustrates the response of the computational execution time for the (RNN) LSTM model in the short term in comparison with the feedforward neural network (NARX) model and the ARX model. It is evident that the (RNN) LSTM model requires more execution time due to its complex structure and operation. Specifically, the RNN LSTM model takes longer to execute because of its recurrent nature, with an execution time of 0.0089 s. In contrast, the NARX model, with its feedforward structure, has a shorter execution time of 0.0051 s, reflecting a 57.3% reduction in computational time compared to the RNN LSTM. The ARX model also shows a relatively short execution time when obtaining algorithm results.
In Table 3, the model parameters of the nonlinear LSTM, NARX, and ARX neural networks that were used to train and test the models are shown.
Table 3 shows the parameters of the LSTM, NARX, and ARX linear neural networks. The first of these models is an LSTM network, which has a specialized architecture for handling sequences of data, such as time series. With 64 nodes in its hidden layer, the LSTM network has the ability to learn and model complex relationships between inputs and outputs over time. Its learning rate of 0.2 controls the rate of adjustment of model parameters during training, influencing its ability to converge to the optimal solution. The training of the neural networks was performed with 50 epochs for both the LSTM neural network and the NARX neural network.
The second model is an NARX network, which also uses a neural network structure for prediction. Like the LSTM network, the NARX network has four inputs and two outputs. However, its architecture and inner workings may differ, as it is designed to incorporate feedback information from previous outputs into the current prediction.
Finally, the third model is a linear ARX model with a nonlinear least squares structure. Although it uses a different structure from that of neural networks, this model is still able to capture nonlinear relationships between inputs and outputs. With four inputs and two outputs, the ARX model employs both linear and nonlinear modeling methods to make predictions.

3.2. Forecasting Future Time Steps Based on Predictions and Forecasting Future Time Steps Based on Measurements

Time series are used for chronologically ordered sequences of data that are, in principle, equally spaced in time. Forecasting is the process of predicting future values of a time series based on previously observed patterns (autoregressive) or by including external variables and forecasting future time-series values based on measurements from an LSTM recurrent neural network (RNN) model.
The results obtained for the two outputs of the proposed LSTM model when forcasting future time steps based on the predicted values and those based on measurements of the metric regression and estimation responses are presented below.
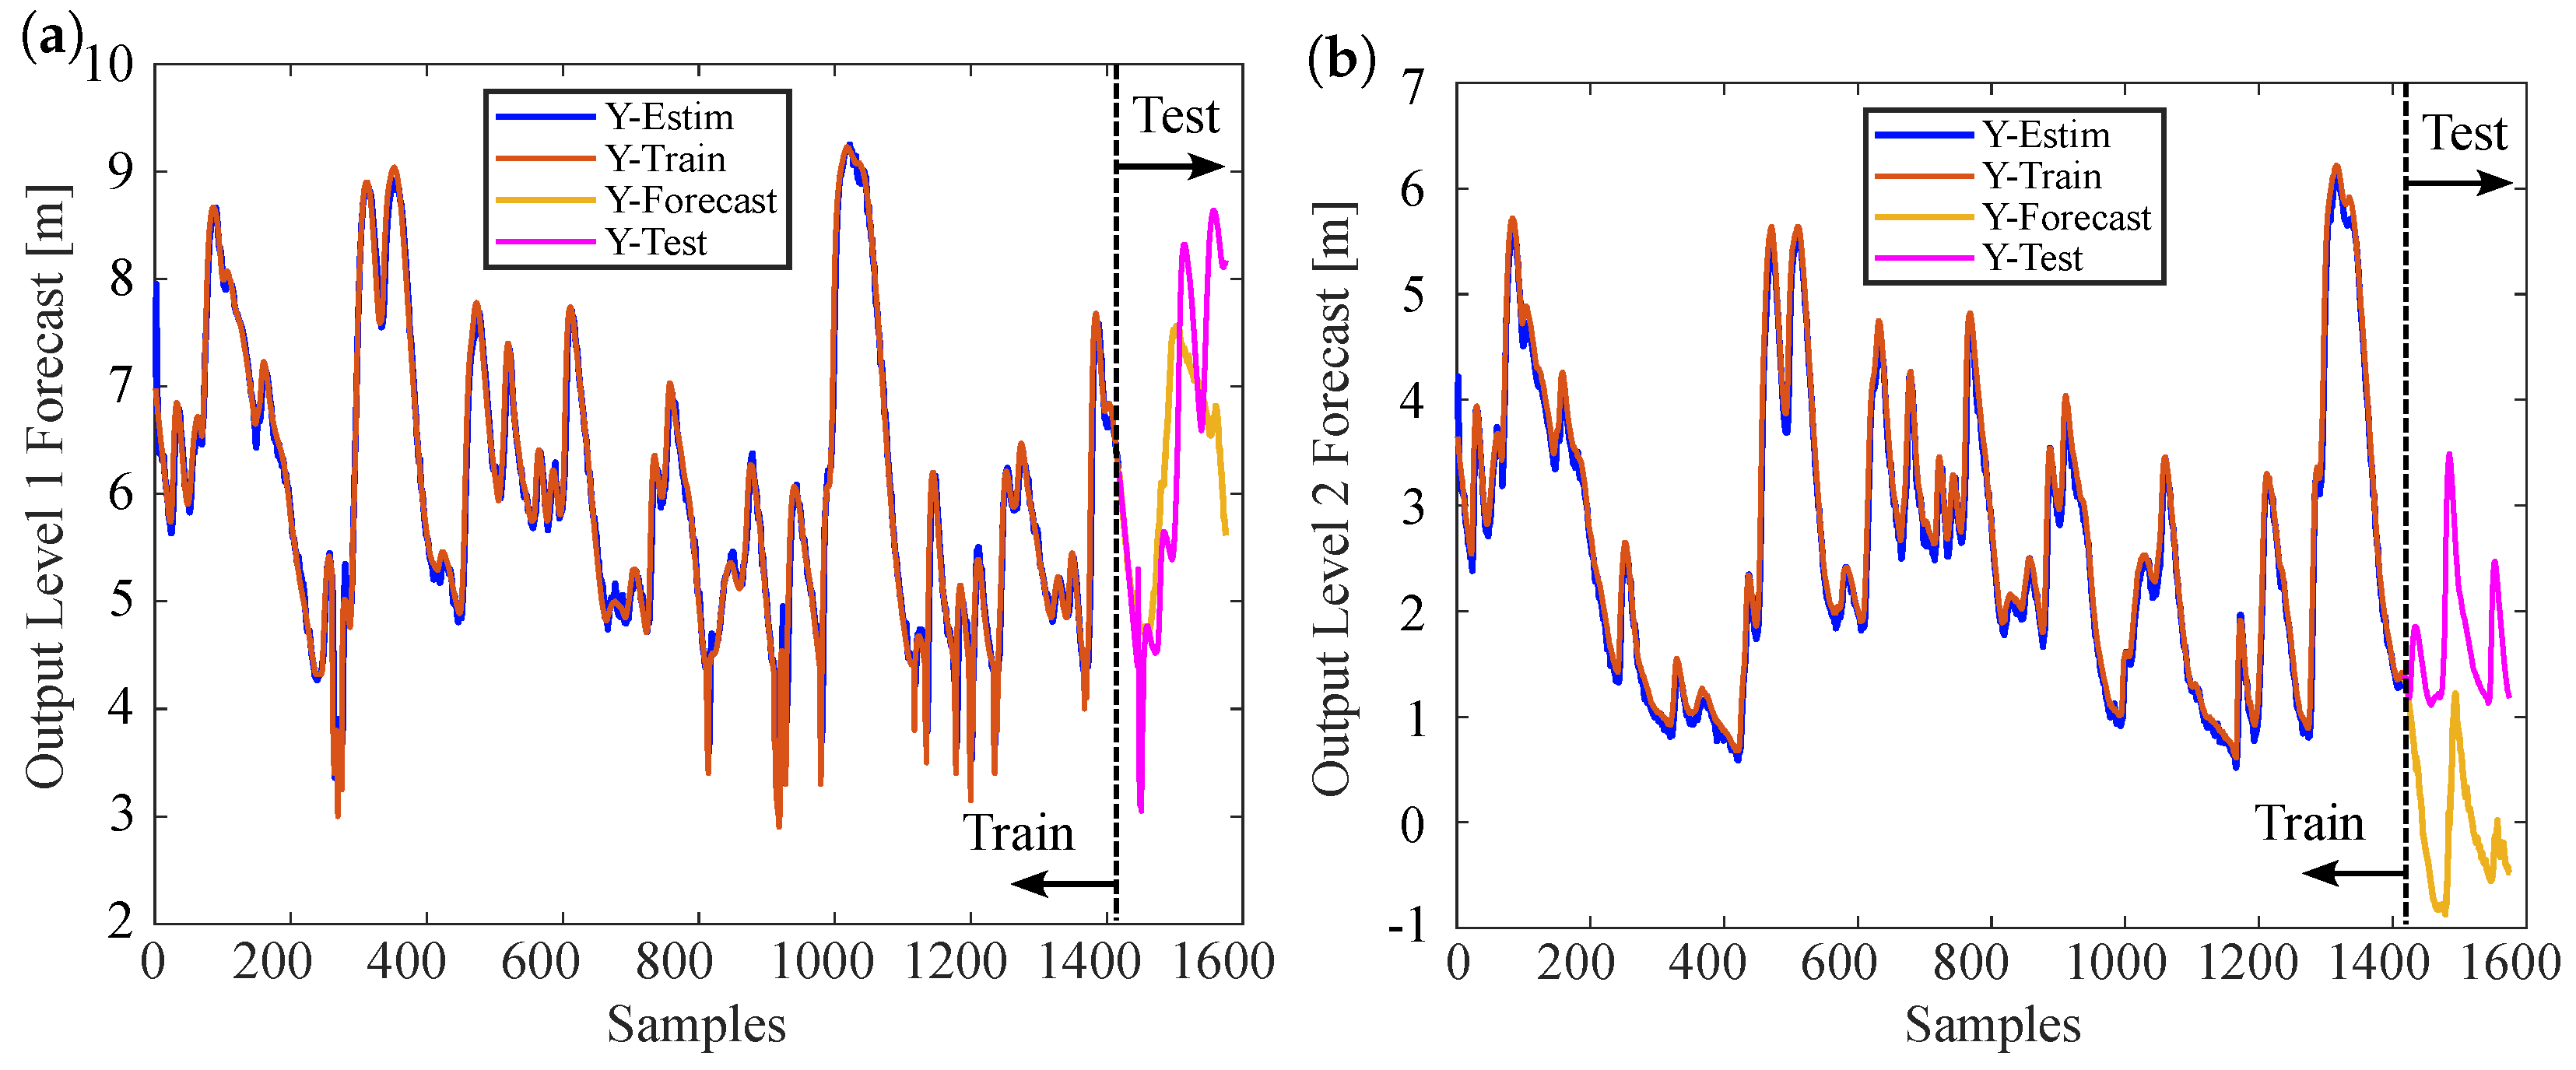
Figure 11 shows the forecasting of future time-series values by the LSTM recurrent neural network (RNN) model based on previously observed patterns (autoregressive) or when including external variables. In Figure 11a, the estimation of the first output of the water level with future time-series values of the LSTM recurrent neural network (RNN) model is presented. In Figure 11b, the estimation of the second output of the water level with future time-series values of the LSTM recurrent neural network (RNN) model is presented.
Figure 11 presents the forecasting of future time-series values of the LSTM recurrent neural network (RNN) model based on previously observed patterns (autoregressive) or by including relevant external variables. This forecasting technique allows the LSTM model to analyze and learn from historical data to identify patterns and trends, enabling it to make accurate forecasts of future time-series values. In addition, the ability to incorporate external variables into the model provides additional information that can further improve forecast accuracy by capturing external influences and complex relationships in the data. This flexibility and adaptability make LSTM models widely used in a variety of time-series forecasting applications, such as financial forecasting, sales analysis, and weather forecasting.
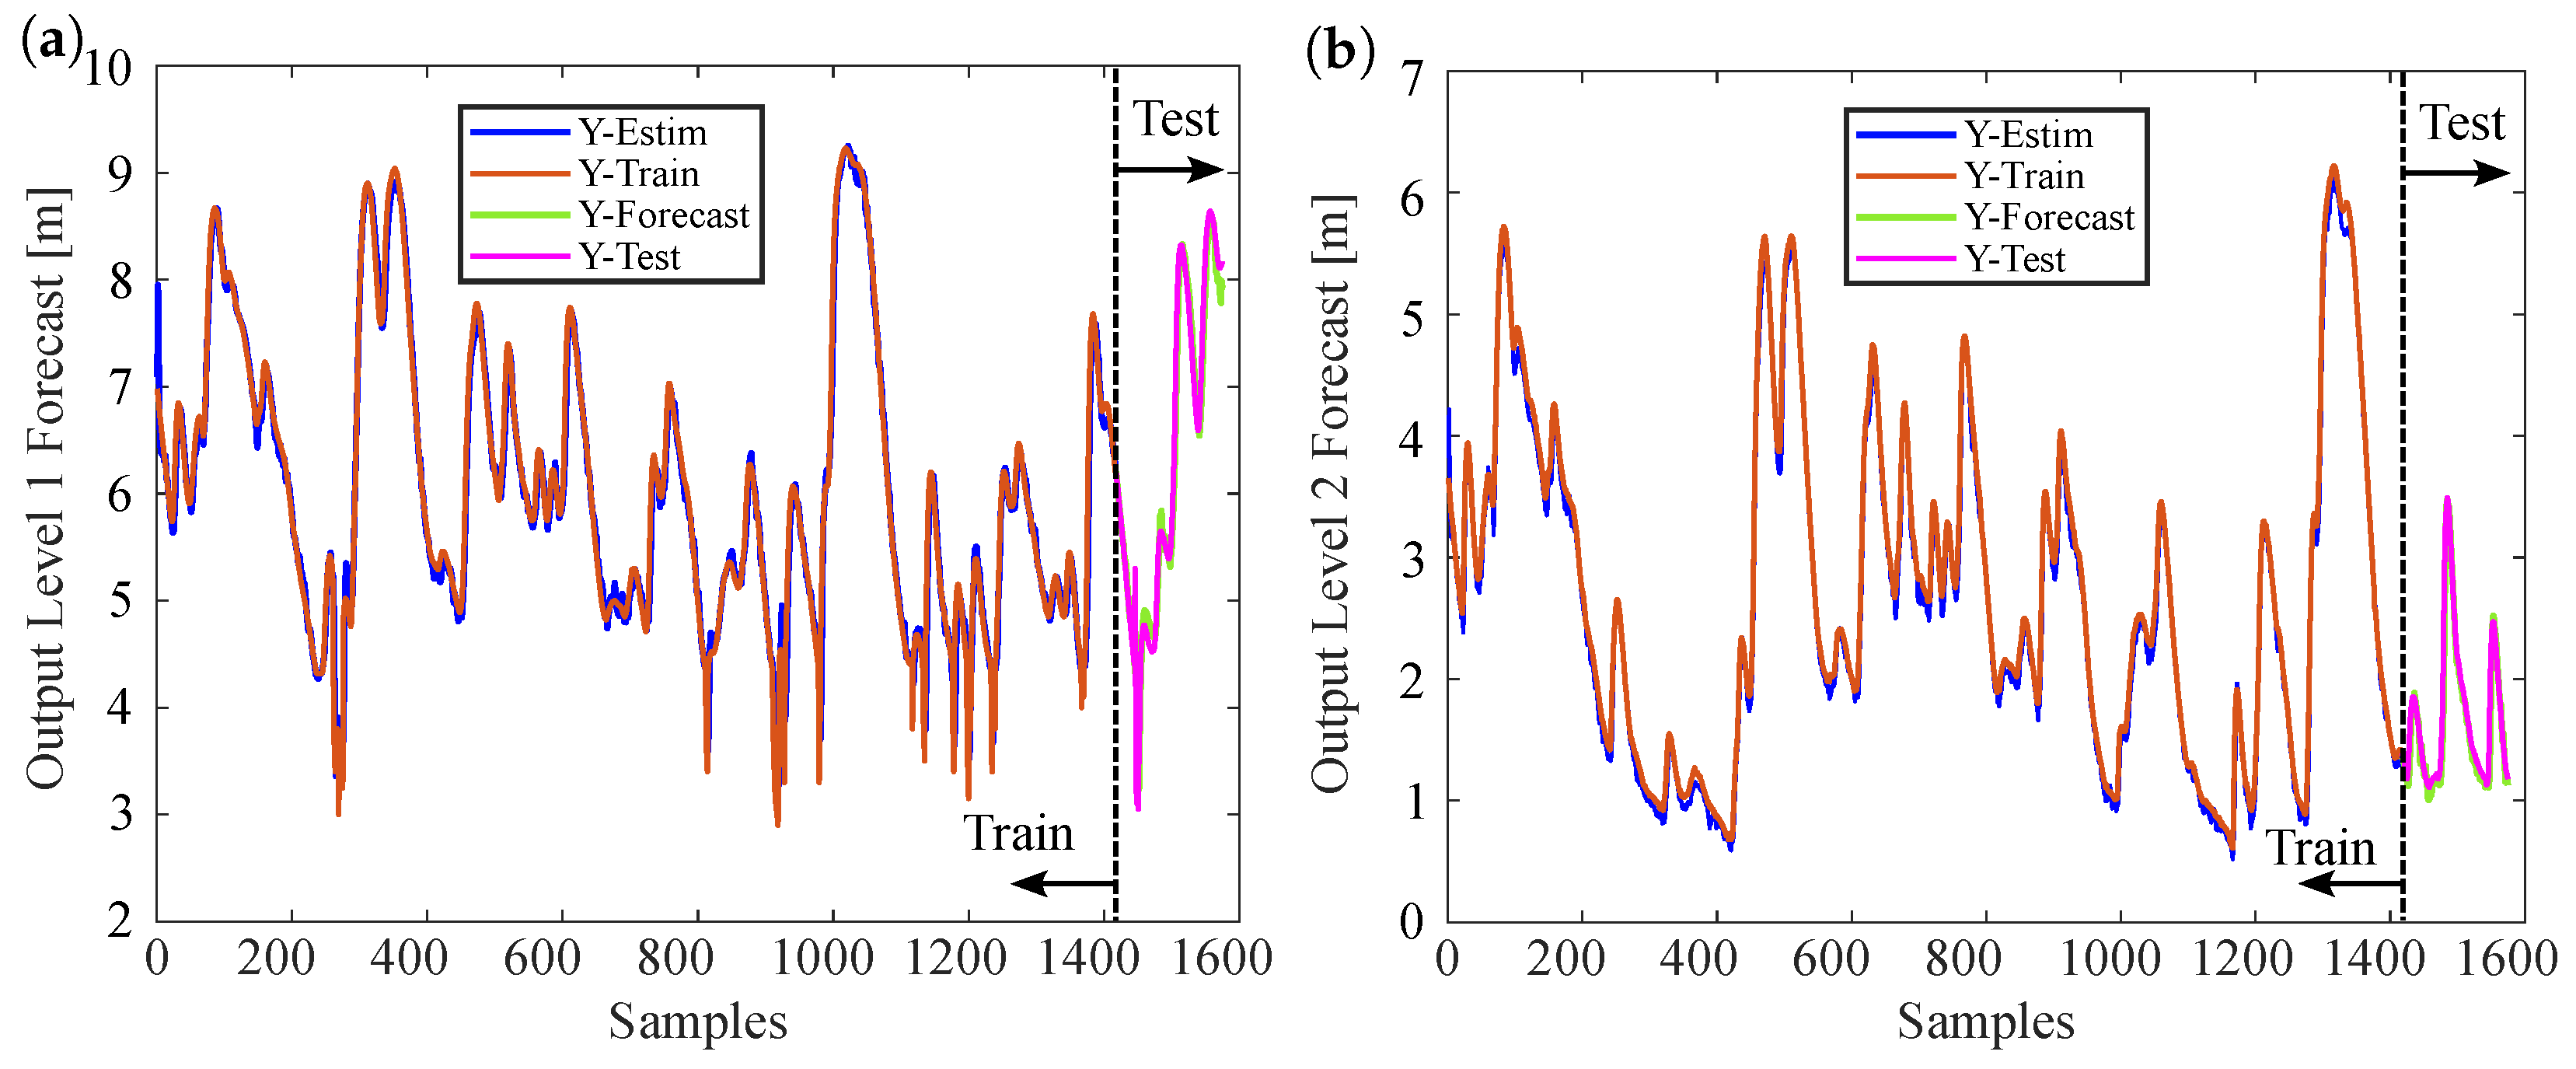
Figure 12 presents the forecasting of future time-series values based on measurements from the LSTM recurrent neural network (RNN) model. Figure 12a presents the forecasting of the response of future time steps based on measurements for output 1. Figure 12b presents the forecasting of the response of future time steps based on measurements for output 2.
Figure 12 visualizes the process of forecasting future values over a measured time series by using an LSTM recurrent neural network (RNN) model. This technique uses historical data to learn complex patterns and make accurate predictions about how the series will evolve in the future. The figure shows how the model interprets past measurements and generates projections for the next time steps.
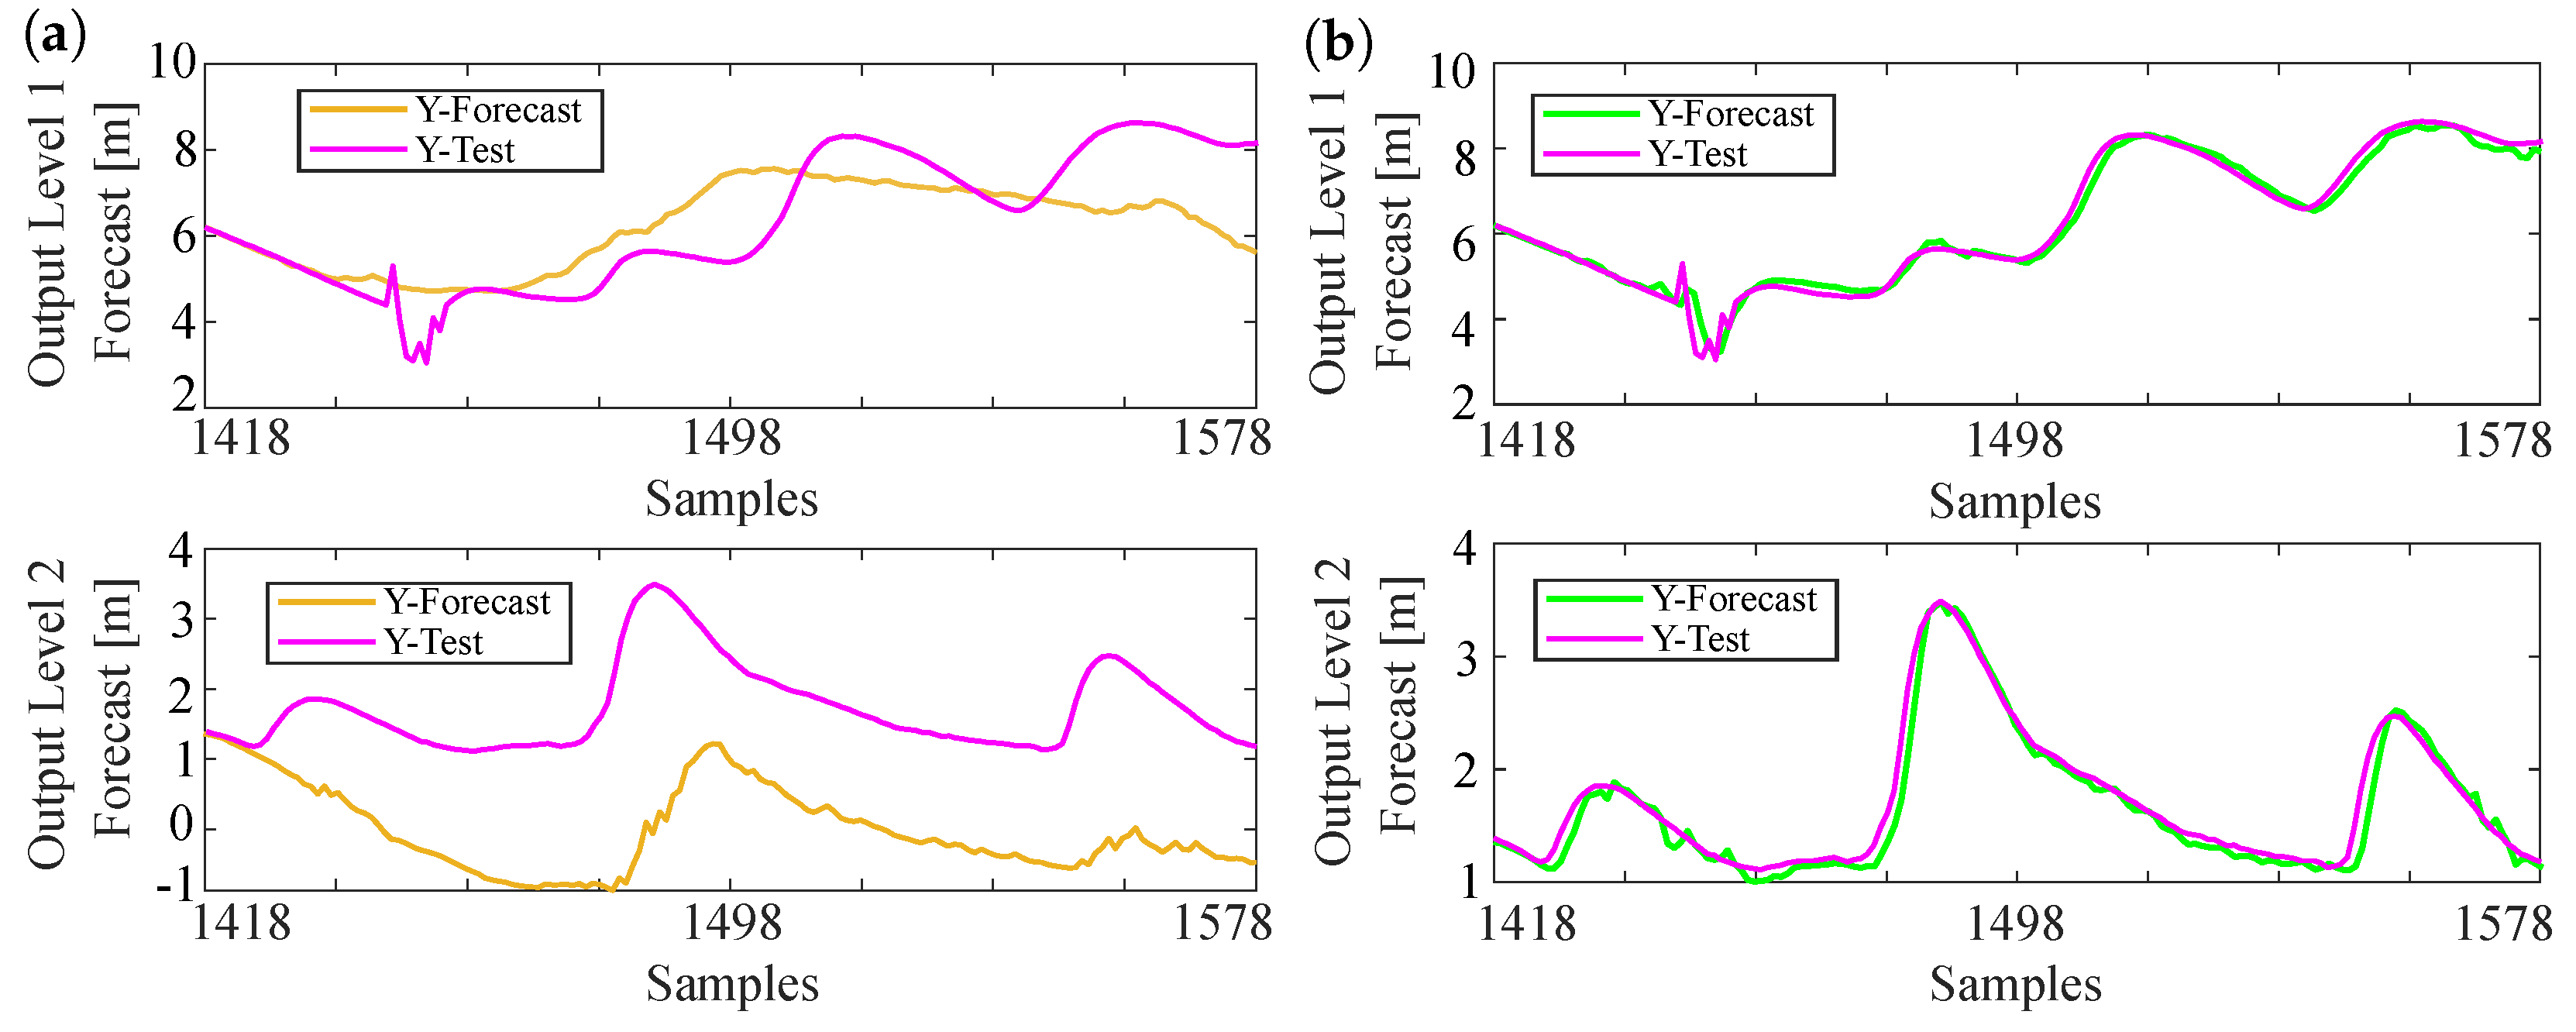
Figure 13 presents a detailed comparison of the forecasting of future time-series values based on measurements from the LSTM recurrent neural network (RNN) model and the response of time steps based on future predictions. In Figure 13a are presented the forecasting responses for output 1 and output 2 based on future predictions. In Figure 13b are presented the forecasting responses of future time steps for output 1 and output 2 based on measurements.
Figure 13 shows the forecasting of future time-series values based on measurements from the LSTM recurrent neural network (RNN) model when using historical data to train the model and generate predictions for future time steps. The LSTM model analyzes past patterns and trends in the data to make accurate predictions about future values. Once the model is trained, it can be used to forecast future time-series values by feeding it with input data representing past measurements.
Additionally, the response of each time step based on future predictions involves evaluating the model’s performance by comparing its predicted values with the actual values observed in the future. This assessment helps determine the accuracy and reliability of the LSTM model in forecasting future time-series values. By analyzing the response of each time step, one can identify any discrepancies or errors in the predictions and refine the model accordingly to improve its forecasting capabilities.
In Table 4, an analysis of two metric regression measures of future forecasts and future forecasts by the LSTM neural network based on the measurements is shown.
In Table 4, it can be observed that the total estimation error of the LSTM recurrent neural network with future forecasts is larger than the estimation error of the LSTM neural network with future forecasts based on actual measurements. Furthermore, it is observed that the Nash–Sutcliffe efficiency coefficient of the LSTM recurrent neural network with future forecasts based on actual measurements is closer to 1, which means that the proposed LSTM neural network model is very good for short-term predictions and very regular in the long term when the data for future predictions are made up of very few data samples, as in the case of this study, since this type of neural network requires large amounts of training data for future predictions.

4. Conclusions

The work presented here focuses on developing a flood prediction model using data samples from two hydrological stations situated along the Atrato River, Department of Chocó, Colombia. An LSTM neural network model was carefully constructed and evaluated to predict the level of the Atrato River based on a short-term model at the two hydrological stations. Unlike the input data needed for the hydrological model proposed here, such as the flow, precipitation, and topography, the developed algorithms use only the information of the measured data available at the two hydrological stations on the Atrato River with the objective of predicting the forward data of the two saline river levels in the proposed multivariate model. The LSTM model learned the long-term dependencies between sequential data series and demonstrated reliable performance in flood forecasting, as did the other two neural network models presented in this research.
Parameters were defined to assess the model’s performance in predicting river levels at two hydrological stations and to analyze the impact of the input data characteristics on the model’s flood forecasting capabilities. The proposed model underwent validation and testing, employing criteria such as the NSE value and RMSE value. An LSTM (long short-term memory) recurrent neural network model was evaluated for short- and long-term level forecasts using independent datasets for the level, flow, and precipitation. Both the validation and testing phases demonstrated equally commendable performance. Notably, there were no significant disparities in the simulation results for the three flow forecast cases with the LSTM model. However, when focusing on flood predictions, the NSE coefficient indicated marginally superior outcomes.
We also observe that the LSTM neural network requires more computational time, as described in Table 3, than the other two nonlinear neural network models, NARX and ARX. This is because LSTM allows RNNs to remember their inputs over a long period of time, as LSTMs hold their information in memory, in the sense that a neuron in an LSTM can read, write, and erase information from its memory.
In conclusion, the presented multivariate LSTM model based on a recurrent neural network (RNN) proves to be a valuable tool for predicting water levels while accounting for correlations among multiple hydrological variables and stations. The significant contribution of this research is the development of a flexible modeling framework that can be adapted to a wide range of hydrological systems, including additional stations and variables. Future research could investigate online training methods, transparent white-box modeling approaches, or the use of more advanced nonlinear structures to more accurately represent the nonlinear dynamics of the system.
The LSTM model employed in this study has emerged as a robust tool for predicting water levels in hydrological systems, effectively addressing the complexities of correlated variables and multiple monitoring stations. The significance of this approach lies in its adaptable modeling structure, offering versatility for application to diverse hydrological systems with varying stations and variables. Future research directions may explore aspects such as real-time training, the use of white-box models, or the incorporation of more sophisticated nonlinear structures to enhance the model’s capacity to capture intricate nonlinear behaviors within the system.
As a recommendation, when employing long-term LSTM recurrent neural network models, it is crucial to use a sufficiently large data sample to achieve optimal training. It is equally important to ensure that the data are diverse and of high quality, incorporating both historical and recent data to capture seasonal patterns and changing trends. In addition, it is recommended to implement data preprocessing techniques to handle outliers and missing values, as well as to regularize the model to avoid overfitting and improve its generalizability.
It is essential to note that the absence of hyperparameterization in this study could have compromised the stability and generalizability of the proposed LSTM model. Therefore, it is strongly recommended that future research address this limitation through a thorough analysis of various sets of hyperparameters. By properly tuning these parameters, it is possible to significantly improve the model’s ability to adapt to different datasets and contexts, thus ensuring greater reliability and robustness in its practical application.

Author Contributions

Software, J.B.R.-M.; Writing—original draft, J.B.R.-M.; Writing—review & editing, J.B.R.-M., D.P. and E.G. All authors have read and agreed to the published version of the manuscript.

Funding

This research received no external funding.

Informed Consent Statement

Not applicable.

Data Availability Statement

The data presented in this study are available on request from the corresponding author.

Conflicts of Interest

The authors declare no conflicts of interest.

References

  1. Bras, R.L.; Rodriguez-Iturbe, I. Random Functions and Hydrology; Courier Corporation: North Chelmsford, MA, USA, 1993. [Google Scholar]
  2. Ghasemi, M.; Samadi, M.; Soleimanian, E.; Chau, K.W. A comparative study of black-box and white-box data-driven methods to predict landfill leachate permeability. Environ. Monit. Assess. 2023, 195, 862. [Google Scholar] [CrossRef] [PubMed]
  3. Muncharaz, J.O. Comparing Classic Time Series Models and the LSTM Recurrent Neural Network: An Application to S&P 500 Stocks [Comparativa de los Models Clásicos de Series Temporales con la Red Neuronal Recurrente LSTM: Una Aplicación a las Acciones del S&P 500]. Financ. Mark. Valuat. 2020, 6, 137–148. [Google Scholar]
  4. Fleuret, F. The Little Book of Deep Learning. A Lovely Concise Introduction. 2023. Available online: https://fleuret.org/public/lbdl.pdf (accessed on 3 June 2024).
  5. Le, X.H.; Ho, H.V.; Lee, G.; Jung, S. Application of long short-term memory (LSTM) neural network for flood forecasting. Water 2019, 11, 1387. [Google Scholar] [CrossRef]
  6. Zhang, Y.; Gu, Z.; Thé, J.V.G.; Yang, S.X.; Gharabaghi, B. The Discharge Forecasting of Multiple Monitoring Station for Humber River by Hybrid LSTM Models. Water 2022, 14, 1794. [Google Scholar] [CrossRef]
  7. Won, Y.M.; Lee, J.H.; Moon, H.T.; Moon, Y.I. Development and application of an urban flood forecasting and warning process to reduce urban flood damage: A case study of Dorim River basin, Seoul. Water 2022, 14, 187. [Google Scholar] [CrossRef]
  8. Ortega-Alonso, D. Pintando con acuarelas en el lugar más lluvioso del mundo. Revista Afluir. 2021. Available online: https://dialnet.unirioja.es/servlet/articulo?codigo=8141737 (accessed on 3 June 2024).
  9. Akbari Asanjan, A.; Yang, T.; Hsu, K.; Sorooshian, S.; Lin, J.; Peng, Q. Short-term precipitation forecast based on the PERSIANN system and LSTM recurrent neural networks. J. Geophys. Res. Atmos. 2018, 123, 12–543. [Google Scholar] [CrossRef]
  10. Adaryani, F.R.; Mousavi, S.J.; Jafari, F. Short-term rainfall forecasting using machine learning-based approaches of PSO-SVR, LSTM and CNN. J. Hydrol. 2022, 614, 128463. [Google Scholar] [CrossRef]
  11. Baek, S.S.; Pyo, J.; Chun, J.A. Prediction of water level and water quality using a CNN-LSTM combined deep learning approach. Water 2020, 12, 3399. [Google Scholar] [CrossRef]
  12. Barzegar, R.; Aalami, M.T.; Adamowski, J. Coupling a hybrid CNN-LSTM deep learning model with a boundary corrected maximal overlap discrete wavelet transform for multiscale lake water level forecasting. J. Hydrol. 2021, 598, 126196. [Google Scholar] [CrossRef]
  13. Jabbari, A.; Bae, D.H. Application of Artificial Neural Networks for accuracy enhancements of real-time flood forecasting in the Imjin basin. Water 2018, 10, 1626. [Google Scholar] [CrossRef]
  14. Tabbussum, R.; Dar, A.Q. Comparative analysis of neural network training algorithms for the flood forecast modelling of an alluvial Himalayan river. J. Flood Risk Manag. 2020, 13, e12656. [Google Scholar] [CrossRef]
  15. Kow, P.Y.; Liou, J.Y.; Yang, M.T.; Lee, M.H.; Chang, L.C.; Chang, F.J. Advancing climate-resilient flood mitigation: Utilizing transformer-LSTM for water level forecasting at pumping stations. Sci. Total. Environ. 2024, 927, 172246. [Google Scholar] [CrossRef] [PubMed]
  16. Ruma, J.F.; Adnan, M.S.G.; Dewan, A.; Rahman, R.M. Particle swarm optimization based LSTM networks for water level forecasting: A case study on Bangladesh river network. Results Eng. 2023, 17, 100951. [Google Scholar] [CrossRef]
  17. Herath, M.; Jayathilaka, T.; Hoshino, Y.; Rathnayake, U. Deep machine learning-based water level prediction model for Colombo flood detention area. Appl. Sci. 2023, 13, 2194. [Google Scholar] [CrossRef]
  18. Dai, Z.; Zhang, M.; Nedjah, N.; Xu, D.; Ye, F. A hydrological data prediction model based on LSTM with attention mechanism. Water 2023, 15, 670. [Google Scholar] [CrossRef]
  19. Wang, Y.; Huang, Y.; Xiao, M.; Zhou, S.; Xiong, B.; Jin, Z. Medium-long-term prediction of water level based on an improved spatio-temporal attention mechanism for long short-term memory networks. J. Hydrol. 2023, 618, 129163. [Google Scholar] [CrossRef]
  20. Nearing, G.; Cohen, D.; Dube, V.; Gauch, M.; Gilon, O.; Harrigan, S.; Hassidim, A.; Klotz, D.; Kratzert, F.; Metzger, A.; et al. Global prediction of extreme floods in ungauged watersheds. Nature 2024, 627, 559–563. [Google Scholar] [CrossRef] [PubMed]
  21. Li, S.E. Reinforcement Learning for Sequential Decision and Optimal Control; Springer: Berlin/Heidelberg, Germany, 2023. [Google Scholar]
  22. Aggarwal, C. Deep Reinforcement Learning. In Neural Networks and Deep Learning: A Textbook; Springer: Berlin/Heidelberg, Germany, 2023; pp. 389–433. [Google Scholar]
  23. Atashi, V.; Gorji, H.T.; Shahabi, S.M.; Kardan, R.; Lim, Y.H. Water level forecasting using deep learning time-series analysis: A case study of red river of the north. Water 2022, 14, 1971. [Google Scholar] [CrossRef]
  24. Muñoz, P.; Orellana-Alvear, J.; Bendix, J.; Feyen, J.; Célleri, R. Flood Early Warning Systems Using Machine Learning Techniques: The Case of the Tomebamba Catchment at the Southern Andes of Ecuador. Hydrology 2021, 8, 183. [Google Scholar] [CrossRef]
  25. Pacheco, K.G.M. “Con el agua al cuello”: Una historia de batallas perdidas contra el agua y desastres por inundaciones en Colombia, 1950–2011. Agua Territ. Water Landsc. 2023, 77–91. [Google Scholar]
  26. Muñoz Agredo, H.A. Lo Natural Como un nodo de Educación y Tecnificación Agropecuaria. 2022. Available online: https://repositorioslatinoamericanos.uchile.cl/handle/2250/3564311 (accessed on 3 June 2024).
  27. Angulo, C.D.; Viviana, Y.; Oviedo-Barrero, F. Modelación numérica para la determinación de la cota máxima de inundación, en la Ensenada de Utría desde Playa de Diego hasta Ciudad El Valle-Chocó. Ing. Investig. Tecnol. 2023, 24. [Google Scholar] [CrossRef]
  28. Smith, J.; Johnson, A.; Williams, R. Advancements in Machine Learning Techniques for Hydrological Modeling. J. Hydroinform. 2020, 12, 45–58. [Google Scholar]
  29. Graves, A.; Schmidhuber, J. Framewise phoneme classification with bidirectional LSTM and other neural network architectures. Neural Netw. 2005, 18, 602–610. [Google Scholar] [CrossRef]
  30. Hochreiter, S.; Schmidhuber, J. Long short-term memory. Neural Comput. 1997, 9, 1735–1780. [Google Scholar] [CrossRef]
  31. Cho, M.; Kim, C.; Jung, K.; Jung, H. Water level prediction model applying a long short-term memory (lstm)–gated recurrent unit (gru) method for flood prediction. Water 2022, 14, 2221. [Google Scholar] [CrossRef]
  32. Renteria-Mena, J.B.; Plaza, D.; Giraldo, E. Multivariable NARX Based Neural Networks Models for Short-Term Water Level Forecasting. Eng. Proc. 2023, 39, 60. [Google Scholar] [CrossRef]
  33. González, A. Evaluación de Pronósticos de Modelos Lineales y no Lineales de la tasa de Cambio de Colombia. Ph.D. Thesis, Pontificia Universidad Javeriana, Bogotá, Colombia, 2016. [Google Scholar]
  34. Jalil, M.A.; Misas, M. Evaluación de pronósticos del tipo de cambio utilizando redes neuronales y funciones de pérdida asimétricas. Rev. Colomb. Estadística 2007, 30, 143–161. [Google Scholar]
Figure 1. Geographical localization of hydrological stations on the Atrato River.
Information 15 00358 g001
Figure 3. Multivariate schematic of the long short-term memory (LSTM) neural network.
Information 15 00358 g003
Figure 4. Architecture of a LSTM neural network to provide a visual depiction detailing the structure of a long short-term memory (LSTM) neural network designed for regression tasks. The illustration visually communicates the network’s components, including the input data, LSTM layers for capturing temporal patterns, potential hidden layers, and the output layer for continuous prediction, facilitating the understanding of the network’s design and function in this study.
Information 15 00358 g004
Figure 5. Data flow structure in time unit t: This diagram illustrates the flow of data in time unit t. This diagram shows how the gates forget, update, and generate the cell and hidden states.
Information 15 00358 g005
Figure 6. Structure of the nonlinear autoregressive neural network model.
Information 15 00358 g006
Figure 7. Structure of the linear autoregressive model with exogenous inputs (ARX) with four inputs u and two outputs y.
Information 15 00358 g007
Figure 8. Short-term estimation response of the two water level outputs of the LSTM model for the hydrological stations. Y-Real corresponds to the real data from the study sample, and Y-Estim corresponds to the estimation of these real data by the LSTM model. (a) Short-term estimation of the water level in Belén of Bajira at hydrological station 1 using an LSTM model. (b) Short-term estimation of the water level in Quibdó at hydrological station 2 using an LSTM model.
Information 15 00358 g008
Figure 9. Short-term estimation response of the two water level outputs of the NARX model for the hydrological stations. Y-Real corresponds to the real data from the study sample, and Y-Estim corresponds to the estimation of these real data by the NARX model. (a) Short-term estimation of the water level in Belén of Bajirá at hydrological station 1 using the NARX model. (b) Short-term estimation of the water level in Quibdó at hydrological station 2 using the NARX model.
Information 15 00358 g009
Figure 10. Short-term estimation response of the two water level outputs of the ARX model for the hydrological stations. Y-Real corresponds to the real data from the study sample, and Y-Estim corresponds to the estimation of these real data by the ARX model. (a) Short-term estimation of the water level in Belén of Bajirá at hydrological station 1 using the ARX model. (b) Short-term estimation of the water level in Quibdó at hydrological station 2 using the ARX model.
Information 15 00358 g010
Figure 11. Long−term estimation response of the two water level outputs of the LSTM model for the hydrological stations. Y-Real corresponds to the real data from the study sample, Y-Estim corresponds to the estimation of these real data by the LSTM model during the training stage, Y-Test corresponds to the real data, and Y-Forecast corresponds to the predictions during the testing stage. (a) Output of water level 1 from hydrological station 1, located in the town of Belén de Bajirá, with the time step response based on future predictions. (b) Output of water level 2 from hydrological station 2, located in the town of Quibdó, with the time step response based on future predictions.
Information 15 00358 g011
Figure 12. Long-term estimation of the measurement response of the two water level outputs of the LSTM model for the hydrological stations; the figure shows Y-Real, which corresponds to the real data from the study sample, Y-Estim, which corresponds to the estimation of these real data by the LSTM model during the training stage, Y-Test, which corresponds to the real data, and Y-Forecast, which corresponds to the predictions during the test stage. (a) Output for water level 1 from hydrological station 1, located in the town of Belén de Bajirá, with the response of future forecasts of time steps based on measurements. (b) Output for water level 2 from hydrological station 2, located in the town of Quibdó, with the response of future forecasts of time steps based on measurements.
Information 15 00358 g012
Figure 13. Long−term forecasting of the measurement response of the two water level outputs of the LSTM model for the hydrological stations. (a) Forecasting responses for output 1 and output 2 based on future predictions. (b) Forecasting responses of future time steps for output 1 and output 2 based on measurements.
Information 15 00358 g013
Table 1. Description of the hydrological stations’ locations.
Station 1 (E1)Station 2 (E2)
Longitude76° 40 10.75 W76° 39 44.13 W
Latitude 45 53.38 N 41 52.77 N
Altitude20.579 MASL20.83 MASL
CityBelén de BajiráQuibdó
Table 2. RMSE and NSE for the long short-term memory system and the computational execution time; Tic operates with the Toc function to measure the elapsed time.
Nonlinear ModelsRMSE Output 1RMSE Output 2NSE Output 1NSE Output 2Tic-Toc
LSTM0.00670.00280.99900.99910.0089
NARX0.00520.00600.99900.99830.0051
ARX0.02750.00710.99720.99800.0054
Table 3. Model parameters of the nonlinear neural networks.
Nonlinear ModelsLearning Rate# Input Nodes# Hidden Nodes# Output Nodes
LSTM0.024642
NARX0.024642
ARX0.024-2
Table 4. RMSE and NSE of future forecasts and future forecasts by the LSTM system based on measurements.
Nonlinear ModelRMSE Output 1RMSE Output 2NSE Output 1NSE Output 2
LSTM Forecast—Future1.23253.45200.38490.1234
LSTM Forecast—Measurements0.06200.01600.96920.9894
Disclaimer/Publisher’s Note: The statements, opinions and data contained in all publications are solely those of the individual author(s) and contributor(s) and not of MDPI and/or the editor(s). MDPI and/or the editor(s) disclaim responsibility for any injury to people or property resulting from any ideas, methods, instructions or products referred to in the content.