Article

Navigating Market Sentiments: A Novel Approach to Iron Ore Price Forecasting with Weighted Fuzzy Time Series

by
Flavio Mauricio da Cunha Souza
1,*,†,
Geraldo Pereira Rocha Filho
2,*,†,
Frederico Gadelha Guimarães
3,†,
Rodolfo I. Meneguette
4,† and
Gustavo Pessin
5,†
1
Postgraduate Program in Instrumentation, Control and Automation of Mining Processes, Federal University of Ouro Preto, Ouro Preto 35400-000, Brazil
2
Department of Exact and Technological Sciences, State University of Southwest Bahia, Vitória da Conquista 45083-900, Brazil
3
Computer Science Department, Federal University of Minas Gerais, Belo Horizonte 31270-901, Brazil
4
Institute of Mathematical and Computer Sciences, University of São Paulo, São Carlos 13566-590, Brazil
5
Vale Technological Institute, Ouro Preto 35400-000, Brazil
*
Authors to whom correspondence should be addressed.
These authors contributed equally to this work.
Information 2024, 15(5), 251; https://doi.org/10.3390/info15050251
Submission received: 18 March 2024 / Revised: 14 April 2024 / Accepted: 26 April 2024 / Published: 29 April 2024

Abstract

:
The global iron ore price is influenced by numerous factors, thus showcasing a complex interplay among them. The collective expectations of market participants over time shape the variations and trends within the iron ore price time series. Consequently, devising a robust forecasting model for the volatility of iron ore prices, as well as for other assets connected to this commodity, is critical for guiding future investments and decision-making processes in mining companies. Within this framework, the integration of artificial intelligence techniques, encompassing both technical and fundamental analyses, is aimed at developing a comprehensive, autonomous hybrid system for decision support, which is specialized in iron ore asset management. This approach not only enhances the accuracy of predictions but also supports strategic planning in the mining sector.

1. Introduction

Iron stands as one of the most extensively utilized metals globally [1]. The international pricing of iron ore is shaped by demand and supply, as well as influenced by a plethora of quantitative factors, including steel prices, production volumes, oil prices, gold prices, interest rates, inflation rates, iron production, and aluminum prices [2]. Given iron ore’s critical role in steel manufacturing, accurate price forecasting is essential for effective risk management in associated ventures and projects [3]. For mining companies like VALE, iron ore price projections are instrumental in assessing the operational viability of specific mines and in managing production surplus.
Unlike other commodities, iron ore pricing follows a unique path, thereby commonly relying on two primary sources. The benchmark index, set daily by key reference companies, represents one source. However, its transparency may be compromised due to behind-the-scenes contractual negotiations, thus affecting market price and quantity predictability. Conversely, the futures market offers nearly round-the-clock trading with transparent transactions, including detailed information on contract volumes, potential buyers and sellers, and their willing transaction prices while the market remains open [4].
The advent of digitalization in corporate governance has unlocked access to vast quantities of both quantitative and subjective market data. With the enhanced processing capabilities of today’s computers, artificial intelligence (AI) methods have become increasingly feasible and effective for prediction tasks [5,6].
Taking advantage of this data wealth, research into future iron ore prices has revealed that hybrid forecasting methodologies offer promising results. Proposals by Li et al. and Ewees et al. have successfully merged optimization techniques with artificial neural networks [2,7]. Similarly, Tuo and Zhang have introduced a hybrid model that combines signal decomposition technology with an artificial neural network [3].
Nonetheless, these methods, which mainly target technical analysis data, struggle to anticipate market shifts in the iron ore sector driven by fundamentally oriented issues. The significant impacts of events like the COVID-19 pandemic, analyzed by Jowitt [8], and carbon emission reduction policies, explored by Ma and Wang [9], underscore the profound effect of fundamental variables on pricing.
In their innovative work, Li et al. merged Rank-Dependent Expected Utility (RDEU) with game theory to examine the behaviors of mining and steelmaking companies in commercial conflicts. Their findings reveal the extensive influence of subjective factors—such as industry growth expectations, as well as the production capacity and surplus availability of mining firms—on strategic corporate decision making and market positioning. By analyzing market actors’ data and their production chain expectations, it is possible to delineate behavioral responses, isolate specific flow patterns, and devise tools and signals for enhanced negotiation, investment, and risk management strategies [10].
In recent years, AI methods employing Natural Language Processing (NLP), like sentiment analysis and opinion mining, have shown notable predictive success in the stock market through fundamental analyses, thus highlighted by studies from Alves [11] and Igarashi et al. [12].
Given the unique characteristics of the iron ore market and the cutting-edge predictive tools for similar assets discussed earlier, developing a dedicated decision support system for iron ore assets is crucial. Such a system, being capable of accurately forecasting iron ore prices using time series analysis, assessing asset-related risks via textual information, and recommending optimal resource management strategies, would provide immense value to companies and managers within this sector.
The successful application of sentiment analysis on news articles and the aggregation of indexes using hesitant fuzzy sets demonstrate the potential for creating an index to quantify subjective market variables specific to the iron ore sector. Moreover, this index could serve as an input variable in a fuzzy time series predictive model, thus potentially enhancing the accuracy of iron ore price forecasts beyond current literature methods.
This study aims to explore the use of alternative variables—derived from industry-related news—as inputs in multivariate fuzzy predictive models to forecast the future trends of the average price time series for 62% refined iron ore. To achieve this, an index will be developed through the hesitant fuzzy aggregation of sentiments extracted from iron ore-related news via sentiment analysis. Furthermore, the quantity of news will be evaluated as an exogenous variable in a predictive model employing fuzzy time series, thus aiming to bolster the model’s robustness compared to existing iron ore price forecasting methods in the literature.
The structure of this document is as follows: An overview and discussion of work relevant to this field are provided in Section 2. The methodology behind the development of the model we propose is detailed in Section 3. The findings from our investigation are explored and interpreted in Section 4. Conclusions drawn from this study, alongside suggestions for future research avenues, are offered in Section 5.

2. Related Work

Beginning with Natural Language Processing (NLP) methods, Igarashi et al. [12] investigated the influence of news and editorials from media outlets specializing in financial markets on market dynamics. Their study juxtaposed the sentiment polarity of the news analyzed against trends identified by technical analysis techniques, such as moving averages, thus finding a predominantly moderate correlation between sentiment and stock price movements. To streamline the analysis of the latest financial market news and aid investors in swift decision making, Sousa et al. [13] suggested employing Bidirectional Encoder Representations from Transformers (BERT) for sentiment analysis, thereby reaching a notable F score of 72.5%.
Advancing the integration of artificial intelligence techniques to support the creation of hybrid forecasting models in the stock market, Dias et al. [14] utilized linguistic values and their corresponding hesitant sets, along with tweets from Bloomberg and the closing figures of the Standard and Poor’s 500 and Nasdaq Composite indexes to depict the American stock market’s prices and sentiments. They applied the Weighted Multivariate Fuzzy Time Series (WMVFTS) as their machine learning model, thereby enhancing the outcomes achieved by the FTS method.
Regarding iron ore price forecasting, a significant portion of recent studies have leveraged artificial intelligence methods driven by predominantly quantitative data in technical analyses. The model proposed by Ewees et al. [7] incorporates chaotic behavior into the recent metaheuristic Grasshopper Optimization Algorithm (GOA) to develop a novel algorithm named the Chaotic Grasshopper Optimization Algorithm (CGOA), which was then utilized to train a Multilayer Perceptron (MLP) network. Similarly, Tuo and Zhang [3] introduced a hybrid model, the Ensemble Empirical Mode Decomposition–Gated Recurrent Unit (EEMD-GRU), thus leveraging signal decomposition technology and an artificial neural network alongside a new data reconstruction method to investigate price risk and fluctuation correlations between Chinese iron ore futures and spot markets. More recently, Li et al. [15] explored the iron ore trade conflict between Chinese steel companies and Australian mining firms using a mix of RDEU and the Hawk–Dove game model. In their latest research, Tonidandel Jr. and Guimarães [16] evaluated the accuracy of fuzzy models, including the Probabilistic Weighted Fuzzy Time Series (PWFTS) and Fuzzy Decision Trees (FDTs), against ARIMA, MLP, and Xgboost predictive models in forecasting iron ore prices.
This work aims to contribute to scientific innovation by amalgamating techniques from the studies mentioned above to introduce a novel variable reflecting the market’s subjective nature, thereby enhancing the robustness of iron ore price forecasts. Utilizing NLP for the sentiment analysis of textual data (iron ore news), hesitant fuzzy sets for sentiment index aggregation, and a fuzzy time series in a hybrid system with diverse machine learning methods, this research seeks to process a variety of input variables and deliver more reliable iron ore price series forecasts than previously available solutions. Table 1 outlines the key topics addressed in related works and the comprehensive scope of this study in its concluding line.

3. Proposed Solution

In this section, we propose the development of a system that utilizes an aggregated sentiment index in an FTS for forecasting iron ore prices. First, we report on the selection, collection, and processing of the data. Next, the method used for sentiment analysis of tweets is presented. This is followed by a description of the method employed to aggregate sentiments from different tweets pertaining to the same considered time period. Subsequently, the WMVFTS method for forecasting is explained. In addition to the system development, to evaluate its efficiency, experimental configuration tests and comparisons between the developed system and other solutions found in the literature will be conducted. Figure 1 provides a brief overview of the methodology of the work.
The study by Tonidandel Jr. and Guimarães [16] serves as the benchmark against which we compare the results and assess the performance of our proposed model.

3.1. Dataset

The dataset employed in the experiments presented in this article consists of two primary components. The first component is a monthly time series of the average prices for refined iron ore futures contracts, which contain a 62% iron content. This series spans from July 2015 to January 2022, thus covering a total of 79 months. The prices reflect the market dynamics and are indicative of the commodity’s economic value over the considered period.
The second component focuses on sentiment analysis and comprises tweets tagged with “iron ore”, specifically those posted by Bloomberg (@business) from 1 July 2015 to 31 January 2022. These tweets were retrieved using the Twitter API, thus resulting in a collection of 504 tweets. Prior to sentiment analysis, the tweets underwent preprocessing, which included removing URLs, special characters, and stopwords to ensure the quality and relevance of the text data. The sentiment analysis algorithm employed NLP techniques to extract sentiment scores from the processed tweets, thereby categorizing each tweet’s sentiment on a scale from 0.0 (most negative) to 1.0 (most positive). The sentiments were then aggregated into 79 data points, correlating with the monthly time series, to provide insight into public sentiment regarding iron ore prices during the period.
Furthermore, the dataset was enriched by including the monthly tweet count, thereby offering an additional dimension of analysis by correlating market prices and public interest or concern as reflected in social media activity. The compiled dataset thus provides a comprehensive basis for analyzing the interplay between market prices and public sentiment towards iron ore.
The visualization of the time series for these variables is illustrated in Figure 2, Figure 3 and Figure 4, which depict the trends and fluctuations in iron ore prices, sentiment analysis scores, and the volume of tweets over the study period, respectively. This multidimensional approach facilitates a nuanced understanding of the factors influencing iron ore market dynamics.

3.2. Iron Ore Prices

The behavior of a monthly time series of average future contract prices for refined iron ore with a 62% iron content was analyzed and forecasted.
In this series, the period between July 2015 and January 2022 was considered, as it matches the timeframe studied by Tonidandel Jr. and Guimarães [16], thus facilitating the comparison between their methods and the one proposed by this work. This is a period where there was a consistent amount of tweets published about the market and iron ore prices, a historical peak in iron ore prices occurred, and there were variations influenced by the COVID-19 pandemic.
Tonidandel Jr. and Guimarães [16] confirmed that the series of average prices of future contracts for refined iron ore with a 62% content, covering the period from July 2015 to January 2022, is nonstationary, which is evidenced by a trend pattern. In this series with monthly periodicity, strong autocorrelation with neighboring lags (up to the twelfth month of delay) was observed, with a low decay of autocorrelation values over time. This indicates that neighboring lags are highly significant for explaining the behavior of the series at a given moment.

3.3. Aggregate Sentiment Index of Tweets

In addition to the main series dataset, a sentiment analysis of tweets posted by Bloomberg (https://twitter.com/business, accessed on 25 April 2024), related to the iron ore market throughout the considered time series, was conducted. A sample of the tweets to be analyzed can be observed in Table 2.

3.3.1. Sentiment Extraction

Sentiment extraction was made possible through the application of BERT on the content of tweets. BERT, introduced by Devlin et al. [17], combines embeddings, bidirectional strategies, and transformers. The transformer, depicted in Figure 5, is a sequence-to-sequence architecture based exclusively on attention mechanisms for encoders [18].
An attention mechanism functions by mapping a query and a set of key–value pairs to an output, where the query, keys, values, and output are all vectors. The output is computed as a weighted sum of the values, where the weight assigned to each value is determined by a compatibility function of the query with the corresponding key [18]. The specific attention mechanism employed by transformers is referred to as “Scaled Dot-Product Attention”, as illustrated in Figure 6.
In it, the input consists of queries and keys from the d k dimension and values from the d v dimension. The scalar products of the query are calculated with all keys, wherein we divide each by d k and apply a softmax function to obtain the weights on the values. The attention function is calculated on a set of queries simultaneously, which is grouped in a matrix Q. Matrices K and V group the keys and values, respectively. The resulting matrix is given by Equation (6):
Attention ( Q , K , V ) = softmax Q K T d k V
Q, K, and V are matrices that represent sentences after embedding.
Multihead attention, shown by Figure 7, consists of several attention layers running in parallel. In other words, it is an application of the attention mechanism in subspaces, where information from different subspaces is processed in different positions.
In the transformer, each of the encoder and decoder layers contains a fully connected feedforward network, which is applied in the same way at each position separately as two linear transformations with a ReLU activation between them, which is represented by the Equation (2).
FFN ( x ) = max 0 , x W 1 + b 1 W 2 + b 2
Since the model has no hints about the order of sequences, positional coding adds numbers after the embedding layer to give importance to the order of words by using sine and cosine functions of different frequencies to represent their behavior.
P E ( p o s , 2 i ) = sin p o s / 10 , 000 2 i / d m o d e l P E ( p o s , 2 i + 1 ) = cos p o s / 10 , 000 2 i / d m o d e l
where p o s is the position, or the index of a word in a sentence, and i is the dimension of the matrix.
Finally, the “Add & Norm” layer helps the transformer to not forget the information from the previous step, thus helping learning during backpropagation. The decoder output goes through a dense layer according to the size of the vocabulary and applying the softmax function, thereby generating probabilities for each word.
One of the differentiators of BERT is the Masked Language Model (MLM) pretraining method. MLM masks some input tokens, thus replacing them with a token called [ MASK ] . It then attempts to predict these tokens using the context in which they are located. As a result, BERT generates a robust bidirectional language model, meaning it is capable of understanding both the preceding and following tokens. In addition to MLM, BERT performs a Next Sentence Prediction (NSP) procedure. In this procedure, BERT tries to predict whether a given sentence A is followed by a specific sentence B . Figure 8 shows the MLM and NSP tasks in BERT’s pretraining.
After pretraining, BERT undergoes a fine-tuning stage according to the task and data being worked on. In the text classification task, the [ CLS ] token represented as C in the output is used as a feature for sentence classification. This is achieved by adding a classification layer containing a softmax function with a cost function. As a result, the network’s parameters are adjusted to fit the problem [17].
The use of BERT is due to it being a pretrained model that can be adjusted for a sentiment score for each tweet, ranging from 0 as the most negative score to 1 as the most positive score. Table 3 contains a sample of tweets and their respective sentiments obtained by BERT.

3.3.2. Sentiment Aggregation

The imprecision in the process of attributing sentiments to texts, due to the nature of these data and the difficulty in establishing the degree of contribution of each element to the final sentiment, necessitates the use of an aggregating method capable of handling these characteristics. Given this fact, Hesitant Fuzzy Sets (HFSs) are fuzzy sets employed in situations where uncertainty among different values complicates determining the membership of an element to a specific set, as in decision-making problems [19]. Let X be a reference set; then, we have the definition of an HFS on X in terms of a function h that, when applied to X, returns a subset of [ 0 , 1 ] [19].
A variant of HFS, widely used in problems requiring an aggregation method, is the Hesitant Fuzzy Weighted Average (HFWA), which is defined by Equation (3) [20].
H F W A = 1 i = 1 n 1 x i w i
where n is the number of elements in the subset of [ 0 , 1 ] , and w i is the weight of each element x i , with i = 1 , 2 , , n .
To obtain the sentiments of the news, firstly, the sentiments of tweets, calculated by BERT, were aggregated daily, due to the emergence of different news on the same day, by applying the HFWA proposed by Xia and Xu [20]. Subsequently, this same aggregation technique was applied for the monthly sentiment aggregation so that they matched the periodicity of the monthly average prices of iron ore. Taking Equation (3) as a basis, when w = ( 1 / n , 1 / n , , 1 / n ) T , Equation (4) is obtained as a result, thus aggregating the sentiments present in the specified period and delivering a sentiment index with a numerical value also ranging between 0 and 1, with 0 being the value for the most negative sentiment and 1 for the most positive.
H F A = 1 i = 1 n 1 x i 1 n
where n is the number of elements in the subset of [ 0 , 1 ] , and i = 1 , 2 , , n . Table 4 shows how the aggregation of sentiments from tweets of the same period would appear.
The reason for using the same weights for tweets within the same monthly period is that they come from a single source. As the number of tweets reported in each month has a significant impact to the point of being considered as an exogenous variable of the system, there were variations in the weight of tweet sentiments from one month to the next.

3.4. Iron Ore Price Forecasting

FTS, as proposed by Song and Chissom [21], represent forecasting methods rooted in fuzzy set theory. These methods are distinguished by their flexible implementation, accommodating both numerical and non-numerical data, and have been applied to forecast variables in diverse knowledge domains, including the financial market [22]. According to Lima et al. [23], an FTS comprises the following main components:
  • Preprocessing: This initial step aims to diminish the presence of irrelevant or minor data within the forecasted time series dataset Y.
  • Partitioning: This involves dividing the universe of discourse U into k fuzzy sets to establish the linguistic variable A ˜ .
  • Fuzzification: This step generates the linguistic representation F of data Y based on the variable A ˜ .
  • Rule Extraction and Representation: Through this process, the knowledge model M identifies patterns within F by examining temporal patterns across a set number of lags Ω .
Forecasting is subsequently performed through the following stages:
  • Preprocessing: Necessary preprocessing is applied to the input sample y ( t ) .
  • Fuzzification: The linguistic representation F of data Y is derived from the variable A ˜ .
  • Inference: Utilizing elements of Ω from F, the model M estimates f ( t + 1 ) .
  • Defuzzification: The forecast f ( t + 1 ) is assigned a numerical value y ^ ( t + 1 ) .
  • Postprocessing: The forecasted output y ^ ( t + 1 ) may be subjected to additional data transformations.
Multivariate time series are represented as matrices Y R n , where n equals the size of the set of attributes V associated with Y. Each vector y ( t ) Y encapsulates all attributes V i V . A crucial aspect of these data points is their temporal dependency, thus necessitating that their sequence, denoted by the time index t T , is preserved.
Introduced by Silva et al. [24], the WMVFTS approach serves as a first-order point predictor within the Multiple Input/Single Output (MISO) framework. Within the set of variables V , one is selected as the target endogenous variable, marked as V , while the remaining variables are categorized as exogenous explanatory variables.
The model construction involves a three-phase training procedure leading to the establishment of a weighted multivariate FTS model, M . This ultimate WMVFTS model M is composed of the variable set V , a fuzzy linguistic variable V ˜ i for each V i V , and an assortment of weighted fuzzy rules concerning V ˜ i . Inputs for this training process include the time series data Y and a set of hyperparameters designated for each V i V .
The forecasting process endeavors to generate a point estimate y ^ ( t + 1 ) for the target variable V , thus employing the input sample Y, linguistic variables V ˜ i , and the fuzzy rules derived within model M .
A hallmark of the WMVFTS method is its deterministic nature, thus guaranteeing consistent forecasts for identical sets of input data and hyperparameters and ensuring a reproducibility not typically found in neural network models. The selection of hyperparameters, specifically k i and α i , significantly influences the model’s accuracy and conciseness. The partition count for each variable directly affects the rule count within the model, as the maximal rule count equates to the Cartesian product of the fuzzy sets A j V i V ˜ i for each V i V .
In this study, we utilized historical values of the monthly average price of iron ore from Market Index (https://www.marketindex.com.au/iron-ore, accessed on 25 April 2024), along with the aggregated sentiment index and the monthly tweet volume, to forecast iron ore prices using the WMVFTS methodology. The series of the monthly average iron ore prices, the aggregated sentiment series, and the monthly tweet count were treated as exogenous variables. The monthly average price series of iron ore served as the endogenous variable.
Within the WMVFTS framework, each variable undergoes partitioning into fuzzy sets, which are empirically determined through the hyperparameter optimization process. This process yielded an optimal partitioning of 40 for the monthly average iron ore price, 10 for the aggregated sentiment index, and 15 for the monthly tweet volume.

4. Performance Evaluation

This section will detail the proposed experiment, following the methodology described in the previous section, and present the obtained results. Initially, a step-by-step description of the experiment is provided, thus outlining the data preprocessing of Twitter data for sentiment analysis and the parameters used in this analysis. Subsequently, the method of aggregating the sentiments extracted from tweets, which resulted in the index applied as input to the predictive model, is presented. The predictive model is then described, along with its configuration variations. Finally, the results are presented, discussed, and compared with other studies.

4.1. Experiment Setup

The codes (Available at https://github.com/flaviomcs/wmvfts_minerio, accessed on 25 April 2024) for the algorithms used in this project were developed in Python, thus leveraging the various libraries and tools dedicated to computational intelligence and time series forecasting available for such purposes.
For the sentiment analysis algorithms experiments, the preprocessing applied to this data involved removing special characters, links, and numbers from the text. In addition to the textual information, only the temporal information from the posts was retained and utilized. Cases of missing data were addressed, which were observed in months when no tweets were published with the predetermined filters. In these cases, considering that this fact indicates a sentiment neutrality, an aggregated sentiment value of 0.5 was inserted, since the most negative sentiment is valued at 0.0 and the most positive at 1.0. The result of this treatment was 79 aggregated sentiment data points and the number of tweets for the months included in the previously mentioned period.
The experiments proceeded to the predictive part with the modeling of the WMVFTS, thereby using as input variables the real price series of iron ore, the index of aggregated sentiments on a monthly basis, and the monthly count of tweets. This modeling utilized the PyFTS library (https://github.com/PYFTS, accessed on 25 April 2024).
The descriptive statistics of the dataset of these variables are displayed in Table 5.
Variations of this set of input variables were executed, considering the results for the set that combines all three variables (identified as WMVFTS (P + S + C)), for the combination of the price series with aggregated sentiments (identified as WMVFTS (P + S)), and for the combination of the price series with the monthly count of tweets (identified as WMVFTS (P + C)).
Following the forecasting phase, we conducted a comparative accuracy analysis between this model and existing models in the literature for iron ore price prediction. As most studies mentioned in Section 2 utilized the Root Mean Square Error (RMSE) and Mean Absolute Percentage Error (MAPE) as performance evaluation metrics, these were also adopted in our study to ease comparisons.
The RMSE metric quantifies the average error in the same unit as the iron ore price, while the MAPE indicates an average percentage error of the data. Additionally, we computed the Mean Directional Accuracy (MDA), thus assessing the percentage of correctly predicted upward or downward trends of the forecasted variable.
The RMSE and MAPE are calculated as follows:
RMSE = 1 n j = 1 n y j y ^ j 2
MAPE = 1 n j = 1 n y j y ^ j y j × 100 %
where y j represents the actual series value at the jth instance, and y ^ j is the corresponding predicted value for a series of length n.
The MDA is determined by the following equation:
1 N t 1 sgn A t A t 1 = sgn F t A t 1
where A t is the actual value at time t, F t is the forecasted value at time t, and N denotes the number of forecast points. The function sgn ( · ) represents the sign function, and 1 is the indicator function.

4.2. Impact of the Obtained Results

For the three sets of input variables, we divided the dataset by allocating 90% for training and the remaining 10% for testing the proposed model. This division was strategically chosen to optimize the learning process while retaining a substantial subset for an accurate evaluation of the model’s predictive capabilities. The outcomes of the tests are presented in Figure 9 and Table 6, which display the statistical results of the forecasts for a period of 7 months using the dataset. These results reveal that the model incorporating all three variables (Price, Sentiment, and Count), denoted as WMVFTS (P + S + C), achieved the best performance in terms of the RMSE and MAPE, thus suggesting that a more comprehensive set of input variables can enhance the model’s forecasting accuracy. Conversely, as the sets of input variables were streamlined, a slight decrease in predictive performance was observed, as evidenced by the comparative results of WMVFTS (P + S) and WMVFTS (P + C). Despite these variations, all models demonstrated perfect directional accuracy, as reflected by the MDA score of 1.0 across all configurations.
To validate the model, we employed the rolling window method as executed by Tonidandel Jr. and Guimarães [16]. This technique involves segmenting the dataset into 23 subsets, with each progressing one month forward after every forecasting iteration. The testing data for each subset are aimed at generating forecasts for the final three months, thus providing a rigorous evaluation framework that closely mimics real-world forecasting scenarios. This approach not only enhances the robustness of the model validation but also offers insights into the model’s performance over different time horizons and under varying market conditions.
The statistical results derived from applying this validation method with the rolling window subsets are presented in Table 7. The WMVFTS (P + S + C) model, which integrates Price, Sentiment, and Count variables, demonstrates superior forecasting precision and directional accuracy, as evidenced by its lower RMSE and MAPE values, alongside a high MDA score. In contrast, models WMVFTS (P + S) and WMVFTS (P + C), despite showing valuable predictive capabilities, exhibited a relative decrease in accuracy and, for WMVFTS (P + S), in directional accuracy as well. These findings underscore the significance of incorporating a comprehensive set of variables for enhancing forecast performance.
The analytical evaluation of our model’s performance on 3-month forecasts, using sliding window sets and illustrated by the RMSE and MAPE outcomes, provides a comprehensive understanding of its behavior under various conditions. The RMSE results, as detailed in Figure 10, are crucial for assessing the predictive accuracy across different input configurations, including combinations of Price, Sentiment, and Count (P + S + C); Price and Sentiment (P + S); and Price and Count (P + C). The analysis of the RMSE across 23 windows emphasizes the model’s stability and reliability, with the minimum values reaching 0.00, thus indicating the potential for highly accurate predictions. The variability in performance, further elucidated by median values—1.53 for (P + S + C), 3.59 for (P + S), and 3.64 for (P + C)—alongside the maximum and interquartile range (IQR), highlights how each model configuration addresses forecasting challenges and the impact of incorporating various data dimensions on predictive accuracy.
Complementarily, the MAPE results, presented in Figure 11, provide an overview of the model’s predictive precision across various configurations. Notably, the (P + S + C) configuration achieved the lowest MAPE values, thus demonstrating superior precision compared to the (P + S) and (P + C) configurations. The range of MAPE values across the 23 windows, with minimums at 0.00 for all models, showcases the capacity for perfect predictions in specific scenarios. The median MAPE values—1.09 for (P + S + C), 2.89 for (P + S), and 2.43 for (P + C)—along with the maximum values and IQR, highlight the forecasting approach’s variability and reliability across different input variable combinations. This detailed statistical analysis underlines the importance of selecting suitable input variables to enhance forecasting accuracy, thus providing a nuanced understanding of the model’s performance dynamics.
To assess the statistical significance of these results, the Friedman test was applied, where the null hypothesis (H0) posits that all groups have the same probability distribution, and the alternative hypothesis (H1) suggests that there is a statistically significant difference between the distributions. With a significance level of 0.05, the test statistic q = 10.0000 and a p-value of 0.0068 were obtained, thus leading to the rejection of H0 and confirming that the probability distributions of the results have significant differences.
Drawing upon the work of Tonidandel Jr. and Guimarães [16], which focuses on similar forecasting within the same time series, we can visually compare and analyze the descriptive statistics—RMSE and MAPE—of their multivariate models (identified as FDTFTS_ID3, FDTFTS_CART, and FDTFTS_RF) with the results of this study, as shown in Table 8 and Table 9.
Upon analyzing Table 8 and Table 9, it is evident that the method proposed in this study, across all input variable configurations—(P + S + C), (P + S), and (P + C)—in the WMVFTS outperformed the multivariate methods—FDTFTS_ID3, FDTFTS_CART, and FDTFTS_RF—referenced in all metrics. This indicates superior accuracy in forecasting iron ore prices in the time series analyzed.

5. Conclusions and Future Works

Given the objectives set forth in the introduction, this study aimed to evaluate the application of alternative variables as exogenous inputs within a predictive model based on fuzzy time series with the goal of enhancing robustness compared to existing methods in the literature for forecasting iron ore prices. To this end, an index was constructed through the hesitant fuzzy aggregation of sentiments extracted from news articles related to iron ore, and the volume of news was considered as a variable.
The findings of this research demonstrate the feasibility and positive impact of using an index constructed from aggregated sentiments derived from iron ore-related news for price forecasting, as well as incorporating news volume.
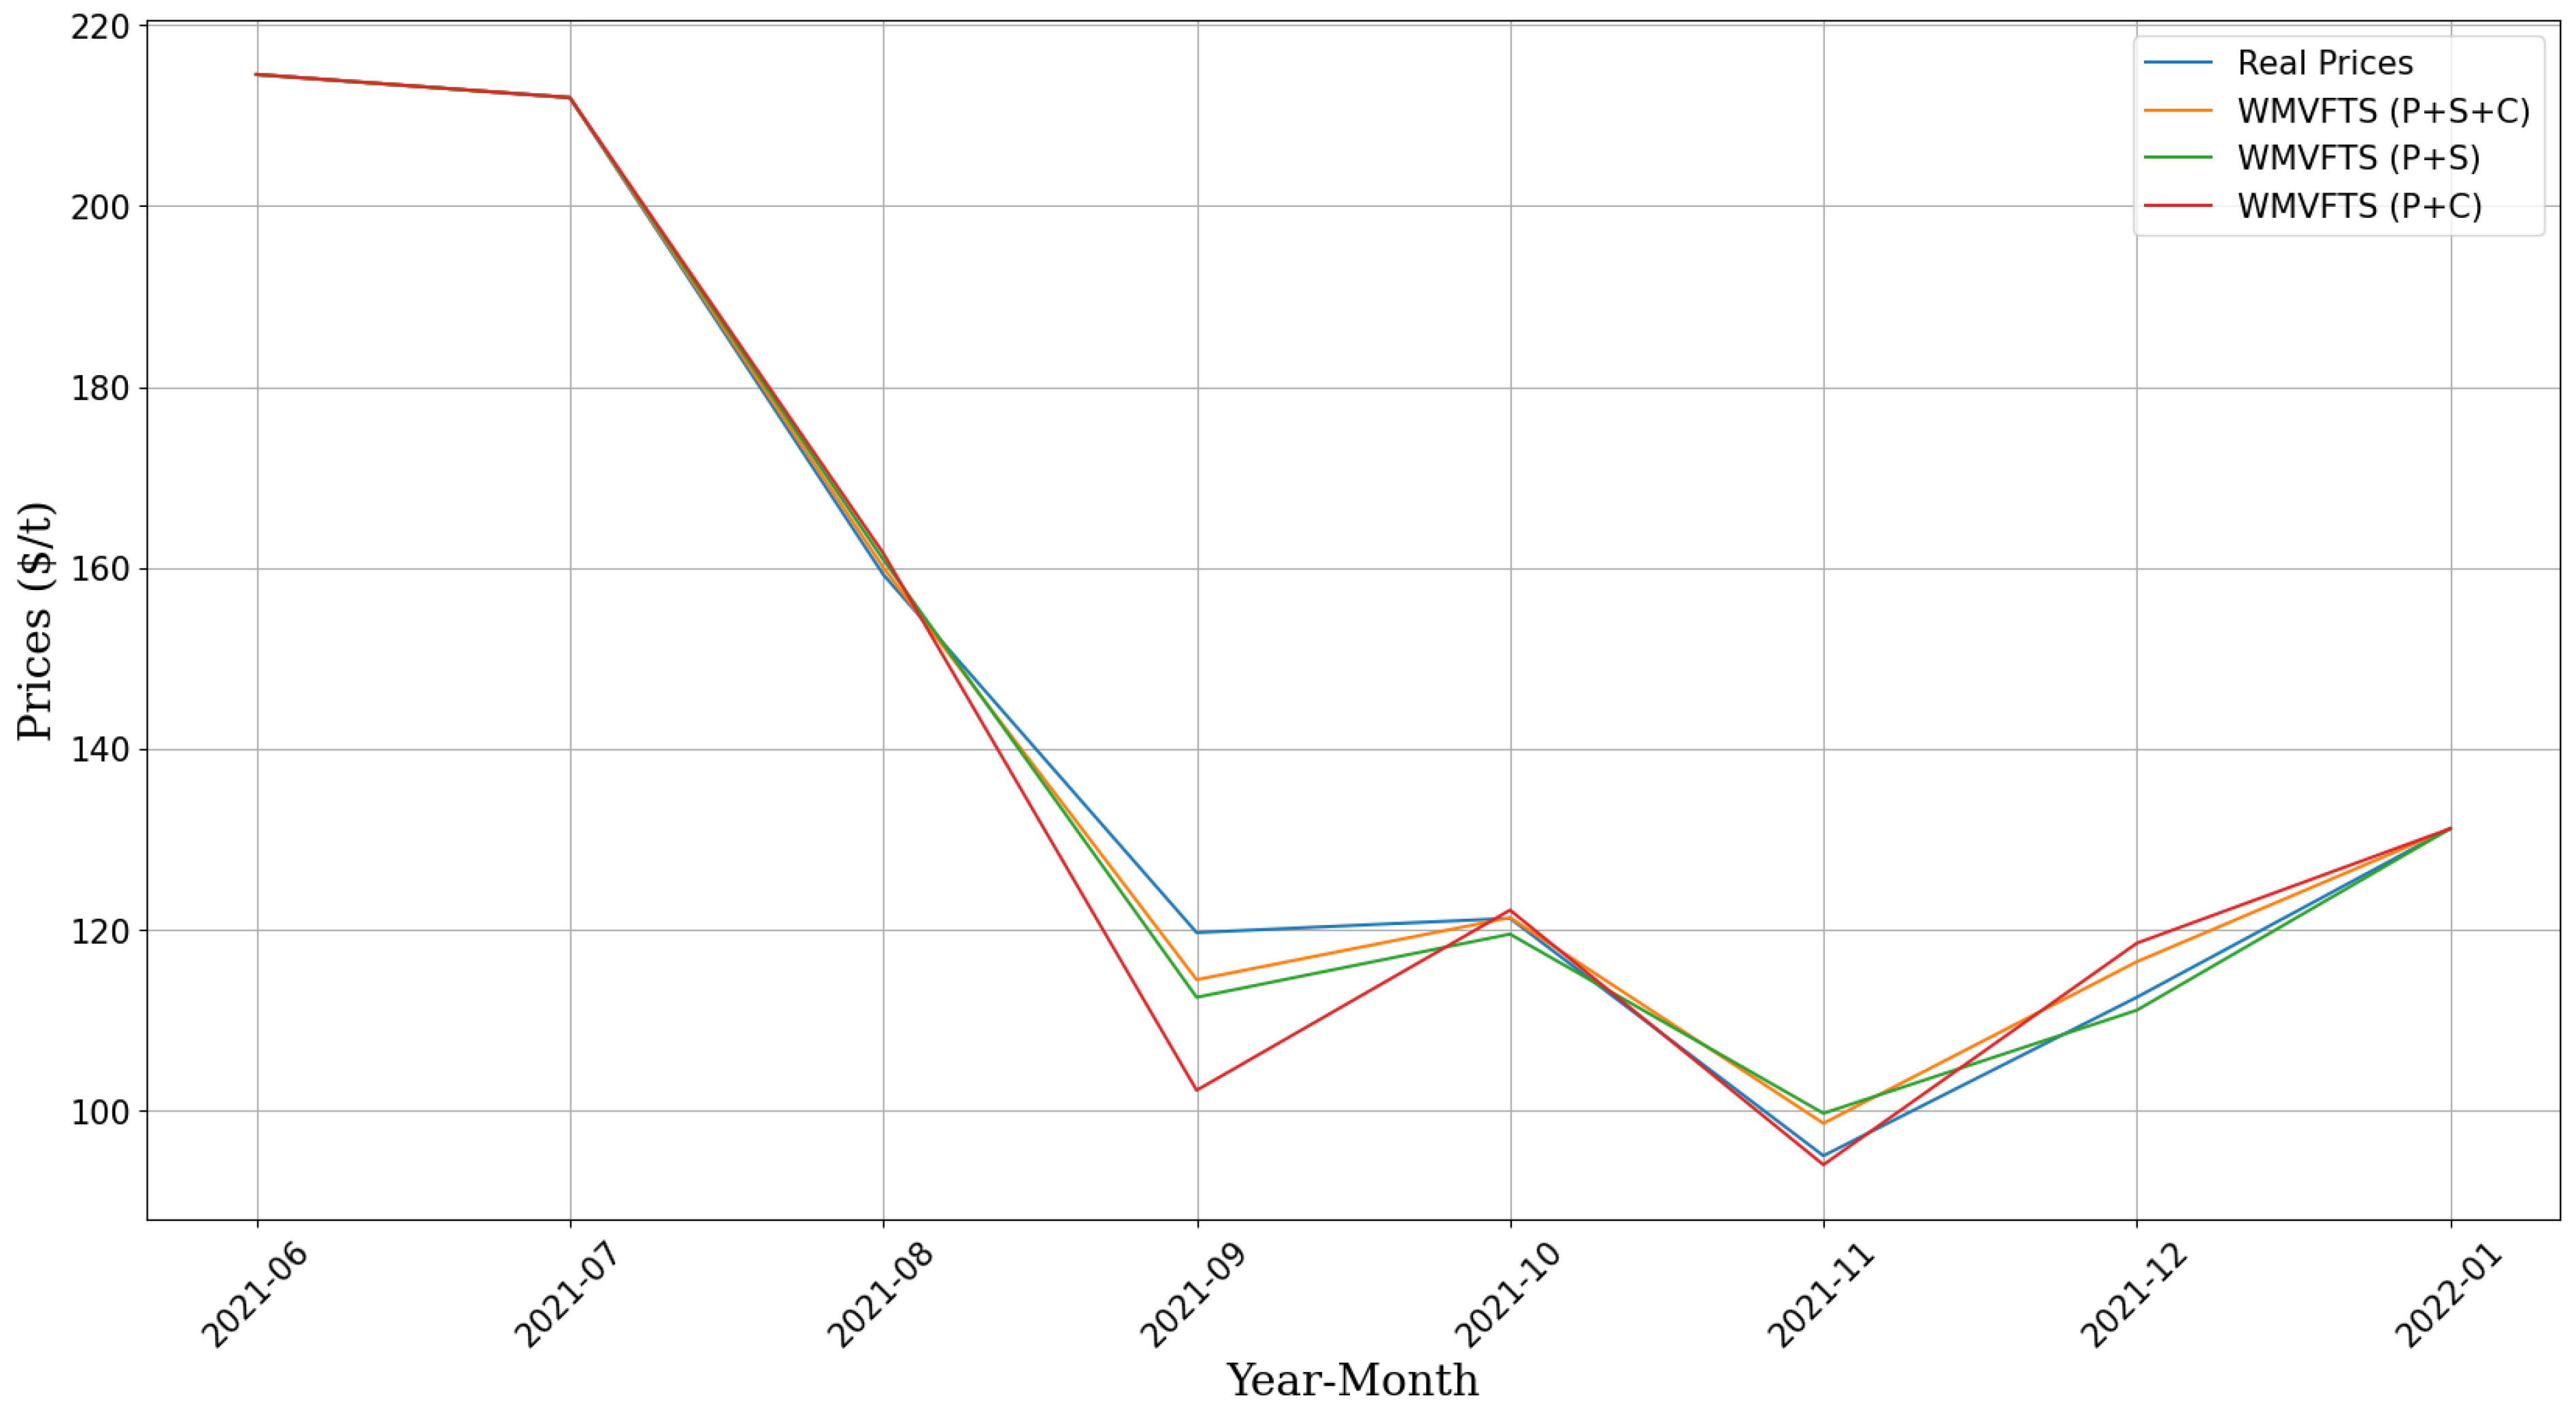
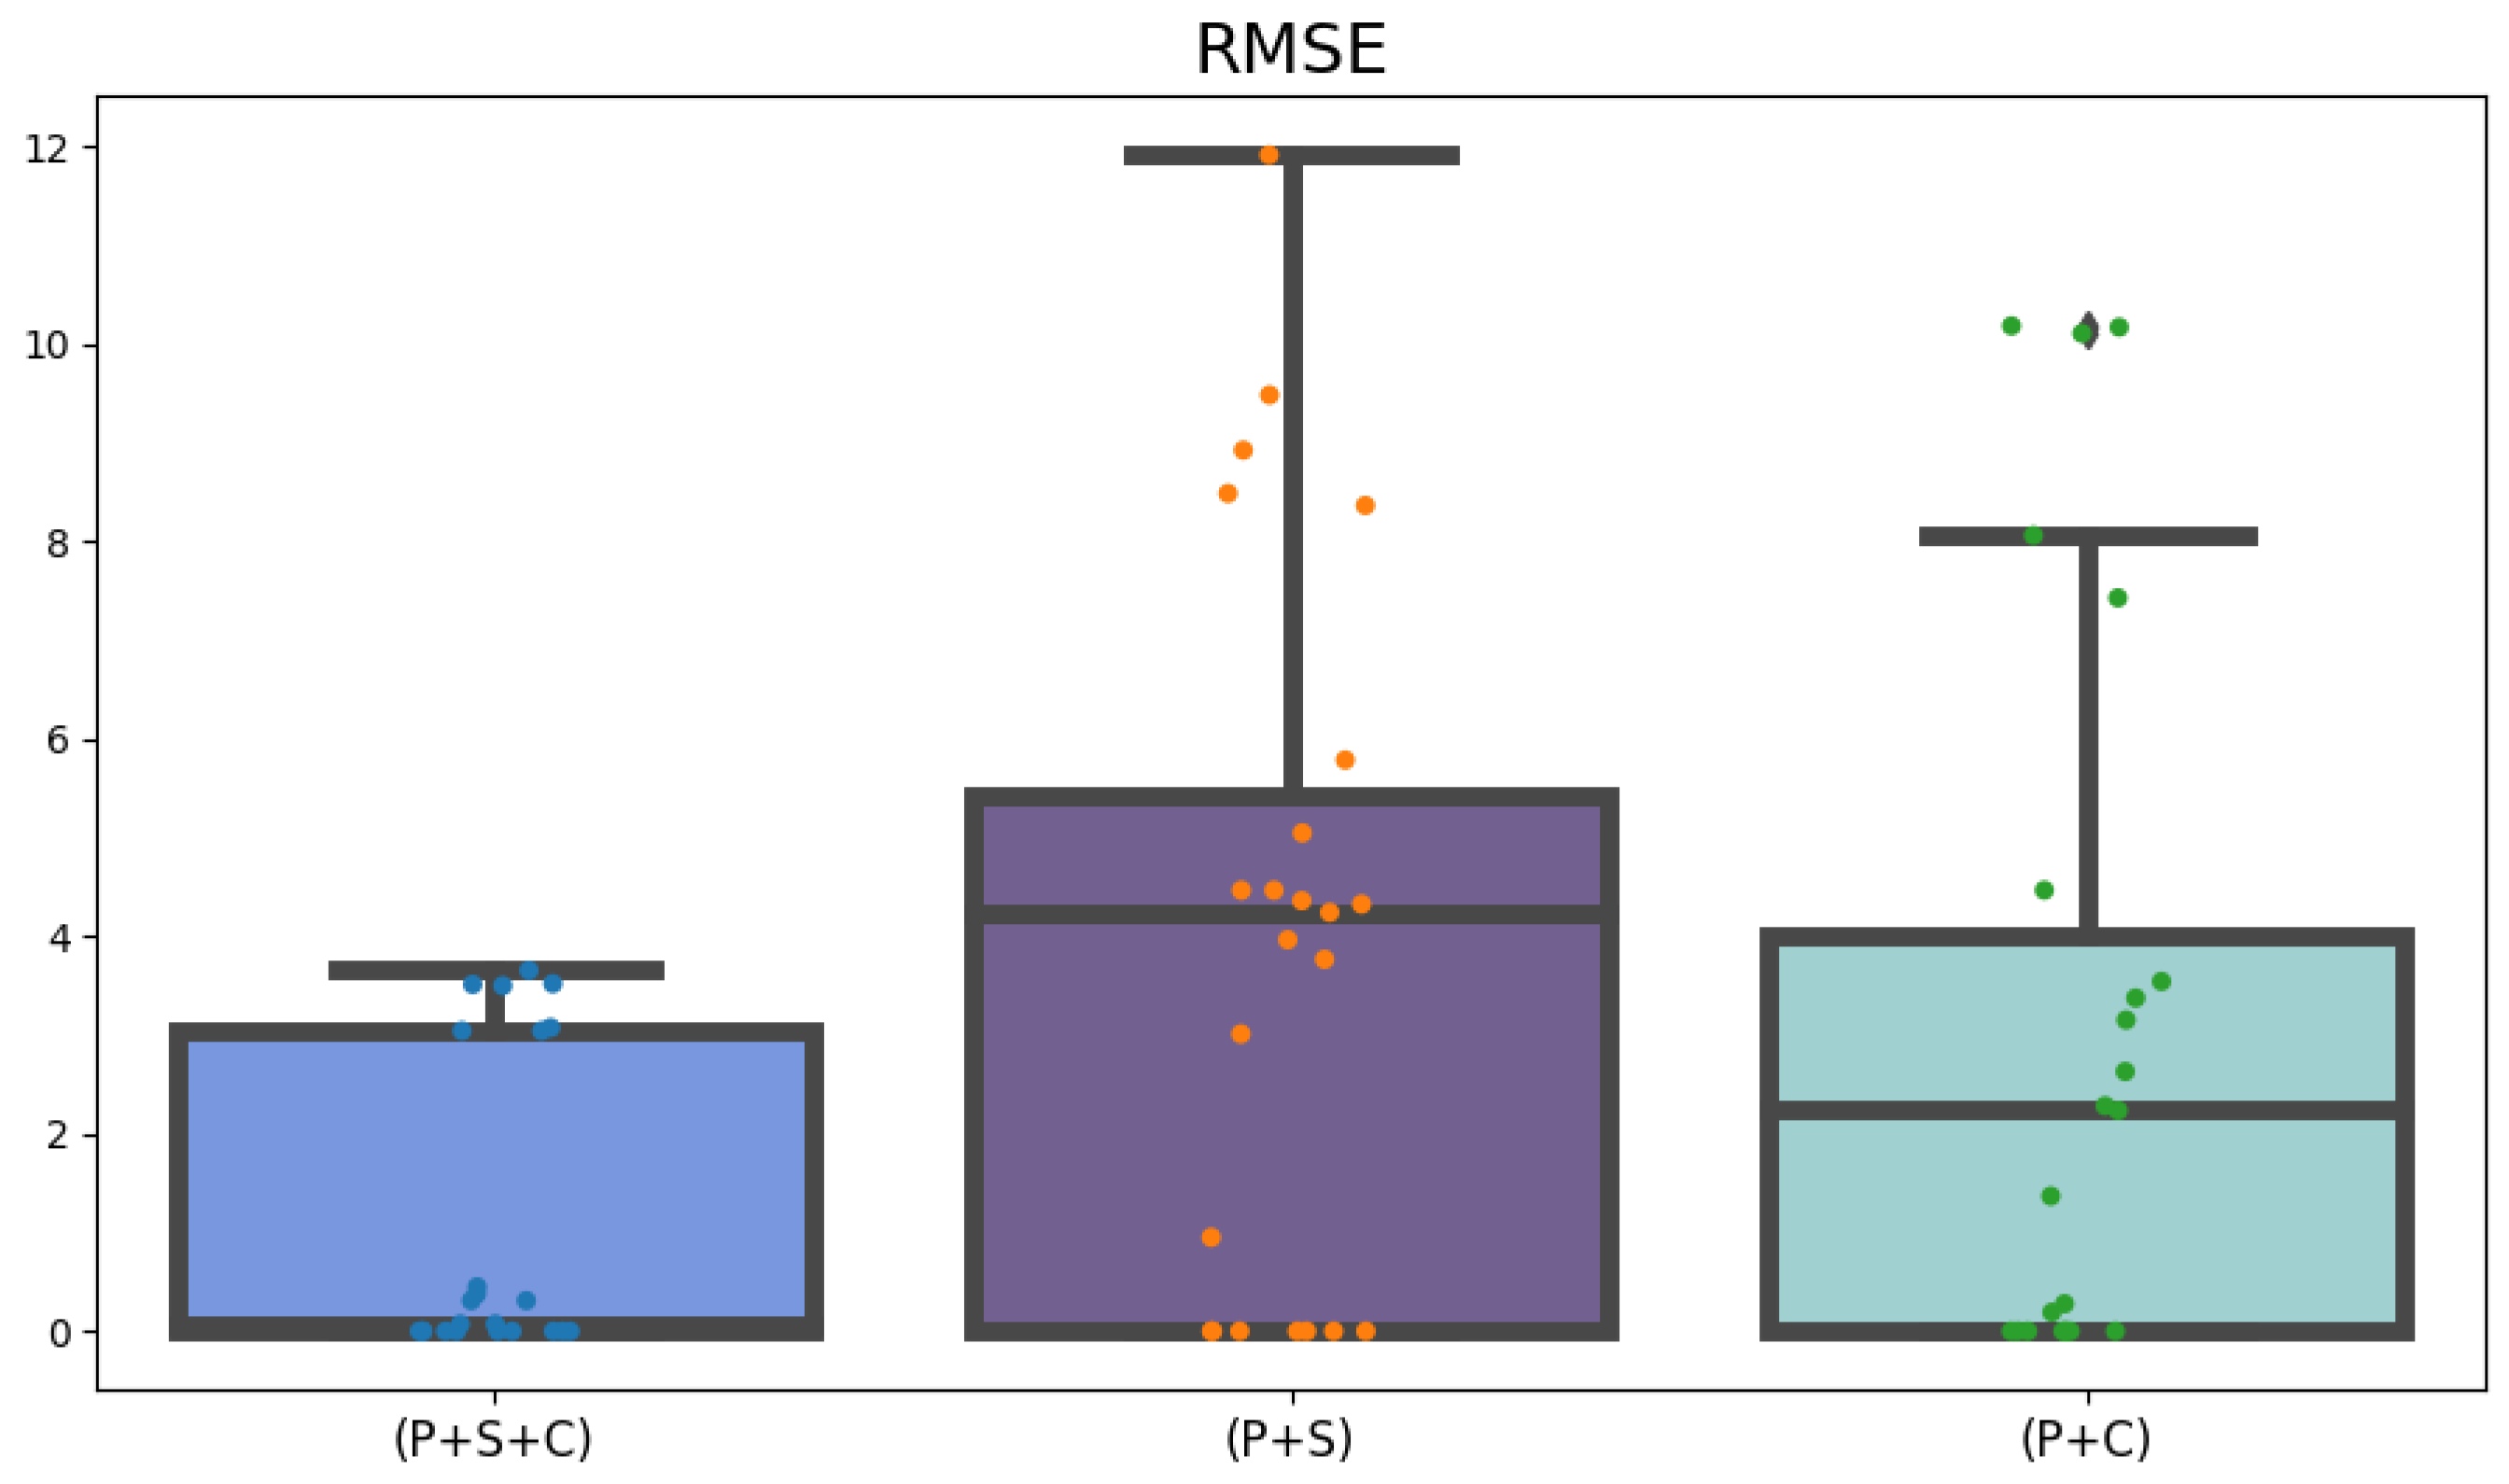
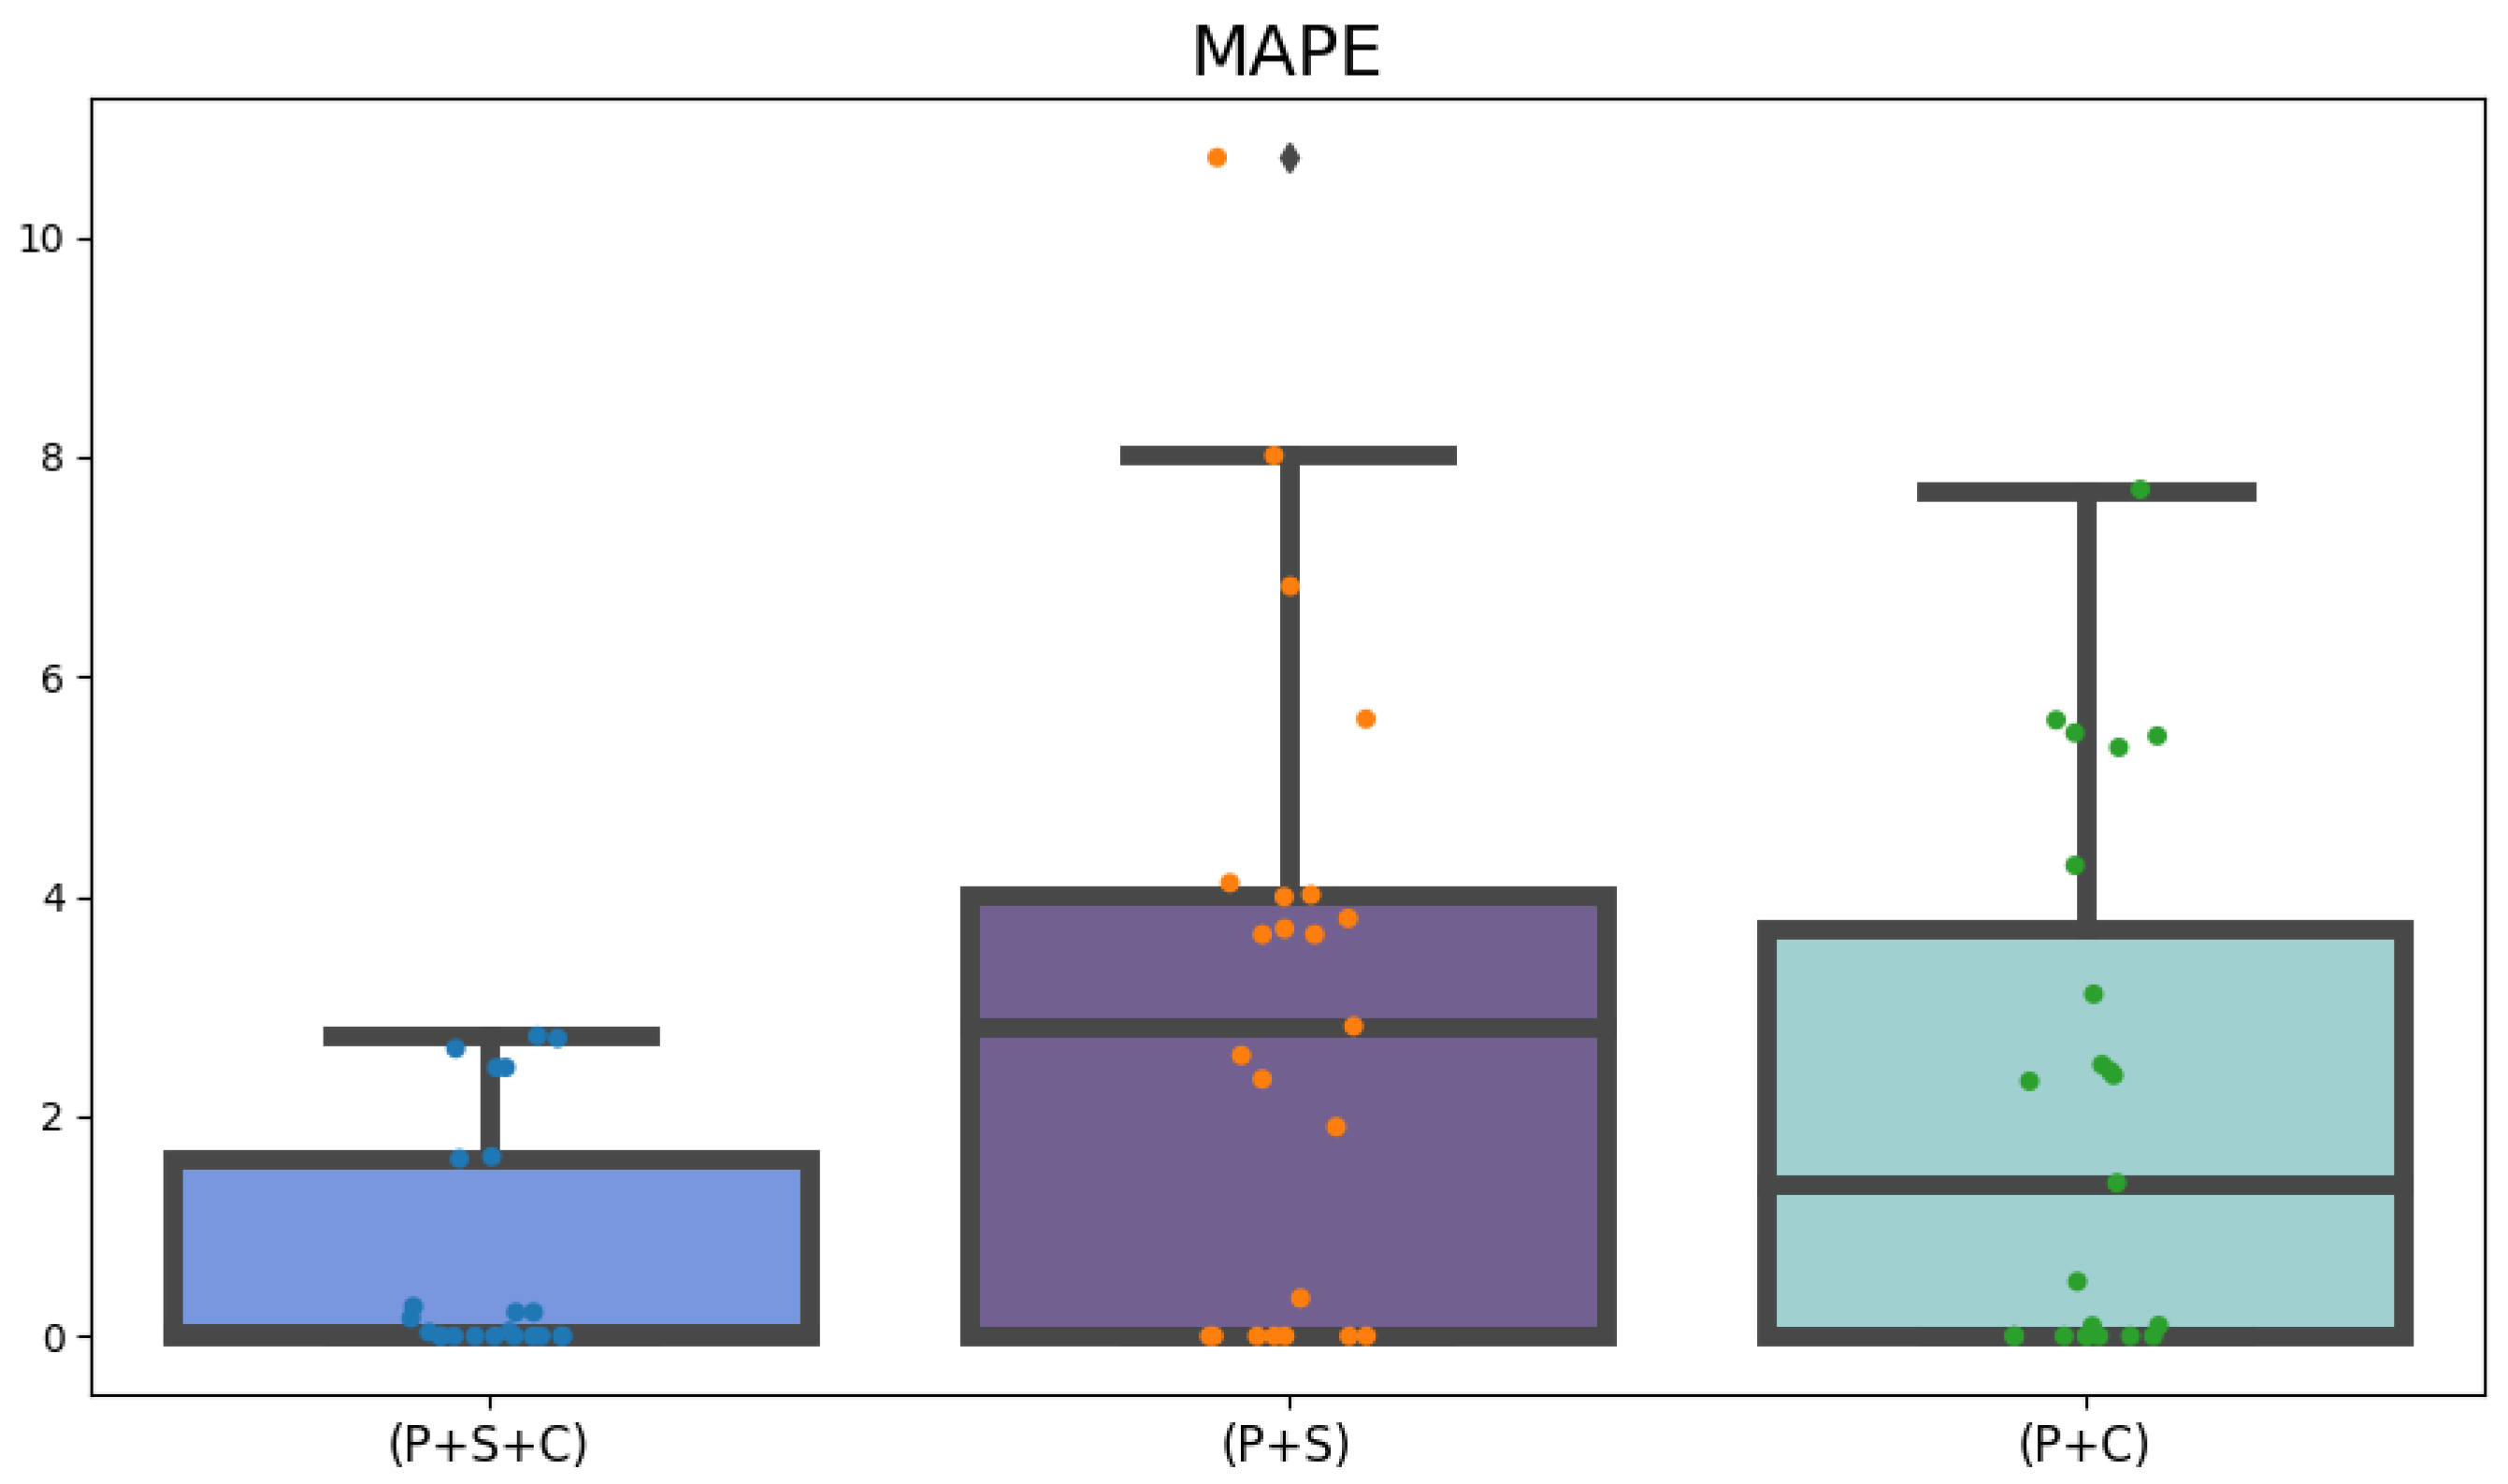
The proposed approach, utilizing the WMVFTS for data analysis, showed improved outcomes when the input dataset included all correlated variables. This predictive method also proved to be superior to the multivariate approaches referenced, as evidenced by descriptive statistical analyses of the RMSE and MAPE. From a planning perspective and aiding analysts in decision making regarding future iron ore prices, the analysis of the MDA metric, with an accuracy above 80% in all tests, suggests that the model presented in this study is promising and reliable for forecasting, especially short- to medium-term trends and fluctuations of the variable of interest.
Throughout the research, some challenges were encountered, and the results had limitations. Identifying an unbiased news source compatible with the BERT parameters for delivering coherent sentiment analysis proved challenging. News articles that influence the rise in iron ore prices may be perceived positively by mining companies but negatively by steel manufacturers. The same news can have different connotations depending on the market sector to which the publishing media are aligned.
Employing a sentiment analysis model trained on a dataset with labeled sentiments from textual sources specialized in the iron ore market and aimed at the relevant segment, mining, or steel manufacturing is likely to enhance the outcomes of this study. However, building such a dataset would require significant effort, as it would necessitate the manual labeling by experts of a large number of news articles impacting the iron ore market in some manner.
Suggestions for future works that build upon this study to refine the employed methodology include several key areas of focus. First, incorporating additional variables that may correlate with the iron ore price series into the predictive model could significantly improve its accuracy. Furthermore, exploring other textual information sources about iron ore and correlated variables, such as reports and specialized articles, could enhance sentiment extraction processes. There is also potential in enhancing the model with modules for automatic decision making that utilize deep learning techniques, with a subsequent comparison of their decisions against those made by human experts. Lastly, applying the methodology proposed in this study to forecast other types of variables could broaden the scope and utility of the research findings.

Author Contributions

Conceptualization, F.M.d.C.S.; methodology, F.M.d.C.S.; validation, F.M.d.C.S., G.P.R.F. and G.P.; resources, F.M.d.C.S.; writing—original draft preparation, F.M.d.C.S., G.P.R.F., F.G.G., R.I.M. and G.P.; writing—review and editing, F.M.d.C.S., G.P.R.F., F.G.G., R.I.M. and G.P. All authors have read and agreed to the published version of the manuscript.

Funding

This research received no external funding.

Informed Consent Statement

Not applicable.

Data Availability Statement

The raw data supporting the conclusions of this article will be made available by the authors on request.

Conflicts of Interest

The authors declare no conflicts of interest.

References

  1. Mendes, J.A. O ferro na história: Das artes mecânicas às Belas-Artes. Gestáo Desenvolv. 2000, 9, 301–318. [Google Scholar] [CrossRef]
  2. Li, D.; Moghaddam, M.R.; Monjezi, M.; Jahed Armaghani, D.; Mehrdanesh, A. Development of a Group Method of Data Handling Technique to Forecast Iron Ore Price. Appl. Sci. 2020, 10, 2364. [Google Scholar] [CrossRef]
  3. Tuo, J.; Zhang, F. Modelling the iron ore price index: A new perspective from a hybrid data reconstructed EEMD-GORU model. J. Manag. Sci. Eng. 2020, 5, 212–225. [Google Scholar] [CrossRef]
  4. Market Index. FAQs. Market Index. 2022. Available online: https://www.marketindex.com.au/ (accessed on 25 April 2024).
  5. Arias, M.; Arratia, A.; Xuriguera, R. Forecasting with twitter data. ACM Trans. Intell. Syst. Technol. (TIST) 2014, 5, 1–24. [Google Scholar] [CrossRef]
  6. Nobre, R.A.; Nascimento, K.C.d.; Vargas, P.A.; Valejo, A.D.B.; Pessin, G.; Villas, L.A.; Filho, G.P.R. AURORA: An autonomous agent-oriented hybrid trading service. Neural Comput. Appl. 2022, 34, 1–16. [Google Scholar] [CrossRef]
  7. Ewees, A.A.; Elaziz, M.A.; Alameer, Z.; Ye, H.; Jianhua, Z. Improving multilayer perceptron neural network using chaotic grasshopper optimization algorithm to forecast iron ore price volatility. Resour. Policy 2020, 65, 101555. [Google Scholar] [CrossRef]
  8. Jowitt, S.M. COVID-19 and the global mining industry. SEG Discov. 2020, 122, 33–41. [Google Scholar] [CrossRef]
  9. Ma, Y.; Wang, J. Time-varying spillovers and dependencies between iron ore, scrap steel, carbon emission, seaborne transportation, and China’s steel stock prices. Res. Policy 2021, 74, 102254. [Google Scholar] [CrossRef]
  10. Keenan, M.J.S. Advanced Positioning, Flow, and Sentiment Analysis in Commodity Markets: Bridging Fundamental and Technical Analysis; Wiley: Hoboken, NJ, USA, 2019. [Google Scholar]
  11. Alves, D.S. Uso de Técnicas de Computação Social para Tomada de Decisão de Compra e Venda de Ações no Mercado Brasileiro de Bolsa de Valores. Ph.D. Thesis, Departamento de Engenharia Elétrica, Faculdade de Tecnologia, Universidade de Brasília, Brasília, DF, Brazil, 2015; 133p. [Google Scholar]
  12. Igarashi, W.; Valdevieso, G.S.; Igarashi, D.C.C. Análise de sentimentos e indicadores técnicos: Uma análise da correlação dos preços de ativos com a polaridade de notícias do mercado de ações. Braz. J. Bus. 2020, 3, 470–486. [Google Scholar] [CrossRef]
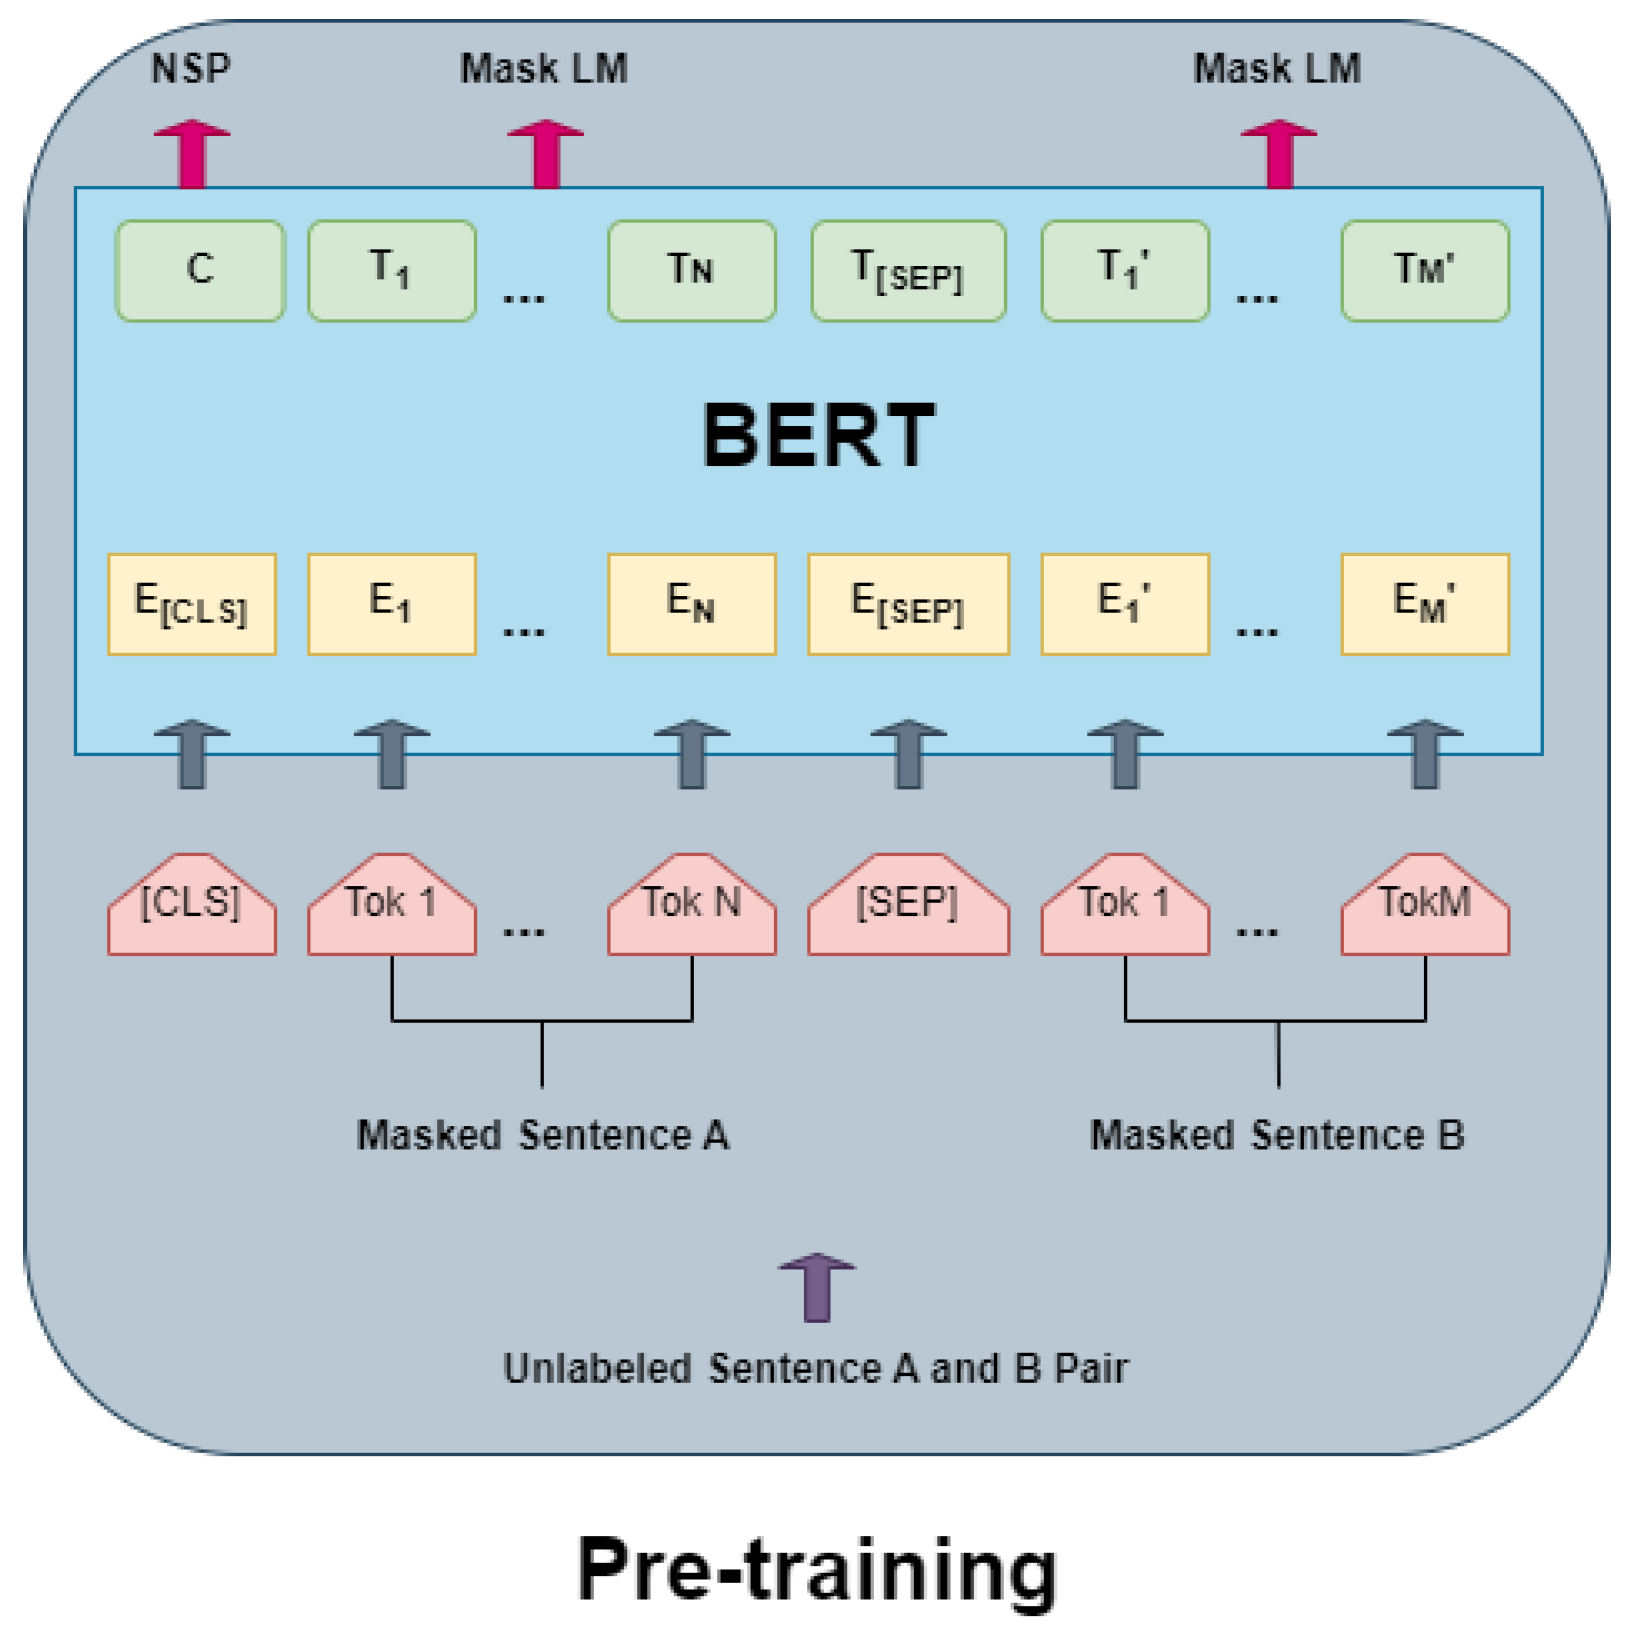
  13. Sousa, M.G.; Sakiyama, K.; de Souza Rodrigues, L.; Moraes, P.H.; Fernandes, E.R.; Matsubara, E.T. BERT for stock market sentiment analysis. In Proceedings of the 2019 IEEE 31st International Conference on Tools with Artificial Intelligence (ICTAI), Portland, OR, USA, 4–6 November 2019; pp. 1597–1601. [Google Scholar]
  14. Dolabela Dias, B.C.; Sadaei, H.J.; De Lima e Silva, P.C.; Guimarães, F.G. Aggregation of Sentiment Analysis Index with Hesitant Fuzzy Sets for Financial Time Series Forecasting. In Proceedings of the 2021 IEEE World AI IoT Congress (AIIoT), Virtual, 10–13 May 2021; pp. 433–439. [Google Scholar] [CrossRef]
  15. Li, W.; Huang, S.; Qi, Y.; Haizhong, A. Rdeu Hawk-Dove Game Analysis of the China-Australia Iron Ore Trade Conflict. Resour. Policy 2022, 77, 102643. [Google Scholar] [CrossRef]
  16. Tonidandel, H., Jr.; Guimarães, F.G. Aplicação de Modelos Nebulosos Univariados e Multivariados na Previsão de Preços de Minério De Ferro: Um Estudo Comparativo. In Proceedings of the Congresso Brasileiro de Automática-CBA: 2022, Fortaleza, Brazil, 16–19 October 2022. [Google Scholar]
  17. Devlin, J.; Chang, M.W.; Lee, K.; Toutanova, K. Bert: Pre-training of deep bidirectional transformers for language understanding. arXiv 2018, arXiv:1810.04805. [Google Scholar]
  18. Vaswani, A.; Shazeer, N.; Parmar, N.; Uszkoreit, J.; Jones, L.; Gomez, A.N.; Kaiser, Ł.; Polosukhin, I. Attention is all you need. In Proceedings of the Advances in Neural Information Processing Systems 30: Annual Conference on Neural Information Processing Systems 2017, Long Beach, CA, USA, 4–9 December 2017. [Google Scholar]
  19. Torra, V. Hesitant fuzzy sets. Int. J. Intell. Syst. 2010, 25, 529–539. [Google Scholar] [CrossRef]
  20. Xia, M.; Xu, Z. Hesitant fuzzy information aggregation in decision making. Int. J. Approx. Reason. 2011, 52, 395–407. [Google Scholar] [CrossRef]
  21. Song, Q.; Chissom, B.S. Fuzzy time series and its models. Fuzzy Sets Syst. 1993, 54, 269–277. [Google Scholar] [CrossRef]
  22. Cheng, C.H.; Chen, C.H. Fuzzy time series model based on weighted association rule for financial market forecasting. Expert Syst. 2018, 35, e12271. [Google Scholar] [CrossRef]
  23. de Lima, P.C. Scalable Models for Probabilistic Forecasting with Fuzzy Time Series. 2019. Available online: https://repositorio.ufmg.br/bitstream/1843/30040/1/Final_Thesis.pdf (accessed on 17 March 2024).
  24. Silva, P.C.; e Lucas, P.d.O.; Sadaei, H.J.; Guimaraes, F.G. Distributed evolutionary hyperparameter optimization for fuzzy time series. IEEE Trans. Netw. Serv. Manag. 2020, 17, 1309–1321. [Google Scholar] [CrossRef]
Figure 1. Flowchart of the methodology proposal. Source: the authors.
Information 15 00251 g001
Figure 2. Real iron ore prices. Source: the authors.
Information 15 00251 g002
Figure 3. Aggregated sentiment. Source: the authors.
Information 15 00251 g003
Figure 4. Number of tweets. Source: the authors.
Information 15 00251 g004
Figure 5. Transformer architecture. Source: Adaptaded from Vaswani et al. [18].
Information 15 00251 g005
Figure 6. Scale product attention. Source: Adaptaded from Vaswani et al. [18].
Information 15 00251 g006
Figure 7. Multihead attention. Source: Adaptaded from Vaswani et al. [18].
Information 15 00251 g007
Figure 8. BERT pretraining. Source: Adaptaded from Devlin et al. [17].
Information 15 00251 g008
Figure 9. Forecasts for 7 months using the complete dataset. Source: the authors.
Information 15 00251 g009
Figure 10. Boxplots of RMSE from the experiments. Source: the authors.
Information 15 00251 g010
Figure 11. Boxplots of MAPE from the experiments. Source: the authors.
Information 15 00251 g011
Table 1. Comparison of related works.
WorkNLP Hybrid System Iron Ore
[12]
[13]
[14]
[7]
[3]
[15]
[16]
Proposed Solution
Source: the authors.
Table 2. Sample of collected tweets.
DataTweet
25 July 2019The mining industry is starting to split on who bears responsibility for all the carbon emissions caused by smeltin
25 July 2019Anglo American plans to buy back up to billion of shares after the diversified miner reaped bumper profits from
20 July 2019Vale’s second quarter production due next week may offer clues on an end to shortages
19 July 2019BHP forecasts iron ore production will rise as much as this fiscal year after output slumped to a first annual d
12 July 2019Forget about oil bonds and tech. This tiny ETF has gained more than so far in July
12 July 2019The world s largest mining company says it could build more iron ore mines over the next to years in nort
Source: the authors.
Table 3. Tweets and sentiments analyzed by BERT.
TweetSentiment BERT
The mining industry is starting to split on who bears responsibility for all the carbon emissions caused by smeltin0.30201486
Anglo American plans to buy back up to billion of shares after the diversified miner reaped bumper profits from0.61859
Vale’s second quarter production due next week may offer clues on an end to shortages0.19472954
BHP forecasts iron ore production will rise as much as this fiscal year after output slumped to a first annual d0.33379474
Forget about oil bonds and tech. This tiny ETF has gained more than so far in July0.20920986
The world s largest mining company says it could build more iron ore mines over the next to years in nort0.35044497
Source: the authors.
Table 4. Sentiment aggregation.
DataTweetBERT SentimentAggregated Sentiment
July 2019The mining industry is starting to split on who bears responsibility for all the carbon emissions caused by smeltin0.302014860.35299
Anglo American plans to buy back up to billion of shares after the diversified miner reaped bumper profits from0.61859
Vale’s second quarter production due next week may offer clues on an end to shortages0.19472954
BHP forecasts iron ore production will rise as much as this fiscal year after output slumped to a first annual0.33379474
Forget about oil bonds and tech. This tiny ETF has gained more than so far in July0.20920986
The world s largest mining company says it could build more iron ore mines over the next to years in nort0.35044497
Source: the authors.
Table 5. Dataset’s descriptive statistics.
 Number of TweetsAggregated SentimentReal Iron Ore Prices
Count79.00000079.00000079.000000
Mean6.3797470.25467490.302152
Std5.1894960.16502939.877650
Min0.0000000.01023041.500000
25%2.0000000.12936364.750000
50%6.0000000.23328481.350000
75%9.0000000.335585104.200000
Max23.0000000.846314214.550000
Source: the authors.
Table 6. Statistical results of the forecasts for 7 months using the complete dataset.
ModelRMSEMAPEMDA
WMVFTS (P + S + C)28.2117.861.0
WMVFTS (P + S)28.6218.361.0
WMVFTS (P + C)29.6519.981.0
Source: the authors.
Table 7. Statistical results of the 3-month forecasts using rolling window sets.
ModelAverage RMSEAverage MAPEAverage MDA
WMVFTS (P + S + C)1.080.740.96
WMVFTS (P + S)3.982.960.8
WMVFTS (P + C)3.022.120.96
Source: the authors.
Table 8. Comparative table of RMSE results with the reference.
RESULTS(P + S + C)(P + S)(P + C)FDTFTS_ID3FDTFTS_CARTFDTFTS_RF
Minimum0.000.000.007.967.964.69
Median1.533.593.6419.1519.2016.17
Maximum3.6511.9110.1837.3037.7330.30
IQR3.045.414.0015.5113.2816.07
Source: the authors.
Table 9. Comparative table of MAPE results with the reference.
RESULTS(P + S + C)(P + S)(P + C)FDTFTS_ID3FDTFTS_CARTFDTFTS_RF
Minimum0.000.000.003.713.711.97
Median1.092.892.4311.9412.0610.50
Maximum2.7310.727.7030.2530.4722.17
IQR1.624.013.7010.638.739.04
Source: the authors.
Disclaimer/Publisher’s Note: The statements, opinions and data contained in all publications are solely those of the individual author(s) and contributor(s) and not of MDPI and/or the editor(s). MDPI and/or the editor(s) disclaim responsibility for any injury to people or property resulting from any ideas, methods, instructions or products referred to in the content.

