Review

Parametric and Nonparametric Machine Learning Techniques for Increasing Power System Reliability: A Review

by
Fariha Imam
1,
Petr Musilek
1,* and
Marek Z. Reformat
1,2
1
Department of Electrical and Computer Engineering, University of Alberta, Edmonton, AB T6G 1H9, Canada
2
Information Technology Institute, University of Social Sciences, 90-113 Lodz, Poland
*
Author to whom correspondence should be addressed.
Information 2024, 15(1), 37; https://doi.org/10.3390/info15010037
Submission received: 12 November 2023 / Revised: 5 January 2024 / Accepted: 8 January 2024 / Published: 11 January 2024

Abstract

:
Due to aging infrastructure, technical issues, increased demand, and environmental developments, the reliability of power systems is of paramount importance. Utility companies aim to provide uninterrupted and efficient power supply to their customers. To achieve this, they focus on implementing techniques and methods to minimize downtime in power networks and reduce maintenance costs. In addition to traditional statistical methods, modern technologies such as machine learning have become increasingly common for enhancing system reliability and customer satisfaction. The primary objective of this study is to review parametric and nonparametric machine learning techniques and their applications in relation to maintenance-related aspects of power distribution system assets, including (1) distribution lines, (2) transformers, and (3) insulators. Compared to other reviews, this study offers a unique perspective on machine learning algorithms and their predictive capabilities in relation to the critical components of power distribution systems.

1. Introduction

Machine learning (ML) is a subfield of artificial intelligence (AI) that aims to develop mathematical models that mimic a human way of identifying and reasoning about dependencies between data variables describing phenomena. Over the last decade, ML techniques have gained enormous recognition for their modeling and prediction capabilities. The main task of ML is to learn an unknown function f ( · ) based on input data ( X )   to predict or explain Y . It yields an estimated function f ^ ( · ) , such that Y f ^ ( X ) . This function can be descriptive, predictive, and prescriptive depending on the needs.
ML algorithms can be categorized in a variety of ways. The most common is to classify them into supervised, unsupervised, and semi-supervised learning techniques. The main difference between these approaches is using labelled and unlabeled data for construction purposes. Another is based on the mechanisms applied to learn the f ( · ) function: parametric and nonparametric ones. This categorization, explained in Section 2, is primarily considered in this paper.
Due to the massive increases in power consumption and diversity of power generation, it has become a challenge for power companies to provide uninterrupted power efficiently. Several factors can contribute to power interruptions such as adverse weather conditions, vegetation and animal interferences, equipment failures, human errors, and other operational reasons, often resulting in power outages. Forecasting and identifying potential outages or fault events have always been a priority for researchers and power utilities. Therefore, modern technologies like ML have been extensively used to increase the power system reliability and customer satisfaction. Because of their powerful learning ability, numerous studies have reviewed applications of ML in power transmission and distribution systems, such as forecasting, security assessment, risk analysis, identifying and locating faults, condition monitoring and inspection of different assets, etc. Asset management and predictive maintenance of different components of power distribution systems have played a significant role in transforming the power industry. Predictive maintenance allows for the detection of various faults and failures in the network in advance, while asset management focuses on maintaining the life cycle and condition monitoring of individual assets.
Several reviews have been published addressing the application of ML techniques in power systems. Jian et al. review different ML techniques, such as traditional ML, deep learning (DL), and reinforcement learning (RL), to improve power system resilience [1]. They address the challenges and important issues associated with using ML. Similarly, Alimi et al. focus on four domains of power system security and stability [2]. They target SCADA network vulnerability and threats, analyses of power quality disturbances (PQDs), voltage stability assessment (VSA), and transient stability assessment (TSA). Further, they examine the benefits and limitations of various ML applications and present related research gaps. Aminifar et al. provide an overview of power system protection schemes, different types of faults, and issues associated with synchronous generators, power transformers, and transmission lines [3]. The focus of this paper is to represent how ML methods overcome traditional model-based techniques in terms of performance and accuracy.
Dashti et al. [4] present a detailed survey on the prediction and location of faults in the power distribution network. The authors investigate different types of systematic and unsystematic faults and the application of various ML algorithms in predicting and locating them. Another survey includes a thorough overview of traditional and intelligent conditional monitoring techniques for the health assessment of transformers [5]. This study shows that the use of ML algorithms, such as artificial neural networks (ANNs), support vector machines (SVMs), k-nearest neighbors (kNN), decision tree (DT), random forest (RF), and regression, can effectively support the monitoring of transformers. It also addresses some of the challenges associated with intelligent algorithms, suggests solutions, and identifies future trends. Rajora et al. [6] provide a detailed survey on the application of supervised, unsupervised, DL, and RL in asset management of power distribution system assets. In addition to addressing the advantages and disadvantages of each technique used in the literature, it also concludes that deep learning techniques are the most optimal for the management of power system assets.
In contrast with the previous literature, this paper classifies ML algorithms into parametric and nonparametric techniques and reviews their applications in power distribution systems. The contributions of this paper can be summarized as follows:
  • Describing two categories of machine learning algorithms, parametric and nonparametric techniques, providing their advantages, drawbacks, and limitations.
  • Focusing on the application of machine learning techniques to power distribution systems for their asset management, condition monitoring, and preventive and predictive maintenance.
  • Providing a comparative and descriptive analysis of machine learning-based models for predicting maintenance-related issues in distribution lines, transformers, and insulators to help in choosing the appropriate technique based on its performance, advantages, and limitations.
  • Offering useful references to select appropriate parametric and nonparametric techniques for insulator inspection, fault diagnosis, and health assessment of transformers and distribution lines.
This paper is organized as follows. Section 2 introduces the parametric and nonparametric techniques and their advantages, disadvantages, constraints, and selection criteria. Section 3 provides a detailed review of their applications to address various problems related to the main components of power distribution systems: distribution lines, transformers, and insulators. In Section 4, a comparison analysis and a conclusion are provided.

2. Parametric and Nonparametric Techniques

This section provides an overview of parametric and nonparametric techniques, including their advantages, disadvantages, and limitations. It also addresses the issue of selecting a suitable technique for a problem. A brief introduction to some of the popular ML algorithms is presented.

2.1. Parametric Techniques

In statistics, parametric means that the population from which the sample is taken follows a specified probability distribution with a finite number of parameters. A parametric technique makes assumptions about the functional form of f · and, based on these assumptions, f · is estimated given as f ^ · . The estimated function has a finite set of parameters that are not affected by new data. These parameters can be estimated by fitting the training data into the model. Let us assume that f · follows the distribution
Y = β 0 + β 1 x 1 + β 2 x 2 2 + + β p x p p .
To estimate f ^ ( · ) , we only need to estimate p+1 coefficients, such that
Y β 0 + β 1 x 1 + β 2 x 2 2 + + β p x p p .
where β 0 ,   β 1 , + + β p are regression coefficients. Although (2) fits a nonlinear model, the model itself is linear in parameters. Therefore, β 0 , β 1 , , β p can be estimated using ordinary least squares and maximum likelihood. Linear regression, polynomial regression, naive Bayes, simple neural network, linear discriminant analysis, and linear support vectors are examples of parametric techniques.

2.2. Nonparametric Techniques

Nonparametric means that data samples are collected from a population with no specific probability distribution. Nonparametric techniques make no assumptions regarding the functional form f(·). Since no prior information is available, these models estimate f(·) from the training dataset based on the trial–error method. In these techniques, the number of parameters to estimate is not fixed and often increases with additional data.
Suppose that we have a training dataset with a binary response variable (yes and no) and no prior knowledge regarding the relationship between input and response variable. One way to classify a new data point is to check its proximity to the neighboring data points, i.e., to calculate the distance between the new and other data points with the known value of the response variable. The Euclidean distance shown is a commonly used distance metric to form such decision boundaries.
Examples of nonparametric techniques are k-nearest neighbors, decision trees, random forest, radial basis function (RBF) kernel support vector machines, and nonparametric regressions.

2.3. Advantages, Disadvantages, and Limitations

Due to the defined functional form and a finite number of parameters to learn, parametric techniques require less computing power and training time. They provide a more straightforward interpretation of results and do not have restrictions on the size of the dataset. However, these models are not accurate representations of data and are more prone to underfitting.
In the case of nonparametric techniques, since no assumptions are made regarding the functional form, they can discover a functional form of f · from the provided data. That leads to a better representation of data and prediction accuracy. These techniques can manage complex data and can be used to make predictions and find patterns and relationships within a dataset. As the learning parameters can be infinite, these models require more training data and time. They are more computationally expensive compared to the parametric methods.
The choice between parametric and nonparametric techniques depends on a prior functional form of information and error distribution. Statistical analysis is a valuable tool to obtain initial knowledge about data. If the data are well defined and follow a particular functional form, a parametric method is a more suitable choice than the nonparametric one. For example, in Figure 1, the attributes X1 and Y1 tend to follow a linear relationship and can be modeled using a linear parametric technique, while the attributes X2 and Y2 does not follow any known or linear distribution; therefore, a nonparametric technique would be a better choice [7].
Parametric techniques are less flexible. The estimated f · is represented within a small range of shapes. In contrast, nonparametric techniques can estimate f · within a wide range of shapes. Thus, the nonparametric methods are considered more flexible. The lower flexibility in developing models leads to better interpretability, which can help solve interference problems. On the other hand, more flexibility in determining a suitable model could result in increased complexity and difficulty in understanding the relationship between inputs and response.
Another methodology for selecting a suitable model for the data is based on the trade-off between bias and variance, which determines the model’s performance. Bias is an error that defines how well the estimated function represents the data, while variance is the variation in the estimated function with a different input dataset. The goal is to find an optimal model with low bias and variance. It could be achieved in prediction analysis by minimizing the prediction error [8]. Regarding the bias–variance trade-off, models developed using parametric techniques have high bias and low variance. Since these models are less flexible, they are better suited for more straightforward and well-defined prediction problems. On the other hand, nonparametric approaches have low bias and high variance, thus often resulting in overfitting.
For example, in regression setting, mean squared error (MSE) is used to estimate the quality of fit of a model, where the MSE is the difference between the actual value and estimated one. Let (3a) be the MSE obtained for training data.
M S E = 1 n i = 1 n ( y i f ^ ( x i ) ) 2
where ( x i   , y i )   is a training observation and f ^ ( x i ) is the prediction of the i-th observation.
The MSE obtained for a testing observation ( x 0   , y 0 )   can be defined as (3b)
M S E 0 = ( y 0 f ^ ( x 0 ) ) 2
where f ^ ( x 0 ) is the prediction at x 0 observation. The training method which minimizes the expected MSE calculated for the test dataset is selected. The relationship between squared bias, variance, and test set MSE is shown in Figure 2. In (4), V a r f ^ x 0 is the variance of f ^ x 0 ,   [ B i a s f ^ x 0 ] 2   is squared bias, and V a r ( ϵ ) is the variance of the error term.
Expected   test   M S E = V a r f ^ x 0 + [ B i a s f ^ x 0 ] 2 + V a r ( ϵ )
It can be seen in Figure 2 that as the flexibility of the model increases, the bias (red) tends to decrease rapidly compared to the increase in variance (blue). In contrast, the test MSE (black) tends to decline initially. At a certain point, increasing the model’s flexibility does not affect system bias (red), but it significantly increases the variance and the test MSE (black); this is referred to as the bias–variance trade-off. The challenge lies in finding the optimal model with low squared bias and variance. Therefore, depending on the research area and the problem statement, the parametric or nonparametric technique should be selected considering the bias–variance trade-off [9].

2.4. Examples of Parametric and Nonparametric Techniques

A diagram representing different parametric and nonparametric ML algorithms is shown in Figure 3. Brief descriptions of a few commonly used algorithms are provided below. For more detailed information, cf. [10].

2.4.1. Regression Models

Regression models are supervised ML algorithms to determine the relationship and correlation between predictors and dependent variables. Linear regression is a straightforward and commonly used approach to predict quantitative responses in applications with a single predictor variable, and their relationship can be linearly defined. However, to accommodate multiple predictors, multiple linear regression is used. To predict the qualitative response or classify the output variable in distinct categories, logistic regression is considered. It determines the probability of belonging to a particular category. Linear and logistic regression are based on the linearity assumption. In situations when data are nonlinear, these models provide poor predictive performance. To overcome this, extensions of linear models like polynomial, step function, splines, local regression, and generalized additive models are more suitable options [9].
Linear models are considered parametric because the parameters to be estimated are predetermined and increasing training data size will result in changes in parameter values only. However, nonlinear models can be parametric with an assumed functional form or nonparametric with no specified function. Some examples of regression models are presented below; for more details, see [9].
Linear   regression :   y i = β 0 + β 1 x i + ϵ i
Polynomial   regression :   y i = β 0 + β 1 x i + β 2 x i 2 + + β d x i d + ϵ i
Multiple   logistic   regression :   P X = e x p   ( β 0 + β 1 x 1 + β 2 x 2 + + β p x p ) 1 + e x p   ( β 0 + β 1 x 1 + β 2 x 2 + + β p x p )
Kernel   regression :   f ^ h x = i = 1 n K ( x x i h ) y i i = 1 n K ( x x i h )
where K is kernel function with bandwidth h.
Multivariate   adaptive   regression   splines   ( MARS ) :   f ^ x = i = 1 k c i B i ( x ) ,
where B i ( x ) is a basis function.

2.4.2. Support Vector Machine

SVMs are supervised ML methods for classification and regression to analyze linear and nonlinear data with better accuracy and performance. In SVMs, different kernel functions, such as linear, polynomial, RBF, and sigmoid, are used to transform input data to a high-dimensional feature space so a hyperplane can separate data points. Once the optimal hyperplane is found, new data points can be classified. The kernel function is chosen based on the type of data. In cases where data can be linearly separable, the linear kernel function is a more suitable choice; since its parameters are not affected by the training dataset, an SVM with a linear kernel can be termed a parametric technique. But an SVM with a nonlinear kernel situation is different. For example, in an RBF SVM, the kernel matrix depends on the training dataset; it is calculated by computing the distance between training points. Thus, as the training data size increases, the model becomes more complex and can be termed nonparametric. Some commonly used kernels are given below.
Linear   kernel :   k ( x , y ) = x · y
Polynomial   kernel :   k x , y = ( x T y + r ) d
Sigmoid   kernel :   k x , y = t a n h ( γ · x T y + c )
Radial   kernel   k x , y = e γ x y 2

2.4.3. Artificial Neural Networks

Artificial neural networks (ANN)s are parallel distributed processors that simulate the structure of the human brain. They are highly adaptive and have high fault tolerance and computational power. An ANN consists of input, one or multiple hidden and output layers. Depending on the neurons in the hidden layers, they can be parametric or nonparametric. Nodes or neurons in different layers are information-processing units that define the operation of the neural network [11]. The input signals are assigned weights, and the summation function sums the inputs multiplied by their respective weights. The activation functions such as step, sign, sigmoid, and linear compute the output, which might become the input of another node. Different types of ANN used for various purposes are feedforward neural networks, multilayer perceptrons (MLPs), convolutional neural networks (CNNs), radial basis function neural networks, and recurrent neural networks (RNNs).
Neural networks are considered parametric when their parameters, i.e., the number of layers and nodes in each layer, are predetermined, and any increase in data size does not increase the number of parameters. But if the parameters are not fixed, the neural network can be interpreted as nonparametric. An example of a nonparametric neural network can be a network with a RBF used as an activation function, as the number of neurons and thus parameters can grow. A nonparametric neural network is introduced by Philipp and Carbonell [12], where size of the ANN is obtained using Adaptive Radial–Angular Gradient Descent or AdaRad optimizations.

2.4.4. Decision Tree

A decision tree (DT) is a nonparametric ML algorithm that can be applied to quantitative and qualitative response problems. Trees are easy to interpret and are increasingly used in decision analysis and knowledge discovery tasks. Since decision trees are highly flexible models, they are more prone to overfitting, resulting in high variance compared to other algorithms. They consist of a series of splitting or decision rules to form a hierarchical tree-like virtual lookup table composed of root, internal, and terminal nodes connected through branches. From the root node, the input data are fed into the internal nodes to split the predictor space to form homogenous subsets or terminal nodes that list all possible combinations within the data. There are different types of DTs, such as classification and regression trees (CARTs), iterative dichotomiser 3 (ID3), M5, C5.0, C4.5, conditional decision trees, and chi-squared automatic interaction detectors (CHAIDs). DTs are also used in ensemble configurations, such as random forest, bagging and boosting ensemble DTs, rotational forest, and light gradient-boosting machine (LightGBM), to improve classification rate and accuracy. All decision tree-based methods are considered nonparametric. Their decision rules rely on training data to make predictions. As training data increases, more decision rules are needed, and the complexity and depth of the trees increase.

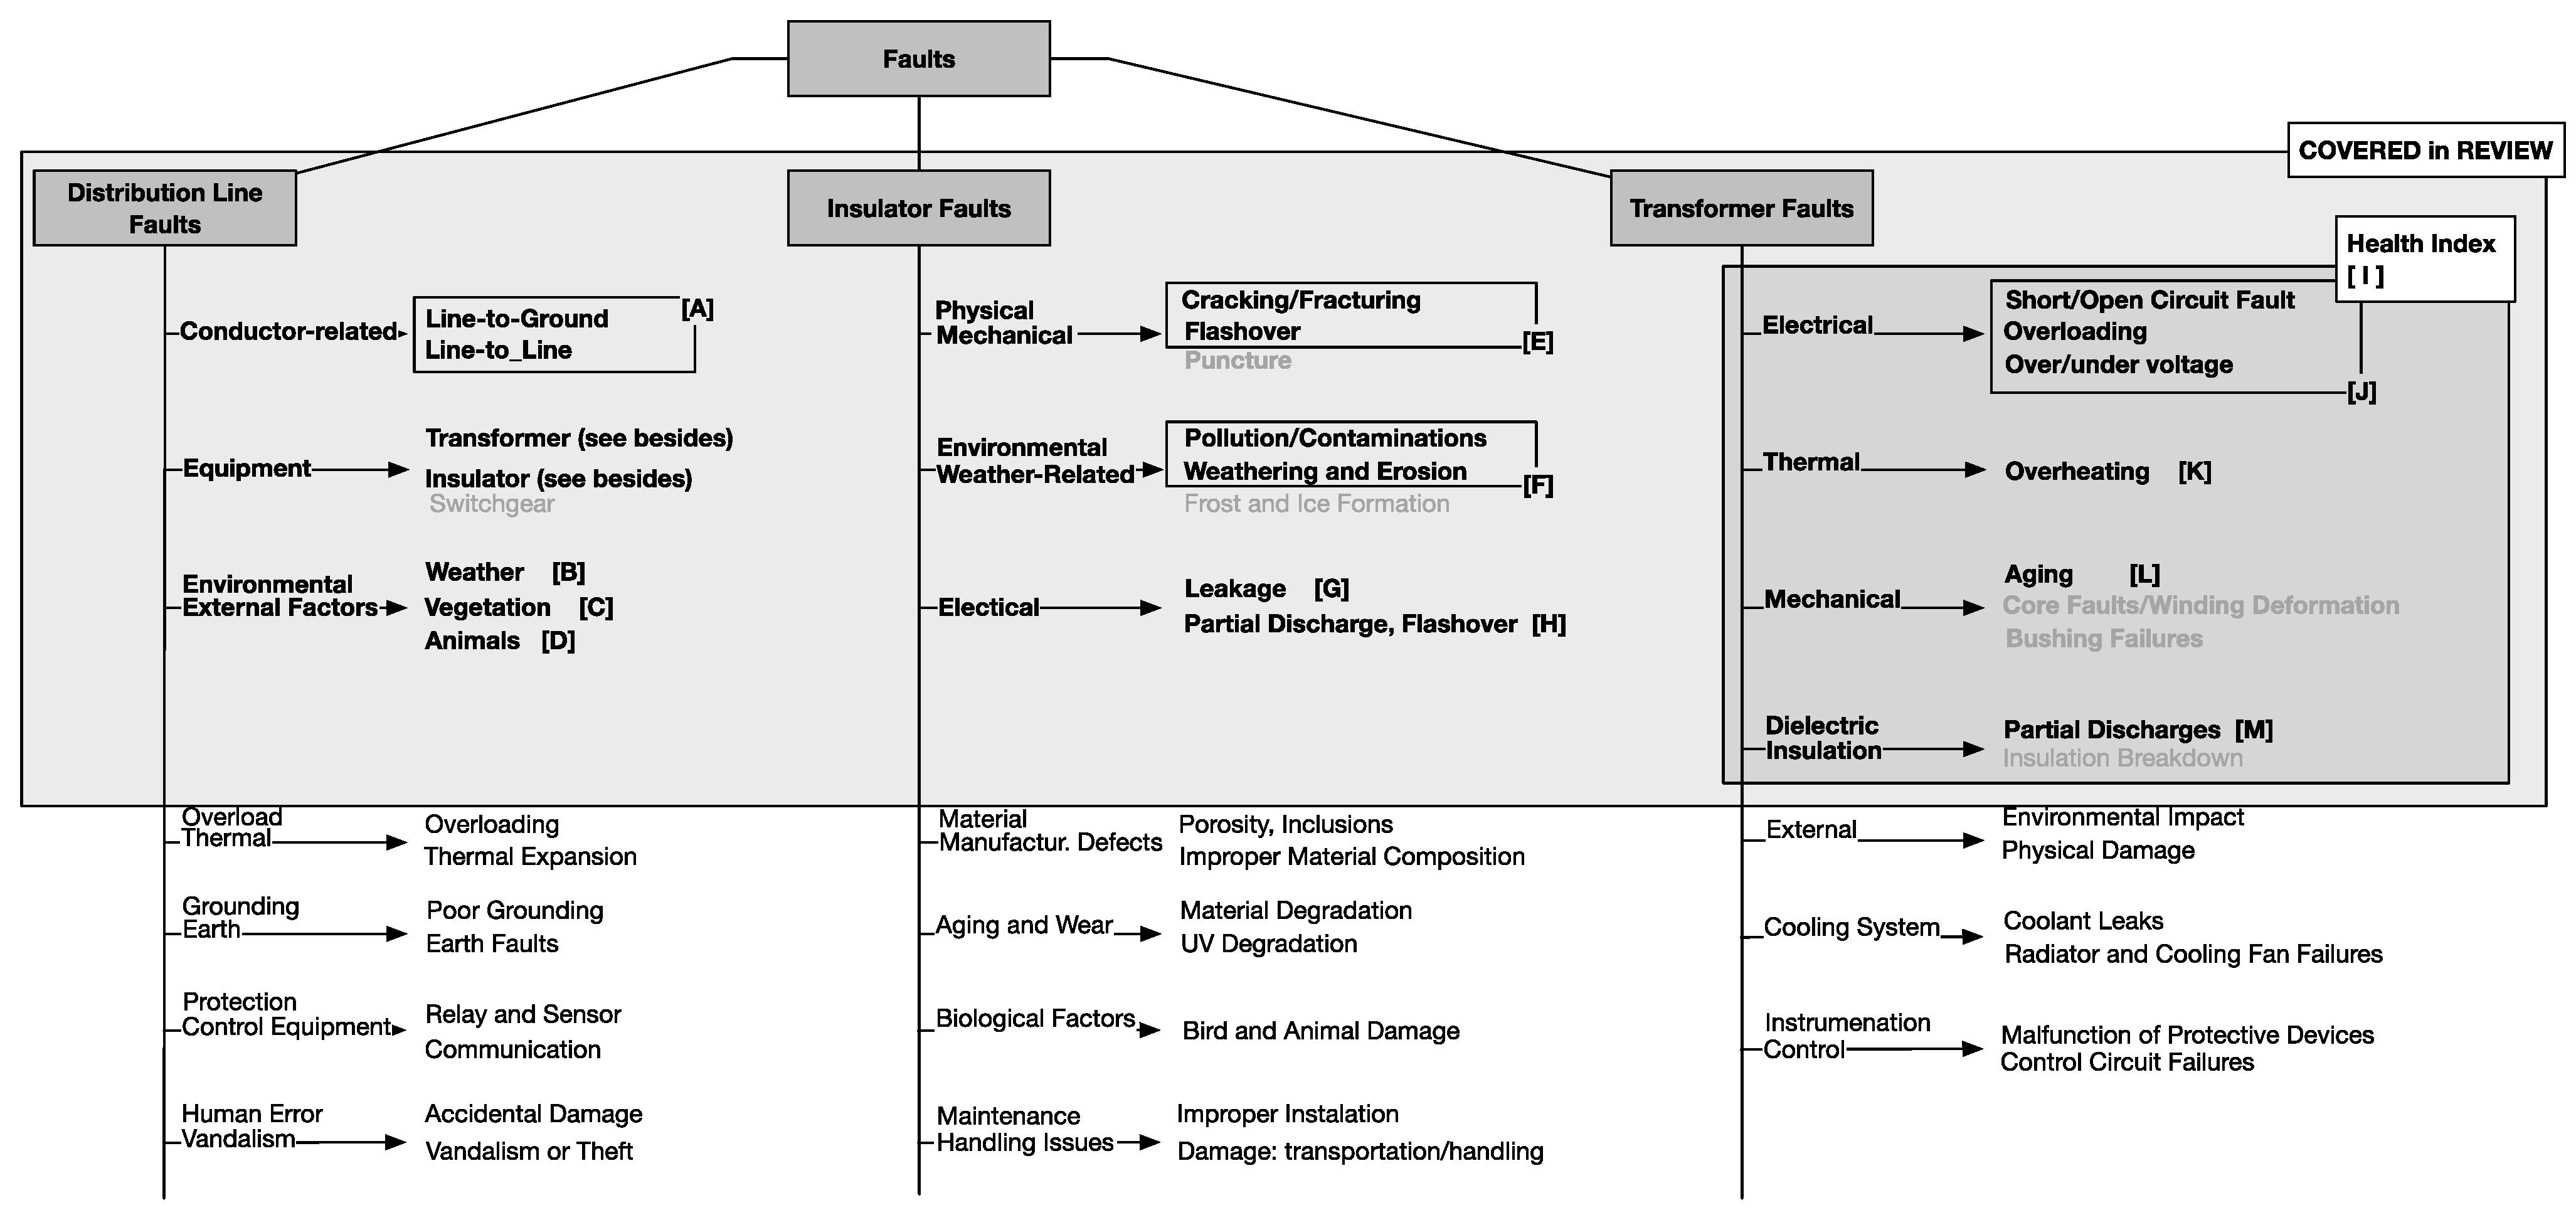
3. Machine Learning in Reliability Assessment

The primary goal of electricity providers is to maintain a reliable and stable power system that supplies uninterrupted electricity service to its customers. Therefore, in addition to traditional reliability assessment techniques such as Monte Carlo, researchers are now opting to apply ML techniques to the reliability assessment of power distribution systems. This section presents an overview of the parametric and nonparametric ML algorithms used for asset management in power distribution systems, condition monitoring, and preventive and predictive maintenance.

3.1. Power Distribution Lines

Power distribution lines are a distribution network’s most vulnerable and critical components. Different types of lines, such as overhead and underground (or subterranean), are subject to various internal and external factors that cause failures and power outages, affecting the system’s reliability. The leading causes of outages in distribution systems are vegetation, weather, animals, and equipment failure. Therefore, researchers, regulators, and distribution system operators opt for predictive maintenance and condition monitoring of these assets so that electricity service can be provided to customers without interruptions. The application of various parametric and nonparametric ML algorithms used for fault diagnosis and maintenance on power distribution lines is addressed in this section.

3.1.1. Weather-Caused Faults

The relationship between overhead distribution line outages and weather conditions such as wind gusts and lightning strikes is analyzed in [13]. Four types of regression models are used to evaluate linear and quadratic relationships between outage and predictor variables. This study considers two datasets representing lightning strikes within 200 m and 400 m around the overhead distribution line. Only two input variables, daily wind gust speed and lightning strokes in kA, are used to train the regression models. Based on the mean square error, R2, and average absolute error, the regression model representing a linear relationship for lightning and a quadratic relationship for wind performs well in estimating the effect of wind and lightning on outages compared to other proposed models. It is also concluded that the use of two different datasets does not affect the performance and prediction accuracy. Therefore, a dataset of lightning strikes within 200 m is sufficient to observe the effect of lightning on outages. In another study [14], weather-related power outages on overhead distribution lines are predicted using linear regression and a one-layer Bayesian network.
A feedforward ANN is used to calculate lightning flashover rates and to differentiate between direct and indirect lightning strikes on unshielded overhead distribution lines [15]. When a lightning strike hits the line (direct) or ground (indirect), it produces overvoltage, causing insulation flashover. Overhead distribution lines should be shielded to increase their protection from external sources. In the proposed study, ANN with two hidden layers of 14 and 12 neurons efficiently distinguished between different types of strikes and predicted flashover rates. Sarajcev [16] proposes a bagging ensemble classifier to predict lightning flashovers on medium voltage overhead distribution lines as an extension of previous work [15]. In the proposed bagging ensemble model, multiple SVM classifiers are trained on bootstrap samples, and their predictions are combined by weighted averaging. The result shows that the bagging ensemble classifier performed better than an ANN in performance, training time, and the ability to deal with noisy and imbalanced data.

3.1.2. Vegetation and Animal Caused Faults

Radmer et al. [17] present a comparative study between three different regression models (linear, exponential, multivariate linear) and ANN for predicting failure rates of overhead distribution lines due to vegetation growth. This study uses weather variables and historical outage data to predict time-varying, vegetation-related failure rates. The experimental results indicate that ANN with one hidden layer provides a better fit for the data. However, for predicting unknown failure rates, the multivariate linear model proved more suitable with the lowest generalization root weighted mean square error (RWMSE) of 0.2427. The generalization error of the linear model was slightly higher than the multivariate, where ANN has the worst generalization error.
Melagoda et al. [18] use parametric and nonparametric ML algorithms, i.e., ANN, decision tree, and random forest, to predict vegetation-related power distribution system outages. The input datasets consist of previous outage information, and weather data (such as temperature, precipitation, humidity, wind speed, and sun hours) are used to train the prediction models. Based on the performance of the models, the random forest can predict the probability of occurrence of an outage with the highest F1 score, that is, 0.94. The random forest prediction result is mapped to the risk map to show the risk associated with the distribution feeder. The output probability of the model is color-coded in five risk levels, which is helpful for priority-based maintenance of the feeders. Kankanala et al. [19] study weekly animal-related outages in overhead distribution lines based on a neural network combined with two boosting algorithms, AdaBoost.RT and AdaBoost+. Based on different performance measures, mean square error (MSE), mean absolute error (MAE), correlation, and best fit between the estimated and observed outages, AdaBoost+ outperforms neural network and Adaboost.RT with the lowest MSE and MAE and highest correlation between estimated and observed outages.

3.1.3. Short Circuit Faults

The MLP neural network is used by Aslan and Yağan [20] to classify and locate shunt faults on a 34.5 kV MV overhead distribution line. The experimental results show that ANN is able to classify all faulty conditions, and its performance is not affected by different fault types, inception angle, remote end source capacity, and fault resistance. Chunju et al. [21] propose a technique to locate a single line-to-ground fault (SLG) in a distribution line using a wavelet fuzzy neural network. The authors extract a high-frequency component from the fault transient signal using wavelet transform and integrate it with a fuzzy neural network to locate the fault. The results suggest that the proposed technique is beneficial for power system fault analysis. Different fault types in power distribution lines, such as line-to-line and line-to-ground faults, are predicted using a decision tree [22].
Min et al. developed a model to predict faults in 10 kV distribution lines based on a light gradient-boosting machine (LightGBM) and CNN [23]. LightGBM uses tree-like models for learning. In this study, multiple sub-models of LightGBM are employed to overcome the imbalance in the fault dataset. The dataset used for this study consists of both discrete and continuous features such as line and equipment information, weather data, operational characteristics, and depth time series features. CNN is employed based on stacking ideas to extract the time series features. The extracted time series and discrete features are then used to train multiple LightGBM models to predict fault probability. The outputs of these sub-models are combined into an ensemble classifier to determine the final fault probability. The results show that by utilizing both parametric and nonparametric techniques, the proposed method gives satisfactory performance compared to the LightGBM classifier without CNN.
Ngaopitakkul et al. [24] use SVMs with discrete wavelet transform (DWT) to classify faults in underground distribution cables. First-scale high-frequency components are extracted using DWT from stimulated fault signals. They are used to train five different SVM models. Various fault inception angles and faulty phases are assessed by considering the location of the underground cable. The proposed algorithm performs better than the method developed by Apisit et al. [25], which uses only DWT for fault classification in underground cables.
Oliveira et al. [26] employ the extreme gradient boosting (XGBoost) algorithm to predict future failures and their location in high-voltage (HV) and medium-voltage (MV) distribution lines. The distribution line dataset is segmented into two groups corresponding to the HV and MV lines. The MV dataset is further segmented based on installation styles such as overhead, subterranean, and hybrid. For each segment, the most significant variables are selected based on stepwise (forward and backward) and ridge regression, which are used to train the prediction model. The proposed methodology is compared with the naïve and historical mean approaches for performance analysis. In the naïve approach, failure predictions are based on the most recent failure records. In contrast, for the historical mean, predictions are based on an average number of failures. Based on weighted error (WE), weighted absolute error (WAE), and weighted absolute percentual error (WAPE), the proposed techniques outperform other approaches with the lowest prediction error and an accuracy of more than 0.80.
The causes of distribution line faults and failures, along with the ML methods used to address them, are summarized in Table 1.

3.2. Insulators

Insulators are other core components of power distribution systems. They support line conductors and electrically isolate them from the ground. Typically, insulators are made of glass, polymers, porcelain, and ceramics. The different types of insulators and their common usage areas are listed in Table 2.
Over time and under certain conditions, insulators may lose their insulating properties. This may lead to line-to-ground (L-G) faults that affect the reliability of the power system. The most common defects found in insulators are breakage, self-explosion, string falling, fouling, cracks, burns, erosion, and contamination. Outdoor insulators are more prone to contamination due to different environmental elements. Over time, these contaminated insulators produce a leakage current, resulting in flashover or system failure. Therefore, various ML-based strategies are used to monitor defects and contamination levels. These defects and damage can be detected using different insulator inspection techniques listed in Table 3. They are often combined with ML algorithms to improve the quality of inspections. Such solutions result in the better detection of insulator defects.

3.2.1. Condition Monitoring Using Images

Traditional methods for monitoring the condition of the insulators are based on visual inspection and aerial surveillance. More recently, video surveillance methods with remote terminal units (RTUs) combined with ML algorithms have become the tools of choice for the real-time monitoring of insulators. Because of their ability to capture various types of surface defects under different backgrounds and weather conditions, they often outperform traditional methods.
This section reviews several parametric and nonparametric techniques used in the maintenance and condition monitoring of insulators deployed in power distribution systems. Prasad and Rao [27] propose a classification method to evaluate the condition of the distribution line insulators using an SVM. In the proposed approach, 80 images of electric poles taken at regular time intervals are captured using remote terminal units (RTUs). K-means clustering is used to identify insulators in pictures, and the local binary pattern-histogram Fourier (LBP-HF) is used to extract insulator features. The generated feature vectors are then input into the SVM model to classify whether the insulator is in a healthy, marginal, or risky state. The result shows that SVM can be an effective tool for the condition monitoring of insulators with 93.33% accuracy.
Reddy et al. use an adaptive neuro-fuzzy inference system (ANFIS) to locate and classify the condition of overhead distribution line insulators [28]. Images with the plain background taken by RTUs are clustered using the k-means algorithm to extract information about the pole, cross-arm, insulators, and conductors. ANFIS detects the insulators in the bounding boxes drawn over the images. Reddy et al. [29] extend their previous work and introduce SVM and ANFIS for the condition monitoring of insulators with complex backgrounds. In both studies, discrete orthogonal S-transform (DOST) extracts insulator characteristics. The experimental results show that SVM performed better in correctly locating insulators in bounding boxes and identifying insulators’ health conditions with complex backgrounds. Similar techniques of conditional monitoring and determining the health of insulators are mentioned in [30]. Here, the wavelet transform is used to extract the features, and the SVM is used to classify the insulators’ conditions. A review of different types of techniques used to monitor and classify the state of overhead distribution insulators is described by Murthy et al. [31]. The authors perform a comparative analysis between various feature extraction techniques such as modified Hough transform, wavelet transform, discrete orthogonal S-transform and LBP-HF, and several classification techniques such as SVM, ANFIS, and hidden Markov model (HMM).
The ANN and CNN are used to evaluate and classify the surface erosion levels of the insulator (silicon rubber) in laboratory settings [32]. In this study, various image enhancement and feature extraction techniques are considered. Visual inspection of silicone rubber (SIR) samples classifies them as healthy, moderately eroded, and severely eroded insulators according to the IEC-60587 standards [33]. A total of 1240 images of SIR taken at different angles and lightening settings have been collected and preprocessed using image enhancement techniques such as contrast adjustment (CA), contrast-limited adaptive histogram equalization (CLAHE), and fast local Laplacian filtering (FLLF). Based on these images, features are extracted using raw features (Raw) and histogram-of-gradient (HOG). They are inputted to ANN and CNN for classification purposes. Experimental results show that with 89.5% accuracy, CNN outperforms the two-hidden-layer ANN with image enhancement and feature extraction techniques. The proposed method can also be applied to outdoor insulators to inspect and detect their health condition.

3.2.2. Condition Monitoring Using Ultrasound

Several optimization methods, such as gradient descent, resilient backpropagation, quasi-Newton, and Levenberg–Marquardt, are used to train ANN to identify faulty insulators in a laboratory setting [34]. This study compares different optimization methods for an ANN regarding processing capacity and performance. Four-pin type porcelain insulators with different conditions (new, broken, laboratory-drilled, and contaminated) are considered to acquire ultrasonic data using an ultrasound detector. An MLP with one hidden layer of five neurons is used to evaluate the performance of different optimization methods. Under this setup, gradient descent gives unsatisfactory training time and accurate results. Therefore, conjugate gradient backpropagation (CGB) is presented with other gradient updating techniques such as Powell–Beale restarts, Polak–Ribiére, Fletcher–Reeves, and scaled CGB. The result shows a trade-off between accuracy and training speed: an accuracy of 99.99% was obtained using scaled CGB; however, its training time was longer than that of the other proposed methods.
An MLP was also used to classify different conditions of ceramic insulators using an ultrasound detector [35]. Two different backpropagation MLPs were built. The first classifies insulators as contaminated or non-contaminated, and the second as perforated and non-perforated. The result shows that the proposed method can detect perforated insulators more accurately (82.00%) than contaminant insulators (68.25%). The double-check technique is utilized to further improve the accuracy of the prediction. An adaptive neuro-fuzzy inference system (ANFIS) with wavelet packet transform is introduced to predict insulator conditions using an ultrasound detector [36]. ANFIS is a hybrid system that uses ANN and fuzzy inference. It can handle complex data [37]. Time series data from the 25 kV class insulator is filtered using wavelet packet transform, which is used as input to the model for time series forecasting. Three fuzzy inference structures, grid partition, fuzzy c-means clustering, and subtractive clustering, are considered for building the ANFIS model. Based on training time and accuracy, fuzzy c-mean clustering outperforms other inference structures. In addition, this approach is further compared with different neural network-based techniques, such as a nonlinear autoregressive (NAR) model, and a nonlinear autoregressive with exogenous input (NARX) model. Still, the proposed system predicts faulty insulators with better accuracy.

3.2.3. Detecting Leakage Current

Khafaf and El-Hag [38] apply an ANN to predict the value of leakage current (LC) in an outdoor polymer insulator. In the proposed approach, three different ANN models are implemented: the nonlinear autoregressive (NAR), input–output (I–O) neural network, and nonlinear autoregressive with exogenous (NARX) with different input time series. Bayesian regularization is used to overcome overfitting in a neural network. Regarding prediction error, the NAR neural network outperforms other models when there is no correlation between the fundamental and third-harmonic components of LC. However, in the presence of correlation, NARX performs better. Furthermore, this study concluded that the NAR neural network is more suitable than SVM and kNN for time series prediction. In other work, the solid-layer method artificially contaminates disc-type porcelain insulators at different contamination levels [39]. A dataset of 2000 samples of leakage current is recorded at different voltage levels. The dimensionality of the dataset is reduced by principal component analysis and separated into four distinct clusters using k-means clustering to evaluate the health of insulators.

3.2.4. Detecting Partial Discharge

Partial discharge (PD) pattern recognition is addressed by Abubakar et al. [40]. The authors propose an ensemble neural network. The network is formed by combining the prediction of different neural networks trained for the same purpose. In this paper, the ensemble network is constructed using three different models: MLP and RBF network (RBFN), both with a single hidden layer and 60 neurons, and Elman recurrent network (ERNN) with one hidden layer and 30 neurons. These models are trained on statistical parameters such as skewness, kurtosis, and discharge factor (Q) to classify various PD patterns. With bootstrap resampling, this ensemble neural network gives better prediction accuracy than individual neural networks. Mas’ud et al. published a review of multiple applications of ANN to detect and recognize partial discharge (PD) faults and patterns [41].
The k-nearest neighbors (kNN) algorithm is applied by Corso et al. [42] to classify contaminated insulators. For this study, five 15 kV pin-type porcelain insulators are artificially contaminated in a laboratory, and their images capture different contamination levels. After image preprocessing and feature extraction, k-NN is built using different data separation techniques and distance calculation functions. A comparative study of parametric and nonparametric ML algorithms, such as decision trees, ensemble (subspace), SVM, and multilayer perceptron models, is also conducted. kNN with 9-fold cross-validation and Mahalanobis function performs well compared to other proposed methods and techniques.
Different defect inspection techniques and applications of ML algorithms to insulator-related problems that are described in this section are presented in Table 3.
Table 3. Insulator inspection techniques and application of ML methods.
Inspection
Techniques
Detection ProcedureMachine Learning
Algorithms
Visual inspection [32]Physically inspecting insulators to find defects but unable to detect small defects. CNN, ANN (P)
Ultrasound detector
[34,35,36]
Capturing sound emitted from partial discharge.MLP (P)
ANFIS (NP)
Leakage current (LC)
[38,39]
Prediction of leakage current and flashover under contamination conditions.NAR neural network (NP)
(I–O) neural network nonlinear Autoregressive with exogenous (NARX) Neural network (NP)
K-means clustering (NP)
Partial discharge (PD)
[40,41]
By identifying patterns of electric discharge (PD) in a high-voltage system.Ensemble neural network (P)
ANN (P)
Image processing
[42]
Capturing images of insulators and extracting information using feature extraction techniques.K-nearest neighbors (NP)
Decision tree (NP)
SVM, and MLP (P)

3.3. Distribution Transformers

As one of the most critical components, utilities and researchers are keenly interested in evaluating transformer losses, monitoring their operational conditions, and predicting their faults or failures. A transformer’s failure can significantly impact the system’s operations. Therefore, various intelligent models are introduced in the predictive maintenance of transformers.
Many internal and external factors could affect the working conditions of transformers, for example, equipment age, electrical and thermal stress, oil leakage, and environmental aspects. Table 4 lists some of these factors and modifier components that could cause faults or failures.
Different techniques are used to monitor a transformer’s health status. Table 5 provides various preventive tests and condition-monitoring methods. These techniques are chosen based on the problem and component being assessed. A detailed description can be found in [44].
Dissolved gas analysis (DGA) is one of the most popular techniques for detecting fault types in transformers, where paper insulation is immersed in insulating oil. Here, hydrogen (H2), methane (CH4), ethane (C2H6), ethylene (C2H4), and acetylene (C2H2) are produced due to oil decomposition, and carbon monoxide (CO) and carbon dioxide (CO2) are produced due to paper decomposition [45]. Transformer faults can be divided into thermal and discharge faults. The thermal defects are low-temperature overheating and high-temperature overheating or sparking. Discharge faults can be divided into high-energy discharge faults or arcing and low-energy discharge faults or partial discharge and corona. Depending on the type of gases and their amount, different types such as partial discharge, arcing, corona, and cellulose condition can be predicted using the IEC three-ratio method [46], four-ratio method [47], ANN, and fuzzy logic. However, this review focuses on applying ML techniques to fault diagnostics. This section presents some parametric and nonparametric ML algorithms used to maintain transformers.

3.3.1. Failure Prediction and Discharge

Binary SVM classification was applied to predict failure in distribution transformers due to burning [48]. Based on the prediction results, maintenance activities were planned to reduce operating expenses and power interruption. According to the results, the most common causes of burning events are atmospheric discharge, short circuits due to low voltage, and overload. Another study used predictor variables such as burn rate, insulation type, transformer location, and keraunic levels to predict transformer failure. The dataset used in this study [49] covered 16,000 distribution transformers for 2019 and 2020. The result demonstrates that a binary SVM can be applied to detect transformer failure with a lower prediction error and can save corrective maintenance expenses.
A database of 700,000 distribution transformers with 72 predictor variables was used to construct random forest and random undersampling with AdaBoost (RUSBoost) to predict failures [50]. Included were weather-related, transformer-specific, transformer loading, and location variables. To reduce the dimensionality of the data, various feature selection methods were deployed, such as sequential forward, backward selection, and mutual information-based filtering. The matching of the top N (MITN) metric was used to assess the performance of the algorithms. RUSBoost performed better than random forest in terms of the metric. The proposed algorithms are cost-effective and outperform traditional fault prediction methods based on DGA diagnostics.
In another published work, a multiclass SVM is proposed to detect fault types in power transformers [51]. A dataset of 223 samples of different fault types is considered. Using transformer dissolved gas analysis, five types of gases, hydrogen (H2), methane (CH4), ethane (C2H6), ethylene (C2H4), and acetylene (C2H2), are used as inputs.
Different types of faults are predicted using a one-against-one multiclass SVM. Because of the nonlinear nature of the data, the RBF is used as the kernel function to map the data into higher dimensions. This study shows that the proposed model can predict transformer fault types with 94.79% accuracy. A hierarchical SVM is presented in [52] to predict faults in distribution transformers. A binary decision tree is built where each node represents an SVM. Various thermal and discharge faults are predicted with an overall accuracy of 92%. This paper demonstrates the advantages of using SVMs over neural networks and the ICE ratio method with respect to diagnostic accuracy.

3.3.2. Fault Diagnosis

Based on DGA, Zhang, Ding, and Liu [53] present a two-step ANN with 10-fold cross-validation. Its goal is to diagnose transformer failure under cellulose conditions. In the first step, five different gases, H2, CH4, C2H6, C2H4, and C2H2 (without cellulose), are used as inputs to construct an ANN for diagnosing a type of fault. Multiple neural network topologies are built and compared to achieve higher accuracy. In the second step, an ANN is constructed to determine cellulose involvement in the fault. The experimental result shows that the two-step ANN, each with two hidden layers, gives the most promising results in terms of diagnostic accuracy.
On the other hand, Dong, Yang, and Li [54] developed a backpropagation neural network (BPNN) to predict faults in transformers, where the parameters of the BPNN were optimized using the bat algorithm [55]. With DGA data, Bat-BPNN with one hidden layer (ten neurons) significantly increased fault diagnosis accuracy. The proposed Bat-BPNN was compared with other optimized models such as BPNN, PSO-BO, and GA-BP. This study shows that the proposed approach performs more accurately in classifying faults, requires less memory, and provides fast convergence with 95.22% accuracy of diagnosis. BPNN is also used in [56] for detecting faults, while a comparison study between random forest and BPNN is given in [57]. According to the results, random forest, with 98.62% accuracy, performs better than BPNN in terms of diagnostic accuracy, class stability, generalization ability, and pattern classification.
In addition, the classification of faults and the evaluation of the transformer insulation condition using DGA data are discussed in [58]. Multiple ML algorithms are compared, such as decision tree, BPNN, adaptive boosting (AdaBoost), k-nearest neighbors (kNN), bagged and boosted ensemble, and SVM. The result shows that the decision tree algorithm performs well in classifying faults with less training time, high prediction speed, and better accuracy than kNN and SVM. Furthermore, the adaptive boost algorithm outperforms all other algorithms with 88.6% accuracy. Similarly, in [59], logistic regression, SVM, kNN, decision tree, random forest, AdaBoost, and extreme gradient boosting (XGB) are implemented to predict magnetic oil gauge faults in distribution transformers. The experimental results show that the decision tree with a training accuracy of 100% and testing accuracy of 98.78% performs well under the given conditions compared to other models.

3.3.3. Health Assessment

A feedforward ANN with two hidden layers (four and two neurons) was in one study used to assess transformer health [60]. A dataset representing 88 transformers with 11 predictor variables, such as total solids in oil, water content, breakdown voltage, and acidity, was used to predict the transformer’s condition based on the value of the AMRA health indices. The proposed model obtained 96.55% accuracy and can be used in asset management to improve the reliability of a power system. Also, in [61], an ANN was used to determine the health status of a transformer. A strategy for the real-time conditional monitoring of distributed transformers combining k-nearest neighbors (kNN) with clustering and the Gaussian mixture model (GMM) was proposed in [62]. The operation map and the health index were used to assess the operational condition of the distribution transformers. In another study, four different ML algorithms, SVM, kNN, decision tree, and random forest, were used to monitor remotely located distribution transformers online [62]. The top oil temperature, vibration, and transformer loading were system indicators to assess transformer health. The result of this study indicates that the health index varies with the transformer loading.
A summary of the reviewed applications of ML algorithms is presented in Table 6.

4. Challenges, Trends, and Future Directions

While analyzing the results and methods presented in the reviewed papers, we identified several issues and challenges.
  • A lack of benchmark datasets: The most significant challenge associated with comparing the ML models and identifying the best ones is non-availability and insufficient datasets; to address that issue, researchers used stimulation or proprietary data, which means even when they focused on the same problems, comparison of models was difficult.
  • The diversity of input features: The presented models used very different input (dependent) variables processed differently during model development processes, which caused a huddle in direct comparison between models.
  • Low replicability: The development of ML models requires extensive, time-consuming experiments and a high level of knowledge to tune models’ (hyper)parameters. Unfortunately, the research papers did not contain detailed descriptions of the model development processes, which very much limits the replicability of the proposed solutions.
Notwithstanding the challenges, parametric and nonparametric ML models have gained significant attention in recent years for the predictive maintenance of power systems. This interest stems from their ability to manage intricate datasets and effectively capture nonlinear relationships. The main trends and future directions in this area can be organized into three main categories: extended models, model interfaces, and advanced ML. Each group is briefly described in the following subsections.

4.1. Extended Models

Parametric and nonparametric models can be combined to form hybrid models, which can provide more accurate predictions and improve robustness. Researchers are exploring hybrid models that integrate the strengths of both approaches, such as combining Gaussian processes with deep neural networks or using random forests with Bayesian inference [64]. ML models often struggle to quantify uncertainty in predictions, which is critical in predictive maintenance. Researchers are developing methods to estimate uncertainty in machine learning models, such as Monte Carlo dropout, Bayesian neural networks, and ensemble methods such as bagging and boosting [65]. These techniques can improve the reliability of predictions and help in decision making. Power system data often involve time series data, which require specific techniques to handle complex temporal relationships. Researchers are applying time series forecasting methods such as ARIMA, LSTM, and GRU to predict equipment failures and optimize maintenance schedules [66].

4.2. Model Interfaces

The integration of multi-modal sensor data is becoming increasingly important in predictive maintenance. Researchers are exploring the use of sensor fusion techniques to combine data from different sensors, such as accelerometers, temperature sensors, and acoustic sensors, to improve fault detection and diagnosis [67]. With the proliferation of IoT devices and edge computing, researchers are exploring ways to perform machine learning tasks on edge devices, reducing latency and improving real-time performance [68]. This trend is expected to continue, enabling faster and more efficient predictive maintenance in power systems. Some approaches also use digital twins to simulate the components of the power system and predict potential failures before they occur [69]. This area is expected to see significant growth in the coming years.

4.3. Advanced Machine Learning

The increased use of DL models such as CNN and RNNs has shown promising results in image recognition, natural language processing, and time series forecasting tasks. They can also be applied to predictive maintenance tasks such as fault detection, diagnosis, and prognosis [70]. The lack of labeled data is a major challenge in applying machine learning to predictive maintenance. Transfer learning and domain adaptation techniques enable researchers to leverage pre-trained models and adapt them to new domains with limited data. These approaches have been used in various applications, such as image classification, object detection, and speech recognition [71]. With the increasing use of black-box models, there is a growing need for explainability and interpretability of model predictions. Explainable AI techniques aim to provide insights into how models make decisions, which can help build trust and improve model performance [72].

5. Analysis

The examined ML-based approaches used for analyzing and monitoring of the conditions of different assets in power distribution systems are summarized in Table 7. Most of the applications focused on analyzing outages and identifying faults and failures.
Nonparametric techniques are more efficient than parametric techniques regarding performance and diagnostic accuracy. Due to their decision-making capacity and performance, they can also be very beneficial in reducing maintenance costs. The nonparametric models lead to more generalized and better-performed models. Yet, they come with some difficulties and limitations. They are flexible and highly adaptable but often computationally intensive. They do not make strong assumptions about the underlying data distribution and rely on the data themselves to model relationships. Therefore, they need enough data to accurately capture the underlying data structure and avoid overfitting. At the same time, they face practical computational limits when dealing with massive datasets. This creates a delicate balance in selecting the right amount of data sufficient for model accuracy but still manageable regarding computational resources. Additionally, these models can be challenging to interpret and sensitive to hyperparameter choices, posing hurdles in practical deployments where clear understanding and fine-tuning are essential.
To summarize, the nonparametric methods require more data than some of the targeted scenarios in distribution systems can provide. Therefore, as much as they are more desirable models, data-related limitations in many scenarios lead to the utilization of parametric models. These models are less demanding regarding the sizes of datasets and are easier to develop and utilize.
A simple summary of selected prediction accuracy values obtained using different ML algorithms for transformer fault prediction, which are reviewed in this paper, is shown in Figure 4. Decision trees, as a nonparametric technique, perform better than other models to predict different fault types.
It becomes evident that utilities, power providers, and researchers are increasingly inclined to use ML methods to address various maintenance issues directly or indirectly related to the reliability of power systems. The learning ability of these methods has shown exceptional potential for the developed models and techniques to improve the operations and reliability of power systems. The presented review is focused on applying ML methods to address issues with distribution lines, insulators, and transformers. It reveals that various parametric and nonparametric techniques are commonly used. Ultimately, based on the cited literature, nonparametric techniques appear to be better suited for fault analysis and monitoring purposes.
The taxonomy of faults for three critical components of the distribution system, illustrated in Figure 5, provides another perspective of the surveyed literature. The broad gray box in the figure encapsulates all the types of faults we have discussed. A notable point is that these faults can be analyzed using data-driven methodologies. For transmission line faults, most of the studied methods employed numerical data to develop predictive models. In the case of insulators, the approaches predominantly involved image processing and frequency analysis techniques. Regarding transformers, many research studies have concentrated on dissolved gas analysis (DGA), which aids in estimating a transformer’s health index (indicated by the dark gray box in Figure 5).
This exploration reveals that the application of machine learning techniques in fault prediction addresses the most frequent and natural causes of faults. However, there remains a significant scope for further research to develop comprehensive systems for predicting faults in system components and enhancing their reliability.

Author Contributions

Conceptualization, M.Z.R. and P.M.; investigation, F.I., M.Z.R. and P.M.; resources, F.I.; writing—original draft preparation, F.I.; writing—review and editing, M.Z.R. and P.M.; visualization, F.I.; supervision, M.Z.R.; project administration, P.M.; funding acquisition, P.M. All authors have read and agreed to the published version of the manuscript.

Funding

This research was funded by the Natural Sciences and Engineering Research Council (NSERC) of Canada grant number ALLRP 549804-19 and by Alberta Electric System Operator, AltaLink, ATCO Electric, ENMAX, EPCOR Inc., and FortisAlberta.

Conflicts of Interest

The authors declare no conflicts of interest.

References

  1. Xie, J.; Alvarez-Fernandez, I.; Sun, W. A Review of Machine Learning Applications in Power System Resilience. In Proceedings of the 2020 IEEE Power & Energy Society General Meeting (PESGM), Montreal, QC, Canada, 2–6 August 2020; pp. 1–5. [Google Scholar] [CrossRef]
  2. Alimi, O.A.; Ouahada, K.; Abu-Mahfouz, A.M. A Review of Machine Learning Approaches to Power System Security and Stability. IEEE Access 2020, 8, 113512–113531. [Google Scholar] [CrossRef]
  3. Aminifar, F.; Abedini, M.; Amraee, T.; Jafarian, P.; Samimi, M.H.; Shahidehpour, M. A review of power system protection and asset management with machine learning techniques. Energy Syst. 2022, 13, 855–892. [Google Scholar] [CrossRef]
  4. Dashti, R.; Daisy, M.; Mirshekali, H.; Shaker, H.R.; Aliabadi, M.H. A survey of fault prediction and location methods in electrical energy distribution networks. Measurement 2021, 184, 109947. [Google Scholar] [CrossRef]
  5. Esmaeili Nezhad, A.; Samimi, M. A review of the applications of machine learning in the condition monitoring of transformers. Energy Syst. 2022, 1–31. [Google Scholar] [CrossRef]
  6. Rajora, G.L.; Sanz-Bobi, M.A.; Domingo, C.M. Application of Machine Learning Methods for Asset Management on Power Distribution Networks. Emerg. Sci. J. 2020, 6, 905–920. [Google Scholar] [CrossRef]
  7. Mahmoud, H. Parametric versus Semi and Nonparametric Regression Models. arXiv 2019, arXiv:1906.10221. [Google Scholar] [CrossRef]
  8. Bhargavi, P.; Singaraji, J. Machine Learning Algorithms in Big data Analytics. Int. J. Comput. Sci. Eng. 2018, 6, 63–70. [Google Scholar] [CrossRef]
  9. James, G.; Witten, D.; Hastie, T.; Tibshirani, R. An Introduction to Statistical Learning with Applications in R; Springer: New York, NY, USA, 2021. [Google Scholar]
  10. Murphy, K.P. Machine Learning: A Probabilistic Perspective; MIT Press: Cambridge, MA, USA, 2013. [Google Scholar]
  11. Haykin, S. Neural Networks, a Comprehensive Foundation; Prentice-Hall: Hoboken, NJ, USA, 1994. [Google Scholar]
  12. Philipp, G.; Carbonell, J. Nonparametric Neural Networks. arXiv 2017, arXiv:1712.05440. [Google Scholar]
  13. Kankanala, P.; Pahwa, A.; Das, S. Regression models for outages due to wind and lightning on overhead distribution feeders. In Proceedings of the 2011 IEEE Power and Energy Society General Meeting, Detroit, MI, USA, 24–28 July 2011; pp. 1–4. [Google Scholar] [CrossRef]
  14. Zhou, Y.; Pahwa, A.; Das, S. Prediction of weather-related failures of overhead distribution feeders. In Proceedings of the 2004 International Conference on Probabilistic Methods Applied to Power Systems, Ames, IA, USA, 12–14 September 2004; pp. 959–962. [Google Scholar]
  15. Martinez, J.A.; Gonzalez-Molina, F. Statistical evaluation of lightning overvoltage’s on overhead distribution lines using neural networks. IEEE Trans. Power Deliv. 2005, 20, 2219–2226. [Google Scholar] [CrossRef]
  16. Sarajcev, P. Bagging Ensemble Classifier for Predicting Lightning Flashovers on Distribution Lines. In Proceedings of the 2022 7th International Conference on Smart and Sustainable Technologies (SpliTech), Split/Bol, Croatia, 5–8 July 2022; pp. 1–6. [Google Scholar] [CrossRef]
  17. Radmer, D.T.; Kuntz, P.A.; Christie, R.D.; Venkata, S.S.; Fletcher, R.H. Predicting vegetation-related failure rates for overhead distribution feeders. IEEE Trans. Power Deliv. 2002, 17, 1170–1175. [Google Scholar] [CrossRef]
  18. Melagoda, A.U.; Karunarathna, T.D.L.P.; Nisaharan, G.; Amarasinghe, P.A.G.M.; Abeygunawardane, S.K. Application of Machine Learning Algorithms for Predicting Vegetation Related Outages in Power Distribution Systems. In Proceedings of the 2021 3rd International Conference on Electrical Engineering (EECon), Colombo, Sri Lanka, 2–3 February 2021; pp. 25–30. [Google Scholar] [CrossRef]
  19. Kankanala, P.; A Pahwa, A.; Das, S. Estimating animal-related outages on overhead distribution feeders using boosting. IFAC-PapersOnLine 2015, 48, 270–275. [Google Scholar] [CrossRef]
  20. Aslan, Y.; Yağan, Y.E. Artificial neural-network-based fault location for power distribution lines using the frequency spectra of fault data. Electr. Eng. 2017, 99, 301–311. [Google Scholar] [CrossRef]
  21. Chunju, F.; Li, K.; Chan, W.; Weiyong, Y.; Zhaoning, Z. Application of wavelet fuzzy neural network in locating single line to ground fault (SLG) in distribution lines. Int. J. Electr. Power Energy Syst. 2007, 29, 497–503. [Google Scholar] [CrossRef]
  22. Togami, M.; Abe, N.; Kitahashi, T.; Ogawa, H. On the application of a machine learning technique to fault diagnosis of power distribution lines. IEEE Trans. Power Deliv. 1995, 10, 1927–1936. [Google Scholar] [CrossRef]
  23. Min, F.; Yaling, L.; Xi, Z.; Huan, C.; Yaqian, H.; Libo, F.; Qing, Y. Fault prediction for distribution network based on CNN and LightGBM algorithm. In Proceedings of the 2019 14th IEEE International Conference on Electronic Measurement & Instruments (ICEMI), Changsha, China, 1–3 November 2019; pp. 1020–1026. [Google Scholar] [CrossRef]
  24. Ngaopitakkul, A.; Pothisarn, C.; Bunjongjit, S.; Suechoey, B. An Application of Discrete Wavelet Transform and Support Vector Machines Algorithm for Classification of Fault Types on Underground Cable. In Proceedings of the 2012 Third International Conference on Innovations in Bio-Inspired Computing and Applications, Kaohsiung, Taiwan, 26–28 September 2012; pp. 85–88. [Google Scholar] [CrossRef]
  25. Apisit, C.; Ngaopitakkul, A. Identification of Fault Types for Underground Cable using Discrete Wavelet Transform. In Proceedings of the International MultiConference of Engineers and Computer Scientists, Hong Kong, China, 17–19 March 2010; pp. 1262–1266. [Google Scholar]
  26. Oliveira, A.; Leitão, A.; Carvalho, L.; Dias, L.; Guimarães, L.; Ribeiro, M. Data-driven methodology to predict distribution lines failure location. In Proceedings of the CIRED 2021—The 26th International Conference and Exhibition on Electricity Distribution, online, 21–23 September 2021; pp. 580–584. [Google Scholar] [CrossRef]
  27. Prasad, P.S.; Rao, B.P. LBP-HF features and machine learning applied for automated monitoring of insulators for overhead power distribution lines. In Proceedings of the 2016 International Conference on Wireless Communications, Signal Processing and Networking (WiSPNET), Chennai, India, 23–26 March 2016; pp. 808–812. [Google Scholar] [CrossRef]
  28. Bharata Reddy, M.J.; Chandra, B.K.; Mohanta, D.K. A DOST based approach for the condition monitoring of 11 kV distribution line insulators. IEEE Trans. Dielectr. Electr. Insul. 2011, 18, 588–595. [Google Scholar] [CrossRef]
  29. Reddy, M.J.B.; Chandra, B.K.; Mohanta, D.K. Condition monitoring of 11 kV distribution system insulators incorporating complex imagery using combined DOST-SVM approach. IEEE Trans. Dielectr. Electr. Insul. 2013, 20, 664–674. [Google Scholar] [CrossRef]
  30. Murthy, V.S.; Tarakanath, K.; Mohanta, D.K.; Gupta, S. Insulator condition analysis for overhead distribution lines using combined wavelet support vector machine (SVM). IEEE Trans. Dielectr. Electr. Insul. 2010, 17, 89–99. [Google Scholar] [CrossRef]
  31. Prasad, S. Review on Machine Vision based Insulator Inspection Systems for Power Distribution System. J. Eng. Sci. Technol. Rev. 2016, 9, 135–141. [Google Scholar] [CrossRef]
  32. Ibrahim, A.; Dalbah, A.; Abualsaud, A.; Tariq, U.; El-Hag, A. Application of Machine Learning to Evaluate Insulator Surface Erosion. IEEE Trans. Instrum. Meas. 2020, 69, 314–316. [Google Scholar] [CrossRef]
  33. IEC 60587:2022; Electrical Insulating Materials Used under Severe Ambient Conditions—Test Methods for Evaluating Resistance to Tracking and Erosion, Edition 4. International Electrotechnical Commission: London, UK, 2022.
  34. Stefenon, S.F.; Branco, N.W.; Nied, A.; Bertol, D.W.; Finardi, E.C.; Sartori, A.; Meyer, L.H.; Grebogi, R.B. Analysis of training techniques of ANN for classification of insulators in electrical power systems. IET Gener. Transm. Distrib. 2020, 14, 1591–1597. [Google Scholar] [CrossRef]
  35. Sopelsa Neto, N.F.; Stefenon, S.F.; Meyer, L.H.; Bruns, R.; Nied, A.; Seman, L.O.; Gonzalez, G.V.; Leithardt, V.R.Q.; Yow, K.-C. A Study of Multilayer Perceptron Networks Applied to Classification of Ceramic Insulators Using Ultrasound. Appl. Sci. 2021, 11, 1592. [Google Scholar] [CrossRef]
  36. Frizzo Stefenon, S.; Zanetti Freire, R.; dos Santos Coelho, L.; Meyer, L.H.; Bartnik Grebogi, R.; Gouvêa Buratto, W.; Nied, A. Electrical Insulator Fault Forecasting Based on a Wavelet Neuro-Fuzzy System. Energies 2020, 13, 484. [Google Scholar] [CrossRef]
  37. Aghay Kaboli, S.H.; Al Hinai, A.; Al-Badi, A.; Charabi, Y.; Al Saifi, A. Prediction of Metallic Conductor Voltage Owing to Electromagnetic Coupling Via a Hybrid ANFIS and Backtracking Search Algorithm. Energies 2019, 12, 3651. [Google Scholar] [CrossRef]
  38. Khafaf, N.A.; El-Hag, A. Bayesian regularization of neural network to predict leakage current in a salt fog environment. IEEE Trans. Dielectr. Electr. Insul. 2018, 25, 686–693. [Google Scholar] [CrossRef]
  39. Dey, U.; Chandra, M.; Das, S. Insulator Contamination Diagnosis using Unsupervised Machine Learning. In Proceedings of the 2022 3rd International Conference for Emerging Technology (INCET), Belgaum, India, 27–29 May 2022; pp. 1–6. [Google Scholar] [CrossRef]
  40. Abubakar Mas’ud, A.; Stewart, B.G.; McMeekin, S.G.; Nesbitt, A. An ensemble Neural Network for recognizing PD patterns. In Proceedings of the 45th International Universities Power Engineering Conference UPEC2010, Cardiff, UK, 31 August–3 September 2010; pp. 1–6. [Google Scholar]
  41. Mas’ud, A.A.; Albarracín, R.; Ardila-Rey, J.A.; Muhammad-Sukki, F.; Illias, H.A.; Bani, N.A.; Munir, A.B. Artificial Neural Network Application for Partial Discharge Recognition: Survey and Future Directions. Energies 2016, 9, 574. [Google Scholar] [CrossRef]
  42. Corso, M.P.; Perez, F.L.; Stefenon, S.F.; Yow, K.-C.; García Ovejero, R.; Leithardt, V.R.Q. Classification of Contaminated Insulators Using k-Nearest Neighbors Based on Computer Vision. Computers 2021, 10, 112. [Google Scholar] [CrossRef]
  43. Maan, J.; Singh, S. Transformer Failure Analysis: Reasons and Methods. Int. J. Eng. Res. Technol. 2016, 4, 1. [Google Scholar]
  44. Youssef, M.M.; Ibrahim, R.A.; Desouki, H.; Moustafa, M.M.Z. An Overview on Condition Monitoring & Health Assessment Techniques for Distribution Transformers. In Proceedings of the 2022 6th International Conference on Green Energy and Applications (ICGEA), Singapore, 4–6 March 2022; pp. 187–192. [Google Scholar] [CrossRef]
  45. Abu-Siada, A.; Islam, S. A new approach to identify power transformer criticality and asset management decision based on dissolved gas-in-oil analysis. IEEE Trans. Dielectr. Electr. Insul. 2012, 19, 1007–1012. [Google Scholar] [CrossRef]
  46. Qiming, C.; Wen, T. Comparative study on three kinds of transformer fault diagnosis method. Power Syst. Technol. 2006, 10, 423–425. [Google Scholar] [CrossRef]
  47. Jian, Z.; Jing, L.; Xiaofang, Z. Four ratio method in the application of the transformer overheating fault judgment. Transformer 2011, 48, 66–67. [Google Scholar]
  48. Alvarez Quiñones, L.I.; Lozano-Moncada, C.A.; Bravo Montenegro, D.A. Machine learning for predictive maintenance scheduling of distribution transformers. J. Qual. Maint. Eng. 2023, 29, 188–202. [Google Scholar] [CrossRef]
  49. Bravo, M.D.A.; Lozano, C.; Alvarez, L. Dataset of Distribution Transformers at Cauca Department (Colombia). Mendeley Data 2021, 4. [Google Scholar] [CrossRef]
  50. Kabir, F.; Foggo, B.; Yu, N. Data Driven Predictive Maintenance of Distribution Transformers. In Proceedings of the 2018 China International Conference on Electricity Distribution (CICED), Tianjin, China, 17–19 September 2018; pp. 312–316. [Google Scholar] [CrossRef]
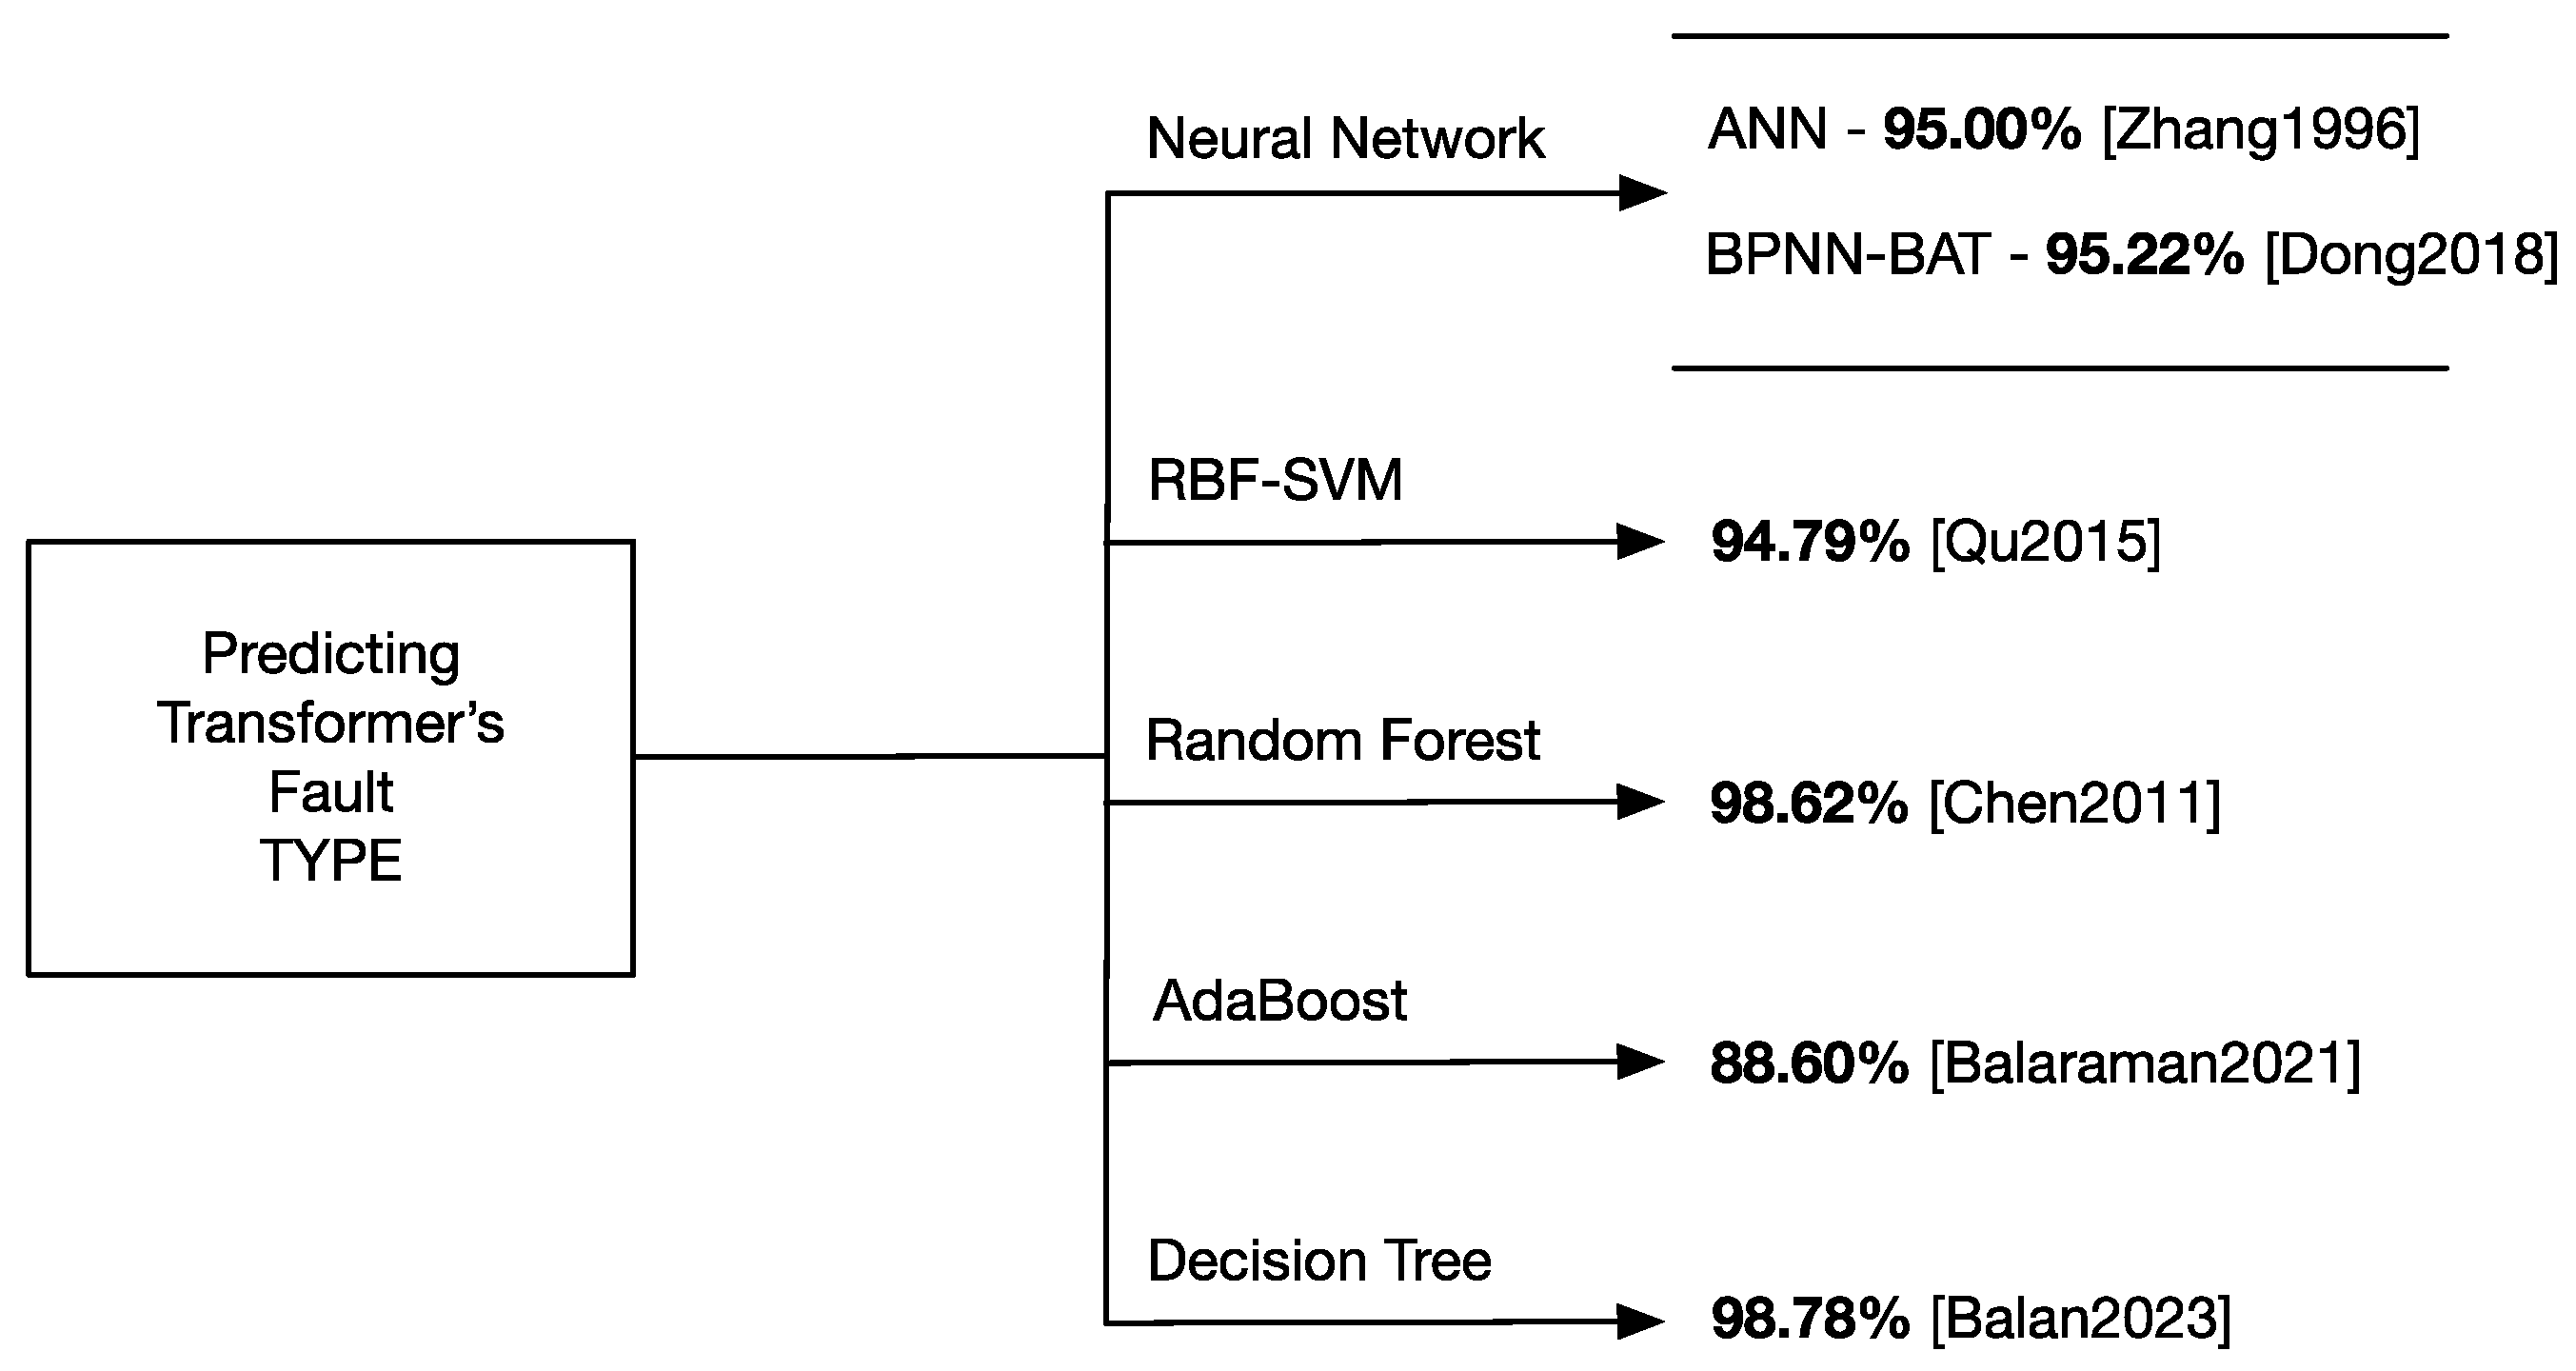
  51. Qu, L.; Zhou, H. The Multi-class SVM Is Applied in Transformer Fault Diagnosis. In Proceedings of the 2015 14th International Symposium on Distributed Computing and Applications for Business Engineering and Science (DCABES), Guiyang, China, 18–24 August 2015; pp. 477–480. [Google Scholar] [CrossRef]
  52. Sahoo, S.; Chowdary, K.V.V.S.R.; Das, S. DGA and AI Technique for Fault Diagnosis in Distribution Transformer. In Advances in Smart Grid and Renewable Energy, Proceedings of the ETAEERE 2020, Bhubaneswar, India, 5–6 March 2021; Lecture Notes in Electrical Engineering; Sherpa, K.S., Bhoi, A.K., Kalam, A., Mishra, M.K., Eds.; Springer: Singapore, 2021; p. 691. [Google Scholar] [CrossRef]
  53. Zhang, Y.; Ding, Y.; Liu, Y.; Griffin, P.J. An artificial neural network approach to transformer fault diagnosis. IEEE Trans. Power Deliv. 1996, 11, 1836–1841. [Google Scholar] [CrossRef]
  54. Dong, H.; Yang, X.; Li, A. A Novel Method for Power Transformer Fault Diagnosis Based on Bat-BP Algorithm. In Proceedings of the 2018 International Conference on Sensing, Diagnostics, Prognostics, and Control (SDPC), Xi’an, China, 15–17 August 2018; pp. 566–569. [Google Scholar] [CrossRef]
  55. Yang, X.S. A new metaheuristic bat-inspired algorithm, Nature Inspired Cooperative Strategies for Optimization (NICSO 2010). In Studies in Computational Intelligence; González, J.R., Pelta, D.A., Cruz, C., Terrazas, G., Krasnogor, N., Eds.; Springer: Berlin/Heidelberg, Germany, 2010; Volume 284, pp. 65–74. [Google Scholar] [CrossRef]
  56. Farag, A.S.; Mohandes, M.; Al-Shaikh, A. Diagnosing failed distribution transformers using neural networks. IEEE Trans. Power Deliv. 2001, 16, 631–636. [Google Scholar] [CrossRef]
  57. Chen, X.; Cui, H.; Luo, L. Fault Diagnosis of Transformer Based on Random Forest. In Proceedings of the 2011 Fourth International Conference on Intelligent Computation Technology and Automation, Shenzhen, China, 28–29 March 2011; pp. 132–134. [Google Scholar] [CrossRef]
  58. Balaraman, S.; Madavan, R.; Vedhanayaki, S.; Saroja, S.; Srinivasan, M.; Stonier, A.A. Fault Diagnosis and Asset Management of Power Transformer Using Adaptive Boost Machine Learning Algorithm. In IOP Conference Series: Materials Science and Engineering; IOP Publishing: Bristol, UK, 2021; Volume 1055, p. 012133. [Google Scholar] [CrossRef]
  59. Balan, A.; Srujan, T.L.; Manitha, P.V.; Deepa, K. Detection and Analysis of Faults in Transformer using Machine Learning. In Proceedings of the 2023 International Conference on Intelligent Data Communication Technologies and Internet of Things (IDCIoT), Bengaluru, India, 5–7 January 2023; pp. 477–482. [Google Scholar] [CrossRef]
  60. Abu-Elanien, A.E.B.; Salama, M.M.A.; Ibrahim, M. Determination of transformer health condition using artificial neural networks. In Proceedings of the 2011 International Symposium on Innovations in Intelligent Systems and Applications, Istanbul, Turkey, 5–18 June 2011; pp. 1–5. [Google Scholar] [CrossRef]
  61. Jaiswal, G.C.; Ballal, M.S.; Tutakne, D.R. ANN based methodology for determination of distribution transformer health status. In Proceedings of the 2017 7th International Conference on Power Systems (ICPS), Shivajinagar, India, 21–23 December 2017; pp. 133–138. [Google Scholar] [CrossRef]
  62. Duarte, L.J.; Pinheiro, A.P.; Ferreira, D.O. A Real-Time Method to Estimate the Operational Condition of Distribution Transformers. Energies 2022, 15, 8716. [Google Scholar] [CrossRef]
  63. Quynh, K.D.; Tran, T.; Roose, L. Machine learning for assessing the service transformer health using an energy monitor device. IOSR J. Electr. Electron. Eng. 2020, 15, 1–6. [Google Scholar]
  64. Cho, S.; May, G.; Tourkogiorgis, I.; Perez, R.; Lazaro, O.; de La Maza, B.; Kiritsis, D. A Hybrid Machine Learning Approach for Predictive Maintenance in Smart Factories of the Future. In Advances in Production Management Systems. Smart Manufacturing for Industry 4.0, Proceedings of the APMS 2018 IFIP Advances in Information and Communication Technology, Seoul, Republic of Korea, 26–30 August 2018; Moon, I., Lee, G., Park, J., Kiritsis, D., von Cieminski, G., Eds.; Springer: Cham, Switzerland, 2018; Volume 536, p. 536. [Google Scholar] [CrossRef]
  65. Xie, S.; Xue, F.; Zhang, W.; Zhu, J. Data-Driven Predictive Maintenance Policy Based on Dynamic Probability Distribution Prediction of Remaining Useful Life. Machines 2023, 11, 923. [Google Scholar] [CrossRef]
  66. Wen, Y.; Rahman, M.F.; Xu, H.; Tseng, T.-L.B. Recent advances and trends of predictive maintenance from data-driven machine prognostics perspective. Measurement 2022, 187, 110276. [Google Scholar] [CrossRef]
  67. Cinar, E. A Sensor Fusion Method Using Transfer Learning Models for Equipment Condition Monitoring. Sensors 2022, 22, 6791. [Google Scholar] [CrossRef]
  68. THafeez, L.; Xu, G. Mcardle, Edge Intelligence for Data Handling and Predictive Maintenance in IIOT. IEEE Access 2021, 9, 49355–49371. [Google Scholar] [CrossRef]
  69. Zhong, D.; Xia, Z.; Zhu, Y.; Duan, J. Overview of predictive maintenance based on digital twin technology. Heliyon 2023, 9, e14534. [Google Scholar] [CrossRef] [PubMed]
  70. Qiu, S.; Cui, X.; Ping, Z.; Shan, N.; Li, Z.; Bao, X.; Xu, X. Deep Learning Techniques in Intelligent Fault Diagnosis and Prognosis for Industrial Systems: A Review. Sensors 2023, 23, 1305. [Google Scholar] [CrossRef] [PubMed]
  71. Li, Z.; Kristoffersen, E.; Li, J. Deep transfer learning for failure prediction across failure types. Comput. Ind. Eng. 2022, 172, 108521. [Google Scholar] [CrossRef]
  72. Walker, C.M.; Agarwal, W.; Lin, L.; Hall, A.C.; Hill, R.A.; Boring, R.L.; Mortenson, T.J.; Lybeck, N.J. Explainable Artificial Intelligence Technology for Predictive Maintenance; Technical Report INL/RPT-23-74159; Idaho National Laboratory (INL): Idaho Falls, ID, USA, 2023. [CrossRef]
Figure 1. Scatter plot of X1 versus Y1 and X2 versus Y2.
Information 15 00037 g001
Figure 2. The trade-off between squared bias (red) and variance (blue); MSE is shown by black curve and dashed line shows V a r ϵ , based on [9].
Information 15 00037 g002
Figure 3. Mind map of different parametric and nonparametric ML algorithms.
Information 15 00037 g003
Figure 4. Different parametric and nonparametric techniques used for predicting transformer fault types [51,53,54,57,58,59].
Information 15 00037 g004
Figure 5. Types of faults covered in the survey in the context of faults in the three essential components of distribution systems. Legend for references; Distribution Lion: [A]—[20,22,23,24,25,26]; [B]—[13,14,15,16]; [C]—[17,18]; [D]—[19]; Insulator: [E]—[27,28,30,34,35]; [F]—[29,32,34,35,36,42]; [G]—[38,39,41]; [H]—[40,41]; Transformer: [I]—[60,61,62,63]; [J]—[45,52,53,54,56,58]; [K]—[51,52,53,54,58]; [L]—[50]; [M]—[51,52,53,54,58].
Information 15 00037 g005
Table 1. Different causes of failure and faults in distribution lines.
Common Causes of
Distribution Line Failure
Machine Learning Algorithms
(P—Parametric, NP—Nonparametric)
Weather [13,14]
Lightning flashover rate [15,16]
Linear and quadratic regression model (P)
ANN (P)
Bagging ensemble classifier–support vector machines (SVM)m (P)
Vegetation [17,18]Regression (P)
Artificial neural network (ANN) (P)
Decision trees (NP)
Random forest (NP)
Animal [19]Neural network-AdaBoost (P)
Shunt fault [20]
Single line-to-ground fault (SLG) [21,24]
Line-to-line fault [22,24]
Double line-to-ground [24]
Three-phase fault [24]
ANN (P)
Fuzzy neural network, SVM (P)
Decision tress (NP), SVM (P)
SVM (P)
Table 2. Insulators and their applications.
InsulatorUsage
Pin InsulatorDistribution system
Suspension InsulatorOverhead transmission lines
Strain InsulatorOverhead transmission system
Shackle InsulatorOverhead distribution system
Post-InsulatorSubstation
Stay InsulatorDistribution lines
Disc InsulatorBoth transmission and distribution lines
Table 4. Fault types and failures of transformers [43].
Factors/ComponentsTypes of Failure/Faults
Age factorWearout failure
Weather/externalLightning strike
Overloading
Short circuit
Switching
Transportation
CoreDC magnetisation
Core deformation
Ungrounded or multiple grounding
WindingShort circuit due to low oil level or hotspot creation
Open circuit
Transient overvoltage due to wrong connection
Buckling
TankRupture due to internal arcing
Excessive corrosion
Oil leakage
InsulationWater accumulation and thermal degradation of oil/paper
Aging of oil/paper
BushingElectrical flashover
Short circuit due to damage or material
Thermal expansion
Transformer oilOil contamination
Short circuit due to failure of oil insulation
Table 5. Transformer health assessment and condition-monitoring techniques [43].
TechniquesTypesDetecting
Chemical diagnostic techniquesDissolved gas analysis (DGA)
Physical and chemical tests of oil quality
Evolving damages (implicit faults)
Insulating liquid degradation
Electrical diagnostic techniquesPartial Discharge test (PD)
Short-circuit impedance (SCI)
Frequency Response Analysis (FRA)
To monitor insulation condition for bushing, HV and LV insulation, and inter-turn insulation.
Mechanical defects in transformer windings.
Winding deformation and displacement
Miscellaneous techniques(1) Signal-based techniques
-
Vibration analysis;
-
Optical fibers;
-
Acoustic emission;
-
Thermography.
(2) Data-based techniques
-
Health index;
-
Finite element analysis.
Aging assessment and provide online monitoring capability.
Assessing the health condition of transformers using statistical and mathematical analysis.
Table 6. Transformer failure analysis and different ML algorithms.
Fault Diagnosis and Health AssessmentMachine Learning Algorithm
Due to burning [48]
Aging infrastructure [50]
Low-energy discharge [51,52,54,56,58]
High-energy discharge [51,52,53,54,58]
High- and low-temperature overheating fault [51,52,53,54,58]
Corona [52,53]
Overloading, lightning, switching, short circuit, transportation [56]
Health index [60,61,62,63]
SVM (P)
Random forest, AdaBoost (NP)
SVM, ANN (P)
Decision tree, kNN, AdaBoost (NP)
SVM, ANN (P)
Decision tree, kNN, AdaBoost (NP)
SVM, ANN (P)
Decision tree, kNN, AdaBoost (NP)
SVM, ANN (P)
ANN (N)
SVM, ANN (P)
Decision tree, kNN, random forest (NP)
Table 7. Summarized overview of parametric and nonparametric ML algorithms mentioned in Section 3.
ApplicationParametric ML AlgorithmsReferenceNonparametric ML AlgorithmsReference
Distribution LinesFault
analysis and
prediction
Linear regression,
artificial neural network (ANN),
simple support vector machine (SVM)
[13,14]
[15,16]
[17,18]
[19,20]
[21,24]
Decision tree,
random forest,
LightGBM,
XGBoost
[18,22]
[23,26]
InsulatorsCondition monitoringSimple support vector machine (SVM) [27,29]
[30,31]
Adaptive neuro-fuzzy inference system (ANFIS)[28,29]
[31]
Fault
analysis
Artificial neural network (ANN),
convolutional neural network (CNN),
multilayer perceptron (MLP) network
[32,34]
[35,40]
[41]
Adaptive neuro-fuzzy inference system (ANFIS),
nonlinear autoregressive,
k-means clustering,
k-nearest neighbors,
decision tree
[36,38]
[39,42]
TransformersFault and failure analysisSupport vector machine (SVM),
artificial neural network (ANN),
logistic regression
[48,52]
[53,54]
[56,57]
[58,59]
Random forest.
AdaBoost,
RBF SVM,
decision tree,
k-nearest neighbors (kNN),
bagging and boosting ensemble
[50,51]
[57,58]
[59]
Condition monitoringArtificial neural network (ANN),
support vector machine (SVM)
[60,61]
[63]
k-nearest neighbors (kNN),
decision tree,
random forest
[62,63]
Disclaimer/Publisher’s Note: The statements, opinions and data contained in all publications are solely those of the individual author(s) and contributor(s) and not of MDPI and/or the editor(s). MDPI and/or the editor(s) disclaim responsibility for any injury to people or property resulting from any ideas, methods, instructions or products referred to in the content.

