
Rapid Forecasting of Cyber Events Using Machine Learning-Enabled Features


Abstract
1. Introduction
Our Contributions
- Perform time series resampling based on original big data to make sure we have an equal sample for forecasting and intrusions.
- Perform and evaluate time series forecasting based on linear regression, SMOreg and LSTM.
- Evaluate the performance of the forecasted events using the metrics MAE and RSME.
- Use time-series data to forecast cyber attack events within a specified period.
2. Related Work
2.1. Intrusion Detection
2.2. Forecasting and Predictions
2.2.1. ARIMA
2.2.2. Linear Regression and SMOreg
2.2.3. Deep Learning
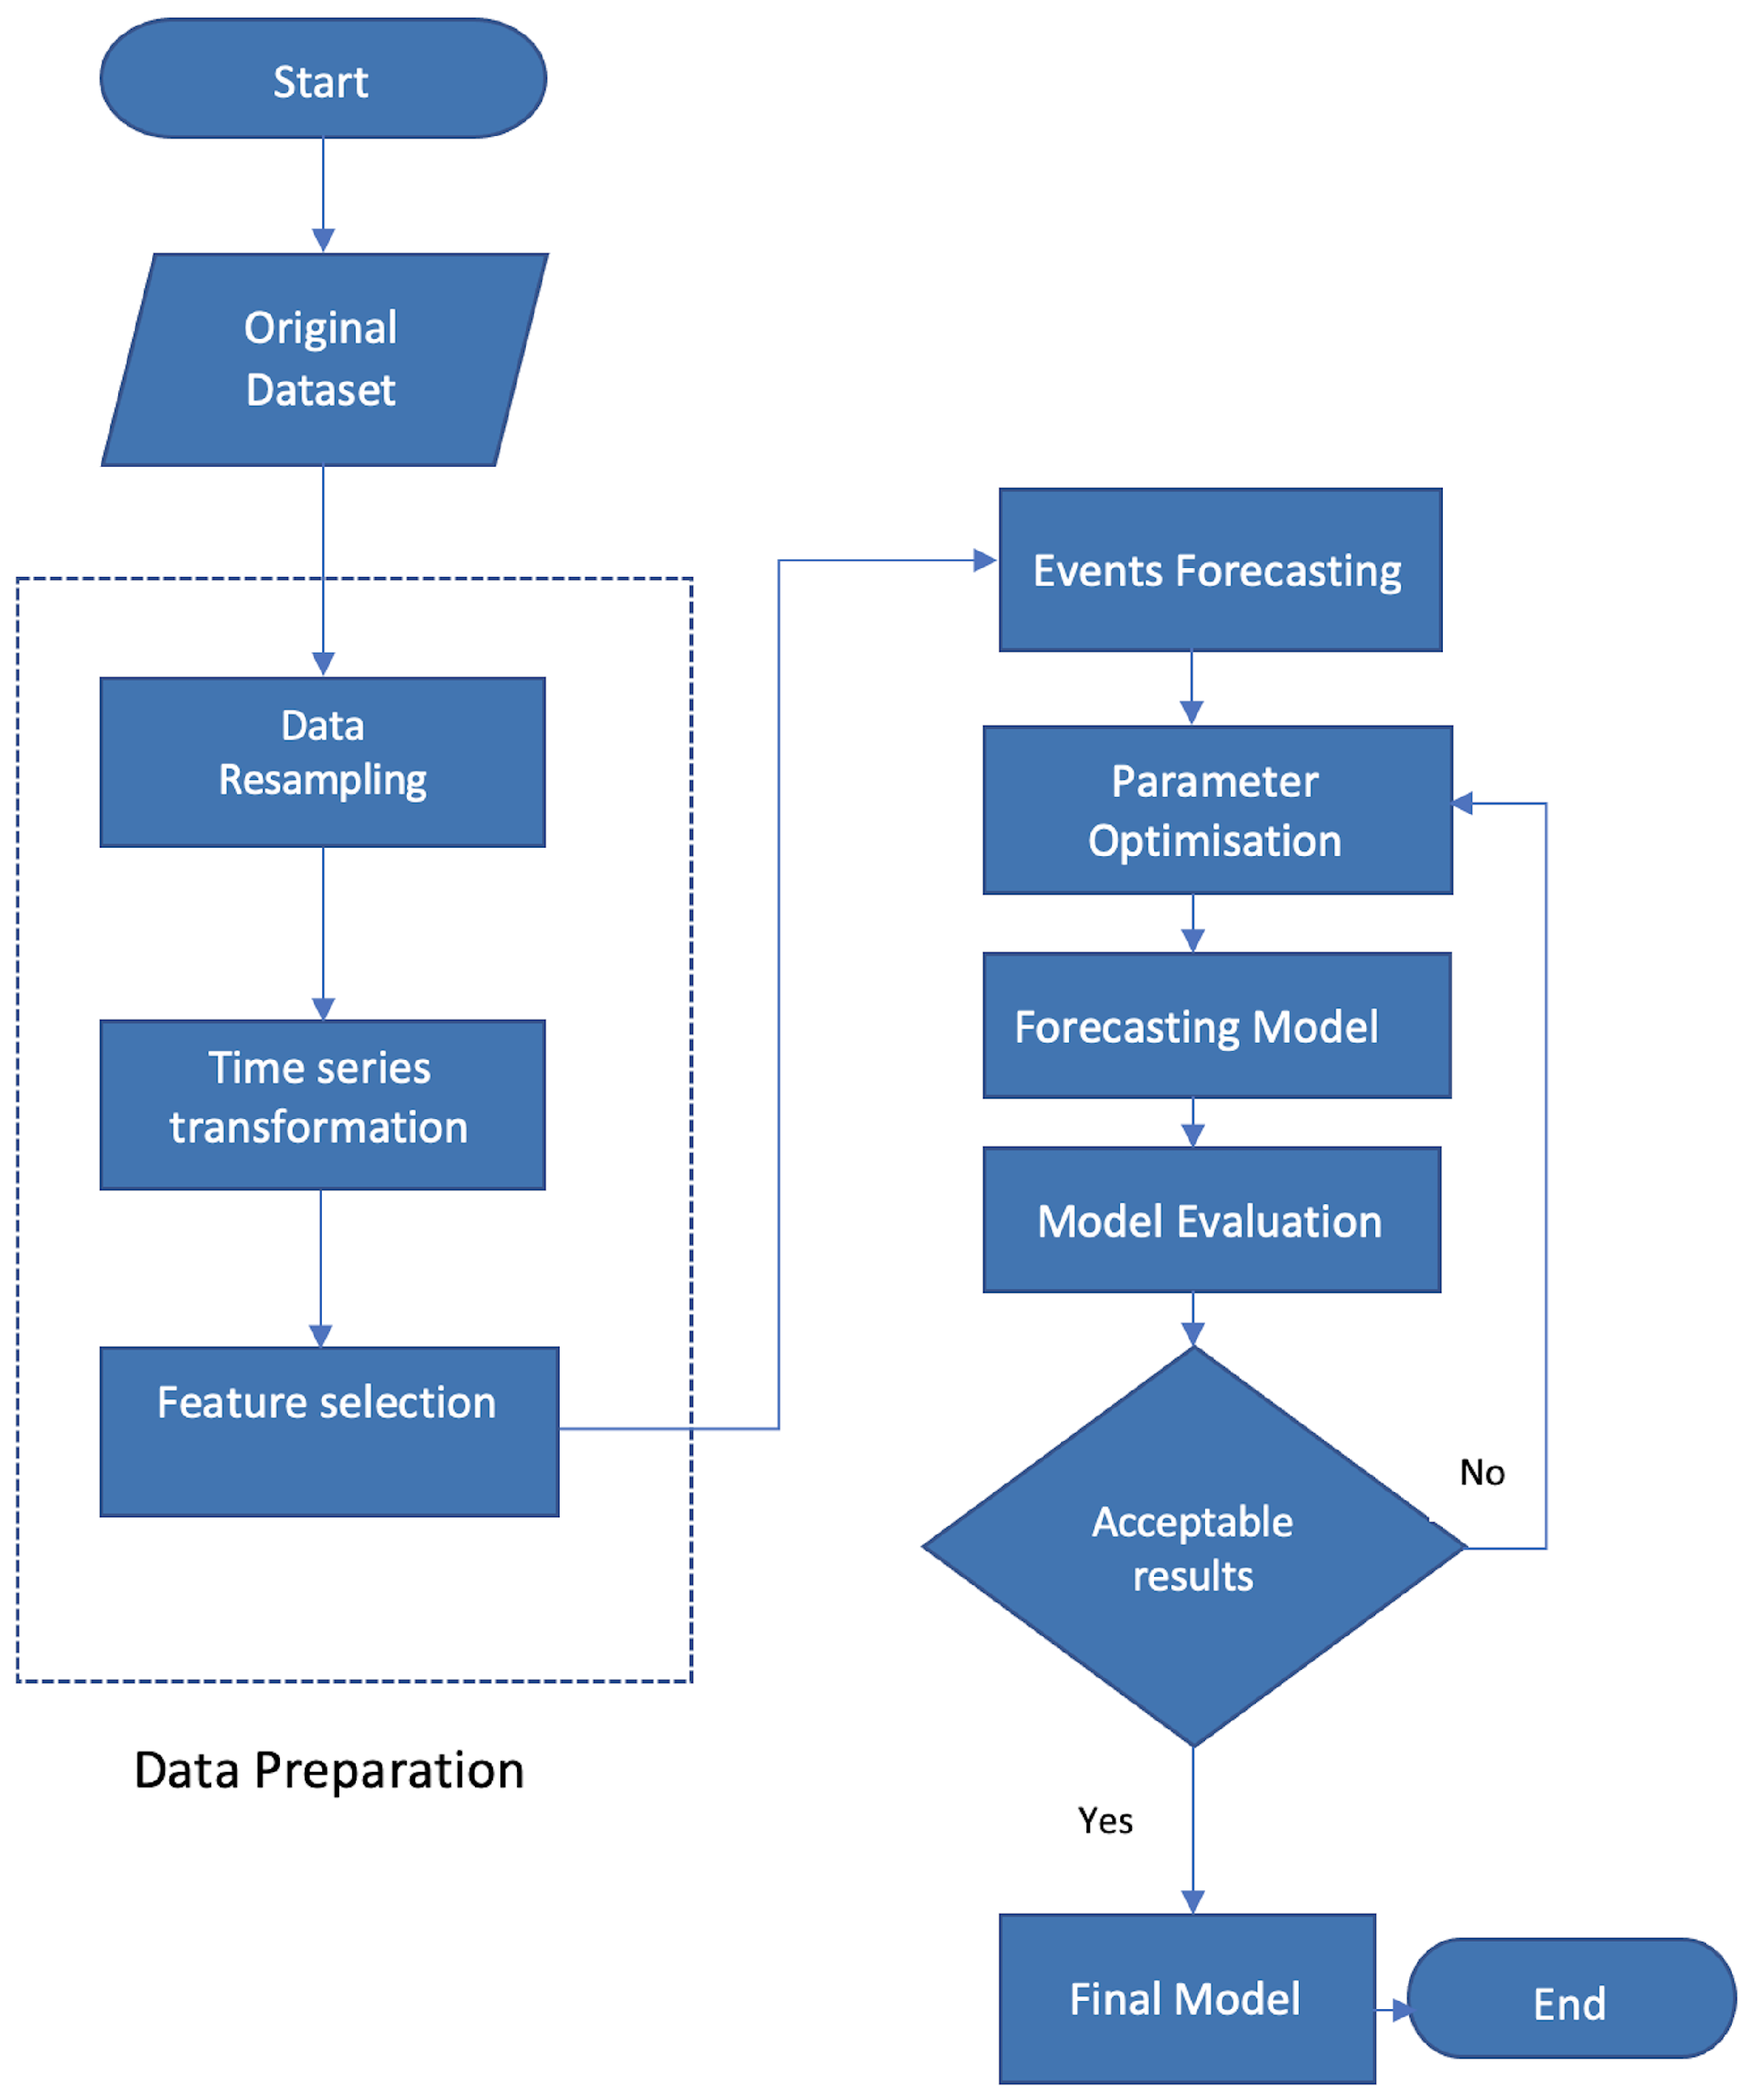
3. Proposed Cyber Event Forecasting Model
3.1. Data Preparation
3.2. Attack Classification
3.3. Feature Selection
4. Experiment Setup
4.1. Experiment Overview
4.2. Baseline Classification
4.2.1. Classification with Forecasted Values
4.2.2. Performance Comparison between Baseline and Forecasted Data
4.3. Time Series Resampling and Forecasted Events
4.4. Time Series Forecasting Parameters
5. Performance Evaluations
5.1. Performance Metrics
5.2. Mean Absolute Error (MAE)
5.3. Root Mean Square Error (RMSE)
5.4. Analysis of the Results
6. Conclusions and Future Work
Author Contributions
Funding
Data Availability Statement
Conflicts of Interest
References
- Constantin, L. Technical Report, CSO Online. 2020. Available online: https://www.csoonline.com/article/3601508/solarwinds-supply-chain-attack-explained-why-organizations-were-not-prepared.html (accessed on 21 February 2023).
- Dina, A.S.; Siddique, A.; Manivannan, D. A deep learning approach for intrusion detection in Internet of Things using focal loss function. Internet Things 2023, 22, 100699. [Google Scholar] [CrossRef]
- Tang, L.; Li, J.; Du, H.; Li, L.; Wu, J.; Wang, S. Big Data in Forecasting Research: A Literature Review. Big Data Res. 2022, 27, 100289. [Google Scholar] [CrossRef]
- Almahmoud, Z.; Yoo, P.D.; Alhussein, O.; Farhat, I.; Damiani, E. A holistic and proactive approach to forecasting cyber threats. Sci. Rep. 2023, 13, 8049. [Google Scholar] [CrossRef] [PubMed]
- IBM. Cost of a Data Breach 2022. IBM. 2022. Available online: https://www.ibm.com/reports/data-breach (accessed on 11 February 2023).
- Ghafir, I.; Hammoudeh, M.; Prenosil, V.; Han, L.; Hegarty, R.; Rabie, K.; Aparicio-Navarro, F.J. Detection of advanced persistent threat using machine-learning correlation analysis. Future Gener. Comput. Syst. 2018, 89, 349–359. [Google Scholar] [CrossRef]
- Milajerdi, S.M.; Gjomemo, R.; Eshete, B.; Sekar, R.; Venkatakrishnan, V. Holmes: Real-time apt detection through correlation of suspicious information flows. In Proceedings of the 2019 IEEE Symposium on Security and Privacy (SP), Francisco, CA, USA, 19–23 May 2019; IEEE: Piscataway, NJ, USA, 2019; pp. 1137–1152. [Google Scholar]
- Ahmed, Y.; Asyhari, A.; Rahman, M.A. A Cyber Kill Chain Approach for Detecting Advanced Persistent Threats. Comput. Mater. Contin. 2021, 67, 2497–2513. [Google Scholar] [CrossRef]
- Laxminarayana, N.; Mishra, N.; Tiwari, P.; Garg, S.; Behera, B.K.; Farouk, A. Quantum-Assisted Activation for Supervised Learning in Healthcare-based Intrusion Detection Systems. IEEE Trans. Artif. Intell. 2022, 1–8. [Google Scholar] [CrossRef]
- Gao, Y.; Chen, J.; Miao, H.; Song, B.; Lu, Y.; Pan, W. Self-Learning Spatial Distribution-Based Intrusion Detection for Industrial Cyber-Physical Systems. IEEE Trans. Comput. Soc. Syst. 2022, 9, 1693–1702. [Google Scholar] [CrossRef]
- Abdel Wahab, O. Intrusion Detection in the IoT Under Data and Concept Drifts: Online Deep Learning Approach. IEEE Internet Things J. 2022, 9, 19706–19716. [Google Scholar] [CrossRef]
- Werner, G.; Okutan, A.; Yang, S.; McConky, K. Forecasting Cyberattacks as Time Series with Different Aggregation Granularity. In Proceedings of the 2018 IEEE International Symposium on Technologies for Homeland Security (HST), Woburn, MA, USA, 23–24 October 2018; IEEE: Piscataway, NJ, USA, 2018; pp. 1–7. [Google Scholar]
- Khandpur, R.P.; Ji, T.; Jan, S.; Wang, G.; Lu, C.T.; Ramakrishnan, N. Crowdsourcing cybersecurity: Cyber attack detection using social media. In Proceedings of the 2017 ACM on Conference on Information and Knowledge Management, Singapore, 6–10 November 2017; pp. 1049–1057. [Google Scholar]
- Hammouchi, H.; Mezzour, G.; Ghogho, M.; El Koutbi, M. Predicting probing rate severity by leveraging twitter sentiments. In Proceedings of the 2019 15th International Wireless Communications & Mobile Computing Conference (IWCMC), Tangier, Morocco, 24–28 June 2019; IEEE: Piscataway, NJ, USA, 2019; pp. 883–888. [Google Scholar]
- Goyal, P.; Hossain, K.; Deb, A.; Tavabi, N.; Bartley, N.; Abeliuk, A.; Ferrara, E.; Lerman, K. Discovering signals from web sources to predict cyber attacks. arXiv 2018, arXiv:1806.03342. [Google Scholar]
- Tang, M.; Alazab, M.; Luo, Y.; Donlon, M. Disclosure of cyber security vulnerabilities: Time series modelling. Int. J. Electron. Secur. Digit. Forensics 2018, 10, 255–275. [Google Scholar] [CrossRef]
- CSE-CIC. A Realistic Cyber Defense Dataset (CSE-CIC-IDS2018). Technical Report, CSE-CIC. 2018. Available online: https://registry.opendata.aws/cse-cic-ids2018 (accessed on 21 February 2022).
- Ahmad, Z.; Shahid Khan, A.; Wai Shiang, C.; Abdullah, J.; Ahmad, F. Network intrusion detection system: A systematic study of machine learning and deep learning approaches. Trans. Emerg. Telecommun. Technol. 2021, 32, e4150. [Google Scholar] [CrossRef]
- Zeek. Zeek an Open Source Network Security Monitoring Tool. Available online: https://zeek.org (accessed on 31 March 2023).
- Snort. Snort Network Intrusion Detection. Available online: https://www.snort.org (accessed on 23 June 2023).
- Devan, P.; Khare, N. An efficient XGBoost—DNN-based classification model for network intrusion detection system. Neural Comput. Appl. 2020, 32, 12499–12514. [Google Scholar] [CrossRef]
- Gurung, S.; Ghose, M.K.; Subedi, A. Deep learning approach on network intrusion detection system using NSL-KDD dataset. Int. J. Comput. Netw. Inf. Secur. 2019, 11, 8–14. [Google Scholar] [CrossRef]
- Divyasree, T.; Sherly, K. A network intrusion detection system based on ensemble CVM using efficient feature selection approach. Procedia Comput. Sci. 2018, 143, 442–449. [Google Scholar] [CrossRef]
- Splunk. Turn Data into Doing. Available online: https://www.splunk.com (accessed on 31 March 2022).
- Open Source HIDS. Available online: https://www.ossec.net (accessed on 31 March 2022).
- Deshpande, P.; Sharma, S.C.; Peddoju, S.K.; Junaid, S. HIDS: A host based intrusion detection system for cloud computing environment. Int. J. Syst. Assur. Eng. Manag. 2018, 9, 567–576. [Google Scholar] [CrossRef]
- Bulle, B.B.; Santin, A.O.; Viegas, E.K.; dos Santos, R.R. A host-based intrusion detection model based on OS diversity for SCADA. In Proceedings of the IECON 2020 The 46th Annual Conference of the IEEE Industrial Electronics Society, Singapore, 18–21 October 2020; pp. 691–696. [Google Scholar]
- Chawla, A.; Lee, B.; Fallon, S.; Jacob, P. Host based intrusion detection system with combined CNN/RNN model. In Proceedings of the Joint European Conference on Machine Learning and Knowledge Discovery in Databases; Springer: Dublin, Ireland, 2018; pp. 149–158. [Google Scholar]
- Yu, J.; Tao, D.; Lin, Z. A hybrid web log based intrusion detection model. In Proceedings of the 2016 4th International Conference on Cloud Computing and Intelligence Systems (CCIS), Beijing, China, 17–19 August 2016; IEEE: Piscataway, NJ, USA, 2016; pp. 356–360. [Google Scholar]
- Otoum, Y.; Nayak, A. As-ids: Anomaly and signature based ids for the internet of things. J. Netw. Syst. Manag. 2021, 29, 1–26. [Google Scholar] [CrossRef]
- Shurman, M.M.; Khrais, R.M.; Yateem, A.A. IoT denial-of-service attack detection and prevention using hybrid IDS. In Proceedings of the 2019 International Arab Conference on Information Technology (ACIT), Al Ain, United Arab Emirates, 3–5 December 2019; IEEE: Piscataway, NJ, USA, 2019; pp. 252–254. [Google Scholar]
- Ullah, S.; Khan, M.A.; Ahmad, J.; Jamal, S.S.; e Huma, Z.; Hassan, M.T.; Pitropakis, N.; Buchanan, W.J. HDL-IDS: A hybrid deep learning architecture for intrusion detection in the Internet of Vehicles. Sensors 2022, 22, 1340. [Google Scholar] [CrossRef] [PubMed]
- Singh, V.K.; Govindarasu, M. Cyber Kill Chain-Based Hybrid Intrusion Detection System for Smart Grid. In Wide Area Power Systems Stability, Protection, and Security; Springer: Berlin/Heidelberg, Germany, 2021; pp. 571–599. [Google Scholar]
- Intrusion Detection Dataset. Available online: https://www.unb.ca/cic/datasets (accessed on 31 March 2022).
- Traffic Data from Kyoto University’s Hotspots. Available online: http://www.takakura.com/Kyoto_data (accessed on 31 March 2022).
- The UNSW-NB15 Dataset. Available online: https://research.unsw.edu.au/projects/unsw-nb15-dataset (accessed on 31 March 2022).
- Nagaraj, P.; Krishna, P.S.; Sai, P.S. Forecasting Cyber Attacks Using Machine Learning. J. Optoelectron. Laser 2022, 41, 550–556. [Google Scholar]
- Sadefo Kamdem, J.; Selambi, D. Cyber-Risk Forecasting Using Machine Learning Models and Generalized Extreme Value Distributions; Technical Report; HAL: Bengaluru, India, 2022. [Google Scholar]
- Deb, A.; Lerman, K.; Ferrara, E. Predicting cyber-events by leveraging hacker sentiment. Information 2018, 9, 280. [Google Scholar] [CrossRef]
- Shu, K.; Sliva, A.; Sampson, J.; Liu, H. Understanding cyber attack behaviors with sentiment information on social media. In Proceedings of the International Conference on Social Computing, Behavioral-Cultural Modeling and Prediction and Behavior Representation in Modeling and Simulation; Springer: Washington, DC, USA, 2018; pp. 377–388. [Google Scholar]
- Alrawi, O.; Ike, M.; Pruett, M.; Kasturi, R.P.; Barua, S.; Hirani, T.; Hill, B.; Saltaformaggio, B. Forecasting Malware Capabilities From Cyber Attack Memory Images. In Proceedings of the USENIX Security Symposium, Virtual, 11–13 August 2021; pp. 3523–3540. [Google Scholar]
- Husák, M.; Bartoš, V.; Sokol, P.; Gajdoš, A. Predictive methods in cyber defense: Current experience and research challenges. Future Gener. Comput. Syst. 2021, 115, 517–530. [Google Scholar] [CrossRef]
- Husák, M.; Komárková, J.; Bou-Harb, E.; Čeleda, P. Survey of attack projection, prediction, and forecasting in cyber security. IEEE Commun. Surv. Tutor. 2018, 21, 640–660. [Google Scholar] [CrossRef]
- Sun, N.; Zhang, J.; Rimba, P.; Gao, S.; Zhang, L.Y.; Xiang, Y. Data-driven cybersecurity incident prediction: A survey. IEEE Commun. Surv. Tutor. 2018, 21, 1744–1772. [Google Scholar] [CrossRef]
- Bashar, M.A.; Nayak, R. TAnoGAN: Time series anomaly detection with generative adversarial networks. In Proceedings of the 2020 IEEE Symposium Series on Computational Intelligence (SSCI), Canberra, Australia, 1–4 December 2020; IEEE: Piscataway, NJ, USA, 2020; pp. 1778–1785. [Google Scholar]
- Schmidl, S.; Wenig, P.; Papenbrock, T. Anomaly detection in time series: A comprehensive evaluation. Proc. VLDB Endow. 2022, 15, 1779–1797. [Google Scholar] [CrossRef]
- Roumani, Y.; Nwankpa, J.K.; Roumani, Y.F. Time series modeling of vulnerabilities. Comput. Secur. 2015, 51, 32–40. [Google Scholar] [CrossRef]
- Jain, G.; Mallick, B. A study of time series models ARIMA and ETS. Int. J. Mod. Educ. Comput. Sci. 2017, 4, 57–63. Available online: http://www.mecs-press.org (accessed on 30 May 2023). [CrossRef]
- Siami-Namini, S.; Namin, A.S. Forecasting economics and financial time series: ARIMA vs. LSTM. arXiv 2018, arXiv:1803.06386. [Google Scholar]
- Werner, G.; Yang, S.; McConky, K. Time series forecasting of cyber attack intensity. In Proceedings of the 12th Annual Conference on Cyber and Information Security Research, Oak Ridge, TN, USA, 4–6 April 2017; pp. 1–3. [Google Scholar]
- Liu, H.; Jiang, R.; Zhou, B.; Rong, X.; Li, J.; Li, A. A Survey of Cyber Security Approaches for Prediction. In Proceedings of the 2021 IEEE Sixth International Conference on Data Science in Cyberspace (DSC), ShenZhen, China, 9–11 October 2021; IEEE: Piscataway, NJ, USA, 2021; pp. 439–444. [Google Scholar]
- Soundarya, C.; Usha, S. Analyzing and Predicting Cyber Hacking with Time Series Models. Int. J. Res. Eng. Sci. Manag. 2020, 3, 1–8. [Google Scholar]
- Valipour, M. Long-term runoff study using SARIMA and ARIMA models in the United States. Meteorol. Appl. 2015, 22, 592–598. [Google Scholar] [CrossRef]
- Kumari, K.; Yadav, S. Linear regression analysis study. J. Pract. Cardiovasc. Sci. 2018, 4, 33. [Google Scholar] [CrossRef]
- Gabralla, L.A.; Abraham, A. Prediction of oil prices using bagging and random subspace. In Proceedings of the Fifth International Conference on Innovations in Bio-Inspired Computing and Applications IBICA 2014, Ostrava, Czech Republic, 23–25 June 2014; pp. 343–354. [Google Scholar]
- Coşkun, M.; Yildirim, Ö.; Ayşegül, U.; Demir, Y. An overview of popular deep learning methods. Eur. J. Tech. (EJT) 2017, 7, 165–176. [Google Scholar] [CrossRef]
- Nedeljkovic, D.; Jakovljevic, Z. CNN based method for the development of cyber-attacks detection algorithms in industrial control systems. Comput. Secur. 2022, 114, 102585. [Google Scholar] [CrossRef]
- Zhang, M.; Xu, B.; Bai, S.; Lu, S.; Lin, Z. A deep learning method to detect web attacks using a specially designed CNN. In Proceedings of the Neural Information Processing: 24th International Conference, ICONIP 2017, Guangzhou, China, 14–18 November 2017; Springer: Cham, Switzerland, 2017; pp. 828–836, Proceedings, Part V 24. [Google Scholar]
- Akhtar, M.S.; Feng, T. Detection of Malware by Deep Learning as CNN-LSTM Machine Learning Techniques in Real Time. Symmetry 2022, 14, 2308. [Google Scholar] [CrossRef]
- Li, Y.; Lu, Y. LSTM-BA: DDoS detection approach combining LSTM and Bayes. In Proceedings of the 2019 Seventh International Conference on Advanced Cloud and Big Data (CBD), Suzhou, China, 21–22 September 2019; IEEE: Piscataway, NJ, USA, 2019; pp. 180–185. [Google Scholar]
- Dey, A. Deep IDS: A deep learning approach for Intrusion detection based on IDS 2018. In Proceedings of the 2020 2nd International Conference on Sustainable Technologies for Industry 4.0 (STI), Dhaka, Bangladesh, 19–20 December 2020; IEEE: Piscataway, NJ, USA, 2020; pp. 1–5. [Google Scholar]
- Farhan, R.I.; Abeer, T.; Nidaa, F. Performance analysis of flow-based attacks detection on CSE-CIC-IDS2018 dataset using deep learning. Indones. J. Electr. Eng. Comput. Sci. 2020, 20, 16–27. [Google Scholar] [CrossRef]
- Ben Fredj, O.; Mihoub, A.; Krichen, M.; Cheikhrouhou, O.; Derhab, A. CyberSecurity attack prediction: A deep learning approach. In Proceedings of the 13th International Conference on Security of Information and Networks, Istanbul, Turkey, 4–6 November 2020; pp. 1–6. [Google Scholar]
- Farahnakian, F.; Heikkonen, J. A deep auto-encoder based approach for intrusion detection system. In Proceedings of the 2018 20th International Conference on Advanced Communication Technology (ICACT), Chuncheon-si, Gangwon-do, Republic of Korea, 11–14 February 2018; IEEE: Piscataway, NJ, USA, 2018; pp. 178–183. [Google Scholar]
- Aminanto, M.E.; Choi, R.; Tanuwidjaja, H.C.; Yoo, P.D.; Kim, K. Deep abstraction and weighted feature selection for Wi-Fi impersonation detection. IEEE Trans. Inf. Forensics Secur. 2017, 13, 621–636. [Google Scholar] [CrossRef]
- Chai, T.; Draxler, R.R. Root mean square error (RMSE) or mean absolute error (MAE). Geosci. Model Dev. Discuss. 2014, 7, 1525–1534. [Google Scholar]


| Classifier | Accuracy Score (%) | FAR (%) | Precision (%) | Recall (%) | F-Measure (%) |
|---|---|---|---|---|---|
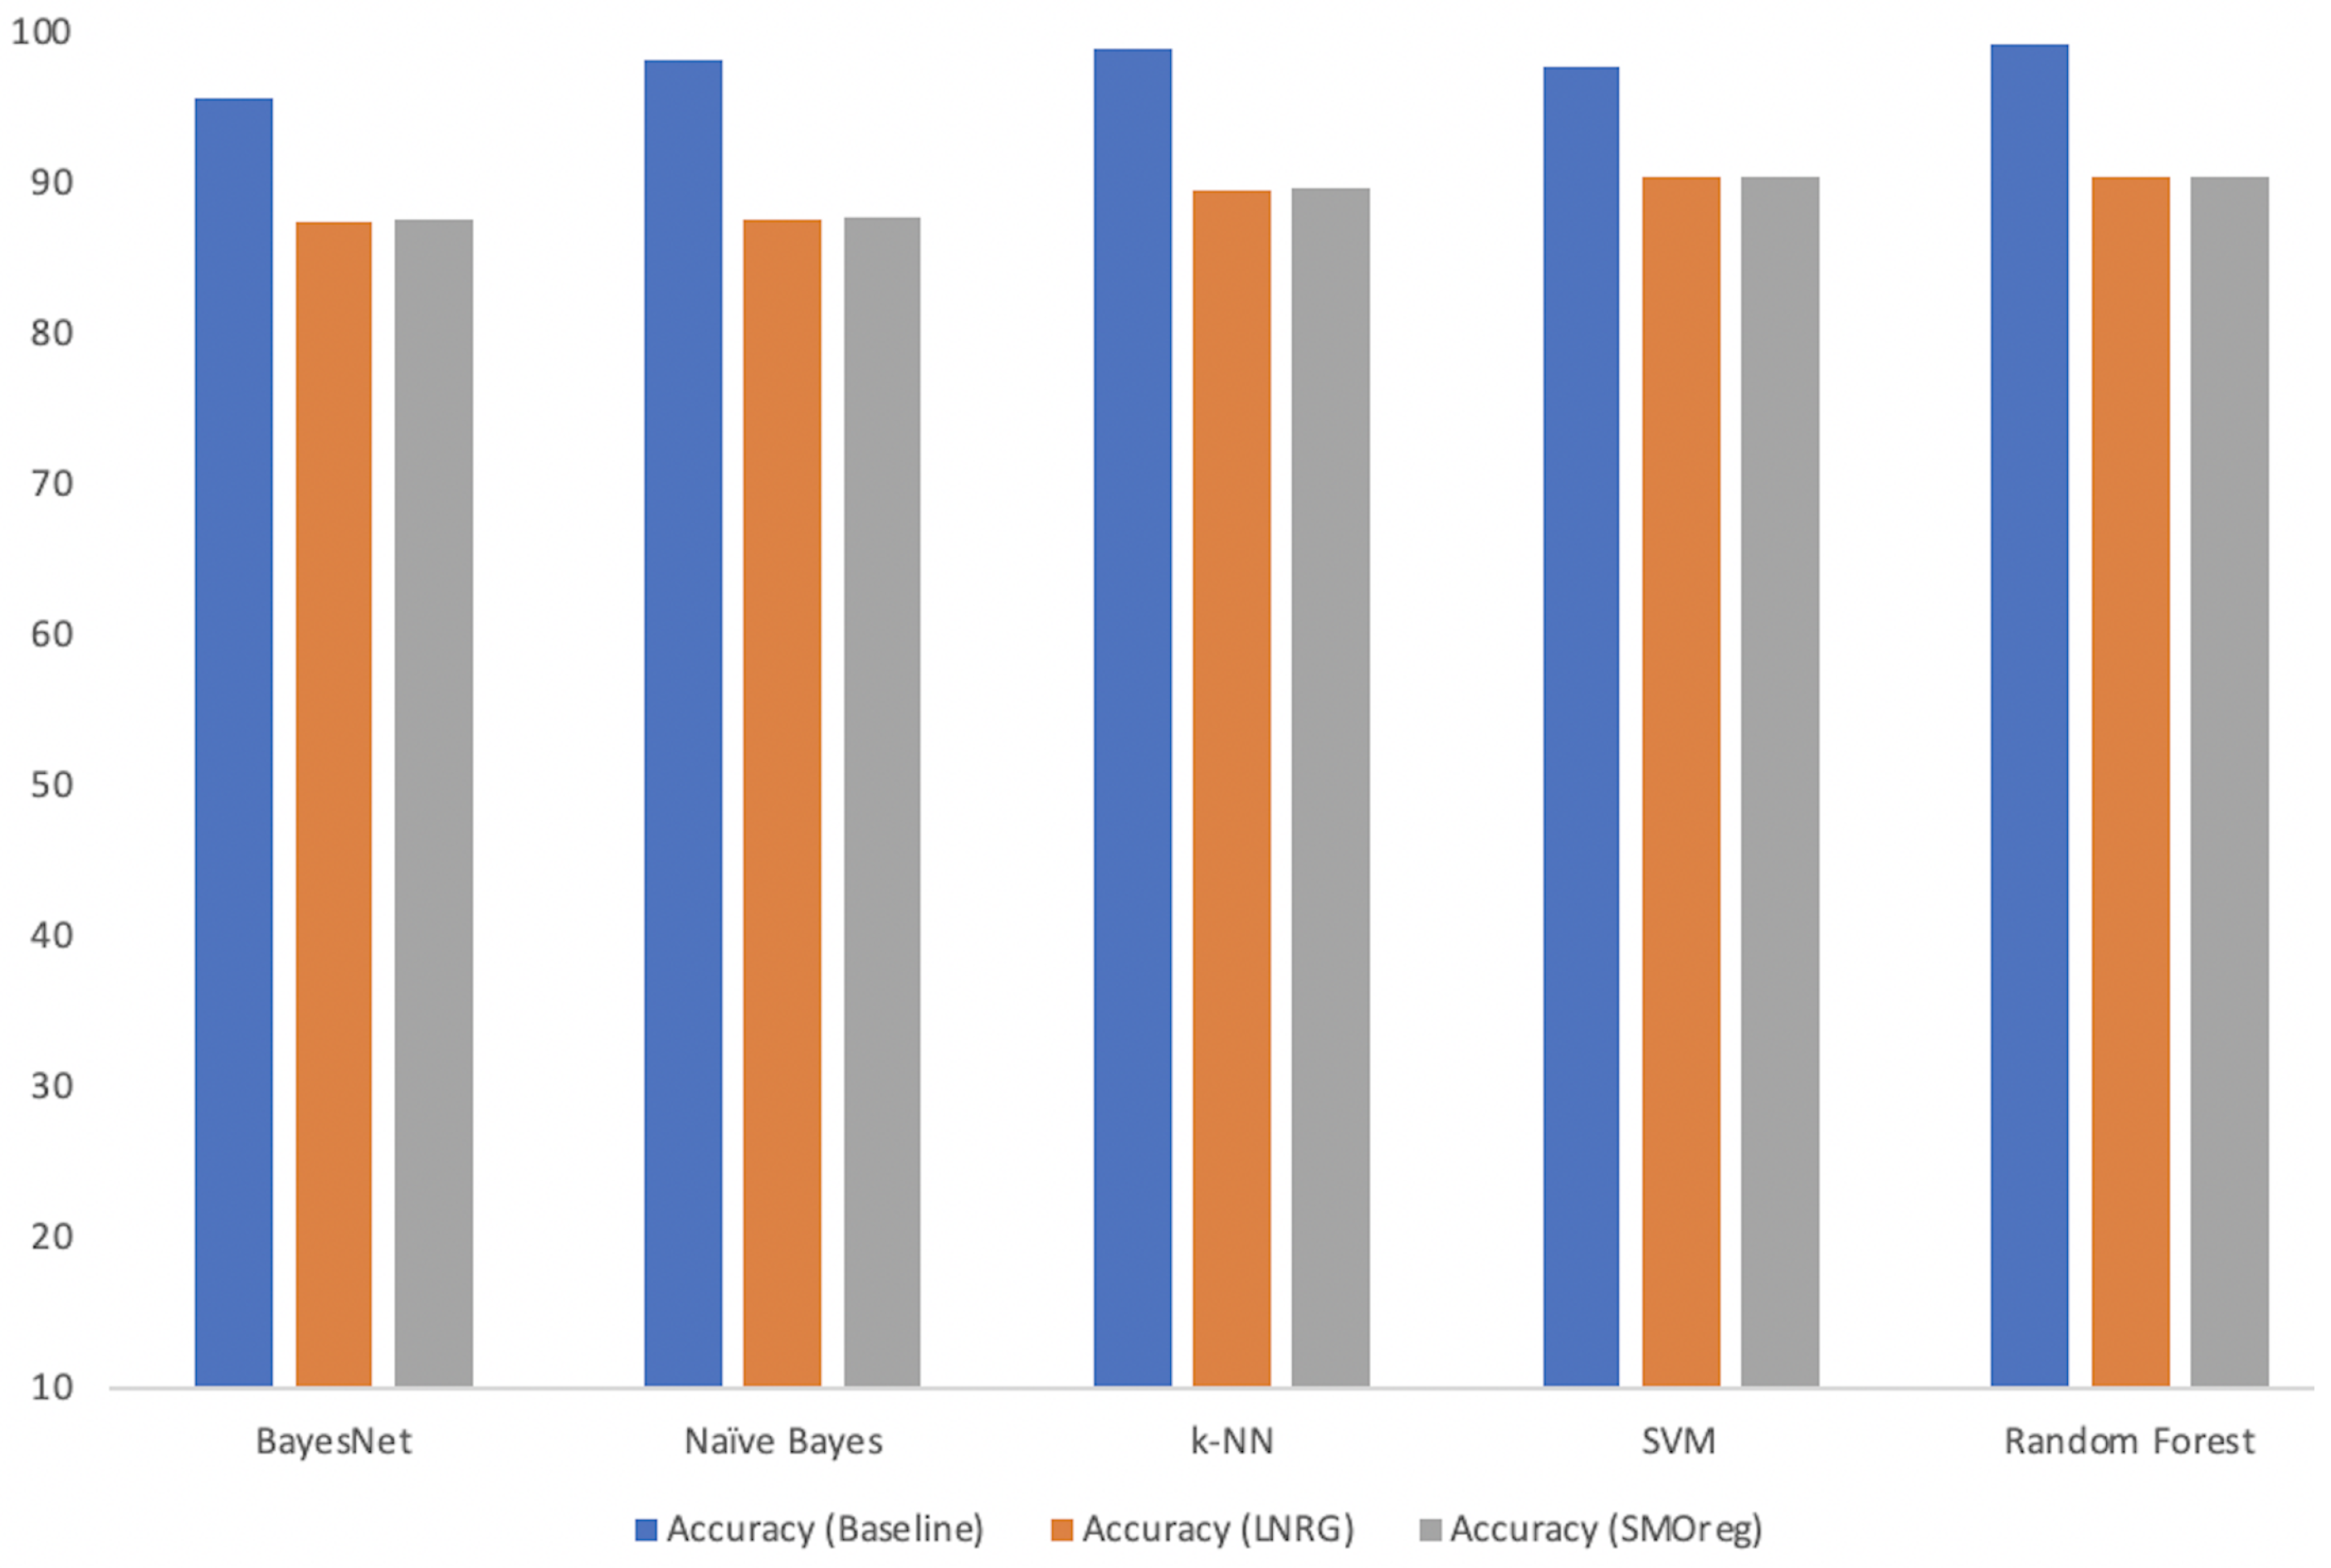
| BayesNet | 95.5% | 0.5 | 96.9 | 95.5 | 95.8 |
| Naive Bayes | 98.1 | 0.2 | 98.4 | 98.1 | 98.2 |
| k-NN | 98.9 | 0.1 | 98.9 | 98.9 | 98.9 |
| SMO | 97.7 | 0.5 | 97.9 | 97.7 | 97.8 |
| Random Forest | 99.2 | 0.1 | 99.3 | 99.2 | 99.3 |
| Base Learner | Classifier | Accuracy Score (%) | FAR (%) | Precision (%) | Recall (%) | F-Measure (%) |
|---|---|---|---|---|---|---|
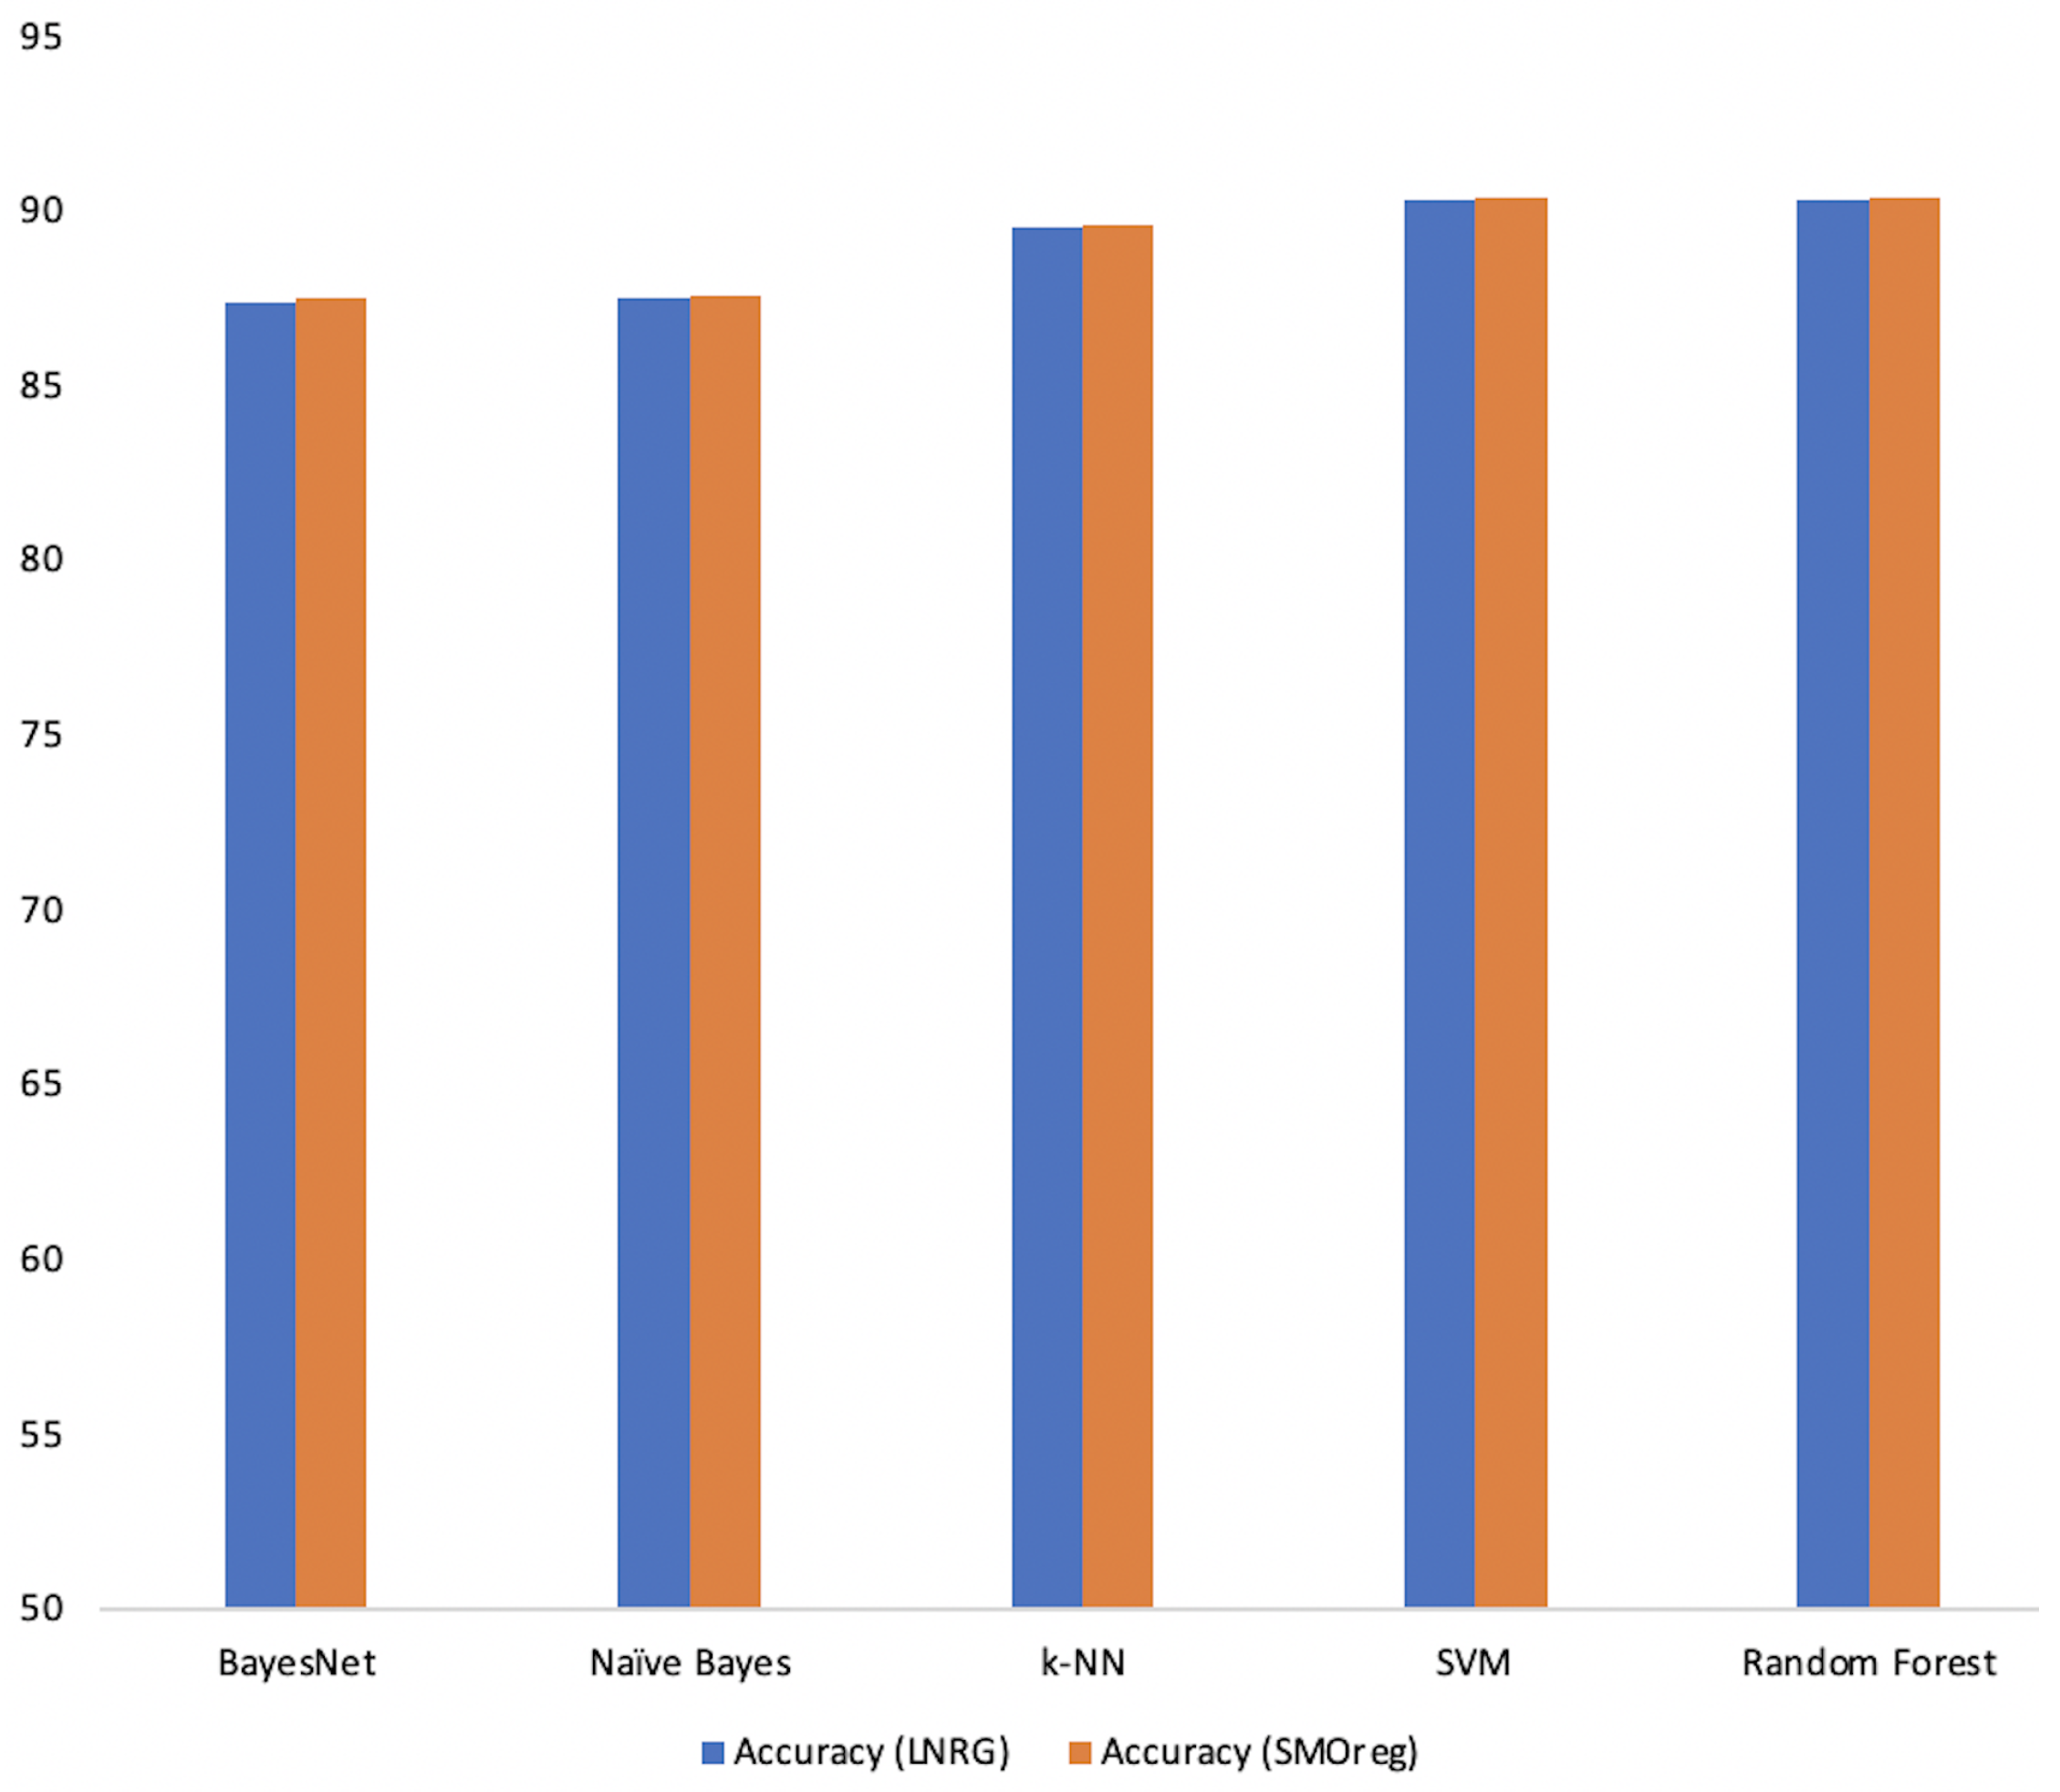
| LNRG | BayesNet | 87.4 | 1 | 86.5 | 87.4 | 86.3 |
| LNRG | Naive Bayes | 87.5 | 1 | 86.6 | 87.5 | 86.4 |
| LNRG | k-NN | 89.5 | 2 | 89.9 | 89.5 | 88 |
| LNRG | SVM | 90.3 | 2 | 91.3 | 90.3 | 88.9 |
| LNRG | Random Forest | 90.3 | 1 | 91.3 | 90.3 | 88.9 |
| Base Learner | Classifier | Accuracy Score (%) | FAR (%) | Precision (%) | Recall (%) | F-Measure (%) |
|---|---|---|---|---|---|---|
| SMOreg | BayesNet | 87.5 | 1 | 86.6 | 87.5 | 86.4 |
| SMOreg | Naive Bayes | 87.6 | 2 | 86.7 | 87.6 | 86.5 |
| SMOreg | k-NN | 89.6 | 2 | 90 | 89.6 | 88.1 |
| SMOreg | SVM | 90.4 | 2 | 91.3 | 90.4 | 89 |
| SMOreg | Random Forest | 90.4 | 1 | 91.3 | 90.4 | 89 |
| Target Feature | Linear Regression | SMOreg | LSTM |
|---|---|---|---|
| Tot Fwd Pkts | 0.0105 | 0.0038 | 2.6127 |
| Tot Bwd Pkts | 0.0034 | 0.0025 | 0.4981 |
| Pkt Len Min | 0.0002 | 0.008 | 0.0054 |
| Fwd Seg Size Min | 0.4912 | 0.0182 | 0.0494 |
| Subflow Bwd Byts | 0.718 | 0.7251 | 31.9957 |
| Target Feature | Linear Regression | SMOreg | LSTM |
|---|---|---|---|
| Tot Fwd Pkts | 0.0129 | 0.0045 | 2.8946 |
| Tot Bwd Pkts | 0.0039 | 0.003 | 0.5842 |
| Pkt Len Min | 0.0002 | 0.0096 | 0.0063 |
| Fwd Seg Size Min | 0.0198 | 0.8776 | 0.0497 |
| Subflow Bwd Byts | 0.8163 | 1.2969 | 35.0395 |
Disclaimer/Publisher’s Note: The statements, opinions and data contained in all publications are solely those of the individual author(s) and contributor(s) and not of MDPI and/or the editor(s). MDPI and/or the editor(s) disclaim responsibility for any injury to people or property resulting from any ideas, methods, instructions or products referred to in the content. |
© 2024 by the authors. Licensee MDPI, Basel, Switzerland. This article is an open access article distributed under the terms and conditions of the Creative Commons Attribution (CC BY) license (https://creativecommons.org/licenses/by/4.0/).
Share and Cite
Ahmed, Y.; Azad, M.A.; Asyhari, T. Rapid Forecasting of Cyber Events Using Machine Learning-Enabled Features. Information 2024, 15, 36. https://doi.org/10.3390/info15010036
Ahmed Y, Azad MA, Asyhari T. Rapid Forecasting of Cyber Events Using Machine Learning-Enabled Features. Information. 2024; 15(1):36. https://doi.org/10.3390/info15010036
Chicago/Turabian StyleAhmed, Yussuf, Muhammad Ajmal Azad, and Taufiq Asyhari. 2024. "Rapid Forecasting of Cyber Events Using Machine Learning-Enabled Features" Information 15, no. 1: 36. https://doi.org/10.3390/info15010036
APA StyleAhmed, Y., Azad, M. A., & Asyhari, T. (2024). Rapid Forecasting of Cyber Events Using Machine Learning-Enabled Features. Information, 15(1), 36. https://doi.org/10.3390/info15010036