Article

Information and Entropy Aspects of the Specifics of Regional Road Traffic Accident Rate in Russia

Department of Road Transport Operation, The Institute of Transport, Industrial University of Tyumen, 625027 Tyumen, Russia
Information 2023, 14(2), 138; https://doi.org/10.3390/info14020138
Submission received: 22 November 2022 / Revised: 7 February 2023 / Accepted: 14 February 2023 / Published: 20 February 2023

Abstract

:
The aim of this research is to study the specifics of the road accident rate formation processes in regions of the Russian Federation (2021) using information-entropic analysis. The typical research approaches (correlation-regression, factorial analyses, simulation modelling, etc.) do not always allow us to identify its specificity. It is impossible to evaluate the quality of the researched process’s structure using these methods. However, this knowledge is required to understand the distinctions between high-quality road safety management and its opposite. In order to achieve the goal of the research methodology based on the use of the classical approaches of C. Shannon, the quantitative value of information entropy H was elaborated. The key components of this method are the modelling of the cause-and-effect chain of road accident rate formation and the consideration of the relative significances of individual blocks of the process in achieving the final result. During the research the required statistical data were collected and the structure of the road accident rate formation process in 82 regions of the Russian Federation in the format “Population P—Fleet of vehicles NVh—Road Traffic Accidents NRA—RTA Victims NV—Fatality Cases ND” was analyzed. The fact that the structure of the road accident rate formation process is extremely specific in different Russian regions was shown. Exactly this specificity forms the degree of ambiguity in the state of Russian regional road safety provision systems in terms of the probability of death in road accidents. The main conclusion of this research is that information-entropic analysis can be successfully used to assess the structural quality of road safety systems.

1. Introduction

Large countries, including Russia, are characterized by a relatively low quality of system management [1,2,3]. This applies to a variety of aspects, including road safety (RS) management. The gigantic territory of the Russian Federation (more than 17 million km2) is divided into eight federal districts, uniting 85 subjects of the Federation (82 regions and three cities of federal status). Attempts to build a vertically integrated road safety management system in the Russian Federation are mainly expressed in the form of directive and regulatory legislation and its promotion from the level of the Federal Center to the regions. This practice is reinforced by total control by federal supervisory authorities (the Prosecutor’s Office and other organizations). Ultimately, in recent years (2010–2022) these measures can be recognized as more or less successful. The statistics on the road traffic accident rate and the dynamics of the indicators that characterize it confirm this assumption to a degree. Thus, over the past 10 years in Russia the value of Human Risk HR has decreased from HR2010 = 18.6 road traffic deaths/100,000 inhabitants down to HR2020 = 10.8 road traffic deaths/100,000 inhabitants or by 42% [4]. This is a good result, which, however, does not allow us to understand the essence of the processes behind it [5].
In order to understand the internal mechanisms for improving road safety in Russia, it is necessary to conduct a structural (information entropy) analysis of the very process of formation of the road traffic accident rate. Moreover, it is desirable to carry out this procedure not only in relation to a large system (the Russian Federation), but also in relation to its subsystems (82 regions and three cities of federal status) in order to identify specific regional features of the structure of the process.

1.1. Why Was Information-Entropic Analysis Chosen as a Tool for Studying the Features of the Road Traffic Accident Rate Formation?

The author chose the information entropy approach for solving the problems of analyzing the features of the processes of formation of the road traffic accident rate for two major reasons. Firstly, an analysis of the results of numerous research works on road safety [6,7,8] shows the ineffectiveness of building regression models of the type Y = f(X1, X2, …, Xm) [9,10,11]. This is easily explained: road safety, as a system property, is the result of hundreds, if not thousands [12,13], of reasons affecting system elements and the relations between them. At first glance, attempts to build relatively simple or more complex regression models are quite successful, but in the end, they are inoperable due to the low reliability of the process under study [14]. Secondly, a detailed analysis of the behaviour of any complex system sooner or later leads the researcher to the realization of the fact that even the simplest system model, with a certain formulation of the question, can be likened to models successfully used in thermodynamics [15]. On the other hand, as A. Ben-Naim [16] points out: “There is no other concept which was gravely misused, misapplied and in some instances, even abused”. Nevertheless, the author does not know a more effective way for a qualitative assessment of complex systems than using the information entropy approach.

1.2. Outline of the Article

The article is organized in seven Sections, as follows: Section 2 presents the results of the analysis of previously performed works directly or indirectly related to the topic of the article. Section 3 presents the problems of the research task and the simplest cause–effect chain of the process of formation of the road traffic accident rate. The original idea and objective of the study are also formulated here: “It is necessary to identify the specifics of the road traffic accident rate in 82 regions of the Russian Federation and do this using information entropy analysis”. Section 4 briefly presents the theoretical aspects of the quantitative assessment of the structural specifics of the regional road traffic accident rate in Russia. Section 5 contains information on the results of a study of the information entropy specifics of the regional road traffic accident rate in Russia (2021). Section 6 is devoted to a discussion of the informational meanings of uncertainty (chaoticity) of the processes of formation of the road traffic accident rate. The article ends with general conclusions, methodological recommendations on the use of information entropy analysis and a discussion of model variants of the processes of formation of the regional road traffic accident rate in Russia (Section 7).

1.3. Study’s Limitations

There are several important comments related to possible criticism about the quality of the statistical data used to characterize road traffic accidents in Russian regions. First, only official statistics of the Main Directorate for Traffic Safety [17] and the Federal State Statistics Service [18] were used in this paper. Second, it is well-known that official road accident rate data are not fully objective [19] and this observation applies to many countries [20]. Third, research by Russian experts devoted to the analysis of the objectivity of the official data of the Main Directorate for Traffic Safety on the indicators of the road accident rate have been examined in detail [21,22]. The final conclusions of these studies are controversial. The authors [21] claim that a multilayered (district–region–Federal District–Russian Federation) system of statistical characteristics accounting creates a 10–20% inaccuracy, but this error rate is systematic and it does not affect comparative (for different regions) conclusions. The authors of [22] are sure that the official Russian data on characteristics of road accident rate are underestimated; however, they do not prove it with statistical evaluations.
The summary is that only official state statistics data were used to assess the information-entropic aspects of the specifics of regional road accident rate in Russia (2021). The objectivity of these data can be doubted, but at the same time, the passive experiment assumes complete trust in official statistics [17,18].

2. Analysis of Previous Works

During the preparation of this article, an extensive analysis of the state of the issue was carried out. All analyzed information sources were classified into two groups—works of general philosophical content [23,24,25,26,27,28,29,30,31,32,33,34,35,36,37,38,39,40,41,42] and articles devoted to the use of entropy methods in assessing the quality of system structures [43,44,45,46,47,48,49,50,51,52].
In its modern interpretation, the high quality of process management or management of the functioning of complex systems is characterized by a low level of chaos of the processes and a high probability of finding a system at a certain, given state [53]. The probability of finding a system at a given state is a function of information entropy [54].
The concept of entropy has a complex history. It was first introduced by R. Clausius in thermodynamics in 1865 to determine the measure of irreversible dissipation of energy, the measure of deviation of a real process from an ideal one [55]. Over the next one hundred and fifty years, the concept of entropy has become widely used in various scientific fields. As M.M. Kostic points out in [56], “Entropy is the most used and often abused concept in science, but also in philosophy and society. Further confusions are produced by some attempts to generalize entropy with similar but not the same concepts in other disciplines. Von Neumann once remarked that “whoever uses the term “entropy” in a discussion always wins since no one knows what entropy really is, so in a debate one always has the advantage”.
Three giants of world science—E. Schrödinger [24], C. Shannon [25,26], and N. Wiener [27]—made an extremely significant contribution to the development of information science and formalized the concept of “information entropy”. C. Shannon in his works [25,26] studied the informational aspect of entropy in depth. E. Schrödinger [24], as Hegel’s dialectics obliges, introduced the antipodal concept of “negative entropy” or “negentropy” into use. In contrast to entropy’s measure of chaos, negentropy describes a degree of order, organization, and certainty. N. Wiener [27] linked the concepts of information and negentropy. In his book “Cybernetics” [27], he independently presented Wiener’s formula, which is only one minus sign away from Shannon’s information quantity formula.
Over the next 70 years (1950–2020), C. Shannon’s information theory and N. Wiener’s ideas of cybernetics became most widespread. Almost all the achievements of the fifth wave of innovation are based on the postulates of C. Shannon’s and N. Wiener’s theoretical developments. Accordingly, the development of entropy was embodied in the development of many author’s versions of entropy (A. Rényi’s entropy, C. Tsallis’s entropy, etc.).
An attempt to generalize various versions of entropies was made in the framework of [57], where the so-called Entropy Universe is presented. Shannon’s information entropy [25,26] occupies a central place in it. An in-depth analysis carried out by the authors of [57] showed that (in the period 1950–2020) the total number of references to Shannon’s information entropy in articles of peer-reviewed journals in Scopus was 34,751, which is almost 50% of the total number of references to 40 different types of entropy (70,495 in total).
An analysis of the use of entropy methods in assessing the quality of system structures has shown that this research subject is also actively developing [38,40,42,44,49,54]. The ideas of assessing the system quality are based on the postulate of the required rationality of the structure of system elements, the degree of which depends on their relative weight (i.e., on their significance for the system) within the system. Figure 1 shows the simplest example illustrating the idea of maximizing entropy in the case of equal weights of two components of the system. In this case, the system is characterized by the maximum level of chaos since system elements are equivalent in significance (system weight).
Entropy ideas for assessing the quality of system structures are implemented in various fields of knowledge [38,40,42,44,49,54]. The main idea of the above articles is that the entropy method is used to determine the weight of evaluation indices and establish a multi-level fuzzy synthetic evaluation model. This method will also be used in our case to identify the specifics of the road traffic accident rate in the regions of Russia.

3. Initial Idea and Problem Statement

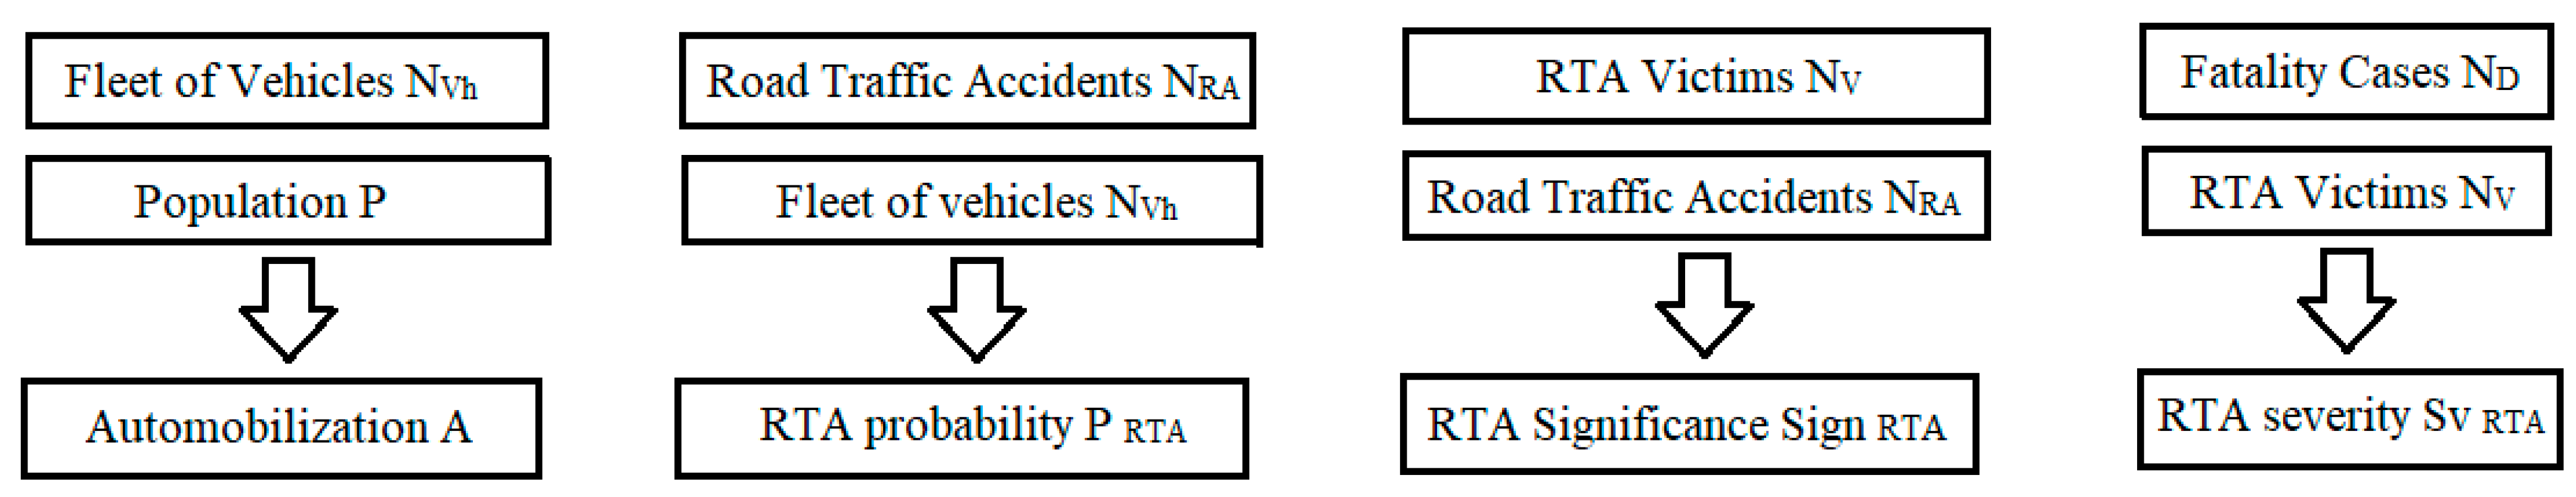
3.1. Cause–Effect Chain of the Process of the Road Traffic Accident Rate Formation

An information-structural analysis of a particular system process implies building a cause–effect chain, i.e., defining a set of information blocks related by a cause–effect relationship [58,59].
The road traffic accident rate, as one of the most negative results of the functioning of large transport systems, is characterised by the following simplest cause–effect chain (Figure 2).
The simplicity and identity of the cause–effect chain (Figure 2) to the studied information process of the road traffic accident rate formation is confirmed by the presence of a pronounced correlation between the blocks. Correlation analysis carried out in relation to 82 subjects of the Russian Federation made it possible to obtain the following correlation matrix of the relationship between regional values (2021) of the characteristics corresponding to the five blocks of the cause–effect chain (Figure 3, Table 1).
Table 1 represents numerical values r for the correlation matrix of the relation between the blocks of the cause–effect chain (Figure 3).
Cities of Russia of federal significance (Moscow, St. Petersburg, Sevastopol) are excluded from the analysis due to the informational specifics of the formation of the accident rate inherent in cities [60].
Even a simple visual analysis of the correlation matrix allows us to conclude that there is a statistical relationship between the variables (blocks of the studied cause–effect chain of the process of formation of the road traffic accident rate). However, the correlation regression analysis does not allow us to fully establish the regional specifics of this process. Thus, the information entropy analysis can help with this. The most important part of the information entropy analysis is the analysis of the structure of the process under study. This is why in the following sections much attention is paid to the specifics of the structure of the road traffic accident rate.

3.2. Initial Idea and Problem Statement

Back in 1949, R. Smeed, a father of motor transport science [61,62], proposed to evaluate the quality of state (regional) road safety systems using two specific characteristics—Human Risk HR (1) and Transport Risk TR (2).
H R = N D ( P / 100,000 ) , number of dead people in traffic accidents / 100,000 people .
H R = N D ( N V h / 100,000 ) , number of dead people in traffic accidents / 100,000 vehicles
where
  • ND—number of dead people in traffic accidents in year;
  • P—median size of population of country (region);
  • NVh—size of vehicle fleet.
It is clear that these characteristics are derived from the relation of the final fifth block of the cause–effect chain (Figure 2), Fatality Cases ND, to the first (Population P) and second (Fleet of vehicles NVh) blocks of the cause–effect chain. Continuing this logic, it is easy to come to the realization that there are two more important descriptive characteristics of the process that relate the final fifth block of the cause–effect chain (Figure 2), Fatality Cases ND, to the third (Road traffic accidents (RTA), NRA) and fourth (RTA victims NV) blocks. These are RTA significance (3) and RTA severity (4):
R T A   S i g n i f i c a n c e   ( S i g n R T A ) = N D N R A , number of dead people in one road traffic accident .
R T A   S e v e r i t y   ( S e v R T A ) = N D N V 100 % , % of the dead people from the number of victims .
where
  • NRA—number of road traffic accidents (RTA) in the country (region), accidents/year;
  • NV—number of victims of road traffic accidents in the country (region), people/year.
Figure 4 presents this logical relationship graphically.
K. Rumar wrote [63] that the population size and characteristics of the usage of the vehicle fleet on one hand and the possibility of death or injury in a road accident on the other hand are in a certain ratio. His papers convincingly show the primacy of the risk of injury and death in road accidents over any other excesses related to other types of transport. He is the author of the classification of road safety problematics. According to K. Rumar [63] all problems of road safety can be classified as:
(a)
explicit (first-order problems);
(b)
requiring serious analysis (second-order problems);
(c)
totally hidden (third-order problems).
According to author’s ideas [63] third-order problems block the solution of the first- and second-order problems but it is hard to reveal and identify them: “By third order (hidden) road safety problems are meant problems that do not become immediately obvious from studying the accident or injury statistics. These problems are often of a more general character, not dealing directly with the traffic situation but with underlying processes or conditions. These conditions may deal with the organization of road safety work such as central or distributed responsibilities, decision processes, resources, co-ordination and roles. They may also concern the management of the road safety such as the steering process of road safety work. They may concern the awareness, the values and knowledge of road safety measures that are typical for citizens in a society—decisions makers, road safety workers as well as roads users. Third order road safety problems prevent or block the possible solutions of the first and second order problems. An improvement of third order problems would facilitate the implementation of much of the knowledge we have today about effective countermeasures which for one reason or another are not implemented”.
Therefore, it makes sense to conduct a structural analysis of the road safety formation process. The toolkit of this study is an information-entropic analysis of the road accident rate formation process.
Let us build a correlation matrix (Figure 5, Table 2) of the relationship of four characteristics of the road traffic accident rate in the regions of Russia (2021)—HR, TR, RTA Significance (SignRTA), and RTA Severity (SevRTA).
Table 2 represents numerical values r for the correlation matrix of the relationships among four characteristics of the road traffic accident rate (Figure 5).
The statistical relationships among the characteristics of the road traffic accident rate (HR, TR, RTA Significance and RTA Severity) here (Figure 4) are much weaker than when assessing a similar relationship (Figure 3) between the blocks of the cause–effect chain “Population P—Fleet of vehicles NVh—Road Traffic Accidents NRA—RTA Victims NV—Fatality Cases ND” (Figure 2).
This has the following explanation: the corresponding specifics are determined by the internal structure of the information process, i.e., proportional relationships between the characteristics of adjacent blocks of the cause–effect chain (Figure 6).
These ratios are quite variable in different regions of such a large country as the Russian Federation. Thus, Automobilization A in the regions of Russia varies in the range A = [219.7; 696.5]; RTA probability P RTA in the range P RTA = [0.00058; 0.00649]; RTA significance Sign RTA in the range Sign RTA = [1.182; 1.849]; and RTA severity Sv RTA in the range Sv RTA = [5.15; 22.28]. The distributions of the values of the corresponding indicators in the regions of Russia (82 regions) are shown in Figure 7.
Perhaps we can note very wide ranges of values of all four indicators—A, P RTA, Sc RTA, Sv RTA—by 1.5…11 times. This variability is determined by the fact that a number of regions of the Russian Federation (no more than 12…15 in total) are characterized by very non-standard values of A, P RTA, Sc RTA and Sv RTA. Thus, the highest values of P RTA, Sc RTA, and Sv RTA were typical for such Russian regions as the Republic of Tuva and the Republic of Kalmykia. Non-standard values of P RTA, Sign RTA and Sv RTA were also typical for a number of North Caucasian regions (for example, for the Chechen Republic and the Republic of Ingushetia). Moreover, it is in these subjects of the Russian Federation that the minimum (for all regions of Russia) values of motorization A and the maximum values of RTA Severity Sv RTA are recorded. There is a kind of data imbalance—a discrepancy between regional specifics and the all-Russian situation.
Thus, we have come to the stage of stating the problem, which is formulated as follows: We need to identify the specifics of the road traffic accident rate in 82 regions of the Russian Federation using information entropy analysis. The results of the analysis of these specifics will allow optimization of the processes of road safety (RS) management in Russia by identifying “specific bottlenecks” in the cause–effect chain that characterizes the process of accident rate formation. This will allow the development and implementation in practice of special management approaches in the field of road safety adapted to the needs of specific regions of the country.

4. Theoretical Aspects of Quantitative Assessment of the Structural Specifics of the Regional Road Traffic Accident Rate in Russia

In the course of information analysis of the process of formation of the road traffic accident rate, aspects of the specifics of assessing information transformation are important. The transfer of information along the cause–effect chain (Figure 2) occurs with certain transformational changes [58,59]. This information transformation can be identified by the information transfer coefficient Ki (5):
K i = X i + 1 X i
where
  • Xi+1—the value of the characteristic of the subsequent block of the cause–effect chain of the process under study;
  • Xi—the value of the characteristic of the previous block of the cause–effect chain.
Table 3 elaborates on this approach.
Accordingly, K1 or KN determines the level of actual motorization in the region; K2 or KRA determines the probability of an average city resident being involved in an accident; K3 or KV characterizes the scale of the accident, i.e., the average number of victims per road accident; K4 or KD characterizes the severity of the accident, i.e., proportion of those killed in road accidents.
Let us build a correlation matrix of the statistical relationships between the coefficients of transformation of numerical information Ki: K1, K2, K3, K4 (Figure 8, Table 4).
Analysis of Figure 8 shows that the statistical relationships among the coefficients of transformation of numerical information K1, K2, K3, and K4 between the links in the cause–effect chain are very weak (R2 < 0.3). This is a sign of the serious specifics of the processes of formation of the road traffic accident rate in various regions of the Russian Federation.
Table 4 represents numerical values r for the relationships among the four coefficients of information transformation Ki of the cause–effect chain for the regions of Russia (2021) (Figure 8).
The values of the coefficients of transformation of numerical information Ki will determine the specifics of Shannon’s information entropy H [25,26] for specific regional road safety systems (6):
H = i = 1 n w i ln w i ,
where
  • n—number of information transmission links;
  • w i —weight coefficients, meeting the normalization condition ( i = 1 n w i = 1 ).
The derivative of the entropy H is the relative entropy Hn (in the dimension [0; 1]), defined as (7):
H = H H max = H ln ( n )
The entropy maximum Hmax is formed under conditions of a multilink (or with a large number of blocks) cause–effect chain; in this relation, Hmax = ln(n). This is explained by the fact that it is in complex systems that situational uncertainty increases significantly.
As follows from (6), determining the structure of the weight coefficients w i for assessing the positive contribution Q of various links in the chain “Population (P)–<…>–Fatality Cases (ND)” is of paramount importance for estimating the value of the entropy HRS and the relative entropy Hn RS. Having the calculated values of the positive weight w N , w R A , w V and w D allows us to solve the main problem of entropy analysis—assessing the degree of influence of various blocks (links) of the chain “Population (P)–<…>–Fatality Cases (ND)” in the formation of the final accident rate.
Weight coefficients w i are defined as (8):
w i = Q i Q
where
  • Qi—positive share of a link in the cause–effect chain of road traffic accident rate formation;
  • Q—overall positive of the process of functioning of the cause–effect chain.
Positive values of Qi of different links in the cause–effect chain of road accident rate formation (Figure 2) are significant in the formation of the result.
Positive Q is determined by formula (9) and formula (10) [64]:
Q = Q i = Q N +   Q R A +   Q V +   Q D ,
Q = Q i = ln ( 1 K N ) +   ln ( 1 K R A ) +   ln ( Q V ) + ln ( 1 Q D ) ,
where
  • QN = ln(1/KN)—positive share of link 1, Population—Fleet of vehicles;
  • QRA = ln(1/KRA)—positive share of link 2, Fleet of vehicles—Road Traffic Accidents;
  • QV = ln(KV)—positive share of link 3, Road Traffic Accidents (RTA)—RTA victims;
  • QD = ln(1/KD)—positive share of link 4, RTA victims—Fatality Cases.
The share of each link w i [64] in the cause–effect chain of road accident rate formation in the total balance is (11):
w i = Q i i = 1 4 Q i = Q i ln ( 1 / K N )   +   ln ( 1 / K R A )   +   ln ( K V )   +   ln ( 1 / K D )
The obtained estimates of the weights w i or the significance of individual process links in the overall process are the source material for the structural analysis of the process under study. Thus, the relative entropy Hn characterizes the structure of the entire process of formation of the road traffic accident rate, rather than the ratio of the final result of the process, fatality cases (ND) to population (P).
The determining value for Shannon’s information entropy H will be the particular values of the positive Qi of a certain link in the cause–effect chain (Figure 2) and the values of the information transformation coefficients Ki.
The values of these coefficients (Ki) for 82 regions of Russia vary over a wide range. That is why the values of the entropy H RS and the relative entropy Hn RS of road safety systems in Russian regions will also differ significantly.

5. Results of the Study of Information Entropy Specifics of the Regional Road Traffic Accident Rate in Russia

When researching the information entropy specifics of the regional road traffic accident rate in Russia, the author used official data on the road traffic accident rate provided by the Main Directorate for Traffic Safety of the Ministry of Internal Affairs of Russia [65], as well as data on the population [66] and the number of vehicles in Russian regions [65].
Appendix A presents the calculated values of the entropy H RS and the relative entropy Hn RS, typical for Russian regional road safety systems. It also presents data on the corresponding regional values of Ki..
The actual range of values of the relative entropy Hn RS of the processes of functioning of regional road safety systems is Hn RS = [0.631; 0.810]. Hn RS values in the regions of the country vary quite widely and the explanation for this is simple: the wide variety of living conditions of the Russian population (climatic, socio-economic, quality of life, etc.). For example, Figure 9 shows data on population density in Russia (2021).
However, let us return to the study of the information entropy specifics of the regional road traffic accident rate in Russia. As shown earlier, these specifics are determined by the features of data transformation in the course of movement along the cause–effect chain (Figure 2) and can be identified using the information transfer coefficients Ki (5).
The numerical values of the information transformation coefficients Ki for Russian regions (2021) vary in the following ranges of values (Table 5).
Figure 10 shows the statistical distributions of the values of the information transformation coefficients Ki for the regions of Russia (2021).
Note (Figure 10) that the regional KN values differ by more than three times; KRA values differ by more than ten times; KV values differ by 1.6 times; and KD values differ by more than four times. This is what testifies to the regional specifics of the road traffic accident rate in Russia.
In addition, the regional specifics of the road traffic accident rate in Russia are also characterized by the type of distribution law for the corresponding values of the information transformation coefficients Ki. Thus, distributions of the values of K1 = KN, K2 = KRA and K4 = KD correspond to the normal law and distribution of the values of K3 = KV, to the extremal law. We note that even in the case of a completely normal distribution of the KRA and KD values quite similar to the diagrams in Figure 10b,d, in the aggregate, there are values that remain outside the coverage area of the theoretical distribution. These are “outlet points” corresponding to regions of the country that do not fit into the overall statistical picture at all. This is also evidenced by the extreme distribution of the values of K3 = KV (Figure 10c). However, in this case, we are talking about a more systemic violation of the tradition of normal distribution rather than about a single deviation from the average statistical picture.
Table 3 shows the regional identification of the presented minimum and maximum values of the information transfer coefficients Ki in relation to the processes of formation of the road traffic accident rate.
It is noteworthy (Table 6) that two regions of the Russian Federation are characterized by unique combinations of the minimum and maximum possible Ki values, in particular, in the Republic of Tuva, KN min and KRA max, and in the Chechen Republic, KRA min and KD max.
Searching for the reasons for such uniqueness leads to the following thoughts. The Republic of Tuva is characterized by an extremely low quality of life, as evidenced by KN min. At the same time, a low quality of life forms a corresponding disregard for risk, which maximizes the value of KRA max. The situation in the Chechen Republic is fundamentally the opposite. The maximum value of KD max indicates two things—a low quality of medical care and, hypothetically, a very low-quality fleet of vehicles (lack of passive safety systems, poor technical condition, etc.). Variants of inadequate road behavior are also possible. On the contrary, the minimum value of KRA min indicates, most likely, a lack of recording of the accidents themselves, i.e., either hiding the facts of accidents or a poorly functioning road safety system. The combinations of Ki and the causes of accidents are different, but at the end we have the highest values for these two regions.
Bizarre combinations of Ki values eventually lead to the formation of certain combinations of values of the positives of the links in the cause–effect chain Qi, and then to the establishment of the appropriate weights w i (relative significance) of each link in the chain.
In most countries of the world, the regional specifics of Hn RS are characterized by a much smaller range of values. Thus, Russia is characterized by extreme diversity in terms of the uncertainty of the functioning of regional transport systems, considered from the standpoint of the probability of formation of the road traffic accident rate (Hn RS regions 2021 = [0.631; 0.810]). What does it mean? There are several implications to this conclusion. Let us look at them in the next section.

6. Informational Meanings of Uncertainty (Chaoticity) of the Processes of Formation of the Road Traffic Accident Rate in the Regions of Russia

K. Wu et al. [67] indicate that “the concept of entropy is a measure of the degree of uncertainty of the fabric mode of the micro state of the system”. This quote formalizes the agreed opinion of the authors [68,69,70,71]. Yet, how can we make the awareness of the meaning of a particular value, for example, Hn RS 2021 = 0.810, more specific? Is it good or bad from the standpoint of a particular car user whose goal is to reach their destination alive and well? The answer to this question is as follows.
A road safety provision system in the Russian region with Hn RS 2021 = 0.810 (Republic of Tuva) can be characterized as maximally indetermined from the perspective of the evaluation of the probability of death of people (its entropic orderliness is relatively low). Conversely, the road safety provision system of several Russian regions (for example, Kamchatka Territory with Hn R 2021S = 0.631) can be characterized as maximally determined from the perspective of the probability of death of people (its entropic orderliness is relatively high).
Let us try to figure out how these two regions of the Russian Federation fundamentally differ from the standpoint of the structure of the process of the accident rate formation.
Table 7 and Table 8 present the initial data and the results of a step-by-step calculation of the HRS and Hn RS values in the regions of Russia characterized by the highest and lowest entropy characteristics.
An analysis of the data in Table 7 and Table 8 shows a threefold superiority of the Kamchatka Territory over the Republic of Tuva in the values of K1 = KN and K2 = KRA. On the contrary, in the Republic of Tuva the values of K4 = KD are two times higher than those for the Kamchatka Territory. The values of K3 = KV in the compared regions also differ, but not so greatly (by 23%). The conclusion is that the structure of the accident rate formation process in these regions of Russia is fundamentally different. With a very high level of motorization (K1 = KN), the probability of being in an accident (K2 = KRA) for a road user in the Kamchatka Territory is three times higher than in the Republic of Tuva, where the level of motorization is low. In Tuva, the specific number of victims per average road traffic accident (K3 = KV) is 23% higher, and the proportion of deaths among victims (K4 = KD) in Tuva is two times higher than in Kamchatka.
By mentally correlating this comparative information, we can understand that the informational meaning of the uncertainty of an event from the standpoint of the probability of the accident rate formation can be interpreted as follows.
The regional road safety system in the Republic of Tuva can be characterized as the most uncertain in terms of assessing the probability of death of people (entropic orderliness is relatively low, since Hn RS → max). Conversely, the regional road safety system in the Kamchatka Territory can be characterized as the most certain in terms of assessing the probability of death of people (entropic orderliness is relatively high, since Hn RS → min).
These conclusions are not contradictory and should not cause confusion. The actual level of road safety, as a qualitative assessment of the state of the transport system, can be high or low; the uncertainty of the state of the system (in particular, from the standpoint of the level of safety of its operation) is an assessment of its state from other standpoints—of the probability of the system being in a certain state.
It is commonly believed [16,35,36,37,50] that, for systems in general, the lower the values of the entropy characteristics H and Hn, the better. This is a controversial statement and recent research shows that there are optimal entropy levels [59] for the state of the system Hn RS → 0.618. Fundamentally, these issues require further research, and in [58,59] only the first steps towards the search for the optimal entropy state of road safety systems were taken.
In general, for Russia, the structure of the accident rate formation process in 2021 (Figure 2) is determined by the following initial data (Table 9), taking into account that the relative entropy of the all-Russian road safety system is characterized by the value of Hn RS Russian Federation 2021 = 0.699.
Of course, if for individual regions of Russia the range of values of Hn RS regions 2021 is Hn RS regions 2021 = [0.631; 0.810], then for the entire country the value of Hn RS RF should be intermediate, Hn RS RF 2021 = 0.699. Thus, those regions of the country for which Hn RS region < Hn RS RF = 0.699 can be characterized as regions with a sufficiently high degree of certainty in terms of estimating the probability of death of people. There are 35 such regions in Russia out of 82 (≈43%).
Vice versa, the regions of Russia for which Hn RS region > Hn RS RF = 0.699 can be characterized as regions with a sufficiently high degree of uncertainty in terms of estimating the probability of death of people. In total, there are 47 such regions out of 82 (≈57%).
How do we use this information for the purposes of road safety management at the federal level? We will discuss this in the next section.

7. Conclusions and Recommendations for Improving the Quality of the Federal Road Safety Management in Russia

7.1. General Conclusions

  • Information-entropic analysis can be successfully used to assess the structural quality of road safety systems.
  • The basis of the information entropy analysis of the road safety systems quality is the determination of the weight (relative significance) of the evaluation indices and the creation of a multi-level synthetic evaluation model. To do this, we need to use the cause–effect chain “Population P—Fleet of vehicles NVh—Road Traffic Accidents NRA—RTA Victims NV—Fatality Cases ND” of the process of formation of the road traffic accident rate and determine the relationship between the values of the characteristics of the subsequent and previous blocks of the cause–effect chain Ki.
  • It is the values of the information transformation coefficients Ki that will determine the specifics of Shannon’s information entropy (the absolute value of H RS and the value of the relative entropy Hn RS) and set the weights (significance) of certain links in the cause–effect chain for specific regional road safety systems.
  • Studies of the regional specifics of the processes of formation of the road traffic accident rate in the regions of the Russian Federation have shown that these specifics really exist. Regional values of the information transformation coefficients Ki differ significantly (sometimes by multiples), and their bizarre combinations have the most direct impact on the final quantitative estimate of the relative entropy Hn RS for specific regional road safety systems.
  • During this research, it was determined that Hn RS RF 2021 = 0.699. The range of values for individual regions of the country is Hn RS regions 2021 = [0.631; 0.810]. At relatively high values of Hn RSmax, regional road safety systems can be characterized as relatively uncertain in terms of assessing the probability of death of people. At relatively low values of Hn RSmin, regional road safety systems can be characterized as relatively certain in terms of assessing the probability of death of people.

7.2. Recommendations

For the purposes of system management, information on the values of the absolute entropy H RS and the relative entropy Hn RS of road safety systems can be used in addition to the already available indicators HR, TR, RTA Significance and RTA Severity (Figure 4).
In relation to these characteristics, two variants of entropy—absolute H RS and relative Hn RS—can be used precisely to generalize as characteristics of the overall quality of the road safety process management system. HR, TR, RTA Significance and RTA Severity characterize individual, particular aspects of road safety processes, and the entropy characteristics H RS and Hn RS characterize the entire road safety system from the standpoint of its quality.
In this regard, the author recommends using the entropy characteristics H RS and Hn RS as additional indicators for assessing the level of road safety in the country (region).

7.3. Model Variants of the Process of Formation of the Regional Road Traffic Accident Rate in Russia (2030 and 2070)

Taking into account the recommendations given in Section 7.2 of this article, we need to understand what the current and potential target (2030) performance levels of HR, TR, RTA Significance, RTA Severity, H RS and Hn RS are for the federal road safety system of Russia.
Table 10 presents these data.
Perhaps it would be appropriate to fantasize about the times when the driver will be taken out of the process of driving and all cars will become independent. The security of such a transport system will increase significantly [72,73,74,75].
For such a futuristic transport system (which may be relevant in fifty years, in the 2070s) it will be possible to achieve the optimal level of Hn RS = 0.618.
Such a system will be characterized by the following predictive characteristics (Table 11).
The concept of zero deaths [76,77,78], adopted in Sweden in 1997 and now having a significant impact on road safety processes around the world [79], assumes that zero deaths in road accidents will someday be achieved. It is hardly possible in absolute terms, but the data in Table 8 bring us closer to this goal (HR RF → 0 road traffic deaths/100,000 inhabitants; HR RF-2070 = 0.33 road traffic deaths/100,000 inhabitants). Furthermore, as calculations show, this will be possible with a certain structure of the process of formation of the road traffic accident rate characterized by a level of Hn RS RF-2070 = 0.618.

Funding

This research received no external funding.

Data Availability Statement

Not applicable.

Acknowledgments

1. The author would like to thank Victor I. Kolesov for his friendly support and professional communication. 2. The author would like to thank the anonymous referees for their very useful suggestions.

Conflicts of Interest

The author declares no conflict of interest.

Appendix A

The ranked data on the values of entropy HRS and relative entropy Hn RS of regional road safety provision systems in the Russian Federation (2021) and their corresponding values of information transformation coefficients Ki.
No.Region of Russian FederationValues (2021)
HRSHn RSK1 = KNK2 = KRAK3 = KVK4 = KD
1Republic of Tuva1.1230.8100.2200.00651.6960.138
2Republic of Ingushetia1.0540.7600.2220.00161.8490.151
3Republic of Crimea1.0370.7480.2740.00311.4010.096
4Chuvash Republic1.0330.7450.2920.00311.3830.083
5Karachayevo-Circassian Republic1.0270.7400.2720.00291.3840.106
6Vladimir Region1.0230.7380.3920.00361.4970.085
7Omsk Region1.0190.7350.3510.00321.3570.058
8Republic of Mari El1.0190.7350.3550.00291.4560.085
9Kirov Region1.0180.7350.3850.00341.4010.058
10Penza Region1.0180.7340.3870.00321.4480.070
11Republic of Daghestan1.0170.7330.2670.00161.6060.139
12Stavropol Territory1.0130.7310.3390.00261.4350.091
13Republic of North Ossetia—Alania1.0100.7290.4230.00261.5650.073
14Republic of Sakha (Yakutia)1.0090.7280.3210.00221.3850.073
15Republic of Kalmykia1.0070.7270.4540.00341.6550.117
16Smolensk Region1.0050.7250.3420.00271.3650.081
17Yaroslavl Region1.0050.7250.3760.00321.3480.067
18Kaluga Region1.0040.7240.3940.00281.4620.087
19Astrakhan Region1.0030.7230.3640.00291.3550.073
20Republic of Altai1.0020.7230.3980.00341.3910.081
21Kostroma Region1.0010.7220.3880.00301.3760.071
22Tyumen Region1.0010.7220.4650.00341.4500.052
23Jewish Autonomous Region1.0010.7220.3690.00321.3670.089
24Bryansk Region1.0010.7220.2670.00221.4020.146
25Irkutsk Region1.0010.7220.3530.00301.3710.096
26Komi Republic1.0000.7220.4010.00281.3830.056
27Republic of Tatarstan1.0000.7220.3520.00271.3180.064
28Republic of Buryatia0.9940.7170.3950.00251.4340.082
29Saratov Region0.9930.7170.4290.00271.4400.069
30Murmansk Region0.9930.7160.4150.00261.3860.055
31Ulyanovsk Region0.9920.7160.3860.00241.3770.068
32Kemerovo Region0.9920.7150.4070.00231.4240.067
33Kursk Region0.9890.7130.4110.00291.3860.081
34Khabarovsk Territory0.9880.7130.3910.00261.3850.085
35Krasnodar Territory0.9870.7120.3930.00271.3820.087
36Amur Region0.9860.7110.4170.00331.3490.082
37Krasnoyarsk Territory0.9850.7100.3780.00251.3580.086
38Altai Territory0.9830.7090.4290.00231.4210.070
39Vologda Region0.9820.7080.4570.00261.4140.058
40Samara Region0.9790.7060.3920.00241.3550.084
41Leningrad Region0.9780.7050.4150.00301.3990.112
42Novgorod Region0.9770.7040.4450.00321.3490.077
43Udmurtian Republic0.9750.7030.3830.00231.3290.081
44Chelyabinsk Region0.9730.7020.4420.00231.3870.068
45Arkhangelsk Region0.9720.7010.3990.00211.3540.076
46Ryazan Region0.9710.7010.4970.00271.4720.076
47Voronezh Region0.9710.7010.4420.00271.4010.090
48Republic of Mordovia0.9680.6980.4220.00211.4640.108
49Sakhalin Region0.9660.6970.4280.00241.3810.094
50Nizhny Novgorod Region0.9640.6950.4930.00301.3580.063
51Tambov Region0.9630.6950.4780.00221.4240.071
52Orel Region0.9630.6950.4570.00211.4100.074
53Ivanovo Region0.9580.6910.4550.00211.3230.055
54Chechen Republic0.9580.6910.2500.00061.8440.223
55Belgorod Region0.9550.6890.4160.00171.3880.088
56Kabardino-Balkarian Republic0.9490.6850.3640.00171.4300.159
57Republic of Bashkortostan0.9470.6830.4510.00211.3520.092
58Magadan Region0.9440.6810.5590.00261.4550.079
59Khanty-Mansi Autonomous Area—Yugra0.9430.6800.5140.00161.4580.065
60Tula Region0.9390.6780.5300.00231.4070.079
61Kurgan Region0.9390.6780.4800.00221.3690.096
62Tver Region0.9370.6760.5160.00261.3690.091
63Volgograd Region0.9370.6760.5170.00181.4160.072
64Perm Territory0.9350.6750.4820.00161.4140.088
65Trans-Baikal Territory0.9350.6740.4120.00221.3380.144
66Lipetsk Region0.9330.6730.4880.00211.3870.103
67Chukotka Autonomous Area0.9260.6680.2730.00091.2500.133
68Kaliningrad Region0.9250.6680.4700.00191.2680.078
69Novosibirsk Region0.9200.6640.4280.00151.3140.110
70Yamal-Nenets Autonomous Area0.9160.6610.4680.00111.3640.078
71Republic of Karelia0.9140.6600.5330.00171.4390.108
72Orenburg Region0.9130.6580.5010.00151.3640.092
73Moscow Region0.9110.6570.4300.00141.3410.127
74Rostov Region0.9090.6560.4240.00131.3750.141
75Pskov Region0.9080.6550.5650.00201.4200.109
76Tomsk Region0.9060.6530.3880.00111.2610.117
77Nenets Autonomous Area0.9020.6510.3690.00131.1820.115
78Republic of Khakassia0.8980.6480.5170.00171.2960.099
79Sverdlovsk Region0.8960.6460.5310.00121.3940.096
80Primorye Territory0.8960.6460.6120.00201.3650.080
81Republic of Adygeya0.8780.6330.5290.00171.3690.157
82Kamchatka Territory0.8750.6310.6960.00201.3770.069

References

  1. Chuaire, M.F.; Scartascini, C.; Tommasi, M. State capacity and the quality of policies. Revisiting the relationship between openness and government size. Econ. Politics 2017, 29, 133–156. [Google Scholar] [CrossRef]
  2. Besley, T.; Persson, T. The origins of state capacity: Property rights, taxation, and politics. Am. Econ. Rev. 2009, 99, 1218–1244. [Google Scholar] [CrossRef] [Green Version]
  3. Evans, P.B.; Rauch, J.E. A cross-national analysis of the effects of “Weberian” state structures on economic growth. Am. Sociol. Rev. 1999, 64, 748–765. [Google Scholar] [CrossRef] [Green Version]
  4. Bakanov, K.S.; Antonov, S.N.; Lyakhov, P.V.; Loparev, E.A.; Ermaganbetov, A.S.; Isaev, M.M.; Koblov, P.S.; Naumov, S.B.; Fattakhov, T.A.; Mazurchuk, T.M. The State and Trends of Road Safety in the Russian Federation in 2011–2020: An Analytical Review; Scientific Center for Road Safety of the Ministry of Internal Affairs: Moscow, Russia, 2022; p. 368. (In Russian) [Google Scholar]
  5. Kravchenko, P.A.; Zhankaziev, S.V.; Oleshchenko, E.M. Concept for ensuring zero mortality in Russia’s roads as a mechanism for fighting against causes of road traffic accidents. Transp. Russ. Fed. 2019, 4, 3–7. (In Russian) [Google Scholar]
  6. Bhatia, R.; Wier, M. Safety in Numbers re-examined: Can we make valid or practical inferences from available evidence? Accid. Anal. Prev. 2011, 43, 235–240. [Google Scholar] [CrossRef]
  7. Elvik, R. Can a safety-in-numbers effect and a hazard-in-numbers effect co-exist in the same data? Accid. Anal. Prev. 2013, 60, 57–63. [Google Scholar] [CrossRef] [Green Version]
  8. Elvik, R.; Bjørnskau, T. Safety-in-numbers: A systematic review and meta-analysis of evidence. Saf. Sci. 2017, 92, 274–282. [Google Scholar] [CrossRef] [Green Version]
  9. Davidson, R.; MacKinnon, J.G. Econometric Theory and Methods; Oxford University Press: Oxford, UK, 2003; p. 768. [Google Scholar]
  10. Breunig, R. Econometric Theory and Methods—By Russell Davidson and James G. MacKinnon. Econ. Rec. 2007, 83, 110–112. [Google Scholar] [CrossRef]
  11. Guerard, J.B. Regression Analysis and Forecasting Models. In Introduction to Financial Forecasting in Investment Analysis; Guerard, J.B., Ed.; Springer: New York, NY, USA, 2012; pp. 19–45. [Google Scholar] [CrossRef]
  12. Brugge, D.; Lai, Z.; Hill, C.; Rand, W. Traffic injury data, policy, and public health: Lessons from Boston Chinatown. J. Urban Health 2002, 79, 87–103. [Google Scholar] [CrossRef] [Green Version]
  13. Kravchenko, P.A. Road safety: A node of relations problems? Transp. Russ. Fed. 2006, 2, 61–62. (In Russian) [Google Scholar]
  14. Frost, J. Regression Analysis: An Intuitive Guide for Using and Interpreting Linear Models; Statistics By Jim Publishing: Online, 2020; p. 358. [Google Scholar]
  15. Fermi, E. Notes on Thermodynamics and Statistics; University of Chicago Press: Chicago, IL, USA, 1966; p. 182. [Google Scholar]
  16. Ben-Naim, A. Entropy and Information Theory: Uses and Misuses. Entropy 2019, 21, 1170. [Google Scholar] [CrossRef] [Green Version]
  17. The Official Website of the State Traffic Inspectorate of the Russian Federation. Indicators of the State of Road Safety. Available online: http://stat.gibdd.ru/ (accessed on 31 October 2022).
  18. Official Website of the Federal State Statistics Service of the Russian Federation. Available online: https://rosstat.gov.ru/folder/ (accessed on 2 November 2022).
  19. Pulyanova, K.V.; Voevodin, E.S.; Fadeev, A.I.; Fomin, E.V.; Askhabov, A.M.; Kashura, A.S. Analysis of road safety assessment methods. In IOP Conference Series: Materials Science and Engineering, Irkutsk, Russia, 27 May–1 June 2019; IOP publishing: Bristol, UK, 2019; Volume 632, p. 012015. [Google Scholar] [CrossRef]
  20. Martensen, H.; Diependaele, K.; Daniels, S.; Van den Berghe, W.; Papadimitriou, E.; Yannis, G.; Van Schagen, I.; Weijermars, W.; Wijnen, W.; Filtness, A.; et al. The European road safety decision support system on risks and measures. Accid. Anal. Prev. 2018, 125, 344–351. [Google Scholar] [CrossRef] [PubMed] [Green Version]
  21. Piankova, A.I.; Fattahov, T.A. Years of healthy life lost due to road traffic accidents in Russia. Profil. Meditsina 2017, 20, 30–36. [Google Scholar] [CrossRef]
  22. Fattahov, T.A.; Piankova, A.I. The Years of Life Lost as a Result of Road Traffic Accidents In Russia in 2000–2012. Probl. Sotsialnoi Gig. Zdravookhranenniiai. Istor. Med. 2018, 26, 271–275. [Google Scholar] [CrossRef] [PubMed]
  23. Hartley, R.V.L. Transmission of Information. Bell Syst. Tech. J. 1928, 7, 535–563. [Google Scholar] [CrossRef]
  24. Schrödinger, E. What is Life? Fe Physical Aspect of the Living Cell; Cambridge University Press: Cambridge, UK, 1994. [Google Scholar]
  25. Shannon, C.E. Mathematical Theory of Communication. Bell Syst. Tech. J. 1948, 27, 379–423. [Google Scholar] [CrossRef] [Green Version]
  26. Shannon, C.E. Communication Theory of Secrecy Systems. Bell Syst. Tech. J. 1949, 28, 656–715. [Google Scholar] [CrossRef]
  27. Wiener, N. Cybernetics: Or Control and Communication in the Animal and the Machine; Technology Press/John and Wiley and Sons: Hoboken, NJ, USA, 1948. [Google Scholar]
  28. Ashby, W.R. An Introduction to Cybernetics; Chapman and Hall: London, UK, 1956. [Google Scholar]
  29. Brillouin, L. Science and Information Theory; Academic Press: New York, NY, USA, 1956. [Google Scholar]
  30. Schelling, T.C. The Strategy of Conflict; Harvard University Press: Cambridge, MA, USA, 1960. [Google Scholar]
  31. Hurwicz, L. On informationally decentralized systems. In Decision and Organization; Radner, R., McGuire, C.B., Eds.; North-Holland: Amsterdam, The Netherlands, 1972. [Google Scholar]
  32. Foerster, H. Cybernetics of Cybernetics; University of Illinois: Urbana, IL, USA, 1974. [Google Scholar]
  33. Turchin, V.F. The Phenomenon of Science: A Cybernetic Approach to Human Evolution; Columbia University Press: New York, NY, USA, 1977. [Google Scholar]
  34. Luhmann, N. The world society as a social system. Int. J. Gen. Syst. 1982, 8, 131–138. [Google Scholar] [CrossRef]
  35. Liiv, E.H. Infodynamics. In Generalized Entropy and Negentropy; AO Juhisjelu: Tallinn, Estonia, 1998. (In Russian) [Google Scholar]
  36. Shchedrovitsky, G. Reflexion and relevant problems. Reflexive Process. Control 2002, 1, 41–45. [Google Scholar]
  37. Cover, T.M.; Thomas, J.A. Elements of Information Theory; John and Wiley and Sons: Hoboken, NJ, USA, 2006. [Google Scholar]
  38. Umpleby, S.A. Second order science: Logic, strategies, methods. Constr. Found. 2014, 10, 16–23. [Google Scholar]
  39. Müller, K.H. The multiple faces of reflexive research designs. Syst. Cybern. Inform. 2015, 13, 87–98. [Google Scholar]
  40. Mobus, G.E.; Kalton, M.C. Principles of Systems Science (Understanding Complex Systems); Springer: Berlin/Heidelberg, Germany, 2015; p. 791. [Google Scholar] [CrossRef]
  41. Novikov, D.A. Cybernetics: From Past to Future; Springer: Berlin/Heidelberg, Germany, 2016; p. 107. [Google Scholar]
  42. Lepskiy, V. Evolution of cybernetics: Philosophical and methodological analysis. Kybernetes 2018, 47, 249–261. [Google Scholar] [CrossRef]
  43. Reza, F.M. An Introduction to Information Theory; MacGraw-Hill: New York, NY, USA, 1961; p. 481. [Google Scholar]
  44. Pincus, S. Approximate Entropy as a Measure of System Complexity. Proc. Natl. Acad. Sci. USA 1991, 88, 2297–2301. [Google Scholar] [CrossRef] [PubMed] [Green Version]
  45. Lin, Z.Z.; Wen, F.S. Entropy weight based decision-making theory and its application to black-start decision-making. Proceeding CSU EPSA 2009, 21, 26–33. [Google Scholar]
  46. Jing, L.P.; Michael, K.N. An entropy weighting k-means algorithm for subspace clustering of high-dimensional sparse data. IEEE Trans. Knowl. Data Eng. 2009, 19, 1026–1041. [Google Scholar] [CrossRef]
  47. Qi, Y.; Wen, F.; Wang, K.; Liand, L.; Singh, S.N. A fuzzy comprehensive evaluation and entropy weight decision-making based method for power network structure assessment. Int. J. Eng. Sci. Technol. 2010, 2, 92–99. [Google Scholar] [CrossRef]
  48. Petrov, A.; Petrova, D. Atmospheric pollution in cities of Russia: Statistics, causes and characteristics. In IOP Conference Series: Earth And Environmental Science; IOP publishing: Bristol, UK, 2017; Volume 72, p. 12007. [Google Scholar] [CrossRef] [Green Version]
  49. Sethna, J.P. Entropy, Order Parameters, and Complexity; Clarendon Press: Oxford, UK, 2017; p. 371. [Google Scholar]
  50. Majda, A.; Kleeman, R.; Cai, D. A mathematical framework for quantifying predictability through relative entropy. Methods Appl. Anal. 2002, 9, 425–444. [Google Scholar]
  51. Kleeman, R. Measuring dynamical prediction utility using relative entropy. J. Atmos. Sci. 2002, 59, 2057–2072. [Google Scholar] [CrossRef]
  52. Han, T.S. Information-Spectrum Methods in Information Theory; Springer: Berlin/Heidelberg, Germany, 2003; Volume 538. [Google Scholar]
  53. Fedoseev, S.A.; Stolbov, V.Y.; Gitman, M.B.; Pustovoyt, K.S. Improving the quality of the industrial enterprise management based on the network-centric approach. R-Economy 2015, 4, 608–617. [Google Scholar] [CrossRef] [Green Version]
  54. Shenker, O. Information vs. entropy vs. probability. Euro. J. Phil. Sci. 2020, 10, 5. [Google Scholar] [CrossRef]
  55. Buchdahl, H.A. The Concepts of Classical Thermodynamics; Cambridge University Press: Cambridge, UK, 1966; p. 223. [Google Scholar]
  56. Kostic, M.M. The elusive nature of entropy and its physical meaning. Entropy 2014, 16, 953–967. [Google Scholar] [CrossRef] [Green Version]
  57. Ribeiro, M.; Henriques, T.; Castro, L.; Souto, A.; Antunes, L.; Costa-Santos, C.; Teixeira, A. The Entropy Universe. Entropy 2021, 23, 222. [Google Scholar] [CrossRef] [PubMed]
  58. Petrov, A.I. Entropy Method of Road Safety Management: Case Study of the Russian Federation. Entropy 2022, 24, 177. [Google Scholar] [CrossRef] [PubMed]
  59. Petrov, A.I.; Kolesov, V.I.; Petrova, D.A. Theory and Practice of Quantitative Assessment of System Harmonicity: Case of Road Safety in Russia before and during the COVID-19 Epidemic. Mathematics 2021, 9, 2812. [Google Scholar] [CrossRef]
  60. Mohammed, A.A.; Ambak, K.; Mosa, A.M.; Syamsunur, D. A review of the traffic accidents and related practices worldwide. Open Transp. J. 2019, 13, 65–83. [Google Scholar] [CrossRef] [Green Version]
  61. Smeed, R.J. Some Statistical Aspects of Road Safety Research. J. R. Stat. Soc. Ser. A 1949, 112, 1–34. [Google Scholar] [CrossRef]
  62. Smeed, R.J. Variations in the pattern of accident rates in different countries and their causes. Traffic Eng. Control 1968, 10, 364–371. [Google Scholar]
  63. Rumar, K. Transport Safety Visions, Targets and Strategies: Beyond 2000; European Transport Safety Council ETSC: Brussels, Belgium, 1999; Available online: https://archive.etsc.eu/documents/etsl1.pdf (accessed on 31 January 2023).
  64. Kolesov, V.; Petrov, A. Cybernetic Modeling in Tasks of Traffic Safety Management. Transp. Res. Procedia 2017, 20, 305–310. [Google Scholar] [CrossRef]
  65. Road Safety Profiles of the Subjects of the Russian Federation 2021. Available online: https://media.mvd.ru/files/embed/4478063 (accessed on 19 October 2021). (In Russian).
  66. Population of the Russian Federation by Regions and Municipalities. 2021. Available online: https://rosstat.gov.ru/compendium/document/13282 (accessed on 20 October 2021). (In Russian)
  67. Wu, K.; Nan, Q.; Wu, T. Philosophical Analysis of the Meaning and Nature of Entropy and Negative Entropy Theories. Complexity 2020, 2020, 8769060. [Google Scholar] [CrossRef]
  68. Wu, K. Philosophical classification of information forms. Potential Sci. 1984, 3, 33–35. [Google Scholar]
  69. Wu, K.; Qi, L. Introduction to Philosophical Information; Shaanxi People’s Press: Xi’an, China, 1987. [Google Scholar]
  70. Wu, K. On in-Itself Information; Academic Monthly: Shanghai, China, 1986; Volume 19. [Google Scholar]
  71. Wu, K.; Jian, W.; Tianqi, W. An Introduction to the Philosophy of Information; Xi’an Jiaotong University Press: Xi’an, China, 2019. [Google Scholar]
  72. Fagnant, D.J.; Kockelman, K. Preparing a nation for autonomous vehicles: Opportunities, barriers and policy recommendations. Transp. Res. Part A Policy Pract. 2015, 77, 167–181. [Google Scholar] [CrossRef]
  73. Millard-Ball, A. Pedestrians, Autonomous Vehicles, and Cities. J. Plan. Educ. Res. 2016, 38, 6–12. [Google Scholar] [CrossRef] [Green Version]
  74. Wang, J.; Zhang, L.; Huang, Y.; Zhao, J. Safety of Autonomous Vehicles. J. Adv. Transp. 2020, 2020, 8867757. [Google Scholar] [CrossRef]
  75. Petrov, A.; Petrova, D. Assessment of Spatial Unevenness of Road Accidents Severity as Instrument of Preventive Protection from Emergency Situations in Road Complex. In IOP Conference Series: Materials Science and Engineering; IOP Publishing: Bristol, UK, 2016; Volume 142, p. 012116. [Google Scholar] [CrossRef]
  76. Rosencrantz, H.; Edvardsson, K.; Hansson, S.O. Vision Zero—Is it irrational? Transp. Res. Part A Policy Pract. 2007, 41, 559–567. [Google Scholar] [CrossRef]
  77. Johansson, R. Vision Zero—Implementing a policy for traffic safety. Saf. Sci. 2009, 47, 826–831. [Google Scholar] [CrossRef]
  78. Zwetsloot, G.I.J.M.; Kines, P.; Wybo, J.-L.; Ruotsala, R.; Drupsteen, L.; Bezemer, R.A. Zero Accident Vision based strategies in organisations: Innovative perspectives. Saf. Sci. 2017, 91, 260–268. [Google Scholar] [CrossRef]
  79. IRTAD Road Safety Database. 2022. Available online: https://trimis.ec.europa.eu/project/international-road-traffic-and-accident-database (accessed on 8 November 2022).
Figure 1. Simplest example of the distribution of entropy values H for a two-component system (components [+] and [−]). In the case of equal weights of two components of the system (when w(+) = w(−)) the entropy of the system H = 1.0.
Information 14 00138 g001
Figure 2. Simplest cause–effect chain of the process of the road traffic accident rate formation.
Information 14 00138 g002
Figure 3. Correlation matrix of the relation between the blocks of the cause–effect chain of the process of the road traffic accident rate formation (2021) in 82 regions of the Russian Federation (excluding cities of federal significance).
Information 14 00138 g003
Figure 4. Characteristics of the road traffic accident rate as a result of informational relation between the blocks of the cause–effect chain of formation of the road traffic accident rate.
Information 14 00138 g004
Figure 5. Correlation matrix of the relation of four characteristics of the road traffic accident rate in the regions of Russia (2021).
Information 14 00138 g005
Figure 6. Four characteristics that determine the specifics of the information process of the functioning of the regional transport system.
Information 14 00138 g006
Figure 7. Statistical distributions of regional values of characteristics that determine the specifics of the information process of the functioning of the regional transport system. (a) Automobilization A; (b) RTA Probability P RTA; (c) RTA Significance Sign RTA; (d) RTA Severity Sv RTA.
Information 14 00138 g007aInformation 14 00138 g007b
Figure 8. Correlation matrix of the relationships between four coefficients of information transformation Ki of the cause–effect chain for the regions of Russia (2021).
Information 14 00138 g008
Figure 9. Population density in Russia (2021).
Information 14 00138 g009
Figure 10. Statistical distributions of values of coefficients of information transformation Ki (2021).
Information 14 00138 g010
Table 1. Values of the Pearson correlation coefficient r (Figure 3).
-PNVhNRANVND
P1.00.98230.92720.89090.7707
NVh0.98231.00.92820.90150.7974
NRA0.92720.92821.00.98920.8088
NV0.89090.90150.98921.00.8622
ND0.77070.79740.80880.86221.0
Table 2. Values of the Pearson correlation coefficient r (Figure 5).
-HRTRSignRTASvRTA
HR1.00.82030.31250.2962
TR0.82031.00.42620.3759
SignRTA0.31250.42621.00.9662
SvRTA0.29620.37590.96621.0
Table 3. Coefficients of information transformation Ki.
Links in the Cause–Effect Chain of Road Traffic Accident Rate Formation
Link
Population P—Fleet of vehicles
NVh
Link
Fleet of vehicles NVh—Road Traffic Accidents
NRA
Link
Road Traffic Accidents NRA—RTA Victims
NV
Link
RTA Victims NV—Fatality Cases
ND
Coefficients of information transformation Ki
K1 = KNK2 = KRAK3 = KVK4 = KD
Table 4. Values of the Pearson correlation coefficients r (Figure 8).
-K1 = KNK2 = KRAK3 = KVK4 = KD
K1 = KN1.0−0.2540−0.2278−0.2854
K2 = KRA−0.25401.00.1681−0.3197
K3 = KV−0.22780.16811.00.4680
K4 = KD−0.2854−0.31970.46801.0
Table 5. Ranges of the actual values of the information transformation coefficients Ki in the regions of Russia (2021).
Values of Coefficients of Information Transmission between Links Ki
K1 = KNK2 = KRAK3 = KVK4 = KD
[0.220; 0.696][0.0006; 0.0065][1.182; 1.849][0.052; 0.223]
Table 6. Representative regions of Russia (2021).
Numerical Values Ki (2021)/Representative Regions
KiMinimum Value Ki/RegionMaximum Value Ki/Region
KN0.220—Republic of Tuva0.696—Kamchatka Territory
KRA0.0006—Chechen Republic0.0065—Republic of Tuva
KV1.182—Nenets Autonomous Area1.849—Republic of Ingushetia
KD0.052—Tyumen Region0.223—Chechen Republic
Table 7. Results of calculating the relative entropy for the process of road safety formation in Republic of Tuva (2021).
Population
P
Fleet of Vehicles
NVh
Road Traffic Accidents
NRA
RTA Victims
NV
Fatality Cases
ND
332,60973,084474804111
Values of coefficients of information transmission between links in the cause–effect chain
K1 = KNK2 = KRAK3 = KVK4 = KD
0.2200.00651.6960.138
Positive of a link in the cause-and-effect chain Q i = ln ( 1 / K i )
1.5155.0380.5281.980
Relative weight of positive of a corresponding link in the chain w i
0.1670.5560.0580.219
Estimated value [ ln   ( w i ) ]
−1.788−0.587−2.842−1.521
Estimated value [ w i · ln   ( w i ) ]
−0.299−0.326−0.166−0.332
Estimated entropy value H = i = 1 n w i ln w i = 1.123
Estimated value of relative entropy Hn RS = 0.810
Table 8. Results of calculating the relative entropy for the process of road safety formation in Kamchatka Territory (2021).
Population
P
Fleet of Vehicles
NVh
Road Traffic Accidents
NRA
RTA Victims
NV
Fatality Cases
ND
312,704217,79244361042
Values of coefficients of information transmission between links in the cause–effect chain
K1 = KNK2 = KRAK3 = KVK4 = KD
0.6960.00201.3770.069
Positive of a link in the cause-and-effect chain Q i = ln ( 1 / K i )
0.3626.1980.3202.676
Relative weight of positive of a corresponding link in the chain w i
0.0380.6490.0330.280
Estimated value [ ln   ( w i ) ]
−3.274−0.433−3.397−1.273
Estimated value [ w i · ln   ( w i ) ]
−0.124−0.281−0.114−0.356
Estimated entropy value H = i = 1 n w i ln w i = 0.875
Estimated value of relative entropy Hn RS = 0.631
Table 9. Results of calculating the relative entropy for the process of road safety formation in Russian Federation (2021).
Population
P
Fleet of Vehicles
NVh
Road Traffic Accidents
NRA
RTA Victims
NV
Fatality Cases
ND
145,557,57660,136,889133,277181,65614,871
Values of coefficients of information transmission between links in the cause–effect chain
K1 = KNK2 = KRAK3 = KVK4 = KD
0.4130.0021.3630.082
Positive of a link in the cause-and-effect chain Q i = ln ( 1 / K i )
0.8846.1120.3102.503
Relative weight of positive of a corresponding link in the chain w i
0.0900.6230.0320.255
Estimated value [ ln   ( w i ) ]
−2.407−0.473−3.455−1.366
Estimated value [ w i · ln   ( w i ) ]
−0.217−0.295−0.109−0.349
Estimated entropy value H = i = 1 n w i ln w i = 0.969
Estimated value of relative entropy Hn RS = 0.699
Table 10. Actual (2021) and forecast (2030) levels of characteristics of road safety indicators in Russia.
Actual Statistics (2021)
Population
P
Fleet of Vehicles
NVh
Road Traffic Accidents
NRA
RTA Victims
NV
Fatality Cases
ND
145,557,57660,136,889133,277181,65614,871
Actual values (2021)
Human Risk
HR
Transport Risk
TR
RTA
Significance
RTA
Severity
Entropy
H RS
Relative Entropy
Hn RS
10.2124.730.1128.200.9690.699
Expected (forecast) values (2030)
Human Risk
HR
Transport Risk
TR
RTA
Significance
RTA
Severity
Entropy
H RS
Relative Entropy
Hn RS
≈4.00≈7.00≈0.080≈5.000.9270.669
Required statistics for this (2030)
Population
P
Fleet of Vehicles
NVh
Road Traffic Accidents
NRA
RTA Victims
NV
Fatality Cases
ND
150,000,00085,500,00075,000120,0006000
Table 11. Imagined (2070) levels of characteristics of road safety indicators in Russia.
Imagined values (2070)
Population
P
Fleet of Vehicles
NVh
Road Traffic Accidents
NRA
RTA Victims
NV
Fatality Cases
ND
170,000,00085,000,00020,00023,800560
Imagined values (2070)
Human Risk
HR
Transport Risk
TR
RTA
Significance
RTA
Severity
Entropy
H RS
Relative Entropy
Hn RS
≈0.33≈0.66≈0.028≈2.40.8560.618
Disclaimer/Publisher’s Note: The statements, opinions and data contained in all publications are solely those of the individual author(s) and contributor(s) and not of MDPI and/or the editor(s). MDPI and/or the editor(s) disclaim responsibility for any injury to people or property resulting from any ideas, methods, instructions or products referred to in the content.

