You are currently viewing a new version of our website. To view the old version click .
Information
  • Article
  • Open Access

8 November 2023

In-Vehicle Network Intrusion Detection System Using Convolutional Neural Network and Multi-Scale Histograms

Joint Research Centre, European Commission, 21027 Ispra, Italy
This article belongs to the Special Issue Wireless IoT Network Protocols II

Abstract

Cybersecurity in modern vehicles has received increased attention from the research community in recent years. Intrusion Detection Systems (IDSs) are one of the techniques used to detect and mitigate cybersecurity risks. This paper proposes a novel implementation of an IDS for in-vehicle security networks based on the concept of multi-scale histograms, which capture the frequencies of message identifiers in CAN-bus in-vehicle networks. In comparison to existing approaches in the literature based on a single histogram, the proposed approach widens the informative context used by the IDS for traffic analysis by taking into consideration sequences of two and three CAN-bus messages to create multi-scale dictionaries. The histograms are created from windows of in-vehicle network traffic. A preliminary multi-scale histogram model is created using only legitimate traffic. Against this model, the IDS performs traffic analysis to create a feature space based on the correlation of the histograms. Then, the created feature space is given in input to a Convolutional Neural Network (CNN) for the identification of the windows of traffic where the attack is present. The proposed approach has been evaluated on two different public data sets achieving a very competitive performance in comparison to the literature.

1. Introduction

Cybersecurity in modern vehicles has become an active field of research as the evolution of the automotive sector has improved the computing and connectivity capabilities of modern vehicles, which support a large variety of automotive applications for traffic management, maintenance and so on. On the other side, the evolution of vehicles to the “computer on wheels“ concept has also exposed vehicles to the risk of cybersecurity threats as described in various surveys in this topic [1,2,3]. These surveys identify the key threats in the automotive sector and the correspondent mitigation techniques, which can be based on cryptographic solutions or analysis of the in-vehicle networks traffic with Intrusion Detection System (IDS). This study focuses on the design of a novel IDS approach for in-vehicular networks based on the CAN-bus standard.
In the ICT domain, the application of IDSs! (IDSs!) to mitigate cybersecurity attacks is well known and they have been used for more than 30 years. IDSs are usually based on the analysis of the network traffic to highlight anomalies or specific traffic patterns, which may point to an attack [4]. The main metrics of evaluation of IDSs are the detection accuracy and the time to detect an attack in the shortest time possible so that an appropriate countermeasure can be implemented. In ICT infrastructure, computers and network components (e.g., routers) are usually the main assets to protect from attacks. In modern vehicles, the assets to be protected are sensors (e.g., engine or tyre sensors), actuators (e.g., bracking systems) and the Electronic Control Unit (ECU)s, which are the computing platforms used to control and monitor the engine and transmissions. The various electronic components in the vehicles are connected through various in-vehicle networks like CAN-bus, FlexRay and LIN [2,
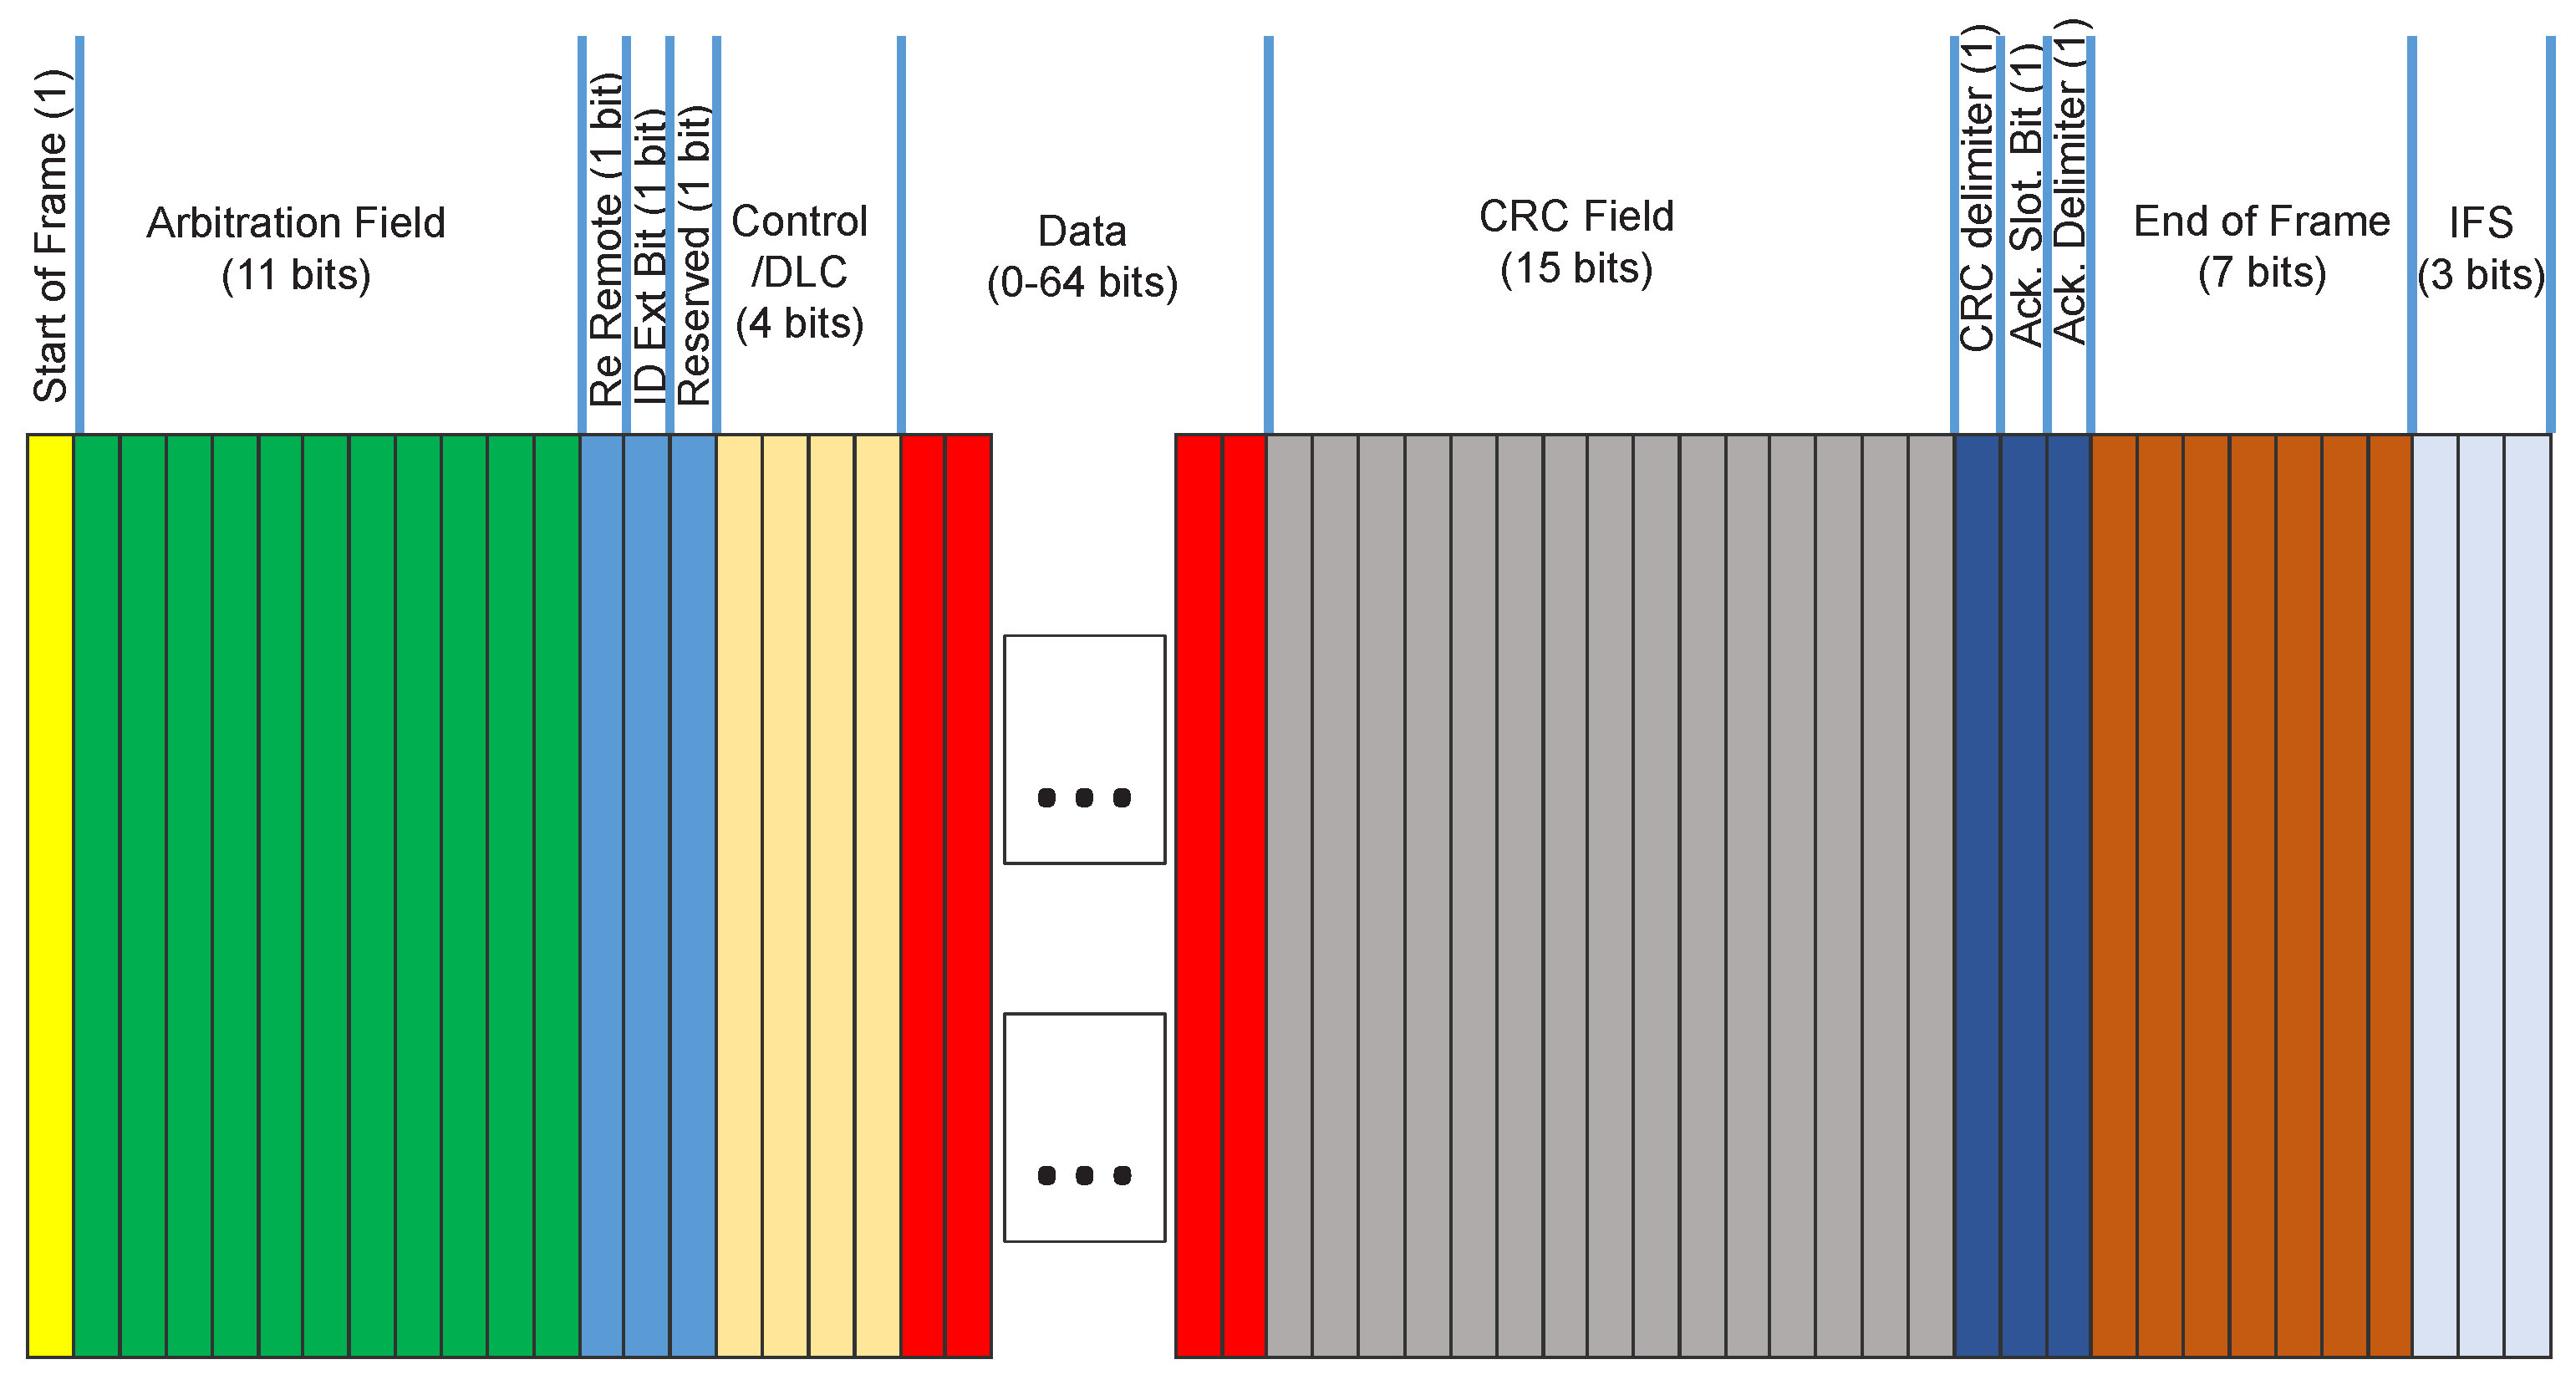
5]. This paper focuses specifically on attacks on the CAN-bus as it is the most widely deployed in-vehicle network standard in the world. A description of the CAN-bus protocol is provided later in this paper.
Contribution of this paper: The implementation of an IDS in in-vehicular networks has been proposed in the literature using different techniques as described in Section 2. One category of IDS is based on the creation of dictionaries or a model of legitimate/normal CAN-bus traffic (without attacks), against which the traffic with attacks is evaluated. In particular, the frequency of appearance or the entropy of CANIDs (one of the fields of the CAN-bus protocol, which identifies the message) is calculated in sliding windows of CAN-bus traffic. The problem with these approaches is the detection accuracy may not be optimal even if they are computing efficient [6]. Other approaches are based on the analysis of the sequences of CAN-bus messages, but the selection of the optimal sequences can also be challenging because it depends on the attack implementation [7]. Recently, various authors have applied Deep Learning (DL) with excellent detection performance at the cost of a significant computing complexity especially with large data set with millions of CAN-bus messages [7,8].
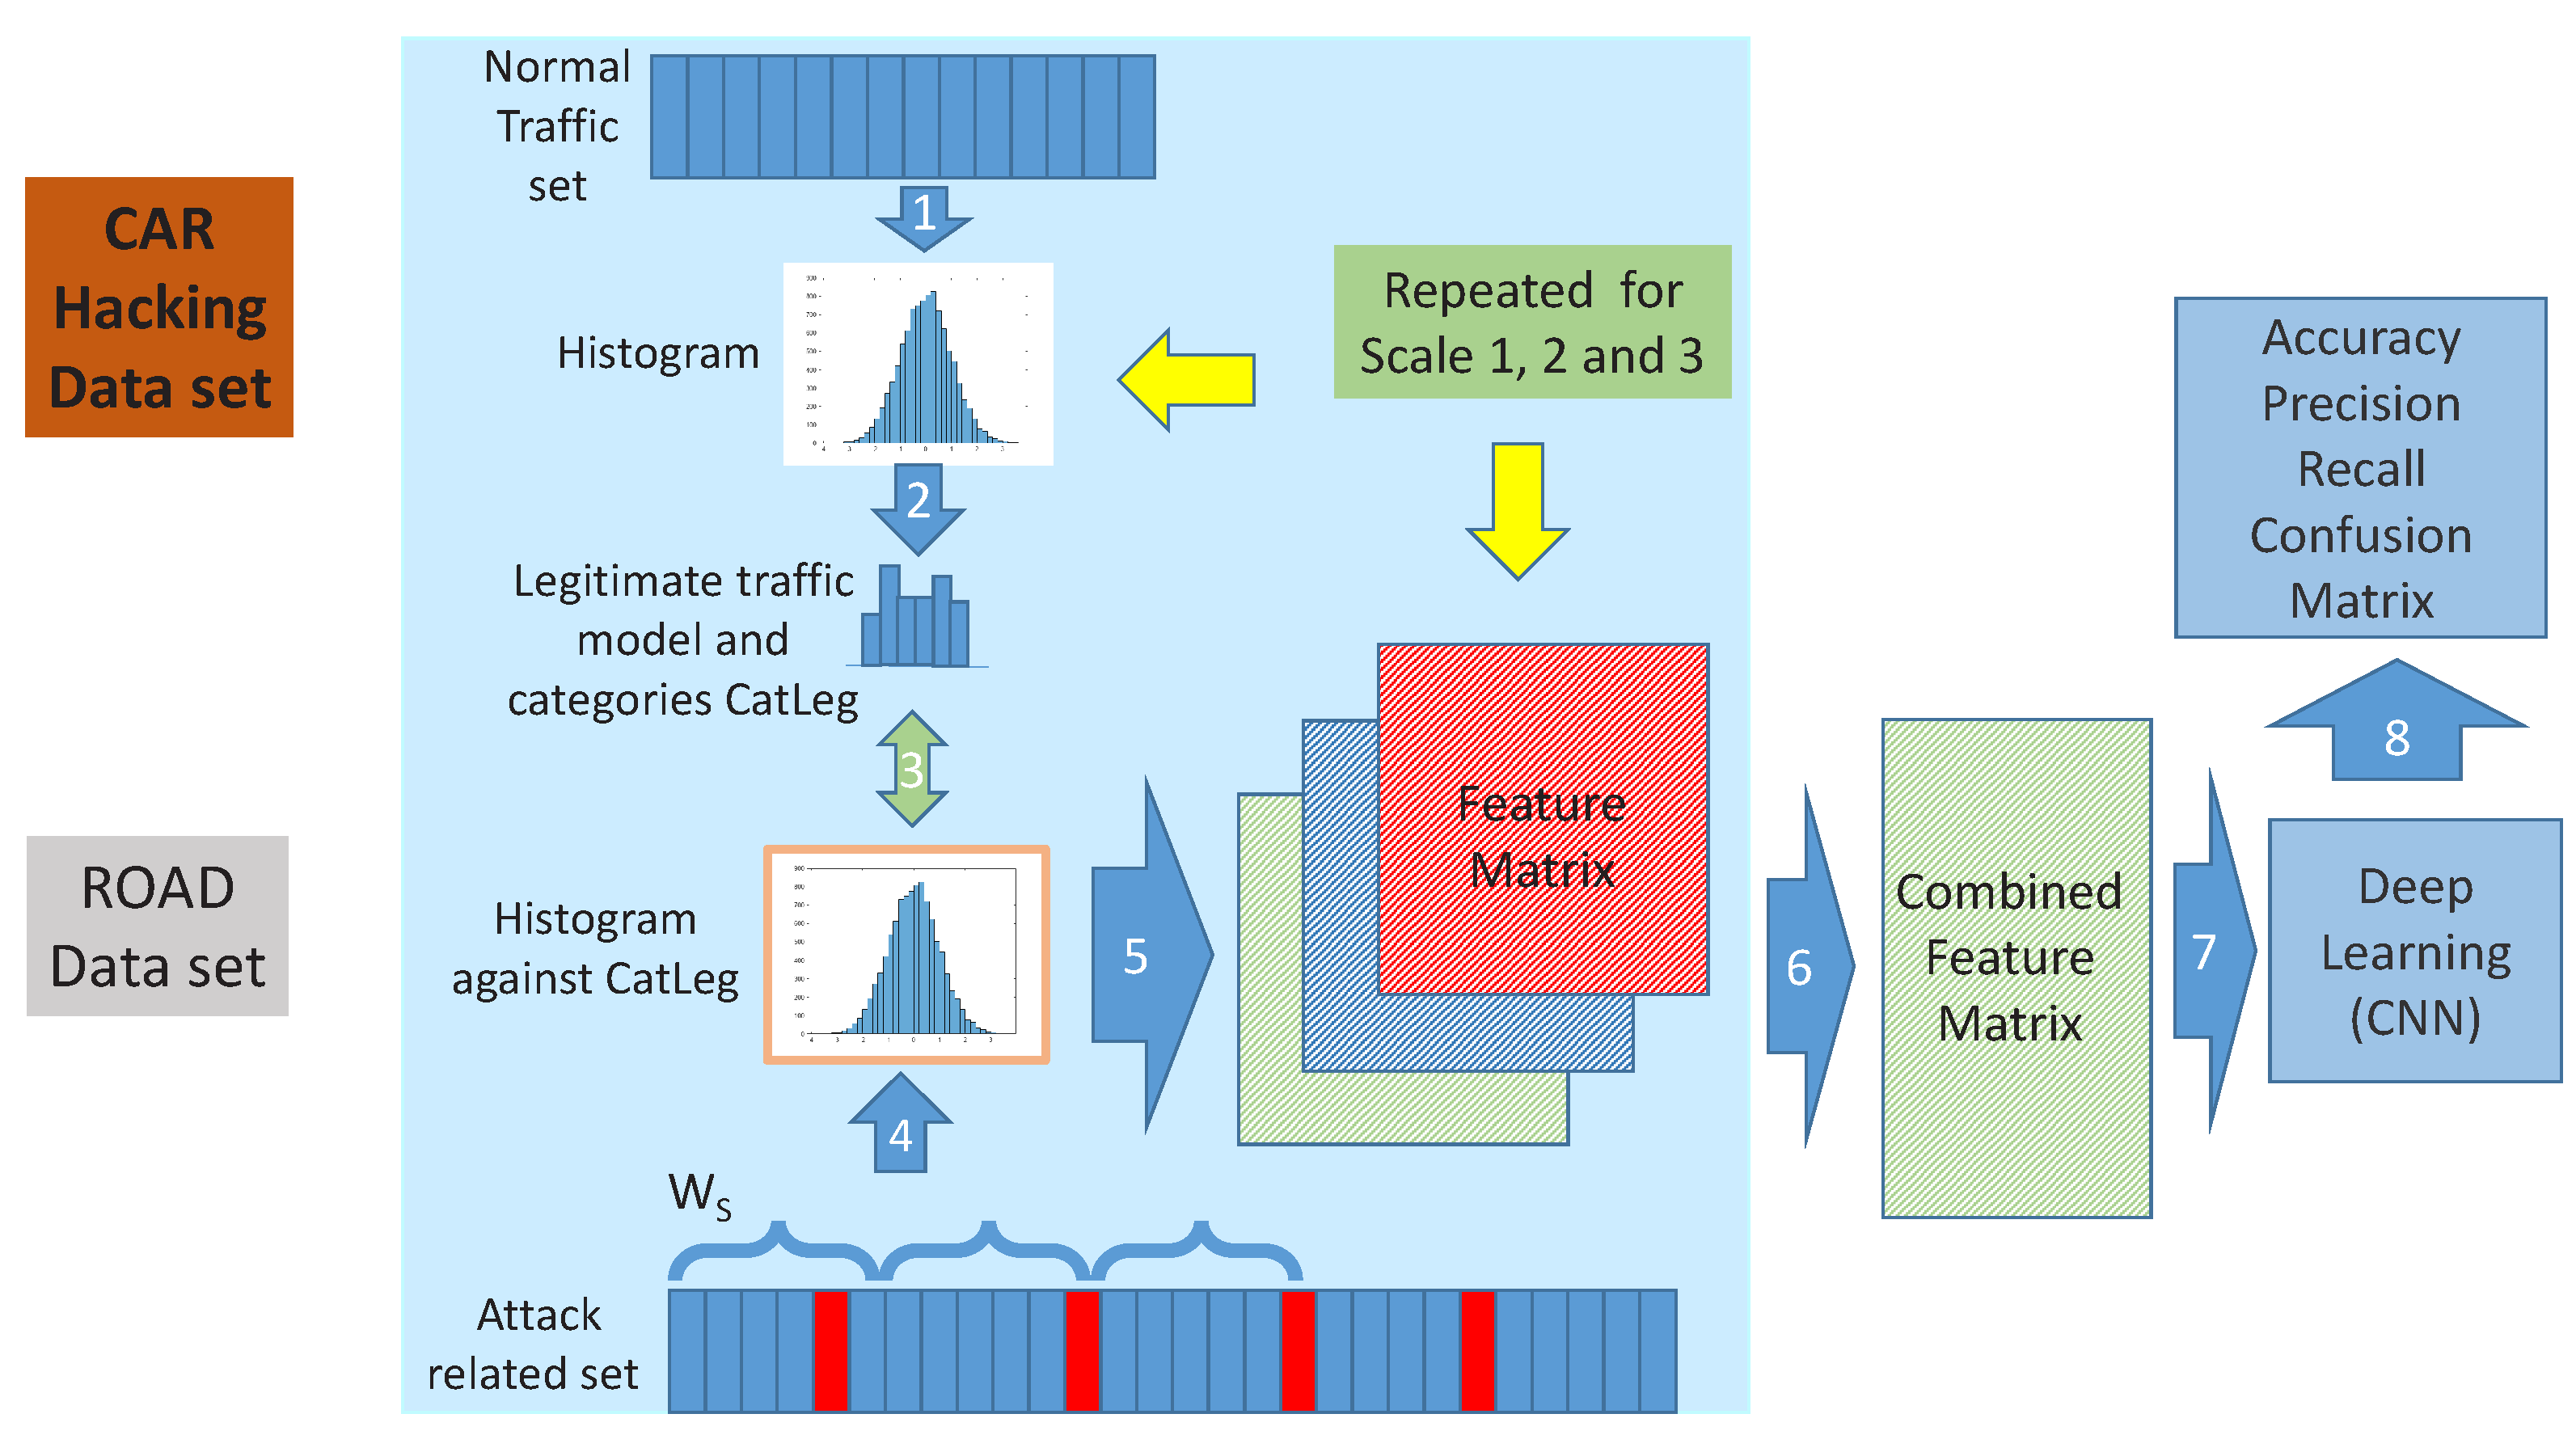
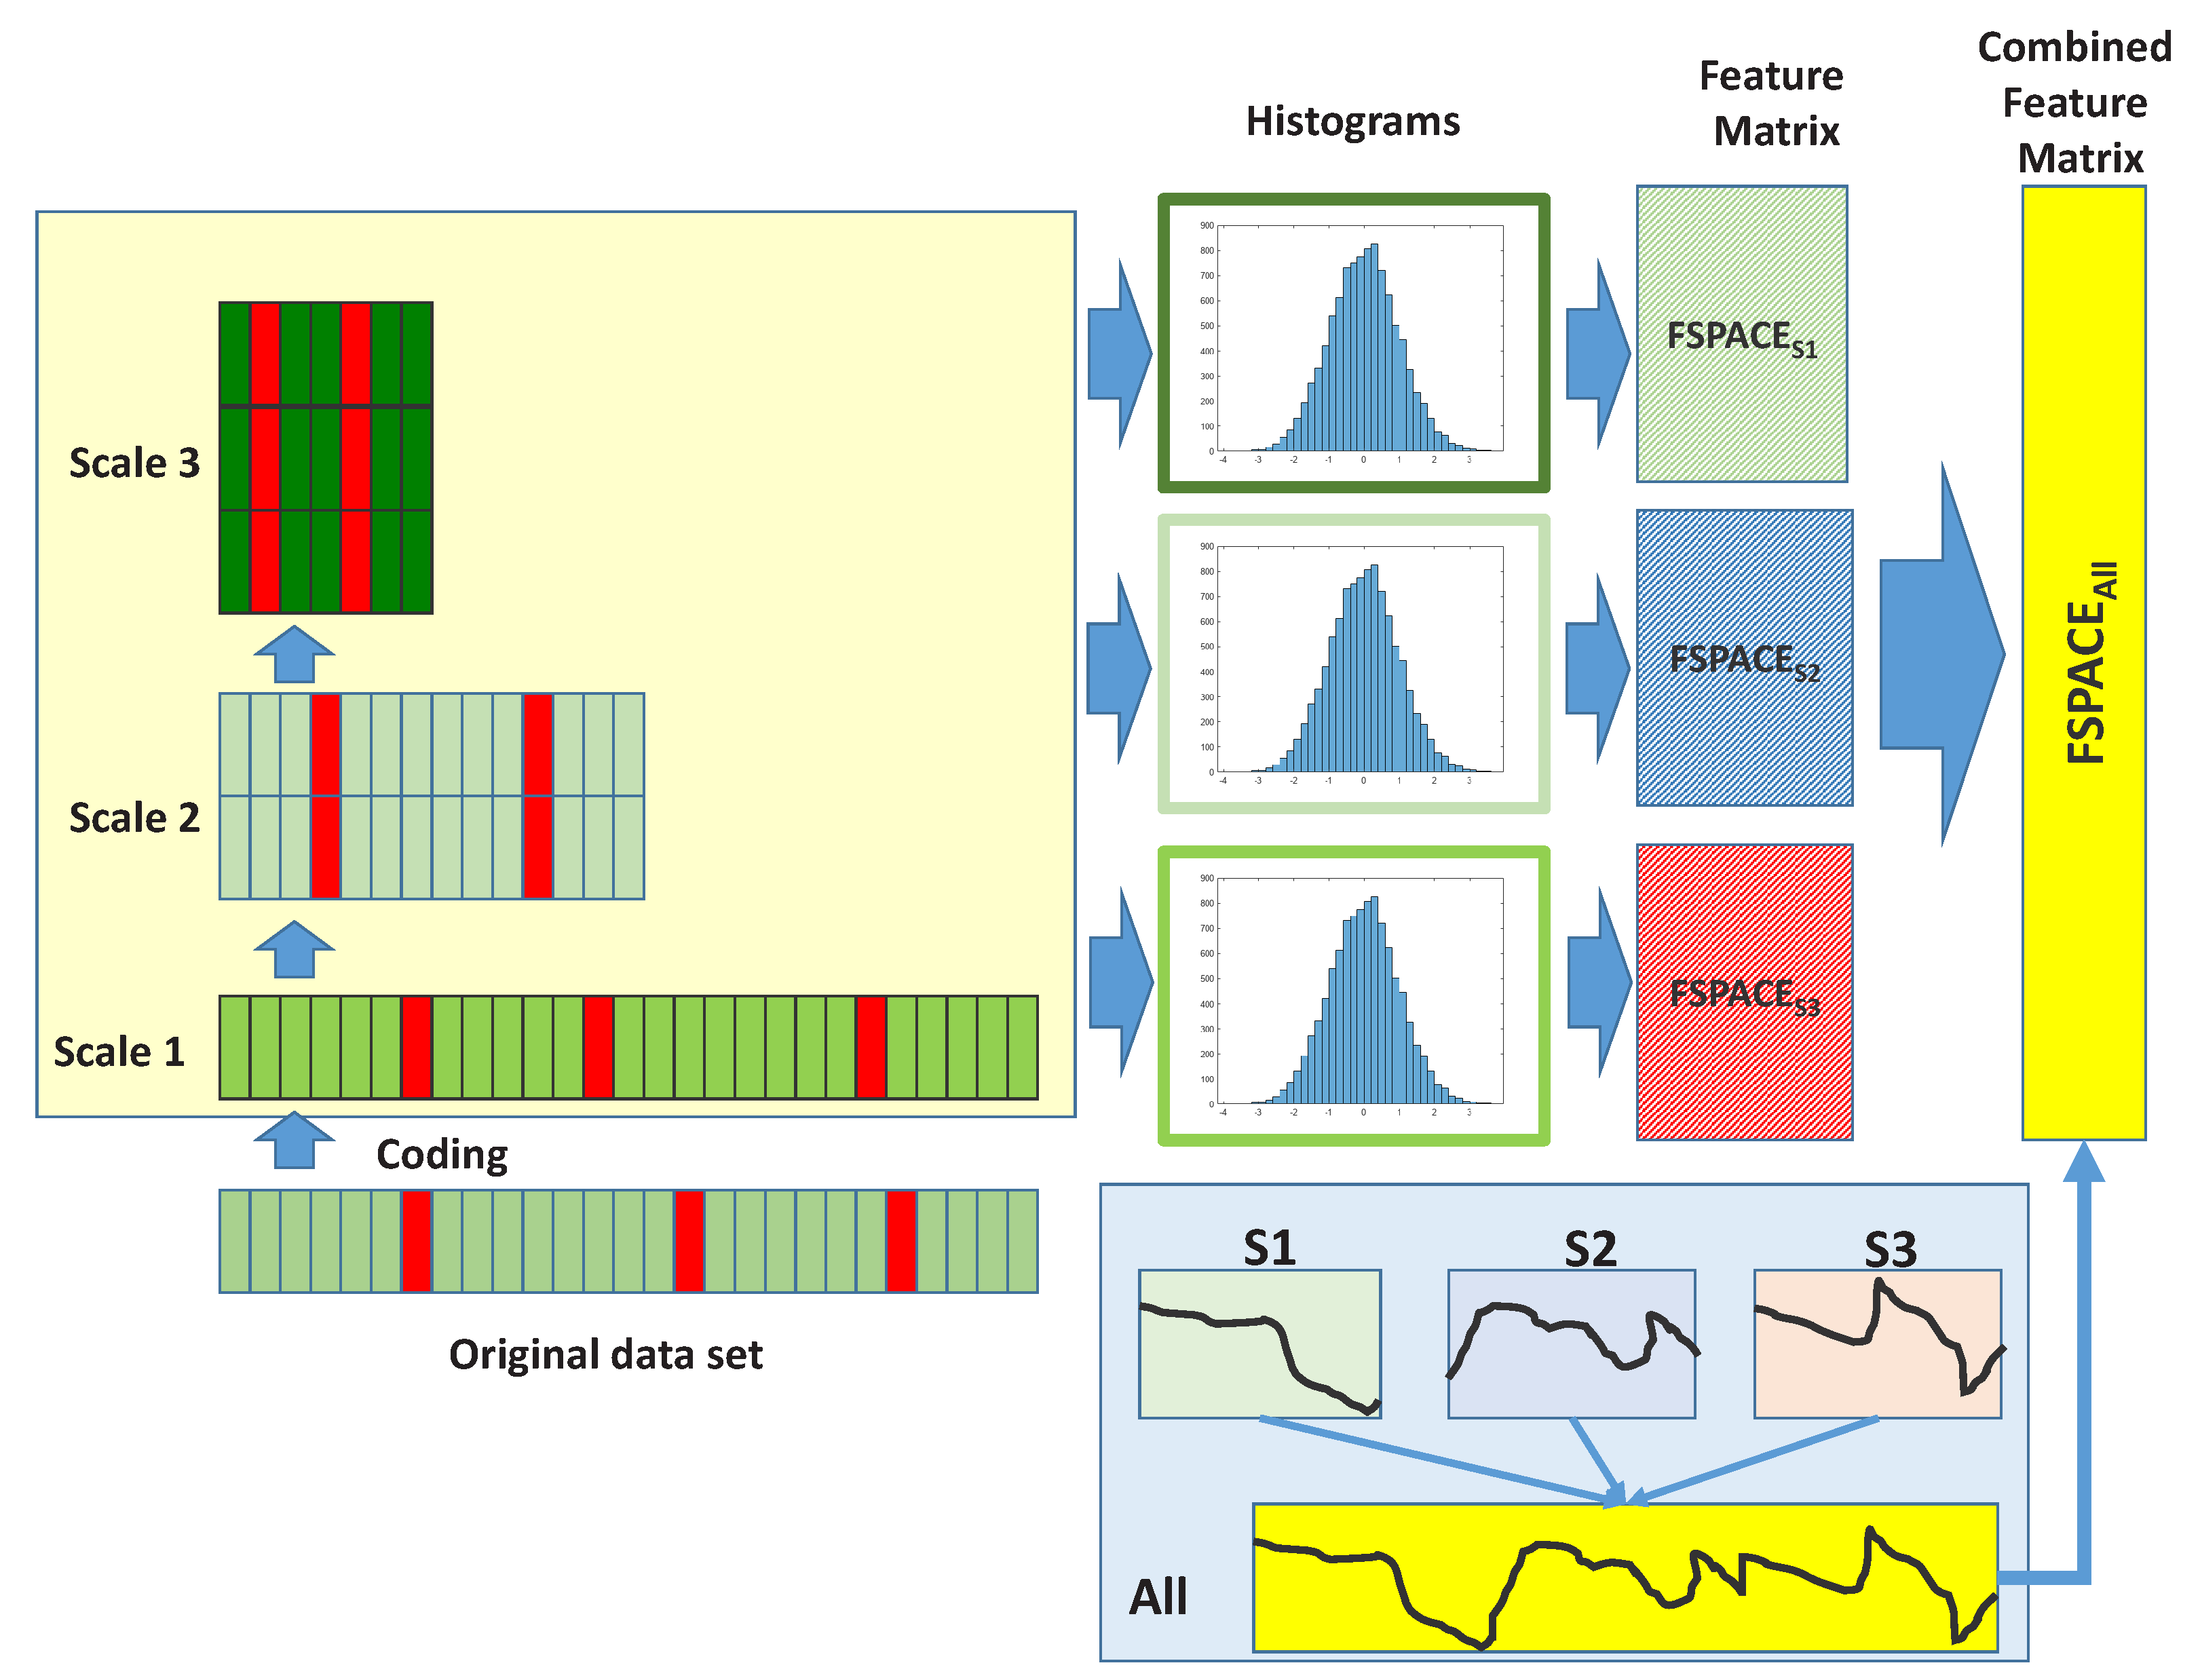
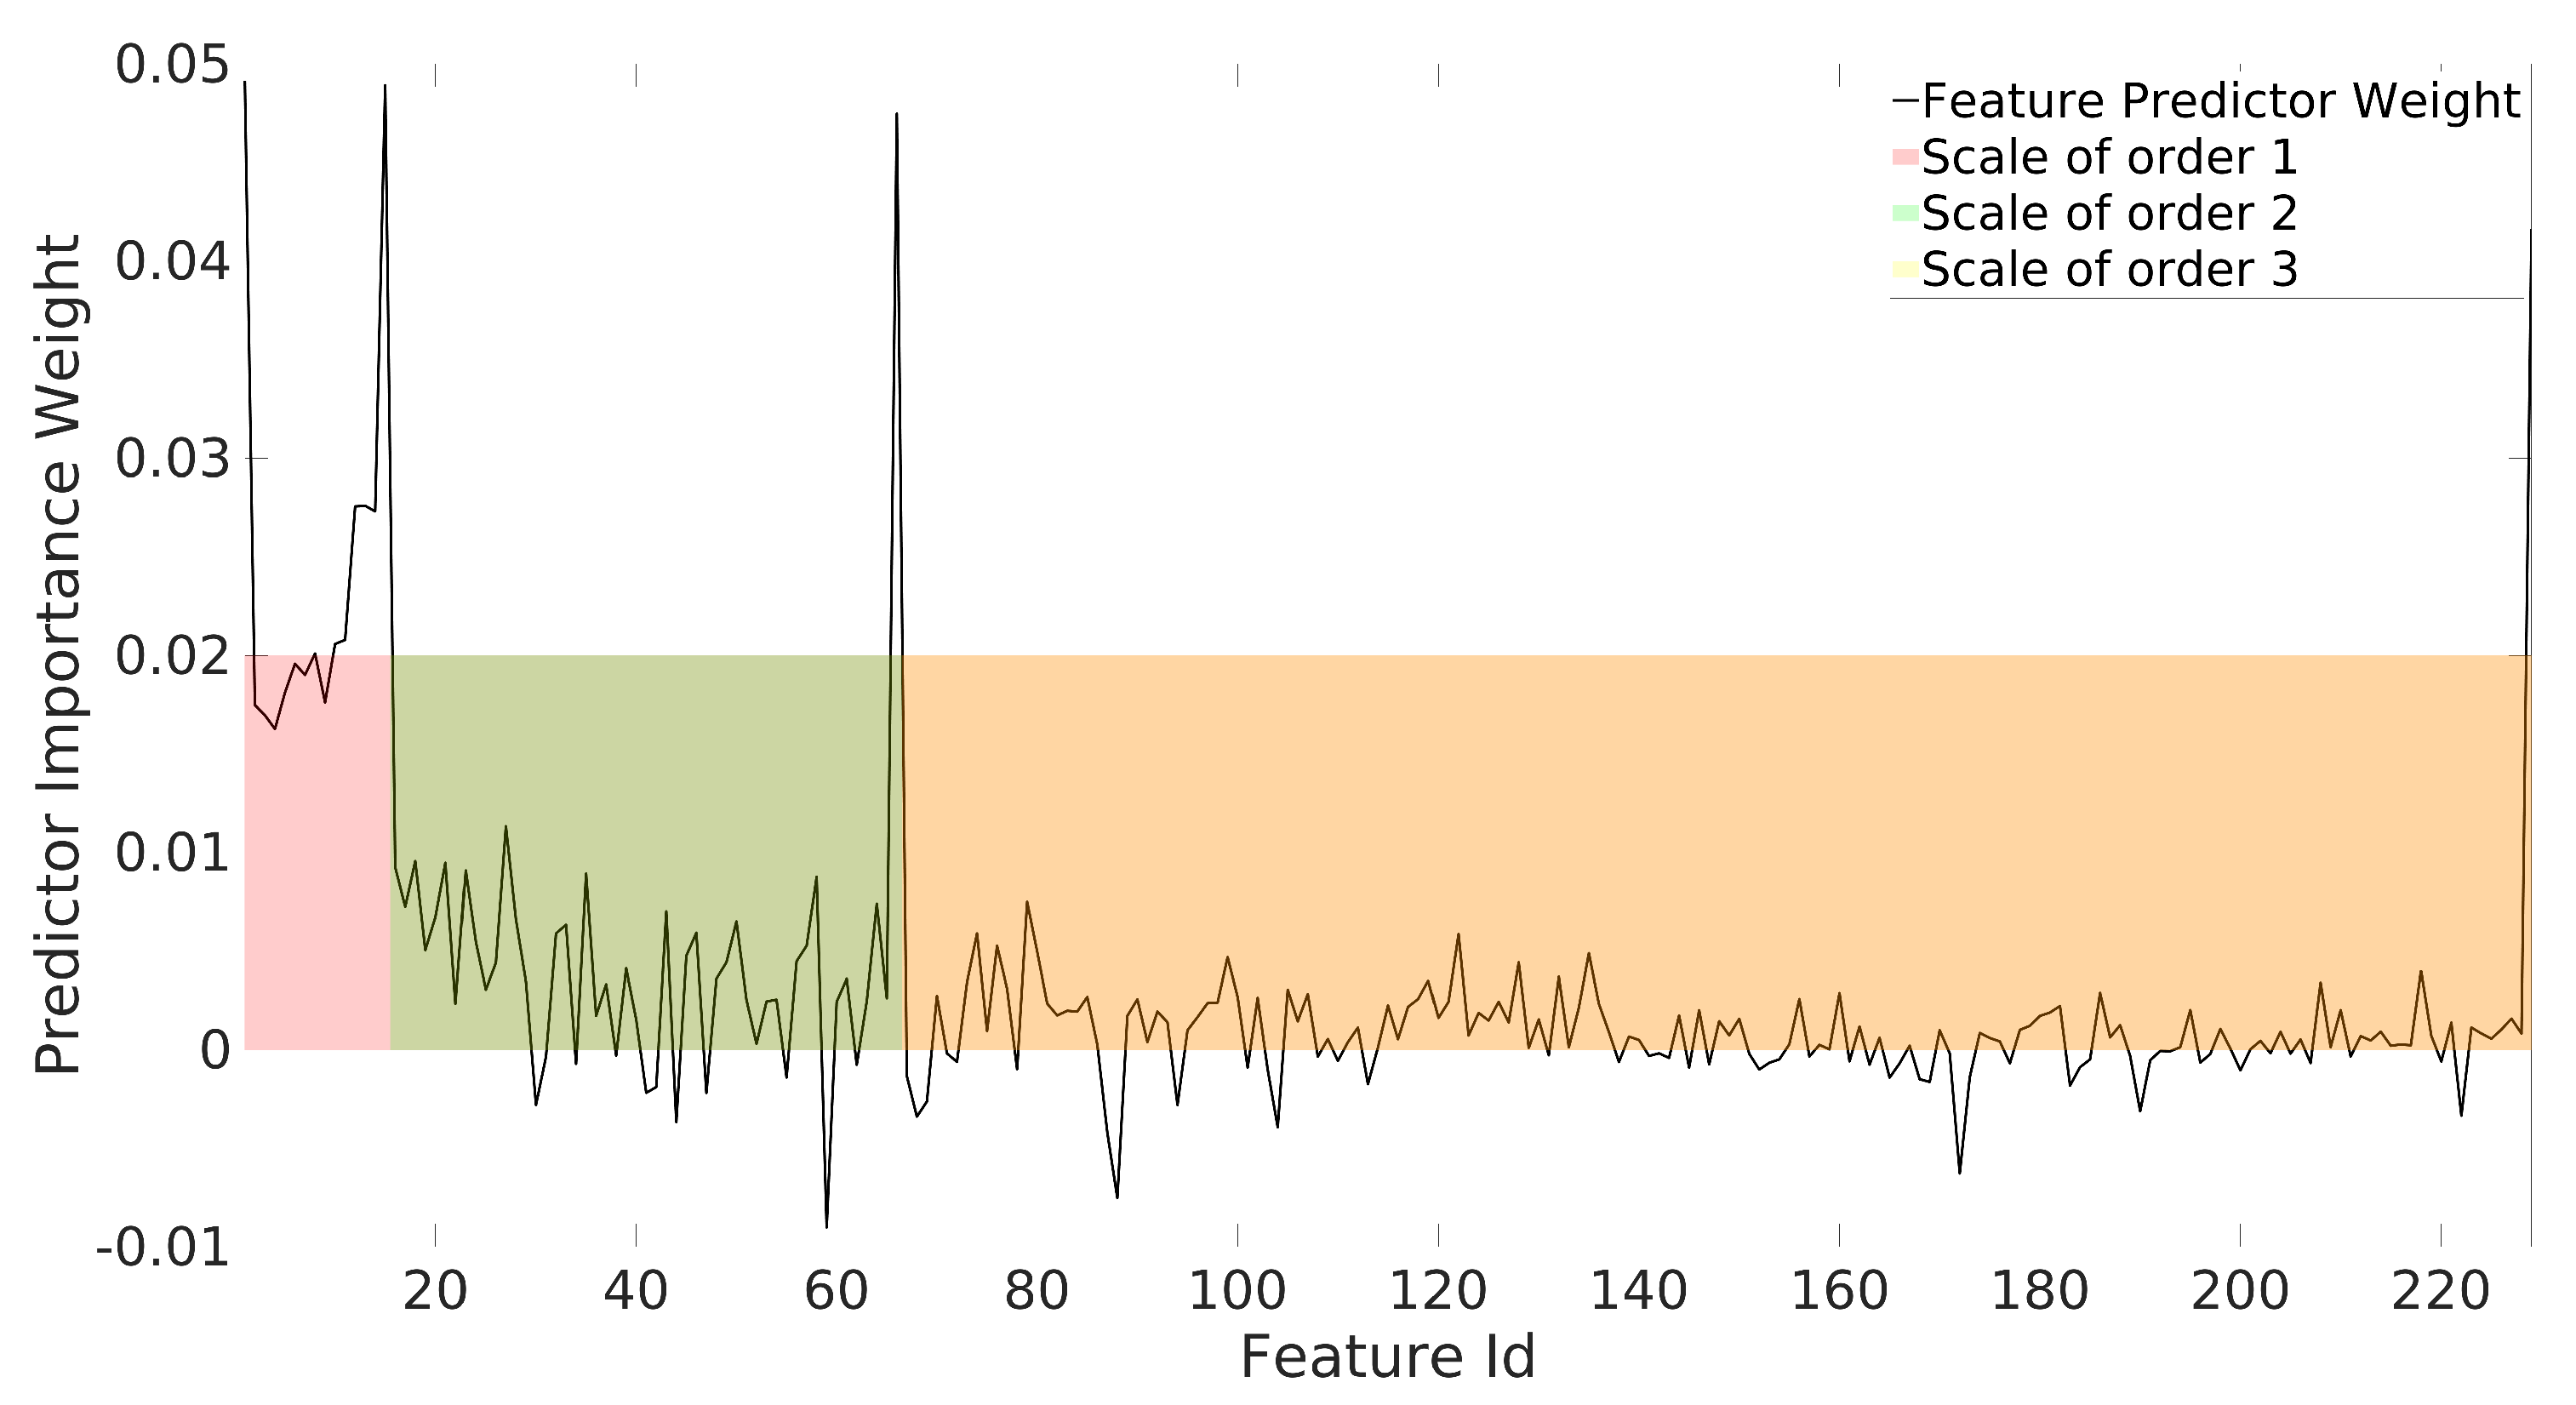
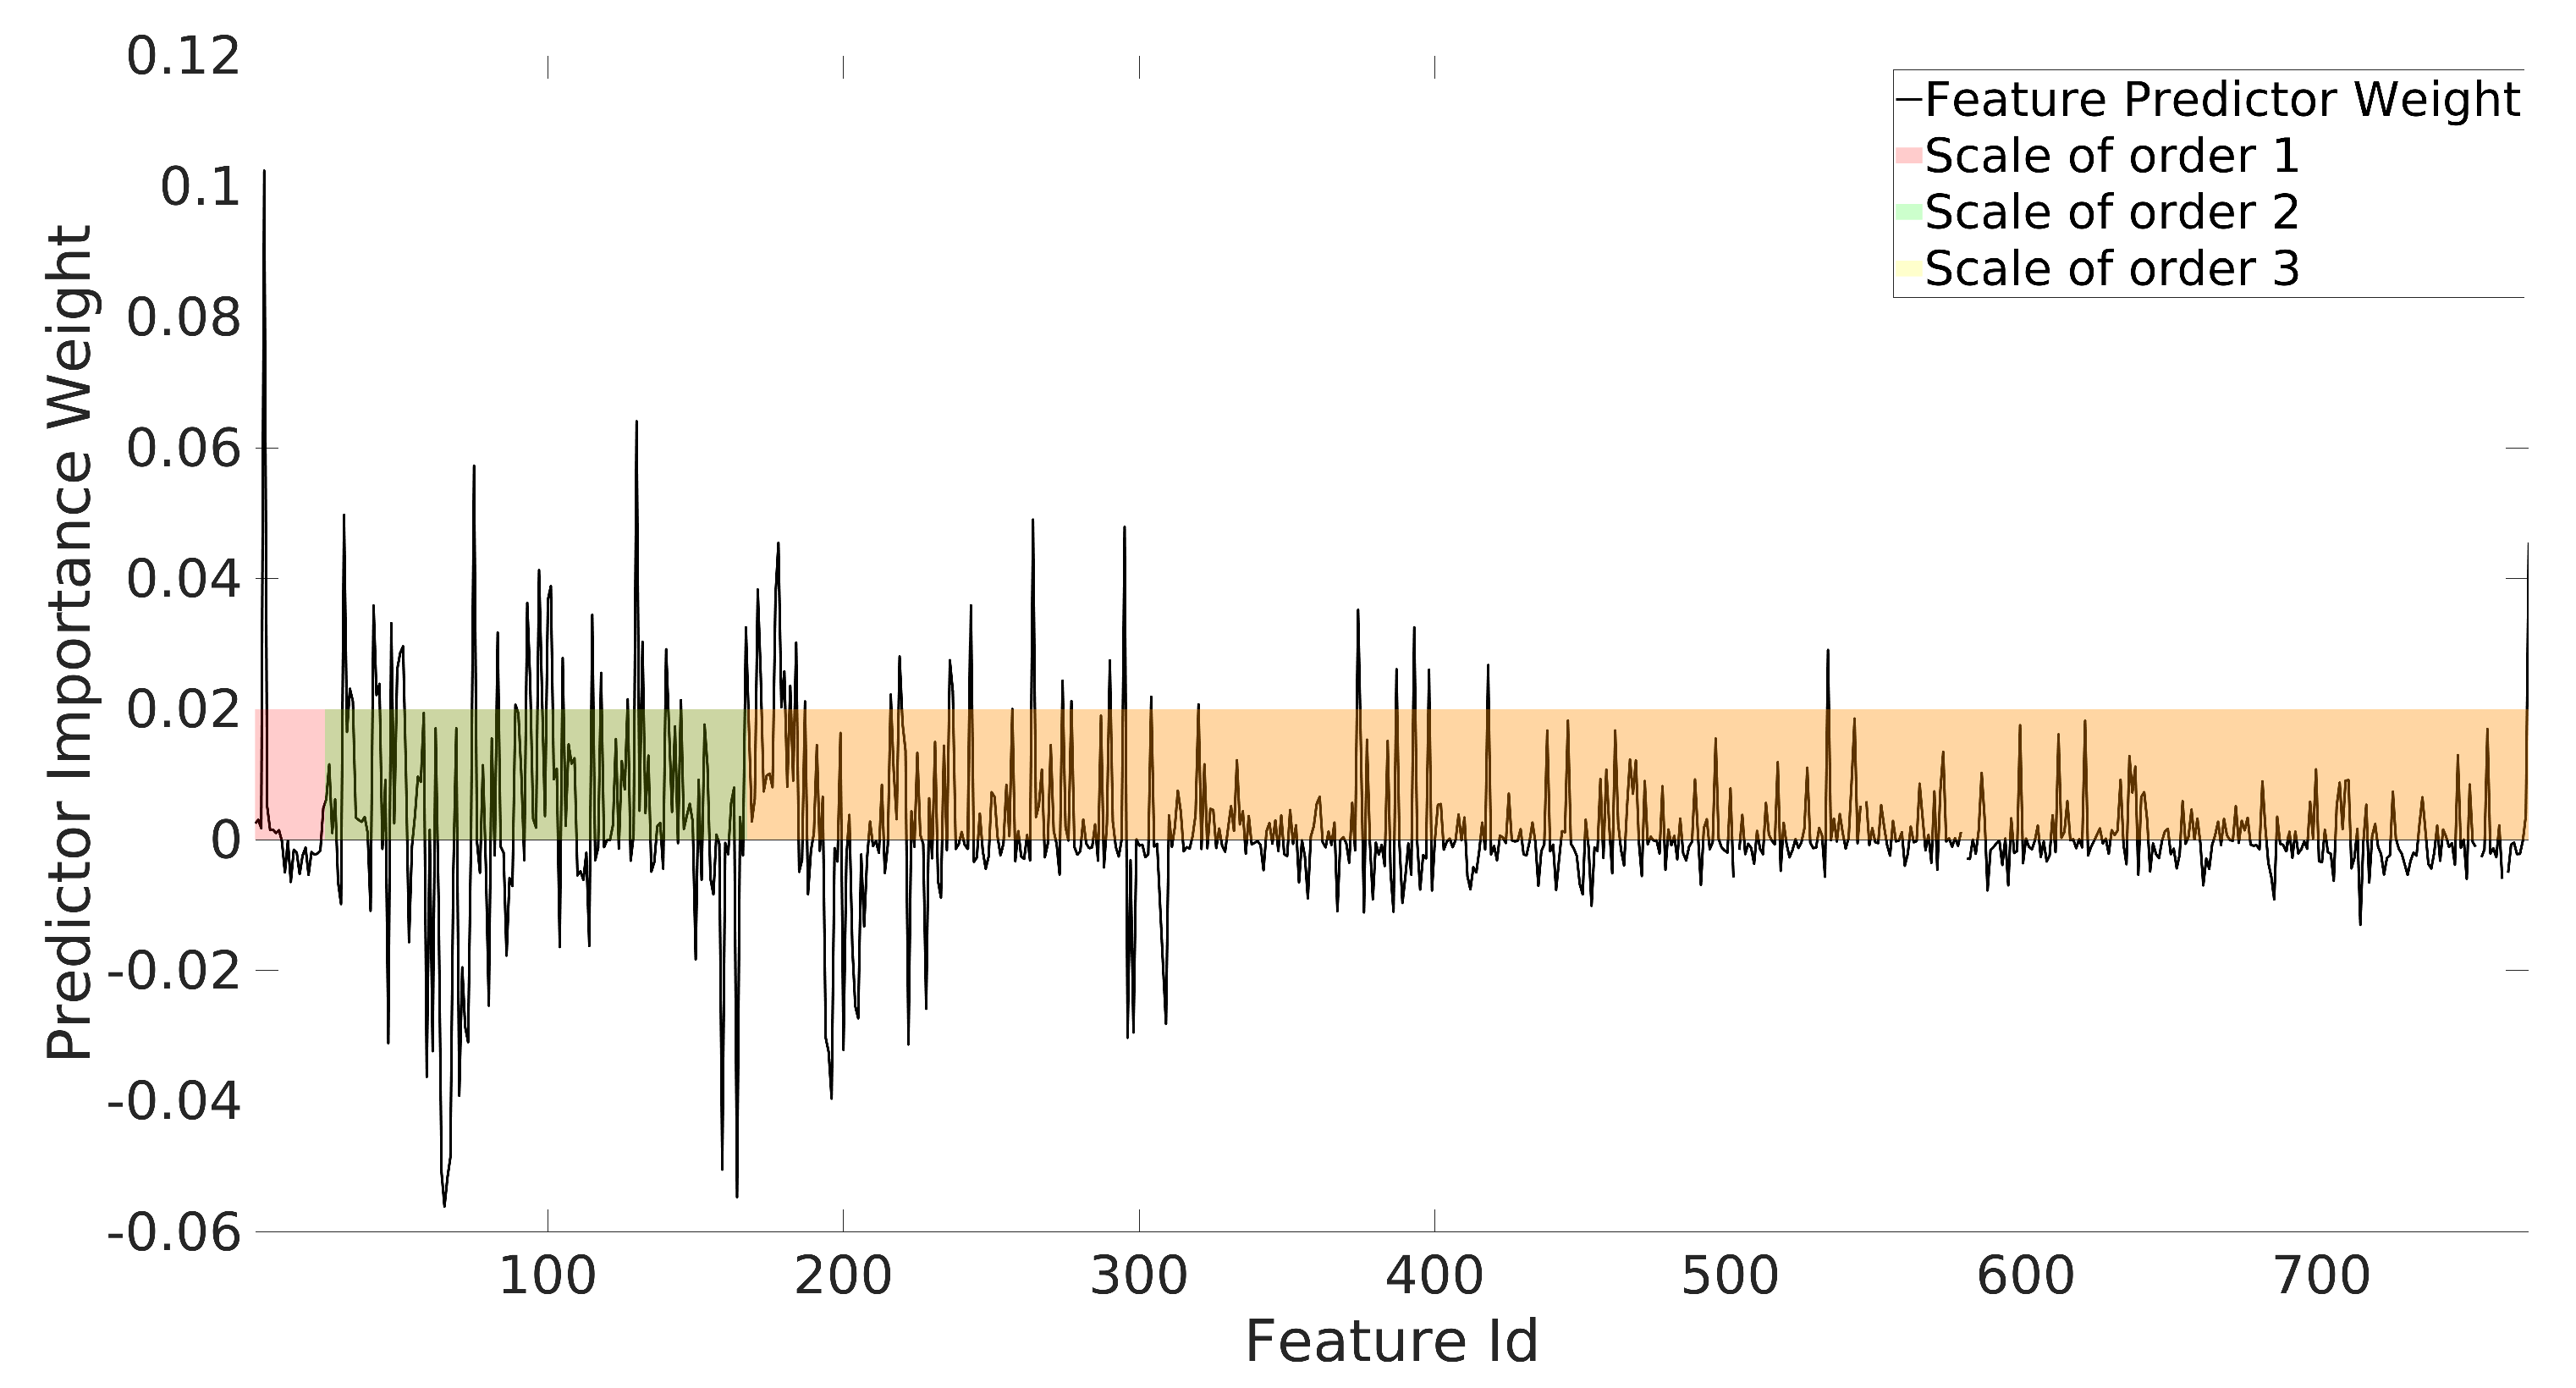
As described in the subsequent sections, this paper proposes a combination of these methods by (1) adopting a multi-scale histogram method to build the dictionary of sequences of CANIDs instead of relying only on the frequency of single CANIDs, and (2) using the created dictionaries to generate a feature space on which DL is applied. The advantage and novelty of the proposed approach is based on the combination of the methods to overcome the limitations of the frequency-based single CANIDs approach, meaning it exploits the strength of the CANIDs sequence methods (through the multi-scale histograms) and the power of DL by mitigating the disadvantage of the DL (which requires significant computing effort), because the DL is applied to the reduced feature space rather than all the CAN-bus traffic. To the knowledge of the author, a multi-scale histogram approach for IDSs has not been applied in the literature and combined with DL.
Scope of this paper: The author would like to highlight that the scope of this paper is to propose a new approach for an IDS based on multi-scale histograms and DL, which is targeted to Denial of Service (DOS) and spoofing attacks as described in the data sets used to evaluate the approach. This paper does not aim to address attacks related to the users like chatbots or deep fakes or other attacks outside the ones defined in the used data sets. The two data sets have been chosen for the following reasons. The first data set is the Car Hacking data set created by the Hacking and Countermeasures Research Lab [9,10]. This data set has been extensively used by the research community working on IDSs for in-vehicular networks and it is also used in this paper for benchmark reasons. The data set addresses DOS, Fuzzy and spoofing attacks. The Car Hacking data set was one of the first data sets created for IDSs for in-vehicular networks, but it has some limitations, which have been analyzed in literature [11]. For this reason, the proposed approach has also been validated on the ROAD dataset [11,12], which contains ambient data recorded during a diverse set of activities, and attacks of increasing stealth with multiple variants and instances of real fuzzing, fabrication and unique advanced attacks, as well as simulated masquerade attacks. Both data sets have been created using real automotive vehicles with CAN-bus protocol implementations. More details are in Section 3.3 and Section 3.4.
Structure of this paper: The structure of this paper is as follows: Section 2 provides an overview on the related work, which is relevant for this study. Section 3 describes the overall methodology of the proposed IDS approach. A brief description of the CAN-bus protocol is provided in Section 3.1. The main workflow of the methodology is described in 
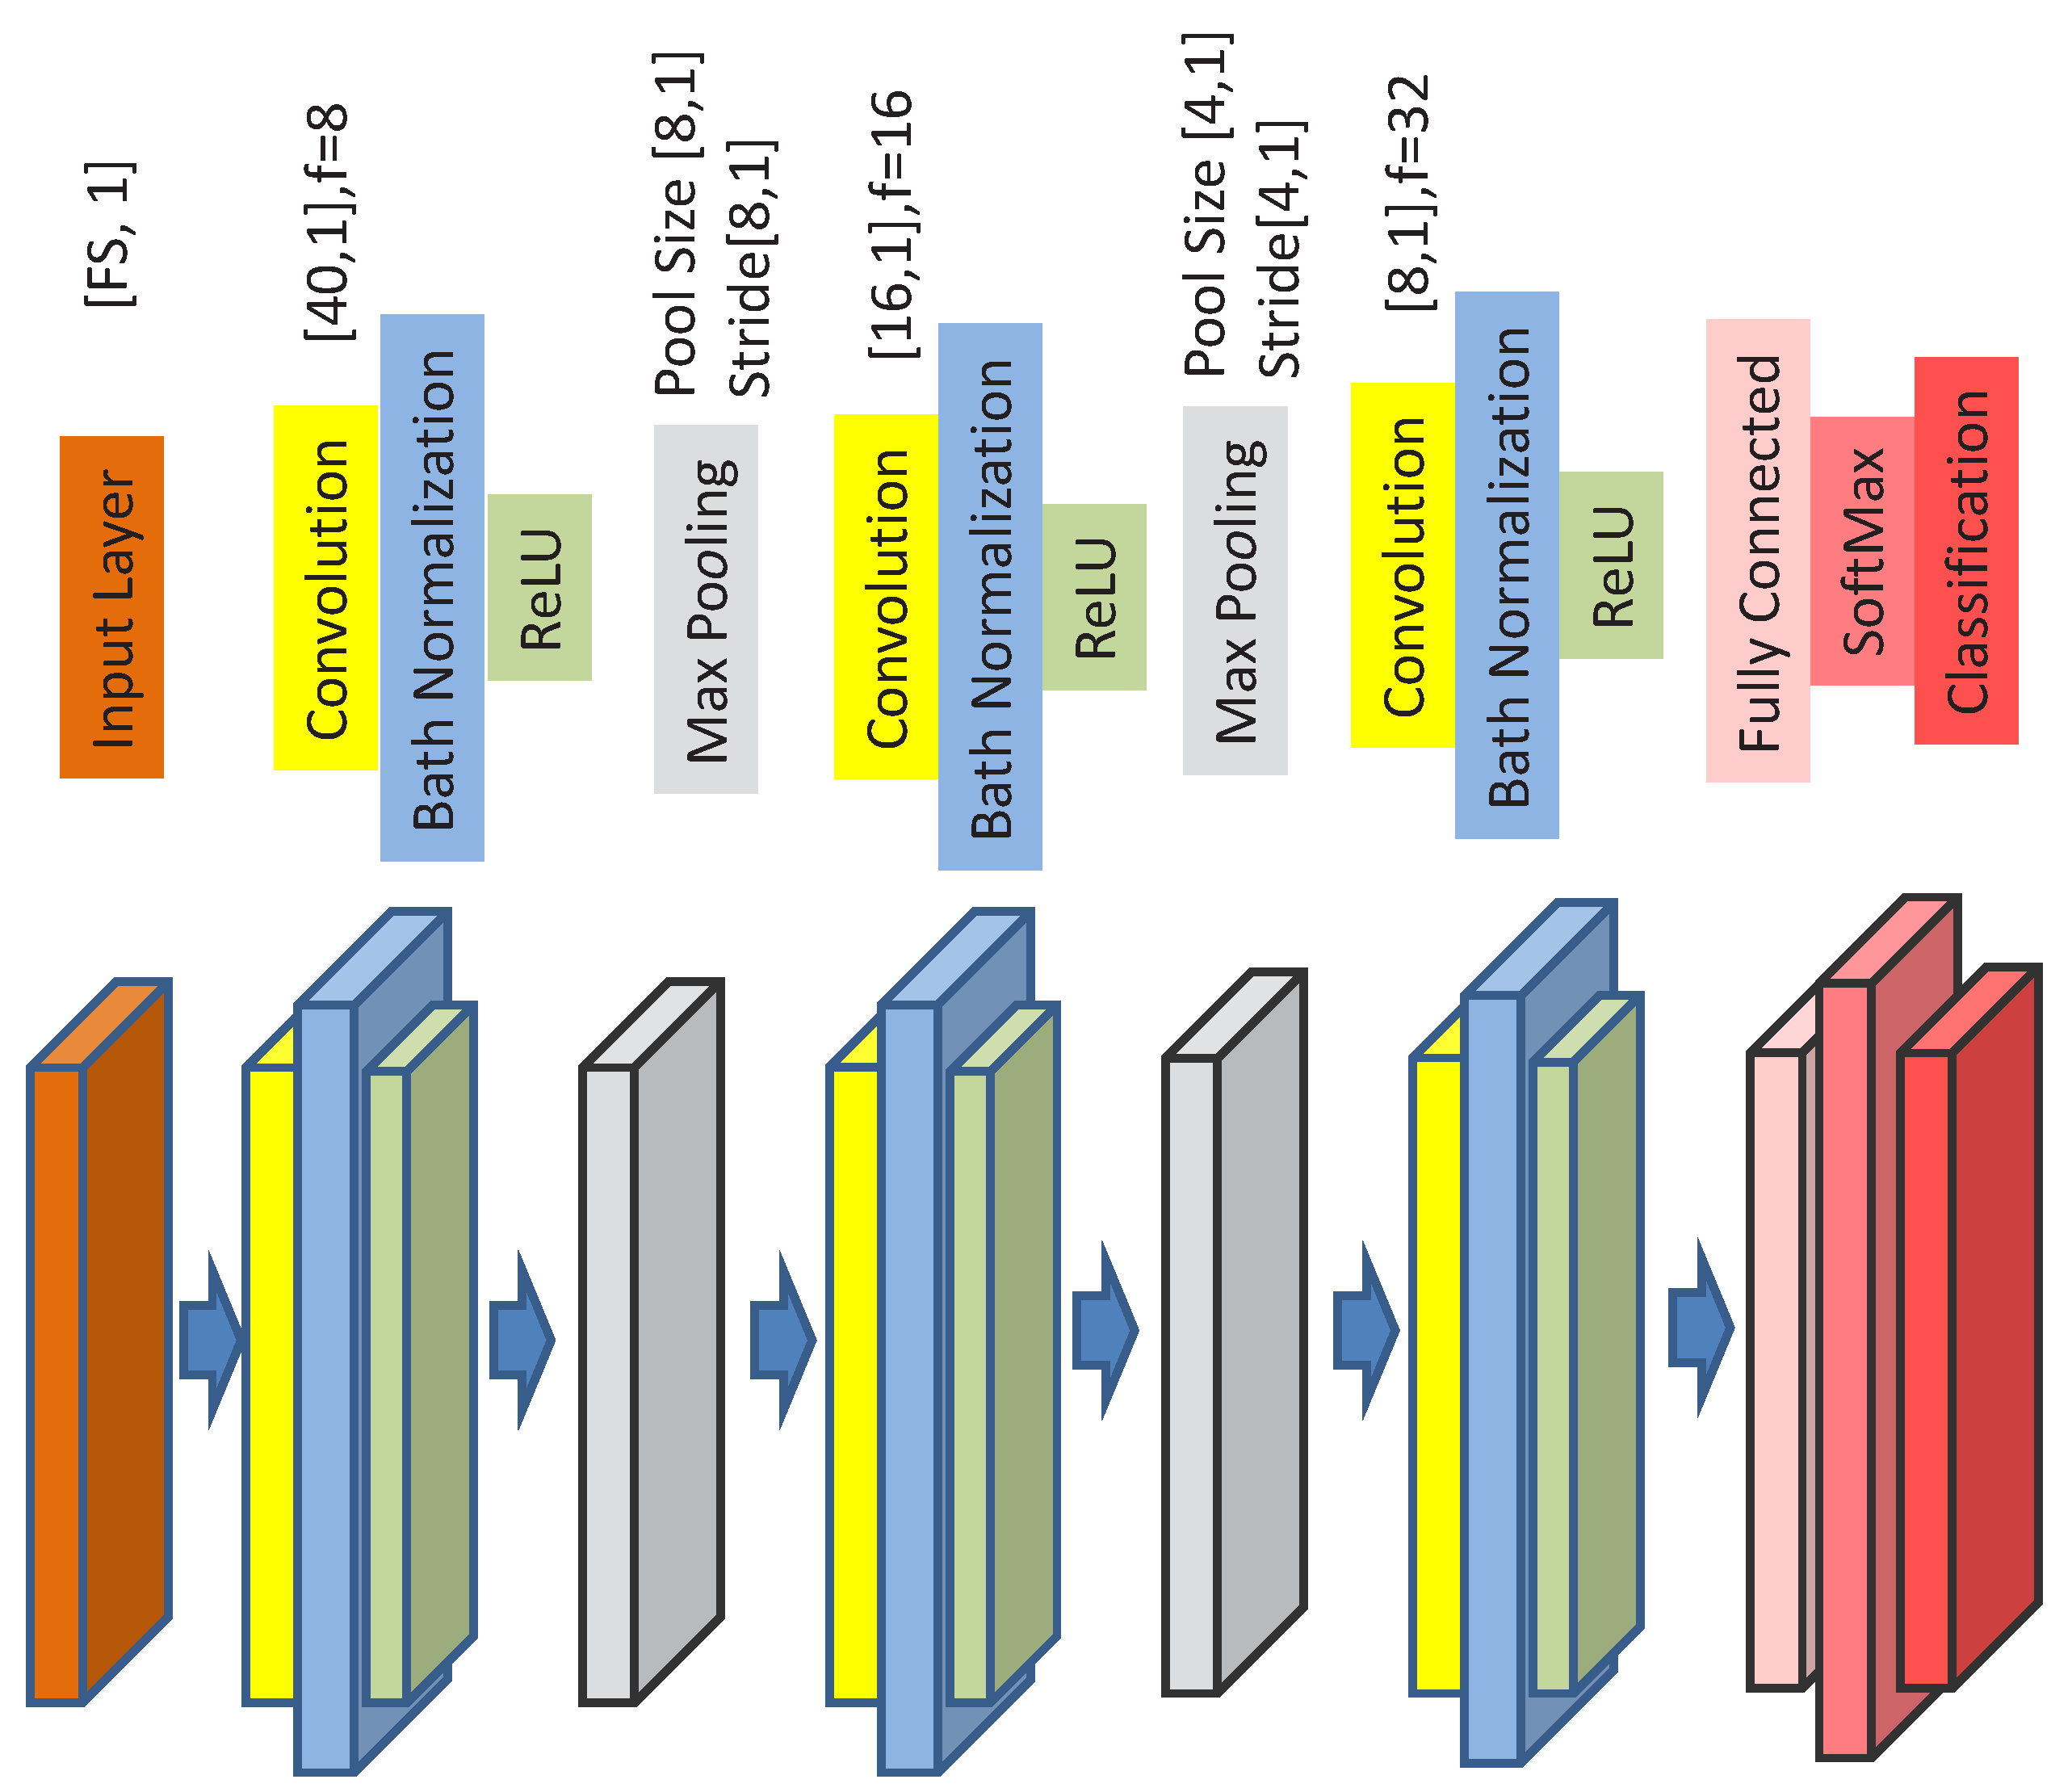
Section 3.2. One key element of the proposed approach is the architecture of the Convolutional Neural Network (CNN) described in Section 3.5. Section 3 also describes the materials used to evaluate the approach in sub-sections: the Car Hacking data set in Section 3.3 and the ROAD data set in Section 3.4. This paper uses two recent public data sets of in-vehicle network traffic with both legitimate traffic and attacks. Each public data set has a different set of attacks. Finally, Section 3.6 identifies the metrics of evaluation and concludes Section 3.
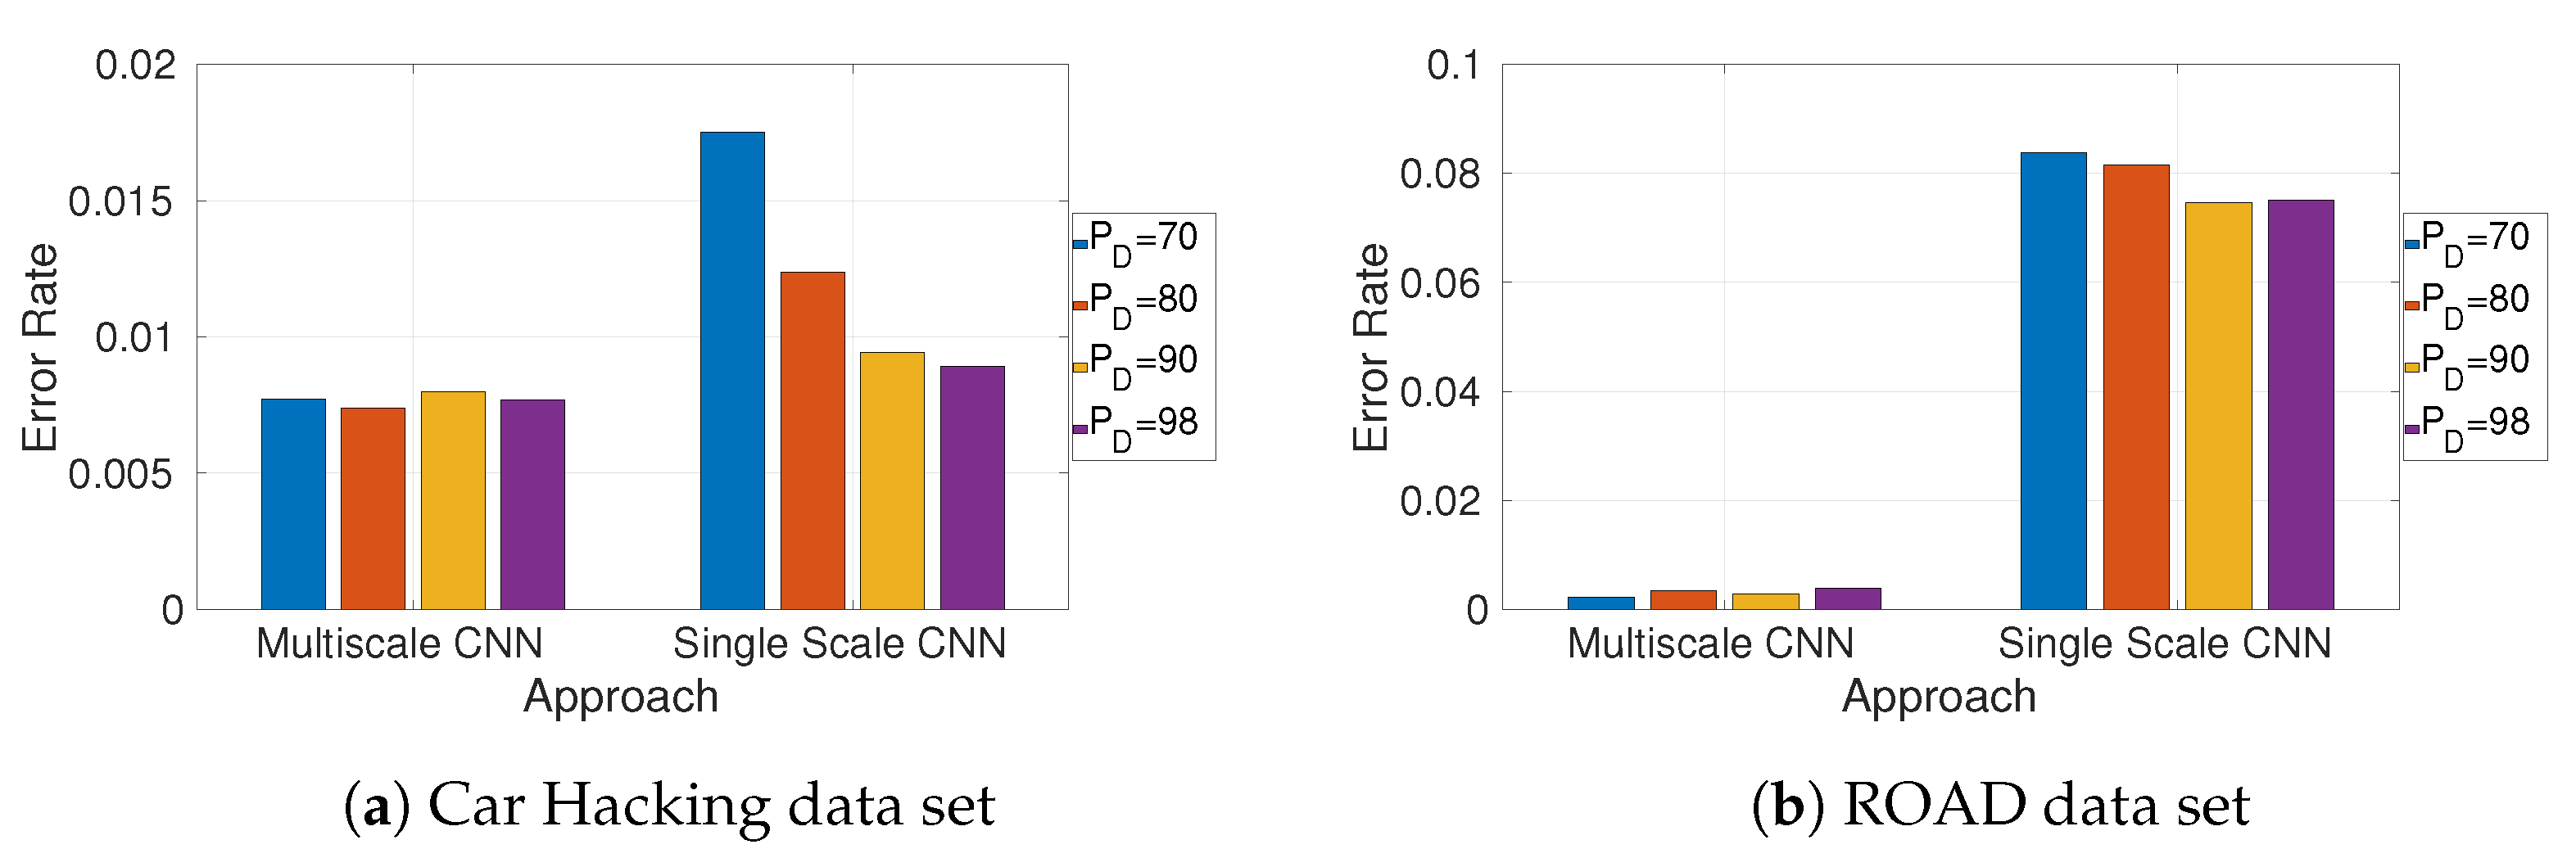
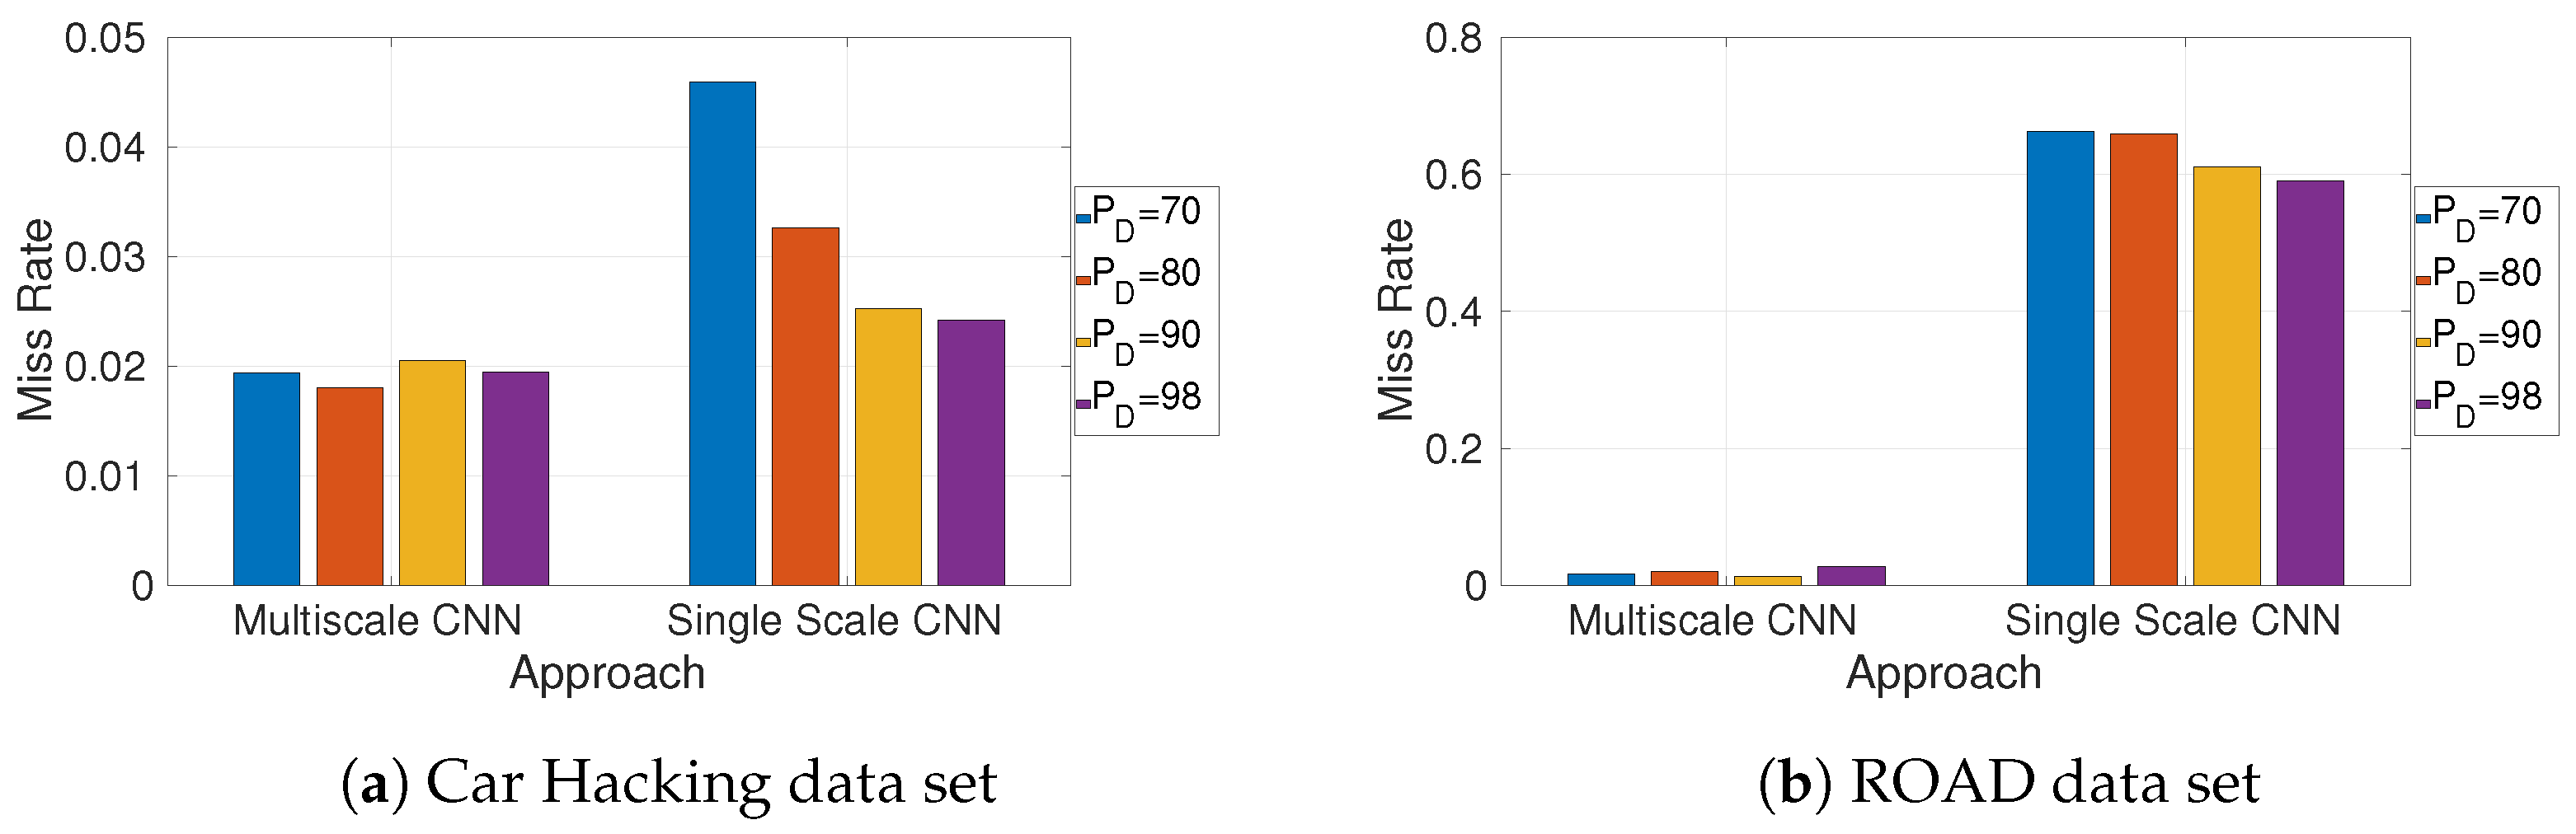
Section 4 presents the results of the application of the proposed approach on the two different data sets. This section also provides a comparison with the results obtained by other studies presented in the research literature on the same data sets. Finally, Section 5 concludes this paper and points towards future developments.

3. Materials and Methods

3.1. CAN Protocol

The CAN-bus protocol is one of the most popular in-vehicle network standards in the world [5]. It was invented by Robert Bosch GmbH and officially released in 1991. CAN-bus is structured as a broadcast message-based protocol and it was designed for robust communication among ECU, sensors and actuators in the vehicle. The term robust is meant for robustness against electrical disturbances, magnetic effects, which are common in automotive vehicles. It was also designed to be cost-effective to mitigate the impact on the overall cost of the vehicle. Cybersecurity aspects were not taken into consideration in the initial design because they were not considered a high-priority risk at that time due to the physical boundaries of the in-vehicle network (i.e., there was no connectivity to the in-vehicle networks of the car), but recent trends in connectivity have shown that the CAN-bus (and the connected ECUs) can be subject to digital attacks as demonstrated by [1].
A description of the standard CAN-bus (in the version CAN 2.0) frame structure with the identification of the specific fields is provided in Figure 1 with CANID (i.e., the arbitration field), which represents the CAN message identifier and the CAN-bus payload data, which is composed of 64 bits (8 bytes). The CANID field for each transmitted CAN frame indicates the packets’ priority. In the CAN-bus standard, the priority of the transmitted packet is inversely proportional to the value of the CANID field.
Figure 1. Frame structure of the CAN-bus protocol.

3.2. Workflow

The overall workflow of the proposed approach is shown in Figure 2, while the specific aspect of the histograms creation is shown in Figure 3.
Figure 2. Main workflow of the proposed approach. The explanations of each methodology step are provided in Table 1.
Figure 3. Detailed aspect of the feature matrix creation. The bottom right corner shows how the features for each scale are concatenated in the final  F S P A C E A l l .
The description of all the data flows used in the workflow is provided in Table 1. The identifier in the first column of the table corresponds to the identifier appearing in Figure 2.
Table 1. Data flows of the workflow.
The workflow is based on the following concepts and steps, and it is the same workflow both for the Car Hacking data set and the ROAD data set. Please note that a summary of the notations used in this paper is provided later in Section 3.7.
As mentioned previously, this approach is uniquely based on the CANID field of the CAN-bus protocol. The reasons to choose this particular field are because: (1) The number of potential CANID fields is limited by the CAN-bus protocol and in the usual CAN-bus traffic in modern vehicles. Then, it is preferred for this specific approach to the payload data, which may have a much larger and unmanageable number of permutations (i.e., 64 bits of payload data) especially for the multi-scale sequences as in this paper. (2) CANID is used heavily for IDS in in-vehicular networks especially for frequency-based IDS designs such as the one proposed in this paper, and (3) the results from the literature show that the distributions of the CANID values are altered when an attack is implemented.
  • A portion of the data set, which contains only normal or legitimate traffic, is put aside from the portion of the data set containing the attack traffic. For both data sets, one million messages were used for the legitimate traffic.
  • The CANID values are extracted from the CAN-bus traffic and converted to a numeric value. The CANID data is converted to two bytes (11 original bits plus a buffering of 5 bits set to 0 to reach a total of 16 bits). From the original hexadecimal value they are converted to a decimal value. For the multiscale 2 and 3, the CANIDs hexadecimal values were converted as well.
  • The frequency of CANID values in the legitimate traffic was estimated for the three scales: sequences of size 1, 2 and 3 to create dictionaries of CANID values for the legitimate traffic. Obviously the potential size of the dictionaries grows considerably for larger scales because it is based on all the potential permutations of the used CANID values  N l e g C A N I D : for multiscale of order 3, this would be  N l e g C A N I D 3  because the order of the CANID values is also relevant and there are no repetitions in the permutations. This is also the reason for why the multiscale approach was stopped at the scale of order 3. In reality, in the data set, this number is lower because not all the permutations are used in the CAN-bus traffic and not all the possible permutations of the 11 bits are defined as correct values in the CAN-bus protocol. The dictionary created at each scale in the legitimate traffic is called  C A T L E G S X  of order X = 1, 2, 3. Not all the CANID frequency values are actually relevant in the execution of the IDS. The issue is to estimate how many frequency values (e.g., the tail of the histogram) should be considered. The proposed approach does not consider a fixed value but it defines a hyper-parameter  P D , which is the percentage of the sum of the CANID bin values in the histogram on the overall number of collected CANID values in the traffic. If the value of  P D  is too small, not all the CANID frequency values are used in the analysis, if the value of  P D  is too high, the feature space created from the histograms in the following steps will be too large, with consequently large computing time and memory requirements for the execution of the classification step in the IDS. The values of  P D  considered in this approach are (70, 80, 90, 98) expressed in percentiles.
  • On the attack-related traffic, the legitimate traffic was split into windows. A sliding window (non-overlapping) of size  W S  (this is one of the hyper-parameters in the approach) is defined to collect the CAN-bus traffic in a contiguous set of  W S  CAN-bus messages. Note that the size of the window is purely related to the number of CAN-bus messages  W S  rather then the time of the messages. This is done to ensure an uniform number of CAN-bus messages to be fed to the next step. The proposed approach has used values of  W S  in the range (120, 150, 180, 210, 240, 270, 300). This range was chosen for the following reasons, which are conflicting trade-offs also reported in the literature: (1) the number of messages has to be large enough to create a histogram that is statistically relevant, (2) the number of messages has to be small enough to locate the attack in the CAN-bus traffic, (3) the smaller the number of messages, the longer the processing time of the approach, as the number of windows on which the CNN has to operate is inversely proportional to the window size  W S  for the data set. On the other side, it is not known a priori which is the window size with the best detection performance. In-fact,  W S  is one of the two hyper-parameters in the approach. The other one is  P D  described before. On each of the windows, the frequencies of appearance of the CANID values and their permutations for scales 2 and 3 were calculated to create three dictionaries of the sequences of CANID values. A pictorial description of this step is shown in Figure 3.
  • On each collected window of the testing data set, the histogram of the CANID values is calculated against the  C A T L E G S X  set to identify how similar are the frequencies of the CANID values to the legitimate traffic. This will create a feature  F S p a c e S X , where X can be 1, 2, 3 for the multiscale order. The sum of the values not appearing in  C A T L E G S X  is reported as an additional feature. Then, the overall set of features created by the histogram for each scale X is  s i z e ( C A T L E G S X ) + 1 .
  • The window is labeled as malicious if there is at least one labeled malicious message in the window. Then, a labeled vector is created for each window size  W S .
  • Because of the multiscale approach, the feature spaces in this study are actually three for the different scale sizes 1, 2 and 3:  F S p a c e S 1 F S p a c e S 2 F S p a c e S 3  (which correspond respectively to  C A T L E G S 1 C A T L E G S 2 C A T L E G S 3 ), which are concatenated along the feature dimension to create a combined feature space  F S P A C E A l l . This aspect is graphically shown in Figure 3 in the right bottom corner.
  • The attack-related traffic data set is split into training and testing portions of size 3/4 and 1/4, respectively, of the entire data set (i.e., 4-fold approach). The validation portion is 1/10 of the size of the training set. The training and testing portions are randomly selected from the attack traffic data set. The process of randomization is repeated 10 times for each four-fold (then 40 times) and the resulting values of the metrics are averaged.
  • Finally, a 1D CNN deep learning algorithm is applied to the  F S P A C E A l l  to perform the classification and identification of the attacks from the legitimate traffic. The CNN is applied to the feature space as a 1D time series. The description of the CNN architecture is provided in Section 3.5.

3.3. Data Sets: Car Hacking Data Set

The Car Hacking data set was created by the Hacking and Countermeasures Research Lab described in [9,10]. The data has been extracted from a Hyundai YF Sonata through a Y-cable plugged into the OBD-II port through a Raspberry Pi3 as described in [9,10]. The recorded CAN-bus traffic matches the specification of CAN 2.0 with a CAN-bus message interpretation based on the Hyundai YF Sonata model.
The datasets each contain 300 intrusions of message injection. Each intrusion is performed in a time frame from 3 to 5 s, and each dataset has a total of around 30 min of CAN-bus traffic.
There are four sub data sets for each of the attacks described below.
  • In the Denial of Service (DoS) attack, messages of ‘0000’ CAN-bus ID were inserted in the in-vehicle network every 0.3 milliseconds.
  • In the Fuzzy attack, totally random CAN-bus ID and payload data values of the CAN-bus message were injected every 0.5 milliseconds.
  • In the Spoofing attack of the RPM type, messages related to the RPM information were injected every 1 millisecond. The injected messages transmitted information about the RPM gauge changing the original status on the instrument panel [9,10].
  • In the Spoofing attack of the Gear type, messages related to the Gear information were injected every 1 millisecond. The injected messages transmitted information about the driver gear changing the original status on the instrument panel [9,10].
The data set is made public with different files for each type of attack. In a similar way to other studies [29], the author combined all the attacks in a single file to evaluate the challenge to identify each attack.
The distribution of the messages in the Car Hacking dataset is provided in Table 2, together with the term in parenthesis used to indicate the attack in the rest of this paper.
Table 2. Data distribution in the Car Hacking in-vehicle network datasets.

3.4. Data Sets: ROAD

The second data is the benchmark Oak Ridge National Laboratory’s (ORNL) Road data set proposed in [11,12]. This benchmark dataset consists of fully compromised electronic control units connected with the CAN bus through an onboard diagnostic port. This dataset contains real network traffic consisting of regular and fabricated attack traffic. The fabricated attack traffic has verified the impact on the behavior of the vehicles. This data set contains network traffic in 12 normal and 33 attack traffic log files. The total traffic captured consists of normal and attack traffic data for 3 h and 30 min.
The authors of [11,12] collected CAN data using the SocketCAN software on a Linux computer with a Kvaser Leaf Light V2 connecting to the OBD-II port. All of the data are from a single vehicle. The make/model is not disclosed and it was manufactured in the mid 2010s. The data was collected both on a dynamometer and on roads, while performing a variety of normal and also sometimes unusual driving activities (e.g., unbuckled seatbelt or opened door while driving).
The ROAD dataset used in this paper mainly includes two types of attacks: fuzzing attacks (called Fuzzing in the rest of this paper) and targeted ID attacks, which includes correlated signal attacks (CorrSig), max engine coolant temp attacks (MaxEng True Class), max speedometer attacks (MaxSpeed), reverse light-off attacks (RevLightOff) and reverse light-on attacks (RevLightOn). This was the same set of attacks used in [30]. The distribution of the messages in the ROAD dataset is provided in the following Table 3 together with the term in parenthesis used to indicate the attack in the rest of this paper.
Table 3. Data distribution in the ROAD in-vehicle network datasets.

3.5. Convolutional Neural Network Architecture

The architecture of the 1D CNN used in this study is shown in Figure 4. It is a relatively simple 1D CNN architecture with three convolutional layers. A max pooling element was used instead of the average pooling because it provided a superior performance.
Figure 4. The architecture of the convolutional neural network used for the classification.
The number of filters for the first convolutional layer was 8, then 16 for the second layer and 32 in the last layer. The Adam solver was used. The window size of the first convolutional layer was set to 40, then, 16 and 8 for the second and third layer, respectively, when all the feature space is used. The maximum number of epochs was set to 160 but it was noticed that the CNN algorithm converges much before this value.
The list of all the CNN hyper-parameters values used to produce the results shown in Section 4 is provided in the following Table 4.
Table 4. List of CNN parameters used in the study.

3.6. Metrics of Evaluation

The metrics used to evaluate the performance of the proposed approach are the error rate (ER), miss rate (MR) and the false discovery rate (FDR), which are defined in the following equations.
E R = 1 a c c u r a c y = 1 T P + T N ( T P + F P + F N + T N )
F D R = 1 p r e c i s i o n = 1 T P ( T P + F P )
M R = 1 r e c a l l = 1 T P ( T P + F N )
ER identifies the overall number of classification errors when the proposed approach fails to identify the legitimate or attack-related traffic. MR is the proportion of positives that yield negative test outcomes with the test. In this context, MR is used to report on the number of samples on which the proposed approach confuses legitimate traffic with attack-related traffic. While this may not be a critical error (because no attack was present), a large MR value may trigger not-necessary actions by the network manager. The FDR is used to report on the number of samples on which the proposed approach confused attack-related traffic with legitimate traffic. A large value of FDR may be more critical than MR because the proposed approach failed to detect an attack. These metrics of evaluation were used because they were adopted in the literature [10,17,24,26,28,30,31].
Where TP is the number of True Positives, TN is the number of True Negatives, FP is the number of False Positives and FN is the number of False Negatives. Because it is a multi-class classification problem with quite unbalanced data sets (the legitimate traffic message are much larger than the attack-related traffic messages), the ER, FDR and MR metrics are calculated using micro-averaging, where the contributions of all classes are aggregated to compute the average metric. To complete the accuracy metric, confusion matrices are also provided to assess the predicted values against the true values. In the confusion matrices presented in this paper, each column of the matrix represents the instances in a true class while each row represents the instances in an predicted class.

3.7. Summary of the Notations

Table 5 summarizes the notations used in this paper.
Table 5. Notations used in this paper.

4. Results and Discussion

This section provides the results obtained with the proposed approach for the two data sets: Car Hacking dataset and ROAD data set. In Section 4.1, the evaluation of the impact of the hyper-parameters is presented. As mentioned before, two main hyper-parameters can have an impact on the classification performance of the proposed approach: the window size  W S  and the percentage of histogram frequency values  P D , which corresponds in percentiles to the sum of the high histogram CANID frequency bins in the normal (i.e., legitimate) traffic data set, which was used to create the  C A T L E G S X  dictionaries. These results also show the relative predictor weight of the different features in both data sets for the values of the hyper-parameters, which achieved the optimal classification performance. In Section 4.2, the performance of the proposed approach using all the features is compared against using only the single-scale dictionary, as is done in literature. In Section 4.3, the author compares the performance in terms of accuracy, precision and recall to the results in the literature on the same data set. Finally, Section 4.4 discusses the advantages and disadvantages of the approaches.

4.1. Evaluation of the Hyper-Parameters

The analysis of the impact of the hyper-parameters on the detection performance is shown using the three main evaluation metrics, Error Rate (ER), Miss Rate (MR) and False Discovery Rate (FDR), on both data sets. Figure 5a shows the ER values obtained for different values of  P D  and  W S  for the Car Hacking data set. The presented values are obtained by averaging the results of the 40 repetitions of the CNN execution (10 repetitions of the four-fold approach). It can be seen from Figure 5a that the impact of the hyper-parameters is significant and the optimal ER (the smallest value) is obtained with  P D = 80  and  W S = 120 . A different result is obtained on the ROAD dataset (presented in Figure 5b), where the optimal values of both a  W S  = 240 and  W S  = 300 are obtained for different values of  P D . Considering that a smaller  P D  is preferable because the size of the feature space (and the computing effort by the CNN) is directly proportional to the value of  P D , the optimal value at  P D  = 70 and  W S  = 300 was chosen for the ROAD dataset.
Figure 5. Error rate obtained with different values of the hyper-parameters  P D  and  W S .
The performance using MR and FDR was also estimated and presented in Figure 6a and Figure 7a, respectively, for the Car Hacking data set and in Figure 6b and Figure 7b, respectively, for the ROAD data set. We can see that the results are consistent with the ER presented previously, with MR higher in absolute quantitative values than FDR. This is related to the consideration that the proposed approach produces most of the errors by identifying as an attack what is actually legitimate traffic. In the IDS, this classification error (type I error rate) may be less critical than the error of not detecting the attack, as it is interpreted as legitimate traffic (type II error rate). It can also be noted that the values of the hyper-parameters can be selected if there is a preference to minimize the MR or the FDR. For example, in the ROAD data set, the lowest FDR is obtained at  P D  = 98 and  W S  = 240, while the lowest MR is obtained at  P D  = 90 and  W S  = 300. Similar considerations can be applied to the Car Hacking data, where the lowest values of FDR is obtained at  W S  = 150 and  P D  = 90, while the lowest value of MR is obtained at  W S  = 240 and  P D  = 80.
Figure 6. Miss rate (1-Recall) obtained with different values of the hyper-parameters  P D  and  W S .
Figure 7. False discovery rate (1-Precision) obtained with different values of the hyper-parameters  P D  and  W S .
To evaluate more in detail the distribution of the False Positive (FP) and False Negative (FN) generated by the classification algorithm, the following Figure 8a and Figure 8b present, respectively, the confusion matrix obtained for the Car Hacking and the ROAD datasets achieved using the optimal values of the hyper-parameters.
Figure 8. Confusion matrices obtained with the optimal values of the hyper-parameters  P D  and  W S . The level of darkness in each rectangle is proportional to the obtained accuracy.
For the Car Hacking data set, Figure 8a shows that the normal, Gear and RPM traffic are very easy to identify with almost perfect accuracy, while for the Fuzzy and DOS attack, the algorithm returns a number of false negatives, as it interprets the attack-related messages as legitimate traffic. For the ROAD data set, the error rates for the different classes are relatively balanced even if the number of FNs is generally higher than the number of FPs. A potential reason for this behaviour is also related to the consideration that both Car Hacking and the ROAD data set are heavily unbalanced data sets with legitimate messages many more than the attack related messages. While, there can be techniques to re-balance such distribution like Synthetic Minority Oversampling Technique SMOTE [32], the author preferred to keep the integrity of the data sets even with the understanding that the classification problem can be more challenging.
The relevance of the features generated by each scale order (i.e., order = 1, 2, 3) was analyzed, which is mapped to the feature spaces  F S p a c e S X  with X = 1, 2, 3, which are combined in  F S p a c e A l l  for the actual classification. This analysis was conducted by using the ReliefF algorithm [33] where the predictor importance weight was estimated for all the features in  F S p a c e A l l  in both data sets. The ReliefF algorithm is a filter feature selection algorithm, which finds the weights of predictors for multiclass machine learning problems. The algorithm penalizes the predictors that give different values to k nearest neighbors of the same class, and rewards predictors that give different values to neighbors of different classes. The hyper-parameter k was set to 10 in this analysis. The results are shown in Figure 9 and Figure 10 for the Car Hacking and the ROAD data set, respectively. The figures were generated using the optimal values of the hyper-parameters for the ER in both data sets. The pink area represents the features of  F S p a c e S 1 , the green area represents the features of  F S p a c e S 2  and the orange–yellow area represents the features of  F S p a c e S 3 . It can be noted that the trend of the predictor importance weight is quite different in the two data sets: while in the Car Hacking data set, all the features of  F S p a c e S 1  have a very high predictor importance weight, this is not the case in the ROAD data set, where the weight is distributed across the three feature spaces. These results show that it is difficult to set a priori which multi scale order is needed for the implementation of the IDS. The peaks (i.e., high predictor weights), which appear at the end (i.e., the right extreme) of each colored area (i.e., feature space), are the features related to the CANID sequences, which do not belong to the dictionary of the legitimate traffic. From both Figure 9 and Figure 10, it can be seen that these specific features have in both data sets a high predictor weight, which justifies their calculations in the proposed approach.
Figure 9. Prediction weight of the different features for the Car Hacking data set with  P D = 80  and  W S = 120 .
Figure 10. Prediction weight of the different features for the ROAD data set with  P D = 70  and  W S = 300 .
On the basis of the results presented in Figure 9 and Figure 10, the amount of features of each feature space that are actually relevant for the classification was also estimated.
Table 6 shows the allocation of the top 30% best-ranking features identified by the ReliefF algorithm for each feature space. While, this information can also be visually estimated from the previous figures, Table 6 provides a more quantitative analysis and also the balance among the feature space in terms of predictor relevance.
Table 6. Allocation of the 30% best ranking features on the multi-scale dictionaries. With the Car Hacking dataset  P D = 80  and  W S = 120 . With the ROAD dataset,  P D = 70  and  W S = 300 .
It can be seen that for the Car Hacking data set, the first two feature spaces are the most relevant and the third feature space is less significant in the implementation of the IDS. On the contrary, for the ROAD data set the second feature space is quite relevant. Both results justify the proposed approach where the traditional method used in the literature, where only the sequences of the single CANID values are analyzed, is extended to consider also dictionaries of sequence of CANID values of orders 2 and 3.
On the basis of the previous results, the performance when using only the single-scale dictionary was also compared against the multi-scale approach. This is presented in the following sub-section.

4.2. Comparison of Multi-Scale with Single-Scale

The relevance of the different feature space for the attack-detection performance was also evaluated using the CNN. The performance of the proposed approach when only the first feature space is used (i.e., single-scale) was also estimated, and it is compared against the performance obtained with all the feature spaces (i.e., multi-scale), which was shown above. Figure 11a, Figure 12a and Figure 13a show the ER, MR and FDR for the Car Hacking data set, respectively, while Figure 11b, Figure 12b and Figure 13b show the ER, MR and FDR for the ROAD data set, respectively, using the optimal values of the hyper-parameters. As in the previous figures, the ER, MR and FDR values are consistent among them even when using only the single scale feature space  F S p a c e S 1 . It can be seen across all the metrics that the errors are smaller when using the whole feature space rather than using only  F S p a c e S 1 . The performance improvement for the Car Hacking data set is significant: the ER ratio between multi-scale and single-scale is 0.5972 for the optimal values of the hyper-parameters. The performance improvement for the ROAD set is dramatic as the ER ratio between multi-scale and single scale is 0.0269 as shown in Figure 11b. These results confirms the distribution of the most relevant features shown in Table 6 and ultimately confirms the validity of the proposed approach on two public data sets, which are significantly used by the research community.
Figure 11. ER comparison of feature spaces with multi-scale and single-scale only. (a) Comparison of the ER obtained using the whole feature space or only  F S p a c e S 1  with the Car Hacking data set and  P D = 80  and  W S = 120 . (b) Comparison of the ER obtained using the whole feature space or only  F S p a c e S 1  with the ROAD data and  P D = 70  and  W S = 300 .
Figure 12. MR comparison of feature spaces with multi-scale and single-scale only. (a) Comparison of the MR obtained using the whole feature space or only  F S p a c e S 1  with the Car Hacking data set and  P D = 80  and  W S = 120 . (b) Comparison of the MR obtained using the whole feature space or only  F S p a c e S 1  with the ROAD data set and  P D = 70  and  W S = 300 .
Figure 13. FDR comparison of feature spaces with multi-scale and single-scale only. (a) Comparison of the FDR obtained using the whole feature space or only  F S p a c e S 1  with the Car Hacking data set and  P D = 80  and  W S = 120 . (b) Comparison of the FDR obtained using the whole feature space or only  F S p a c e S 1  with the ROAD data set and  P D = 70  and  W S = 300 .

4.3. Comparison with Results from Literature on the Car Hacking and ROAD Datasets

In this last sub-section, the author compares the performance obtained with the proposed approach with the other studies mentioned in the related work section as they are focused on using only the CANIDs. It should be noted that the comparison of the results is only provided as an indication because the results may not be fully comparable due to the different handling of the data set: the window size may be different from the one used in this paper, each attack was addressed separately instead of combining all the attacks together as in this paper, only a portion of the data set may be used or data set balancing methods like SMOTE could be used, which alter the distribution of the attack and legitimate messages. Finally, many of the papers identified in the related work uses only additional information beyond the CANIDs like the CAN-bus message payload or timing while this paper uses only the CANIDs.
The results presented in Table 7 show that the proposed approach is competitive, with some approaches providing a better performance and others a worse performance than this approach. Section 4.4 provides a detailed discussion of the results in Table 7.
Table 7. Comparison of the results with both data set for Error Rate, Miss Rate and False-Detection Rate.

4.4. Discussion

This sub-section discusses the advantages and disadvantages of the approaches identified in Table 7 with the approach proposed in this paper. As discussed before, it is noted that some results may not be fully comparable because the structure and distribution of the initial data sets could be altered in the referenced studies. For the Car Hacking data set, approaches based on deep learning and which operate on the single CAN-bus messages records like [10] (where CNN operates on the CANIDs transformed to binary images) or [26] (where all the information of the CAN-bus messages is used together with the temporal information with a CNN-LSTM architecture) obtain the best detection performance (and better than the approach proposed in this paper) at the cost of significant computing complexity, because all the CAN-bus message records are given in input to the DL algorithm.
The reduction of the input space and the consequent decrease in computing complexity through the sliding window is one element of the proposed approach. The disadvantage of the sliding window approach is the risk to lose discriminating features in the pre-processing step. Then it is important to extract the most significant information from the traffic windows before the application of the classification algorithm (e.g., CNN). The comparison with the sliding windows approaches in the literature [17,24,28] is positive for this approach as it generally obtains a competitive or better performance than the results in the literature. At one extreme of the sliding window approaches is the extraction of entropy features [17], which can be quite time-efficient but provides a relatively low detection performance. A more comprehensive statistical analysis of the relevance of the windows size and the thresholds used to discriminate legitimate traffic from attack-related traffic can produce a better performance as shown in [24], but at the cost of tuning various hyper-parameters. The results from [24] are slightly worse than the ones obtained in this paper, even if it should be considered that [24] calculates the metrics only with the DOS and Fuzzy attack, while this study considers all the attacks of the Car Hacking data set and the scores may not be directly comparable. Transformations of the CAN-bus traffic to other representations, which may preserve discriminating information together with DL may also be attempted as it combines the power of DL with the dimensionality reduction of the window-based approach. This is the case of [28], where CNN was combined with recurrence plots even if the classification performance is worse than the approach proposed in this paper. The reduction of the input space can also be performed in combination with DL by using dimensionality-reduction algorithms like Principal Component Analysis (PCA), which is applied to all the CAN-bus message features in [31] together with LSTM. The final detection performance obtained by [31] is relatively high but it still lower than the one obtained in this paper.
For the ROAD dataset, there is scarcity of results in the literature to compare the performance of the different approaches. The results from [30] are slightly better than our proposed approach but it should be considered that the authors in [30] have used a combination of oversampling (to re-balance the distribution of the attack related messages to the legitimate traffic) and outlier detection (to remove not relevant CAN-bus messages), which has significantly altered the original data set.
To conclude this sub-section, the author summarizes the main advantages and disadvantages of the proposed approach. One of the main advantages is the use of the sliding window, which significantly reduces the input space to the DL classifier. Another advantage is the use of a dictionary based only on legitimate traffic, which does not require the creation of dictionaries with attack-based traffic (which may be biased towards the presence of specific attacks). The advantage of the temporal sequences of CAN-bus messages is incorporated in the approach using the novel multi-scale histograms method. Thanks to the transformation of the original attack-detection problem to a feature problem, the power of the CNN is exploited (as the temporal information is already included in the multi-scale dictionary representation, the LSTM was not needed).
The disadvantages of the proposed approach are the following. The size of the multi-scale dictionary can be quite large especially for the higher values of the scale (order = 3). Then, it is important to optimize the size of the dictionary while preserving the most discriminating features. In this approach, this aspect is controlled through the parameter  P D . The other hyper-parameter is the window size  W S . Then, the other significant disadvantage of this approach is the need to determine the optimal values of  P D  and  W S . This study did not identify a common set of values, which can be generalized across different data sets because the optimization process for the Car Hacking data set and the ROAD data set provided quite different results.

5. Conclusions and Future Developments

This paper has presented a novel intrusion detection system (IDS) for in-vehicle networks, which combines the concept of creating a dictionary based on the frequency of appearance of CANIDs values (the identifiers of the CAN-bus protocol) in sliding windows with DL. The goal is to combine the computing efficient window-based method with the classification performance of DL. Contrary to what is presented in the research literature, the proposed approach adopts a multi-scale workflow where the sequences of CANID values or scale 1, 2 and 3 are used and combined to create a multi-scale dictionary. The histogram distributions calculated from the windows of the CAN-bus traffic with attacks are compared against the histograms created only using legitimate traffic. Such analysis creates a feature space on which the DL with convolutional neural networks (CNN) is applied for classification in a supervised learning fashion. The proposed approach is applied to two different public data sets, where it achieves a competitive performance. In particular, the attack classification performance is better than dictionary-based approaches and some of the other approaches proposed in the literature based on CNN and the sliding window concept. It is worse than DL approaches, which are not based on the sliding window but which can be more computing-intensive than the approach proposed in this paper. An analysis of the relevance of the generated features with scales of orders 2 and 3 using the ReliefF algorithm shows that they contribute significantly to the classification performance. This analysis supports the design of the proposed approach. Regarding trade-offs and limitations in the proposed approach, the most significant limitation is the need to calculate the optimal values of the main hyper-parameters (window size and size of the dictionary) and the need to limit the size of the dictionary for higher orders of the scale (e.g., 3).
Future developments may go in different directions. One direction would be to implement an unsupervised approach because the creation of the dictionary would be also suitable for this purpose. Another direction would be to implement an adaptive window approach where the size of the window of analysis in the attack CAN-bus traffic varies according to some statistics. In this latter case, the advantage of the proposed approach is that the feature space size given in input to the CNN is independent from the window size.

Funding

This work has been partially supported by the European Commission through project DIAS funded by the European Union H2020 Programme under Grant Agreement No. 814951. The opinions expressed in this paper are those of the author and do not necessarily reflect the views of the European Commission.

Data Availability Statement

The study described in this paper is based on two public data sets, which have been already referenced before in the manuscript. This information is repeated here: The Car Hacking data set is described and available in [9,10]. The ROAD dataset is described and available in [11,12].

Conflicts of Interest

The author declares no conflict of interest.

Abbreviations

BoWBag of Words
CANController Area Network
CAN-busController Area Network-bus
CNNConvolutional Neural Network
CANIDCAN-bus identifier
CRCCyclic Redundancy Check
DOSDenial of Service
DLDeep Learning
DLCData Length Code
ECUElectronic Control Unit
ERError Rate
FDRFalse Discovery Rate
FPFalse Positive
FNFalse Negative
ICTInformation and Communication Technologies
IDSIntrusion Detection System
IFSInter Frame Space
KNNK-Nearest Neighbour
LINLocal Interconnect Network
LSTMLong short-term memory
OBDOn-Board Diagnostics
ORNLOak Ridge National Laboratory
MLMachine Learning
MRMiss Rate
ReLUrectified linear unit (ReLU)
ROADReal ORNL Automotive Dynamometer
RPMRound Per Minute
SMOTESynthetic Minority Oversampling Technique
TNTrue Negative
TPTrue Positive

References

  1. Miller, C.; Valasek, C. A survey of remote automotive attack surfaces. Black Hat USA 2014, 2014, 94. [Google Scholar]
  2. Petit, J.; Shladover, S.E. Potential cyberattacks on automated vehicles. IEEE Trans. Intell. Transp. Syst. 2014, 16, 546–556. [Google Scholar] [CrossRef]
  3. Eiza, M.H.; Ni, Q. Driving with sharks: Rethinking connected vehicles with vehicle cybersecurity. IEEE Veh. Technol. Mag. 2017, 12, 45–51. [Google Scholar] [CrossRef]
  4. Campos, E.M.; Saura, P.F.; González-Vidal, A.; Hernández-Ramos, J.L.; Bernabe, J.B.; Baldini, G.; Skarmeta, A. Evaluating Federated Learning for intrusion detection in Internet of Things: Review and challenges. Comput. Netw. 2021, 203, 108661. [Google Scholar] [CrossRef]
  5. Wu, W.; Li, R.; Xie, G.; An, J.; Bai, Y.; Zhou, J.; Li, K. A survey of intrusion detection for in-vehicle networks. IEEE Trans. Intell. Transp. Syst. 2019, 21, 919–933. [Google Scholar] [CrossRef]
  6. Al-Jarrah, O.Y.; Maple, C.; Dianati, M.; Oxtoby, D.; Mouzakitis, A. Intrusion detection systems for intra-vehicle networks: A review. IEEE Access 2019, 7, 21266–21289. [Google Scholar] [CrossRef]
  7. Loukas, G.; Karapistoli, E.; Panaousis, E.; Sarigiannidis, P.; Bezemskij, A.; Vuong, T. A taxonomy and survey of cyber-physical intrusion detection approaches for vehicles. Ad Hoc Netw. 2019, 84, 124–147. [Google Scholar] [CrossRef]
  8. Young, C.; Zambreno, J.; Olufowobi, H.; Bloom, G. Survey of automotive controller area network intrusion detection systems. IEEE Des. Test 2019, 36, 48–55. [Google Scholar] [CrossRef]
  9. Seo, E.; Song, H.M.; Kim, H.K. GIDS: GAN based intrusion detection system for in-vehicle network. In Proceedings of the 2018 16th Annual Conference on Privacy, Security and Trust (PST), Belfast, UK, 28–30 August 2018; pp. 1–6. [Google Scholar]
  10. Song, H.M.; Woo, J.; Kim, H.K. In-vehicle network intrusion detection using deep convolutional neural network. Veh. Commun. 2020, 21, 100198. [Google Scholar] [CrossRef]
  11. Verma, M.E.; Iannacone, M.D.; Bridges, R.A.; Hollifield, S.C.; Moriano, P.; Kay, B.; Combs, F.L. Addressing the lack of comparability & testing in CAN intrusion detection research: A comprehensive guide to CAN IDS data & introduction of the ROAD dataset. arXiv 2020, arXiv:2012.14600. [Google Scholar]
  12. Verma, M.E.; Iannacone, M.D.; Bridges, R.A.; Hollifield, S.C.; Kay, B.; Combs, F.L. Road: The Real Ornl Automotive Dynamometer Controller Area Network Intrusion Detection Dataset (with a Comprehensive Can Ids Dataset Survey & Guide). 2020. Available online: https://0xsam.com/road/ (accessed on 20 September 2023).
  13. De La Torre, G.; Rad, P.; Choo, K.K.R. Driverless vehicle security: Challenges and future research opportunities. Future Gener. Comput. Syst. 2020, 108, 1092–1111. [Google Scholar] [CrossRef]
  14. Rakhmanov, A.; Wiseman, Y. Compression of GNSS Data with the Aim of Speeding up Communication to Autonomous Vehicles. Remote Sens. 2023, 15, 2165. [Google Scholar] [CrossRef]
  15. Marchetti, M.; Stabili, D.; Guido, A.; Colajanni, M. Evaluation of anomaly detection for in-vehicle networks through information-theoretic algorithms. In Proceedings of the 2016 IEEE 2nd International Forum on Research and Technologies for Society and Industry Leveraging a better tomorrow (RTSI), Bologna, Italy, 7–9 September 2016; pp. 1–6. [Google Scholar]
  16. Wu, W.; Huang, Y.; Kurachi, R.; Zeng, G.; Xie, G.; Li, R.; Li, K. Sliding window optimized information entropy analysis method for intrusion detection on in-vehicle networks. IEEE Access 2018, 6, 45233–45245. [Google Scholar] [CrossRef]
  17. Baldini, G. On the application of entropy measures with sliding window for intrusion detection in automotive in-vehicle networks. Entropy 2020, 22, 1044. [Google Scholar] [CrossRef]
  18. Baldini, G. Intrusion detection systems in in-vehicle networks based on bag-of-words. In Proceedings of the 2021 5th Cyber Security in Networking Conference (CSNet), Abu Dhabi, United Arab Emirates, 12–14 October 2021; pp. 41–48. [Google Scholar]
  19. Rajapaksha, S.; Kalutarage, H.; Al-Kadri, M.O.; Petrovski, A.; Madzudzo, G. Improving in-vehicle networks intrusion detection using on-device transfer learning. In Proceedings of the Symposium on Vehicles Security and Privacy, San Diego, CA, USA, 27 February 2023. [Google Scholar]
  20. Kalutarage, H.K.; Al-Kadri, M.O.; Cheah, M.; Madzudzo, G. Context-aware anomaly detector for monitoring cyber attacks on automotive CAN bus. In Proceedings of the 3rd ACM Computer Science in Cars Symposium, Kaiserslautern, Germany, 8 October 2019; pp. 1–8. [Google Scholar]
  21. Derhab, A.; Belaoued, M.; Mohiuddin, I.; Kurniawan, F.; Khan, M.K. Histogram-based intrusion detection and filtering framework for secure and safe in-vehicle networks. IEEE Trans. Intell. Transp. Syst. 2021, 23, 2366–2379. [Google Scholar] [CrossRef]
  22. Katragadda, S.; Darby, P.J.; Roche, A.; Gottumukkala, R. Detecting low-rate replay-based injection attacks on in-vehicle networks. IEEE Access 2020, 8, 54979–54993. [Google Scholar] [CrossRef]
  23. Baldini, G. Multi scale histogram-based intrusion detection system for the MIL-STD-1553 protocol. In Proceedings of the 2023 IEEE International Mediterranean Conference on Communications and Networking (MeditCom), Dubrovnik, Croatia, 4–7 September 2023; pp. 252–257. [Google Scholar]
  24. Khan, J.; Lim, D.W.; Kim, Y.S. Intrusion Detection System CAN-Bus In-Vehicle Networks Based on the Statistical Characteristics of Attacks. Sensors 2023, 23, 3554. [Google Scholar] [CrossRef] [PubMed]
  25. Desta, A.K.; Ohira, S.; Arai, I.; Fujikawa, K. ID sequence analysis for intrusion detection in the CAN bus using long short term memory networks. In Proceedings of the 2020 IEEE International Conference on Pervasive Computing and Communications Workshops (PerCom Workshops), Austin, TX, USA, 23–27 March 2020; pp. 1–6. [Google Scholar]
  26. Agrawal, K.; Alladi, T.; Agrawal, A.; Chamola, V.; Benslimane, A. NovelADS: A novel anomaly detection system for intra-vehicular networks. IEEE Trans. Intell. Transp. Syst. 2022, 23, 22596–22606. [Google Scholar] [CrossRef]
  27. Alsaade, F.W.; Al-Adhaileh, M.H. Cyber attack detection for self-driving vehicle networks using deep autoencoder algorithms. Sensors 2023, 23, 4086. [Google Scholar] [CrossRef]
  28. Desta, A.K.; Ohira, S.; Arai, I.; Fujikawa, K. Rec-CNN: In-vehicle networks intrusion detection using convolutional neural networks trained on recurrence plots. Veh. Commun. 2022, 35, 100470. [Google Scholar] [CrossRef]
  29. Ullah, S.; Khan, M.A.; Ahmad, J.; Jamal, S.S.; e Huma, Z.; Hassan, M.T.; Pitropakis, N.; Arshad; Buchanan, W.J. HDL-IDS: A hybrid deep learning architecture for intrusion detection in the Internet of Vehicles. Sensors 2022, 22, 1340. [Google Scholar] [CrossRef] [PubMed]
  30. Jin, F.; Chen, M.; Zhang, W.; Yuan, Y.; Wang, S. Intrusion detection on internet of vehicles via combining log-ratio oversampling, outlier detection and metric learning. Inf. Sci. 2021, 579, 814–831. [Google Scholar] [CrossRef]
  31. Khan, I.A.; Moustafa, N.; Pi, D.; Haider, W.; Li, B.; Jolfaei, A. An enhanced multi-stage deep learning framework for detecting malicious activities from autonomous vehicles. IEEE Trans. Intell. Transp. Syst. 2021, 23, 25469–25478. [Google Scholar] [CrossRef]
  32. Fernández, A.; Garcia, S.; Herrera, F.; Chawla, N.V. SMOTE for learning from imbalanced data: Progress and challenges, marking the 15-year anniversary. J. Artif. Intell. Res. 2018, 61, 863–905. [Google Scholar] [CrossRef]
  33. Robnik-Šikonja, M.; Kononenko, I. Theoretical and empirical analysis of ReliefF and RReliefF. Mach. Learn. 2003, 53, 23–69. [Google Scholar] [CrossRef]
Disclaimer/Publisher’s Note: The statements, opinions and data contained in all publications are solely those of the individual author(s) and contributor(s) and not of MDPI and/or the editor(s). MDPI and/or the editor(s) disclaim responsibility for any injury to people or property resulting from any ideas, methods, instructions or products referred to in the content.

Article Metrics

Citations

Article Access Statistics

Multiple requests from the same IP address are counted as one view.