1. Introduction
Stroke is a common cause of gait abnormalities in older adults [
1]. Depending on the location and severity of the stroke, it can affect the motor pathways in the brain that control movement, coordination, and balance [
2]. This can result in various gait abnormalities, such as foot drop, spasticity, and hemiplegia. Foot drop is a condition where the foot cannot be lifted properly, resulting in a dragging gait [
3]. Spasticity is a condition where there is increased muscle tone, causing stiffness and difficulty with movement [
4]. Hemiplegia is severe weakness on one side of the body, which can result in an uneven gait [
5]. Additionally, stroke survivors may also experience fear of falling, decreased confidence in their gait, and reduced physical activity levels. Rehabilitation programs, such as occupational therapy, physical therapy, and exercise, can help stroke survivors improve their gait and reduce the risk of falls [
6].
However, these individuals need personalized intervention programs that must be based on quantitative assessments of movement. Gait analysis is the process of evaluating the way a person walks, with the aim of identifying abnormalities or changes in their gait pattern [
7]. This type of analysis is commonly used in the assessment of various conditions affecting mobility, including aging, neurological disorders, and musculoskeletal injuries. Accurate and reliable gait analysis is essential for the diagnosis, treatment, and management of these conditions. Utilizing laboratory techniques for gait analysis can be time-intensive and necessitate a dedicated environment with specialized equipment, resulting in high costs and limited accessibility. Although quantitative motion analysis provides reliable and repeatable measurements, as documented by Mohan et al., these approaches are now being enhanced through the integration of wearable sensors and artificial intelligence (AI) methodologies to address these constraints [
7].
Nevertheless, regardless of the chosen analytical approach, a fundamental challenge remains: effectively leveraging the quantitative insights obtained from gait analysis to diagnose movement problems’ nature and severity [
8], decipher the underlying mechanisms of motor disorders, and gauge the impact of interventions aimed at their rehabilitation. Such decisions are pivotal in enhancing patients’ mobility, thereby influencing their overall functionality and quality of life. However, given the substantial amount of data generated by contemporary gait analysis, arriving at these decisions has proven to be an intricate, resource-intensive, and time-demanding process. In this context, artificial intelligence emerges as a promising avenue for aiding in and augmenting such clinical decision making.
Using these techniques can provide a more efficient and cost-effective means of gait analysis that can be more widely accessible. The ability of CNNs to learn and extract features from complex visual data such as gait patterns makes them particularly suited to gait analysis. Furthermore, SNNs allow for more robust comparisons between gait patterns, accounting for individual variations in appearance and movement that traditional gait analysis methods may miss. Hence, the primary scope and contributions of this work encompass several significant aspects in the field of stroke diagnosis and personalized treatment strategies: (i) The innovative visual representation of biomechanical time series: Our work introduces a pioneering approach to the visual representation of biomechanical time series data related to stroke diagnosis. By leveraging advanced visualization techniques, we offer a more intuitive and informative way to analyze and interpret complex temporal data patterns. (ii) Addressing data limitations using Siamese neural networks (SNNs): We tackle a prevalent challenge in the medical domain—limited data availability. To overcome this hurdle, we employ state-of-the-art Siamese neural networks (SNNs) that excel in learning from small datasets. Our SNN-based framework demonstrates its capability to extract meaningful information from sparse data, enhancing the accuracy and reliability of stroke diagnosis. (iii) Facilitating knowledge extraction through visual explanations: In addition to accurate diagnosis, our work places a strong emphasis on knowledge extraction. We harness the power of visual explanations to elucidate the decision-making process of our model. By providing transparent and interpretable insights into the features and factors contributing to stroke diagnosis, we empower clinicians with a deeper understanding of the underlying mechanisms. This knowledge, in turn, facilitates the development of personalized treatment strategies tailored to individual patient profiles. In summary, this study has the potential to revolutionize gait analysis and stroke diagnosis by leveraging advanced neural network techniques; improving the accessibility, accuracy, and personalization of analyses; and potentially leading to more effective treatment strategies. The integration of CNNs and SNNs, along with the focus on visualization and knowledge extraction, could bring about significant advancements in the medical field.
State of the Art
According to the literature, various studies have explored the use of deep learning (DL) techniques for the evaluation of gait patterns [
7,
9]. Lau et al. conducted a study where they employed support vector machines (SVMs), artificial neural networks (ANNs), and radial basis function neural networks (RBFs) as classifiers to categorize five different walking conditions (stair ascent, stair descent, level ground, upslope, and downslope) for hemiparetic post-stroke survivors [
10]. The results showed that the SVM-based classifier performed better than the ANN and RBF methods, achieving an overall classification accuracy of 97.5%. In a separate study, Kaczmarczyk et al. utilized an ANN for the classification of gait patterns in post-stroke survivors [
11]. Convolutional neural networks (CNNs) are a type of deep learning algorithm that has shown promise in stroke, particularly in the development of Siamese neural networks (SNNs). SNNs use a pair of identical CNNs that learn to extract features from two input images, and then, compare them to identify similarities or differences. Fan et al. utilized an SNN based on inertial sensor-based signals for automatic fall risk assessment for stroke survivors [
12]. In another study, Vieira et al. used an SNN for the detection of ischemic stroke in computed tomography (CT) scans [
13]. In the context of gait analysis, SNNs can be used to compare gait patterns between individuals or to analyze changes in gait patterns over time or in response to interventions. Zhang et al. [
14] presents a gait recognition method using Siamese Neural Networks for human identification. It improves gait feature extraction with gait energy images, outperforming traditional approaches on a large gait database. Liu et al. [
15] combines bioinformatics and AI for human identification through gait recognition. It uses deep learning and a Siamese network for spatial and temporal gait features, enhancing distance metric learning. The results on a significant gait database show superior performance to existing methods.
Hayashi et al. [
16] investigate the significance of prehospital stroke diagnosis, emphasizing the need for precision, especially in identifying large vessel occlusions. Using machine learning, the researchers assessed five diagnostic algorithms and found that Extreme Gradient Boosting-based models achieved the highest diagnostic value, with impressive results across stroke subcategories. Yang et al. [
17] address the rising global burden of ischemic stroke (IS) by employing machine learning. It identifies 69 differentially expressed genes associated with IS and reveals immune and inflammatory pathways. Machine learning techniques, including LASSO, SVM-RFE, and Random Forest, achieve impressive diagnostic accuracy with AUC values up to 1.000. However, the ANN model, while effective with positive samples, faces challenges in classifying negatives. Badriyah et al. [
18] enhances CT scan image quality for stroke patients and uses machine learning, including Random Forest, to classify stroke sub-types with impressive 95.97% accuracy. An interesting study by Horst et al. [
19] addresses the ‘black box’ challenge in machine learning, focusing on individual gait patterns in clinical biomechanics. Using Layer-Wise Relevance Propagation (LRP), their research unveils the significance of input variables like ground reaction forces and joint angles at different gait cycle phases. This innovative approach sheds light on complex ML methods, making them more interpretable in gait analysis and enhancing their potential for diagnosis and treatment.
After conducting a thorough examination of the current literature, it becomes clear that the use of gait analysis data for diagnosing stroke is an area that has not been extensively studied using AI. Additionally, there is a lack of comprehensive surveys that aim to visually present biomechanical and gait data. It is important to note that our study is groundbreaking as it introduces the innovative concept of visualizing biomechanical data, transforming them into image-based representations. This pioneering effort explores previously uncharted territory in this specific field.
4. Discussion
The primary objective of this research paper is to introduce a pioneering approach that merges the visual representation technique of biomechanical time series with an explainable machine learning methodology. This combined framework aims to effectively identify and analyze crucial parameters related to stroke. By integrating visual representations with explainable ML techniques, this novel approach offers a comprehensive and interpretable means of studying stroke-related factors and their impact. As a “Proof of Concept Study,” this initiative underscores the novelty of melding visual representation techniques with explainable machine learning methodologies, serving as a preliminary yet promising step towards a more comprehensive and interpretable analysis of stroke-related biomechanical data.
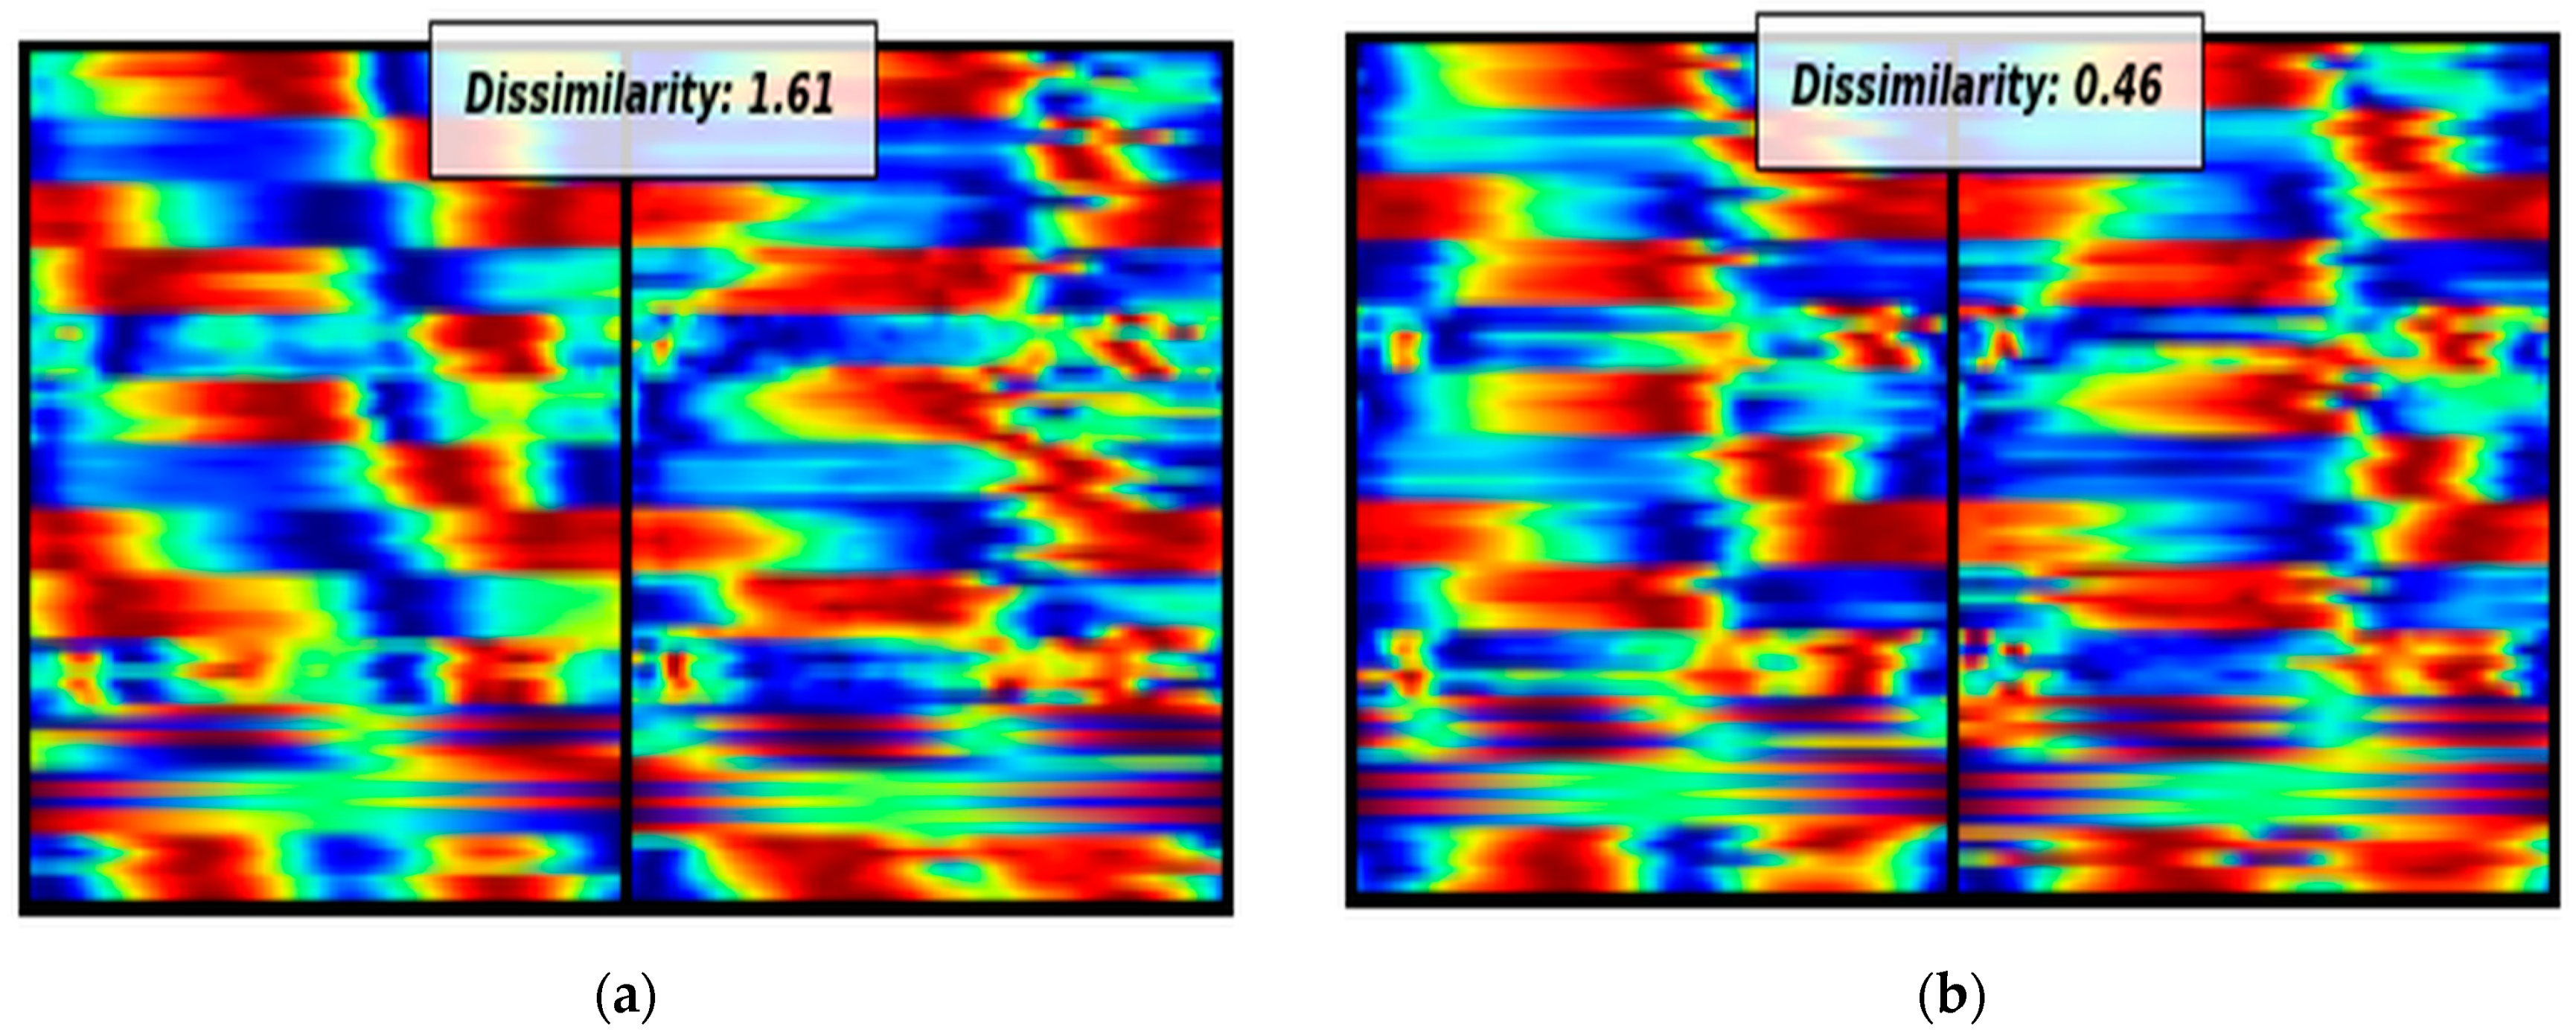
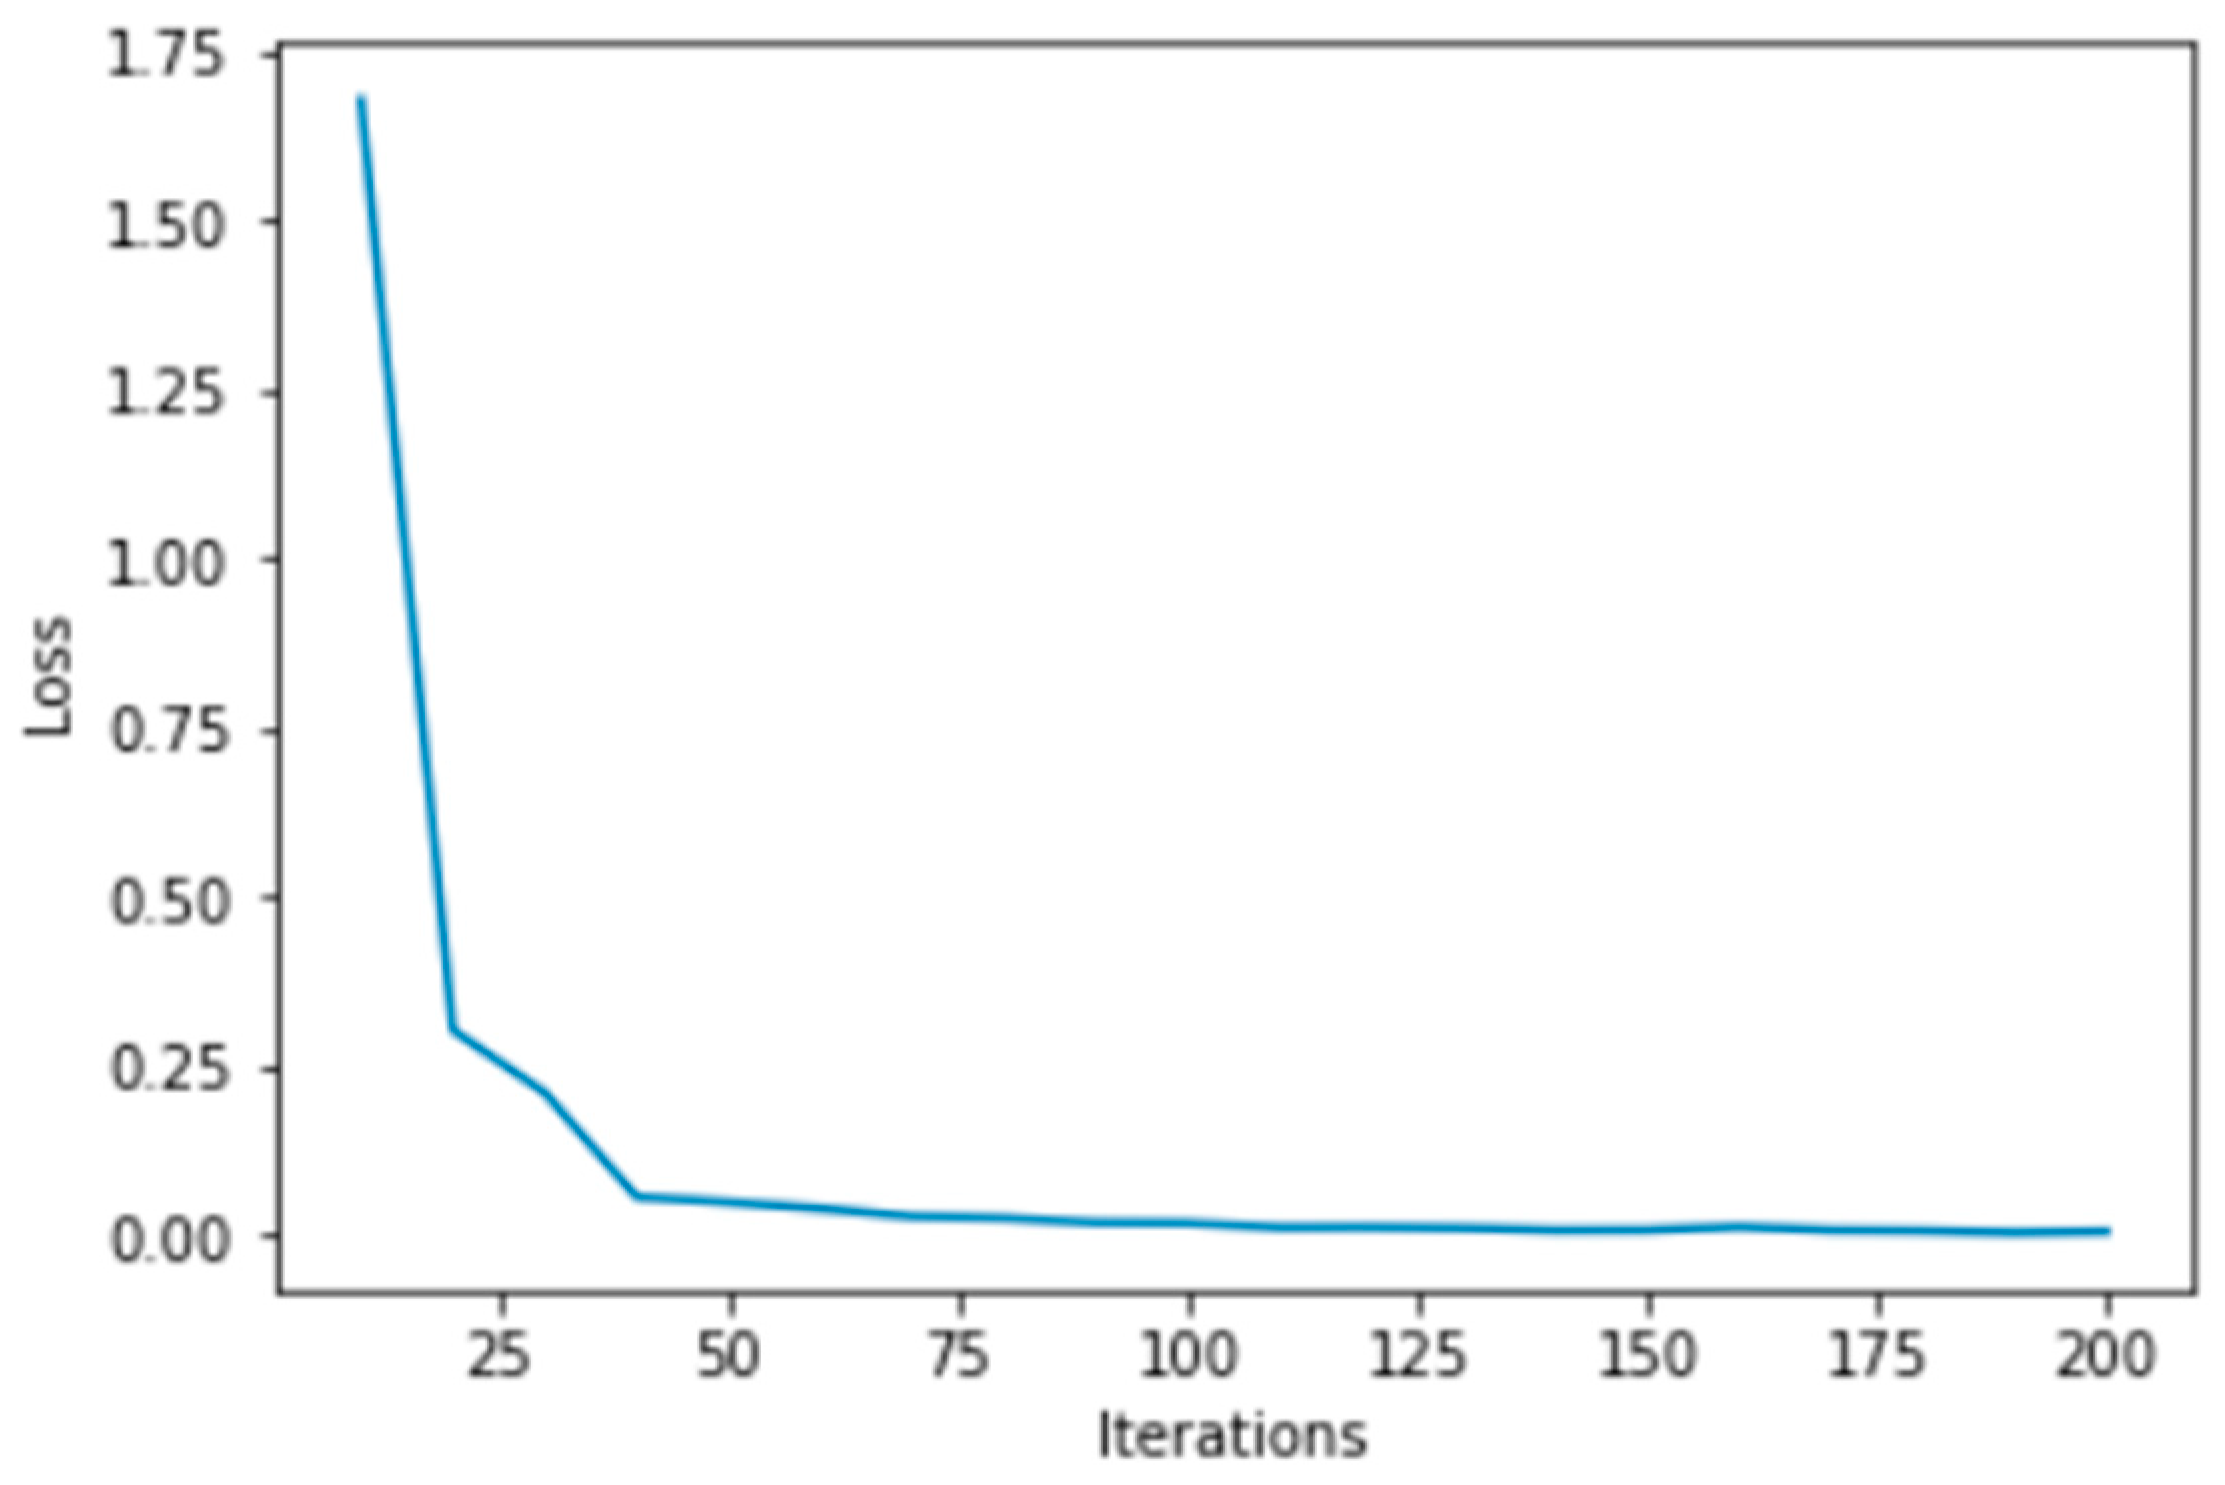
Additionally, due to the limited biomechanical motion analysis data, this study addresses this challenge by using Siamese Neural Networks. Siamese neural networks have proven their effectiveness when dealing with limited amounts of data. In this study, due to the small number of stroke survivors, we converted the biomechanical signals into images by using the aforementioned visual representation technique in order to harness the power of the convolutional SNN. As observed, despite the small amount of data, the proposed methodology presents encouraging outcomes, providing 100% accuracy. The crux of the novelty in this study does not reside in the classification models employed, but significantly in the feature extraction approach orchestrated by the Siamese neural networks and the unique visualization technique. This distinct approach of converting biomechanical data into a visual format, coupled with the adept feature extraction capability of the SNN, lays the foundation for the encouraging results observed. However, it is crucial to gather more data and samples to draw safer conclusions. Conducting further investigations with a larger and more diverse dataset will help us obtain more reliable results and strengthen the validity and generalizability of our findings.
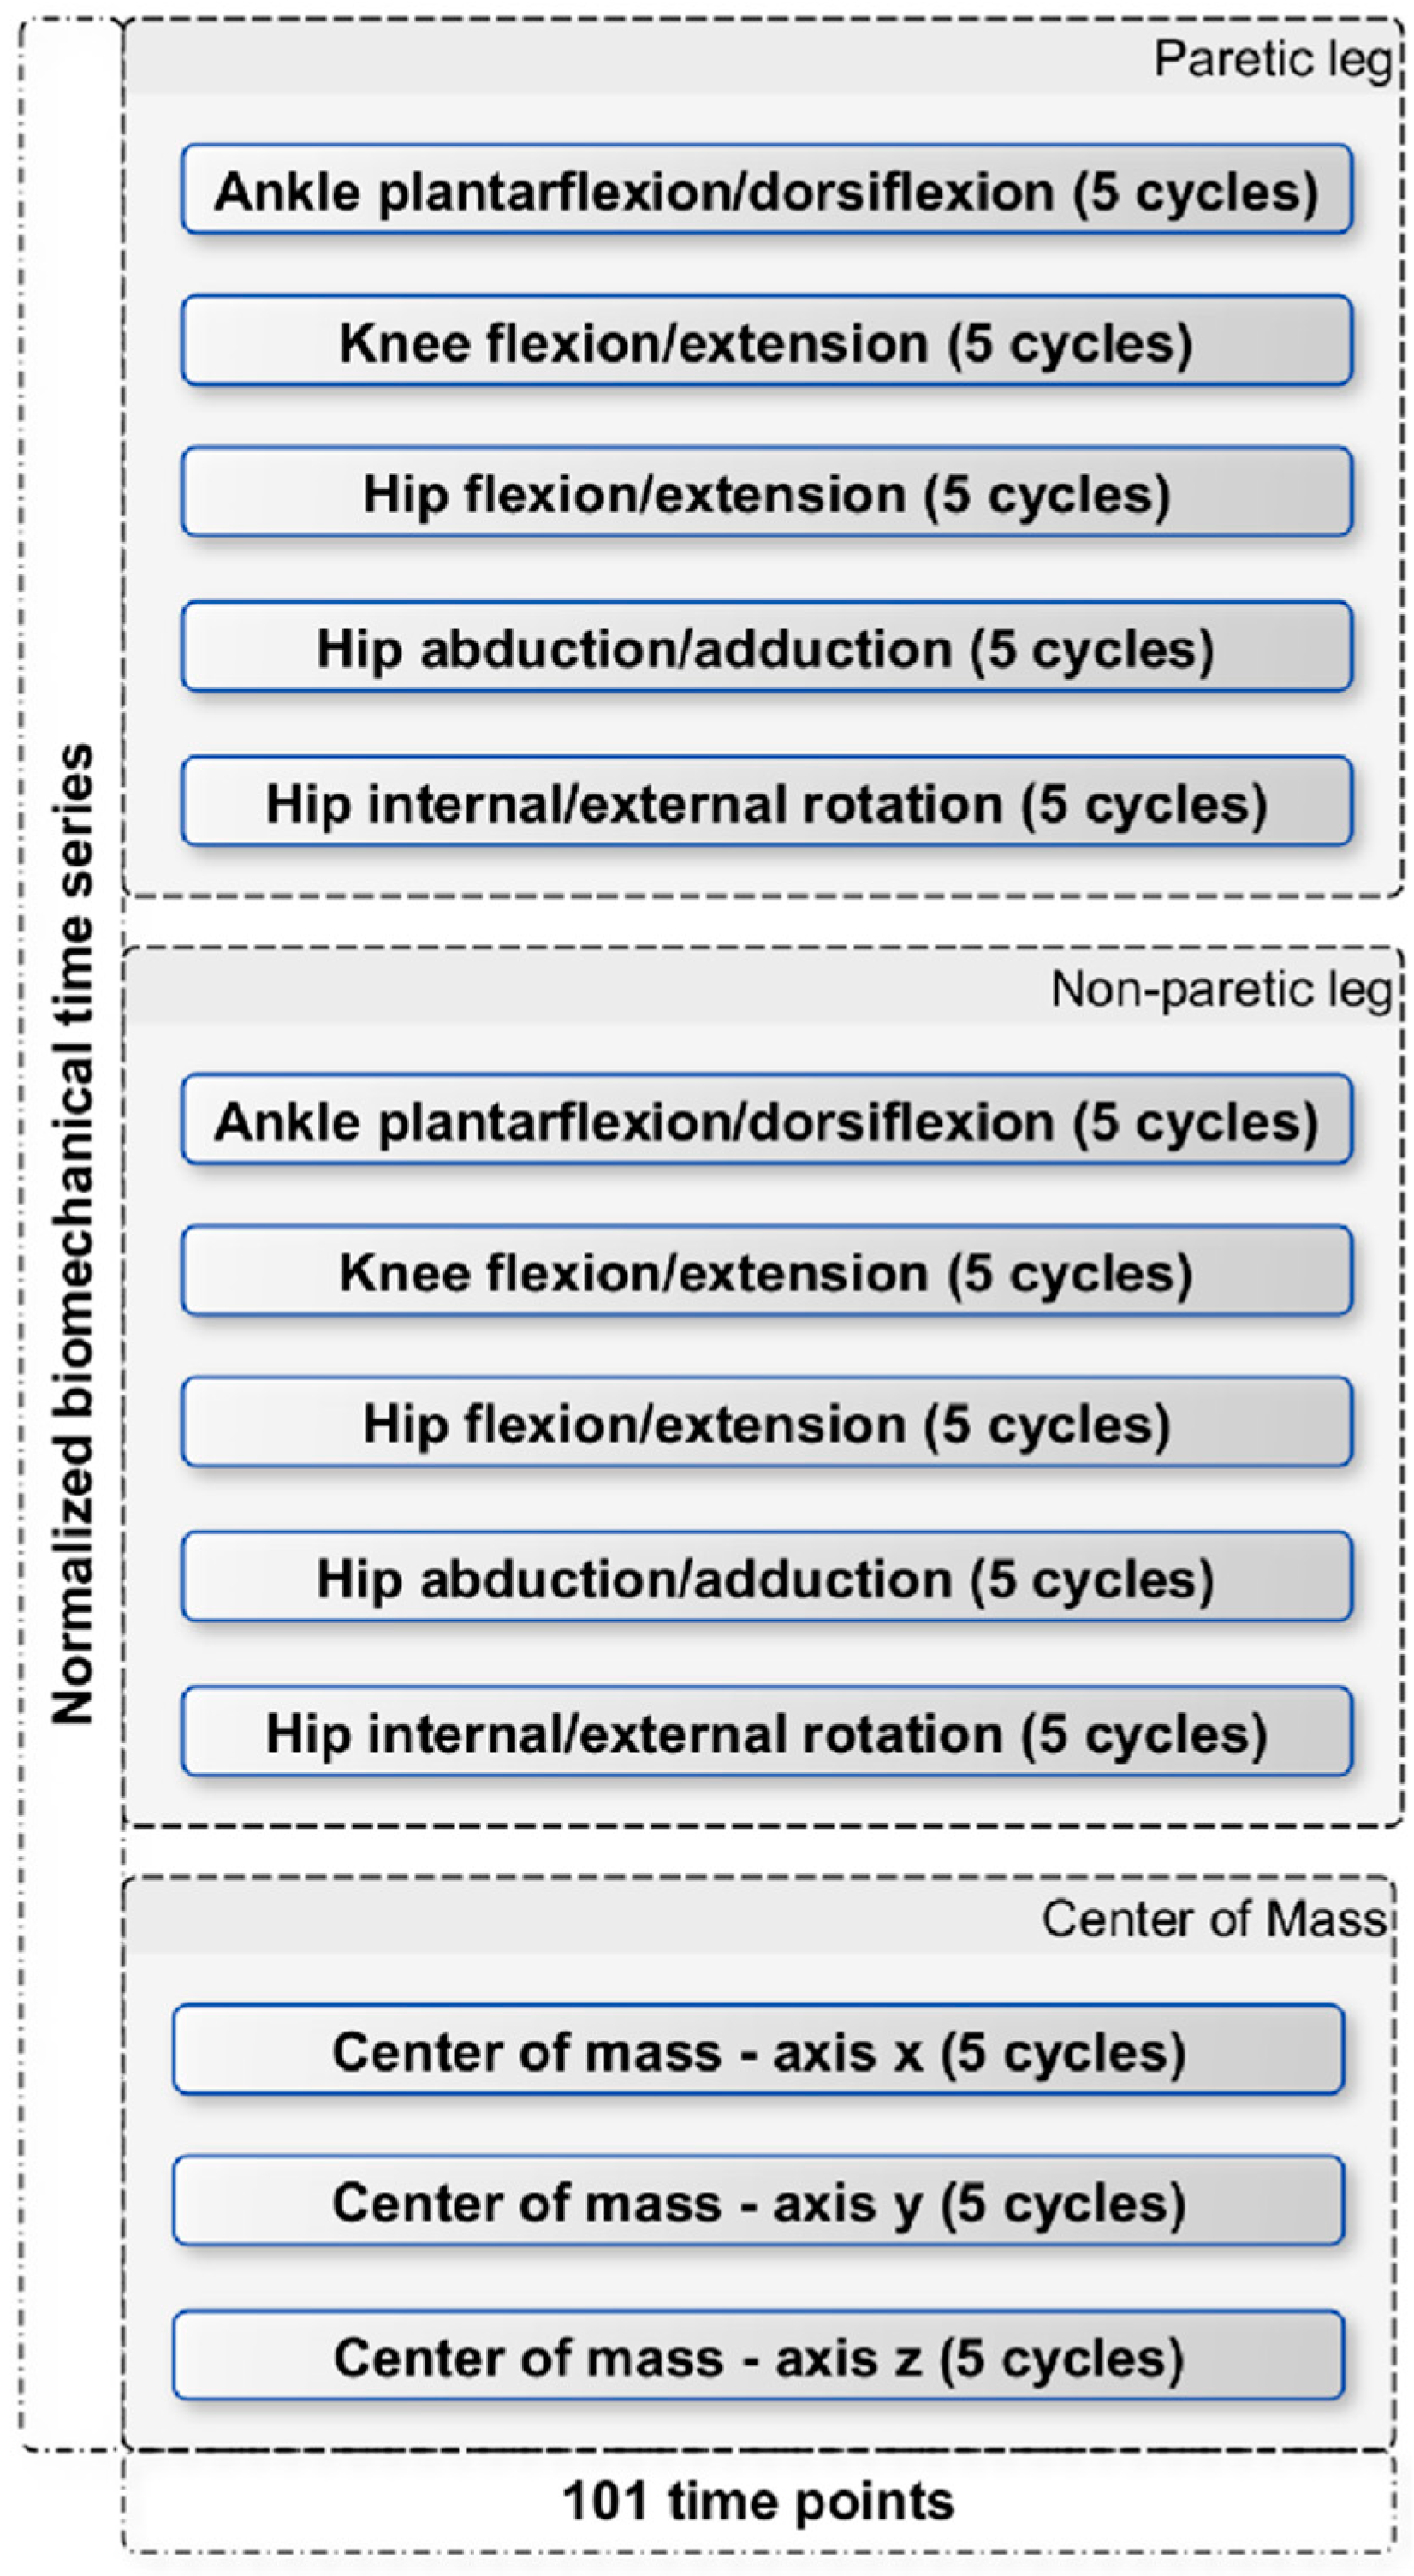
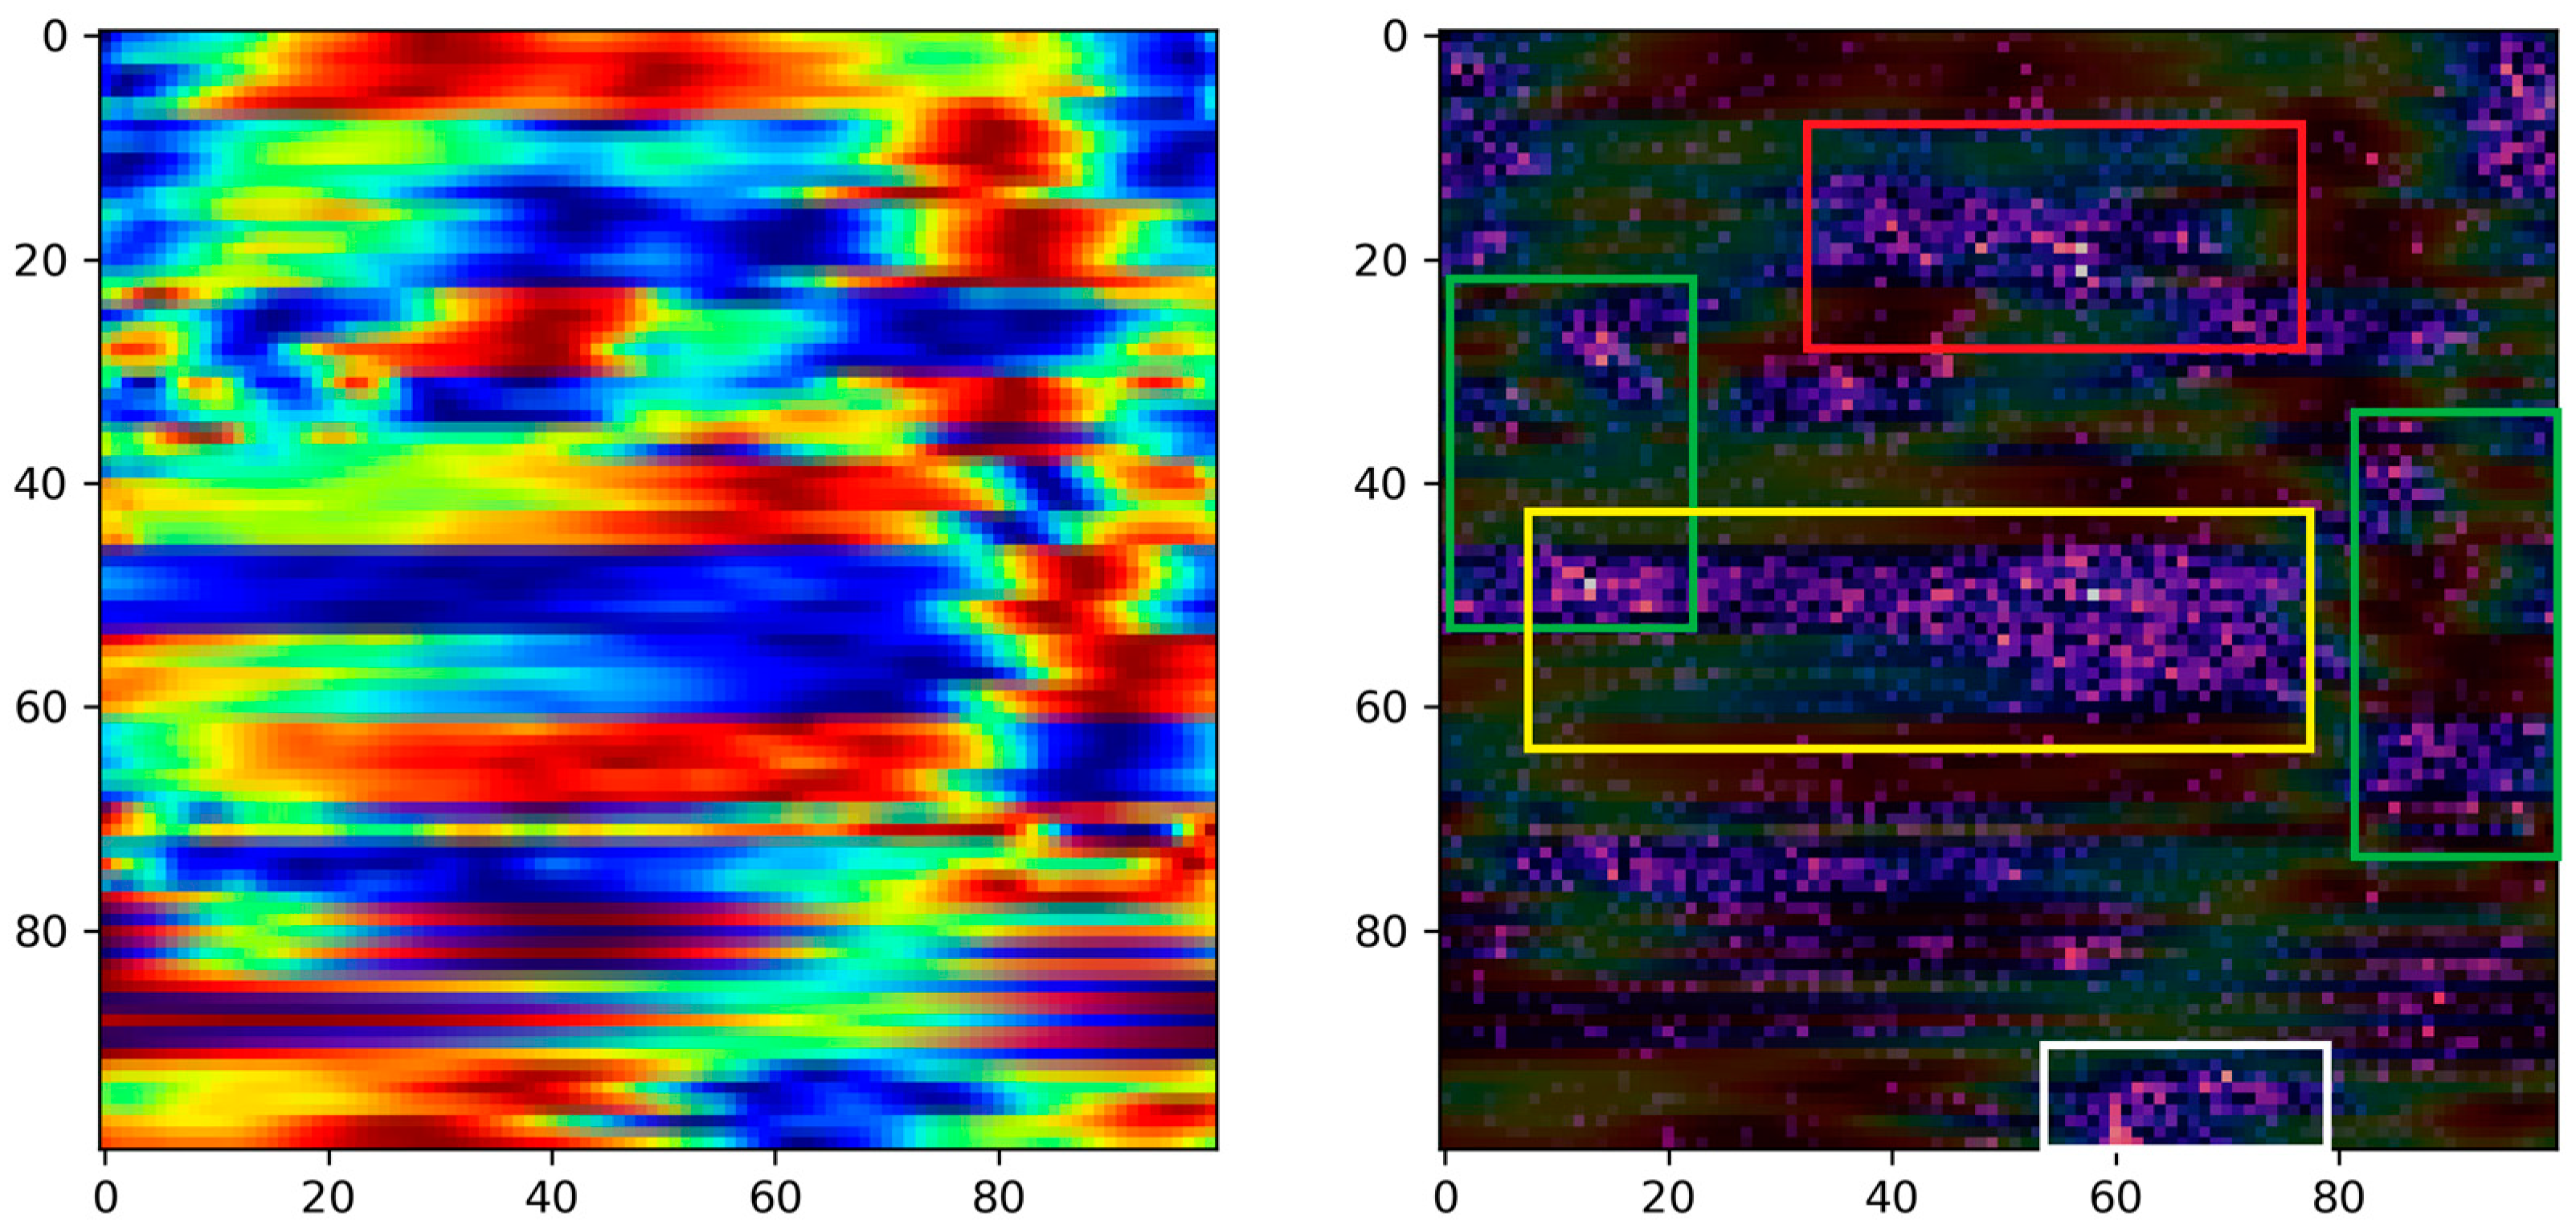
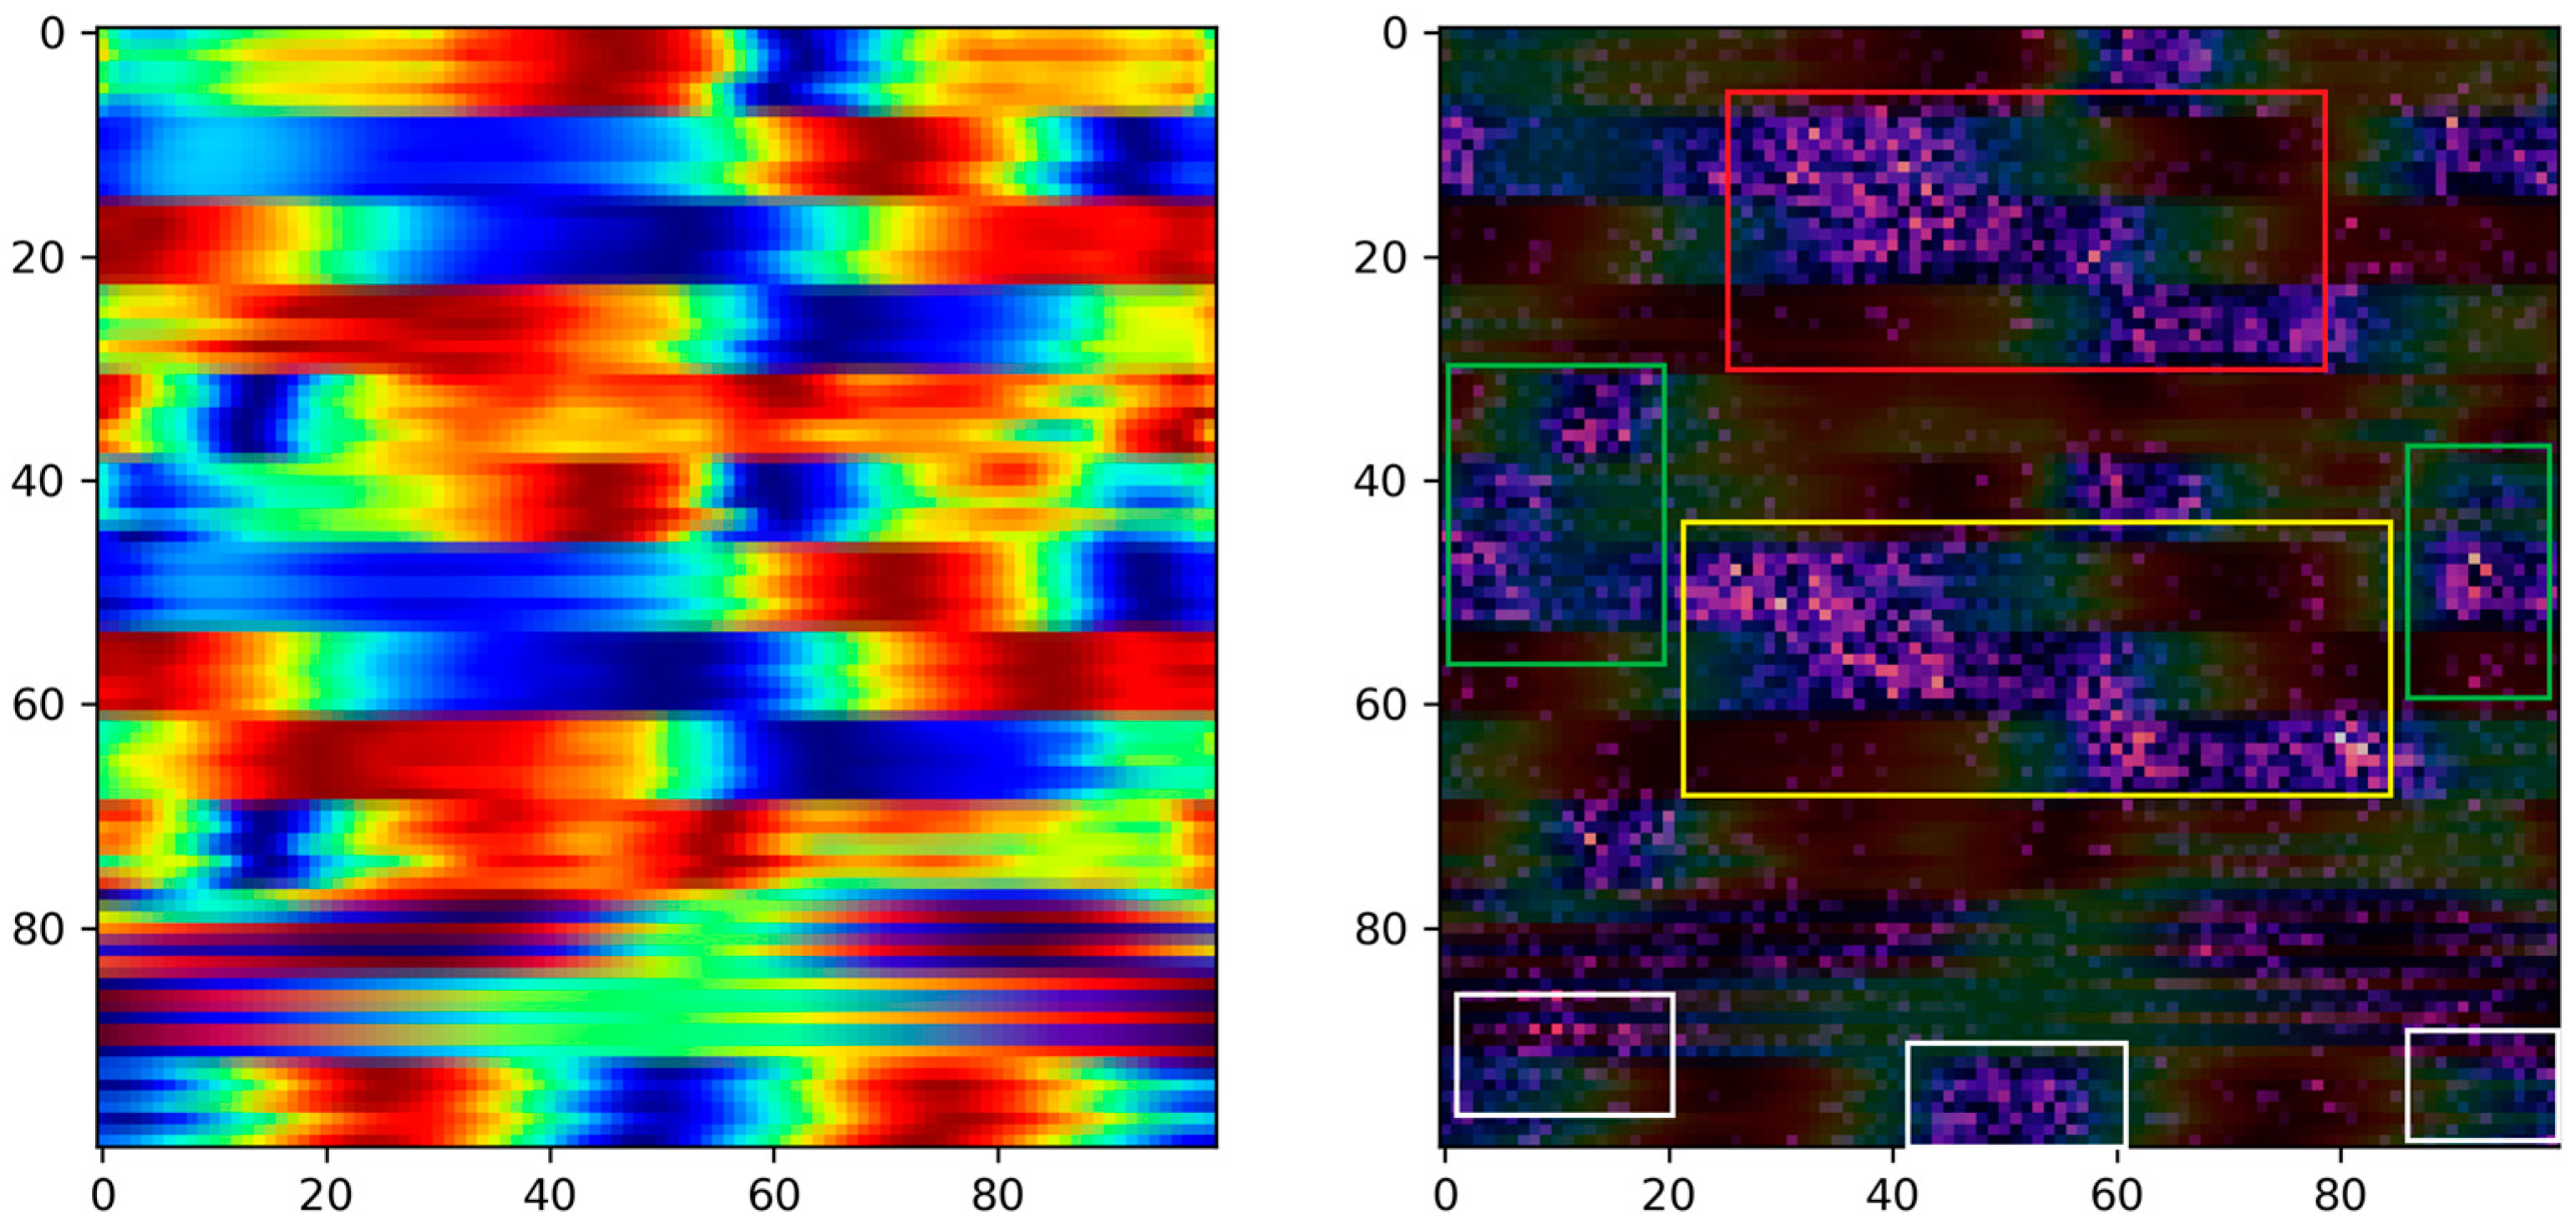
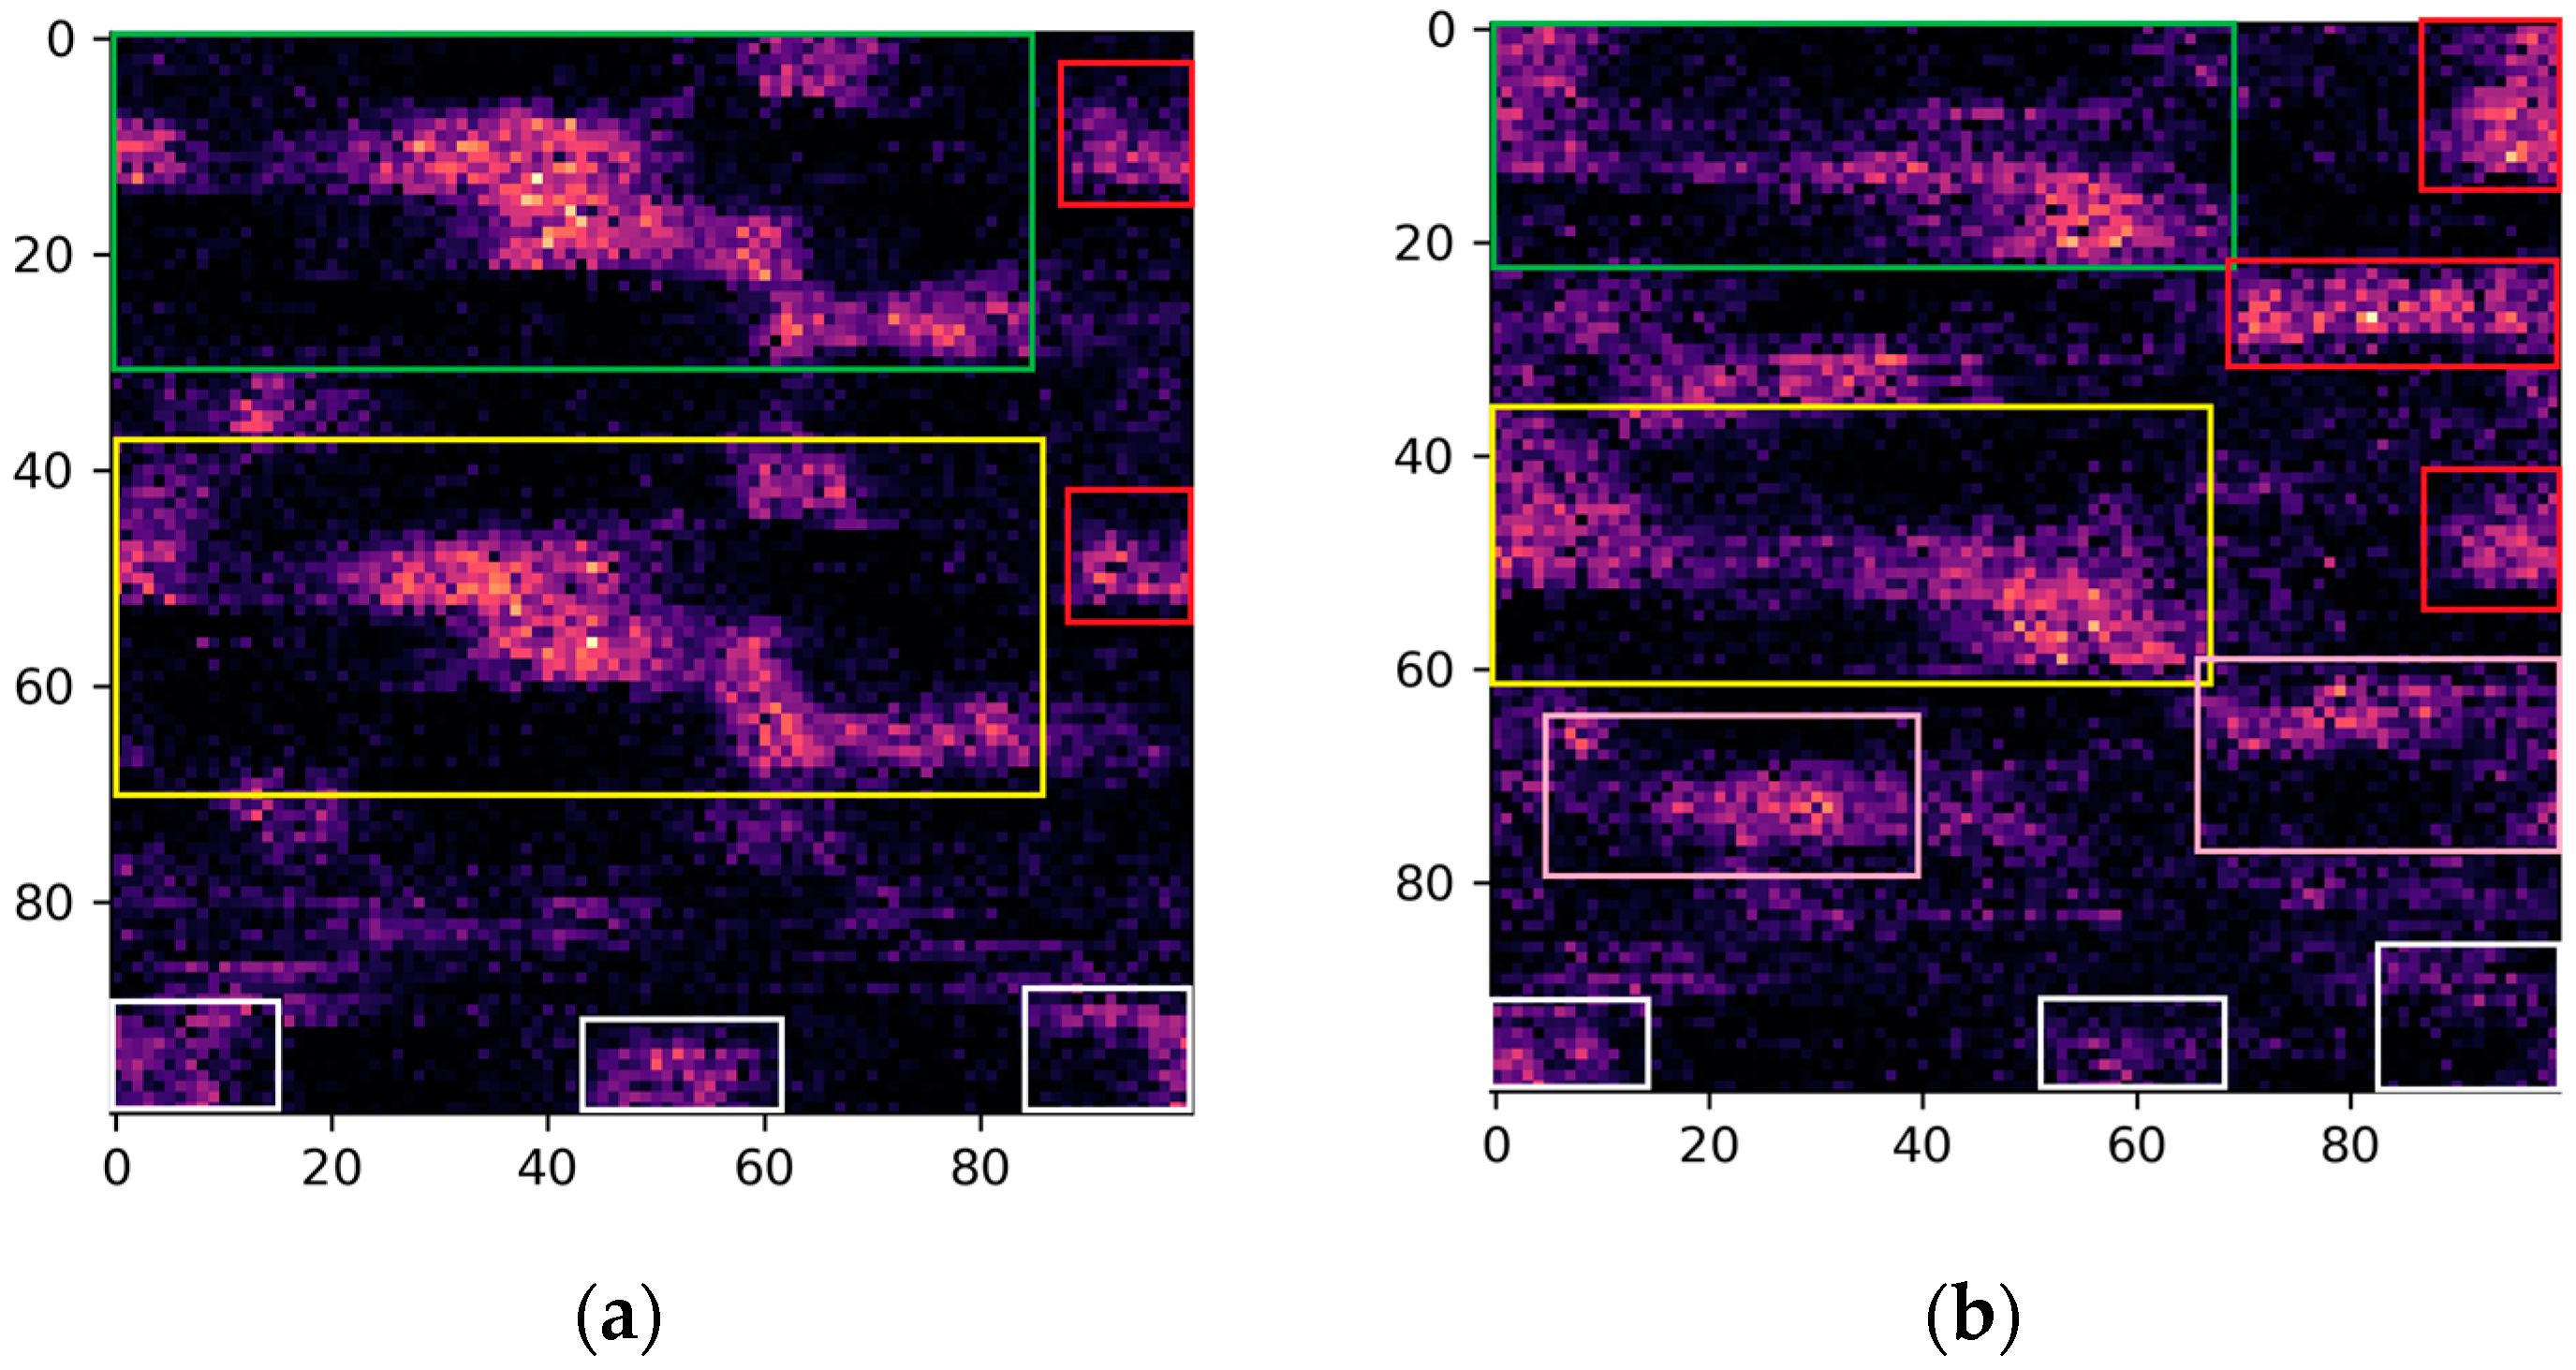
Moreover, in the pursuit of identifying critical biomechanical parameters associated with stroke, we employed the Grad-CAM technique with the primary objective of interpreting the decision-making process of the proposed model. The rationale behind this approach stems from the essential need for explanatory insights into AI-based decision making in medical contexts. Specifically, by interpreting the regions within images that activate the model’s output, we can potentially offer fresh perspectives to clinicians, providing them with valuable information for improved understanding and decision making in stroke-related cases. Based on the activated regions identified by the Grad-CAM algorithm, several key biomedical parameters emerge as significant. These include ankle plantarflexion/dorsiflexion, knee flexion/extension, and hip flexion/extension in both the paretic and non-paretic legs. Additionally, hip abduction/adduction and hip internal/external rotation play a noteworthy role, specifically in the paretic leg. Furthermore, the center of mass (axis-z) is also identified as an influential factor in the model’s decision-making process. Overall, between the two groups, we see obvious differences in the activation areas during the swing phase. These findings highlight the importance of these specific parameters in understanding the underlying factors driving the model’s predictions. This nuanced understanding paves the way for developing more targeted rehabilitation strategies, reinforcing the substantial potential of the visualization and explanatory techniques employed in this study.
Specifically, ankle plantarflexion/dorsiflexion, knee flexion/extension, and hip flexion/extension are fundamental to the normal locomotion process, contributing to the smoothness and efficiency of movement. In stroke survivors, impairments in these parameters can disrupt the coordination and range of motion during the gait cycle [
28]. Deviations from the expected patterns could indicate muscular weaknesses, spasticity, or compensatory movements that are common after stroke [
29,
30]. Moreover, hip abduction and adduction are important for maintaining stability during the gait cycle, and deficits in these motions could affect balance and overall gait symmetry [
31]. Likewise, limitations in hip internal and external rotation might indicate muscular control imbalances or joint stiffness. Consequently, the emphasis on these parameters is in accordance with the challenges in controlling the lateral and rotational movements of the hip joint post-stroke [
5]. In addition, the engagement of the center of mass, particularly on the vertical (z) axis, indicates issues of balance and weight distribution [
32]. Stroke survivors often show alterations in weight-bearing capacity and balance control, which may affect their overall gait pattern. Finally, the observed differences in the activation regions during the swing phase suggest that this phase is particularly sensitive to the identified parameters. The swing phase involves lifting the foot off the ground and moving it forward for the next step. It requires a precise sequence of joint movements and muscle contractions. Differences in activation patterns during this phase could reflect adaptations made by stroke survivors to compensate for deficits in motor control and strength.
The above identified parameters highlight potential areas of dysfunction, providing clinicians with a clearer understanding of the underlying biomechanical issues. By leveraging these insights, tailored rehabilitation approaches can be developed to improve post-stroke gait patterns and enhance overall mobility and quality of life. However, it is important to note that the specific biomechanical differences can vary depending on the severity of the stroke, the location of the brain damage, and individual factors. The elucidation of these biomechanical parameters through the innovative visualization and explainable machine learning methodologies deployed in this study illuminates a pathway for a more informed, personalized rehabilitation planning, potentially leading to better patient outcomes and an enriched understanding of post-stroke locomotor dynamics.
This study presents certain limitations that chiefly stem from the constrained sample size and the single-source nature of the biomechanical data, which was garnered from one gait analysis laboratory. This scenario potentially narrows the generalizability of the proposed model, thus necessitating caution in extrapolating the findings across a broader spectrum. Moreover, the uniqueness of the visualization technique employed, while innovative, requires further validation to establish its efficacy and versatility in different contexts or with varied datasets. Looking ahead, the roadmap for future work is outlined with several pivotal directions. Foremost among these is the acquisition of more data and the external validation of the model, which entails engaging with diverse datasets potentially sourced from different gait analysis laboratories. This step is crucial to foster a more robust and generalized model capable of handling varied biomechanical data. Moreover, we have outlined a strategic roadmap that involves the integration of wearable sensors, specifically Inertial Measurement Units (IMUs), to capture comprehensive kinematic data. This forward-looking approach aims to further enrich our analysis and strengthen the applicability of our methodology in real-world scenarios, offering the potential to advance the field of biomechanical data utilization in medical diagnosis. Additionally, the exploration of newly derived signals holds promise in enriching the model’s input and, consequently, its predictive prowess. Furthermore, the amalgamation of explanatory techniques like Grad-CAM with Shapley Additive Explanations (SHAP) [
33] is envisioned to provide a more nuanced understanding of the model’s decision-making process. This blend of techniques aims to not only enhance the interpretability of the model, but also foster more coherent communication of its findings to clinicians, thereby bridging the gap between complex machine learning models and practical clinical application.
Author Contributions
Conceptualization, C.K., E.K. (Evangelos Karakasis), S.M. and N.A.; data curation, K.A., C.K. and E.K. (Evangelos Karakasis); formal analysis, K.A. and C.K.; funding acquisition, K.V. and N.A.; investigation, E.K. (Evangeli Karampina), D.M. and D.T.; methodology, C.K., E.K. (Evangelos Karakasis), S.M. and N.A.; project administration, C.K., K.V. and N.A.; resources, E.K. (Evangeli Karampina), D.M., G.G. and K.V.; software, K.A. and E.K. (Evangelos Karakasis); supervision, N.A.; visualization, E.K. (Evangelos Karakasis) and G.G.; writing—original draft, K.A., C.K. and N.A.; writing—review and editing, S.M., G.G., D.T., K.V. and N.A. All authors have read and agreed to the published version of the manuscript.
Funding
This research was funded by the grant MIS 5047286 from Greek and European funds (EYD-EPANEK).
Institutional Review Board Statement
The Research Ethics Committee of Democritus University of Thrace (ΔΠΘ/ΕHΔΕ/28061/165/20.01.2023) approved this research. The study was conducted according to the guidelines of the Declaration of Helsinki.
Informed Consent Statement
Informed consent was obtained from all subjects involved in this study.
Data Availability Statement
The dataset generated and/or analyzed during the current study is not publicly available.
Acknowledgments
We acknowledge the support provided by the project “Study of the interrelationships between neuroimaging, neurophysiological and biomechanical biomarkers in stroke rehabilitation (NEURO-BIO-MECH in stroke rehab)” (MIS 5047286), which is implemented under the action “Support for Regional Excellence”—Operational Program “Competitiveness, Entrepreneurship and Innovation” (NSRFm2014-2020), under the auspices of Greece and the European Union (European Regional Development Fund).
Conflicts of Interest
The authors declare no conflict of interest.
References
- Verghese, J.; LeValley, A.; Hall, C.B.; Katz, M.J.; Ambrose, A.F.; Lipton, R.B. Epidemiology of Gait Disorders in Community-Residing Older Adults. J. Am. Geriatr. Soc. 2006, 54, 255–261. [Google Scholar] [CrossRef]
- Kwakkel, G.; Kollen, B.; Lindeman, E. Understanding the Pattern of Functional Recovery after Stroke: Facts and Theories. Restor. Neurol. Neurosci. 2004, 22, 281–299. [Google Scholar]
- Quantitative Analysis of Stroke Patients with Foot Drop—ProQuest. Available online: https://www.proquest.com/openview/f15d4e659e9e189283c67662abf8ee9b/1?pq-origsite=gscholar&cbl=18750 (accessed on 31 August 2023).
- Thibaut, A.; Chatelle, C.; Ziegler, E.; Bruno, M.-A.; Laureys, S.; Gosseries, O. Spasticity after Stroke: Physiology, Assessment and Treatment. Brain Inj. 2013, 27, 1093–1105. [Google Scholar] [CrossRef] [PubMed]
- Balaban, B.; Tok, F. Gait Disturbances in Patients With Stroke. PM&R 2014, 6, 635–642. [Google Scholar] [CrossRef]
- An, M.; Shaughnessy, M. The Effects of Exercise-Based Rehabilitation on Balance and Gait for Stroke Patients: A Systematic Review. J. Neurosci. Nurs. 2011, 43, 298. [Google Scholar] [CrossRef] [PubMed]
- Mohan, D.M.; Khandoker, A.H.; Wasti, S.A.; Ismail Ibrahim Ismail Alali, S.; Jelinek, H.F.; Khalaf, K. Assessment Methods of Post-Stroke Gait: A Scoping Review of Technology-Driven Approaches to Gait Characterization and Analysis. Front. Neurol. 2021, 12, 650024. [Google Scholar] [CrossRef]
- Buckley, C.; Alcock, L.; McArdle, R.; Rehman, R.Z.U.; Del Din, S.; Mazzà, C.; Yarnall, A.J.; Rochester, L. The Role of Movement Analysis in Diagnosing and Monitoring Neurodegenerative Conditions: Insights from Gait and Postural Control. Brain Sci. 2019, 9, 34. [Google Scholar] [CrossRef] [PubMed]
- Matsushita, Y.; Tran, D.T.; Yamazoe, H.; Lee, J.-H. Recent Use of Deep Learning Techniques in Clinical Applications Based on Gait: A Survey. J. Comput. Des. Eng. 2021, 8, 1499–1532. [Google Scholar] [CrossRef]
- Lau, H.; Tong, K.; Zhu, H. Support Vector Machine for Classification of Walking Conditions of Persons after Stroke with Dropped Foot. Hum. Mov. Sci. 2009, 28, 504–514. [Google Scholar] [CrossRef]
- Kaczmarczyk, K.; Wit, A.; Krawczyk, M.; Zaborski, J. Gait Classification in Post-Stroke Patients Using Artificial Neural Networks. Gait Posture 2009, 30, 207–210. [Google Scholar] [CrossRef] [PubMed]
- Fan, X.; Wang, H.; Zhao, Y.; Huang, K.-H.; Wu, Y.-T.; Sun, T.-L.; Tsui, K.-L. Automatic Fall Risk Assessment with Siamese Network for Stroke Survivors Using Inertial Sensor-Based Signals. Int. J. Intell. Syst. 2022, 37, 6168–6184. [Google Scholar] [CrossRef]
- Vieira, A.B.; Fonseca, A.C.; Ferro, J.; Oliveira, A.L. Using a Siamese Network to Accurately Detect Ischemic Stroke in Computed Tomography Scans. In Proceedings of the Progress in Artificial Intelligence; Marreiros, G., Martins, B., Paiva, A., Ribeiro, B., Sardinha, A., Eds.; Springer International Publishing: Cham, Switzerland, 2022; pp. 159–170. [Google Scholar]
- Zhang, C.; Liu, W.; Ma, H.; Fu, H. Siamese Neural Network Based Gait Recognition for Human Identification. In Proceedings of the 2016 IEEE International Conference on Acoustics, Speech and Signal Processing (ICASSP), Shanghai, China, 20–25 March 2016; pp. 2832–2836. [Google Scholar]
- Liu, W.; Zhang, C.; Ma, H.; Li, S. Learning Efficient Spatial-Temporal Gait Features with Deep Learning for Human Identification. Neuroinformatics 2018, 16, 457–471. [Google Scholar] [CrossRef]
- Hayashi, Y.; Shimada, T.; Hattori, N.; Shimazui, T.; Yoshida, Y.; Miura, R.E.; Yamao, Y.; Abe, R.; Kobayashi, E.; Iwadate, Y.; et al. A Prehospital Diagnostic Algorithm for Strokes Using Machine Learning: A Prospective Observational Study. Sci. Rep. 2021, 11, 20519. [Google Scholar] [CrossRef] [PubMed]
- Yang, W.-X.; Wang, F.-F.; Pan, Y.-Y.; Xie, J.-Q.; Lu, M.-H.; You, C.-G. Comparison of Ischemic Stroke Diagnosis Models Based on Machine Learning. Front. Neurol. 2022, 13, 1014346. [Google Scholar] [CrossRef]
- Badriyah, T.; Sakinah, N.; Syarif, I.; Syarif, D.R. Machine Learning Algorithm for Stroke Disease Classification. In Proceedings of the 2020 International Conference on Electrical, Communication, and Computer Engineering (ICECCE), Istanbul, Turkey, 12–13 June 2020; pp. 1–5. [Google Scholar]
- Horst, F.; Lapuschkin, S.; Samek, W.; Müller, K.-R.; Schöllhorn, W.I. Explaining the Unique Nature of Individual Gait Patterns with Deep Learning. Sci. Rep. 2019, 9, 2391. [Google Scholar] [CrossRef] [PubMed]
- Leboeuf, F.; Baker, R.; Barré, A.; Reay, J.; Jones, R.; Sangeux, M. The Conventional Gait Model, an Open-Source Implementation That Reproduces the Past but Prepares for the Future. Gait Posture 2019, 69, 235–241. [Google Scholar] [CrossRef]
- Bromley, J.; Guyon, I.; LeCun, Y.; Säckinger, E.; Shah, R. Signature Verification Using a “Siamese” Time Delay Neural Network. In Proceedings of the Advances in Neural Information Processing Systems, Denver, CO, USA, 29 November–2 December 1993; Morgan-Kaufmann: Burlington, MA, USA, 1993; Volume 6. [Google Scholar]
- Song, C.; Ji, S. Face Recognition Method Based on Siamese Networks Under Non-Restricted Conditions. IEEE Access 2022, 10, 40432–40444. [Google Scholar] [CrossRef]
- Wu, X.; Kimura, A.; Iwana, B.K.; Uchida, S.; Kashino, K. Deep Dynamic Time Warping: End-to-End Local Representation Learning for Online Signature Verification. In Proceedings of the 2019 International Conference on Document Analysis and Recognition (ICDAR), Sydney, NSW, Australia, 20–25 September 2019; pp. 1103–1110. [Google Scholar]
- Khosla, P.; Teterwak, P.; Wang, C.; Sarna, A.; Tian, Y.; Isola, P.; Maschinot, A.; Liu, C.; Krishnan, D. Supervised Contrastive Learning. In Proceedings of the Advances in Neural Information Processing Systems, Virtual, 6–12 December 2020; Curran Associates, Inc.: Red Hook, NY, USA, 2020; Volume 33, pp. 18661–18673. [Google Scholar]
- Hearst, M.A.; Dumais, S.T.; Osuna, E.; Platt, J.; Scholkopf, B. Support Vector Machines. IEEE Intell. Syst. Their Appl. 1998, 13, 18–28. [Google Scholar] [CrossRef]
- Breiman, L. Random Forests. Mach. Learn. 2001, 45, 5–32. [Google Scholar] [CrossRef]
- Selvaraju, R.R.; Cogswell, M.; Das, A.; Vedantam, R.; Parikh, D.; Batra, D. Grad-CAM: Visual Explanations From Deep Networks via Gradient-Based Localization. In Proceedings of the IEEE International Conference on Computer Vision, Venice, Italy, 22–29 October 2017. [Google Scholar]
- Lamontagne, A.; De Serres, S.J.; Fung, J.; Paquet, N. Stroke Affects the Coordination and Stabilization of Head, Thorax and Pelvis during Voluntary Horizontal Head Motions Performed in Walking. Clin. Neurophysiol. 2005, 116, 101–111. [Google Scholar] [CrossRef] [PubMed]
- Knarr, B.A.; Reisman, D.S.; Binder-Macleod, S.A.; Higginson, J.S. Understanding Compensatory Strategies for Muscle Weakness during Gait by Simulating Activation Deficits Seen Post-Stroke. Gait Posture 2013, 38, 270–275. [Google Scholar] [CrossRef] [PubMed]
- Gait Post-Stroke: Pathophysiology and Rehabilitation Strategies—ScienceDirect. Available online: https://www.sciencedirect.com/science/article/pii/S0987705315000696?casa_token=qlv44LtpuwIAAAAA:IpI7lNBX2k1WTmlmL7-A6B7GC3rynr8a6D7twLPWwvC_j3biZ8WNYpAlPdVj-ih9XzmiQpgapQ (accessed on 31 August 2023).
- Lu, T.-W.; Yen, H.-C.; Chen, H.-L.; Hsu, W.-C.; Chen, S.-C.; Hong, S.-W.; Jeng, J.-S. Symmetrical Kinematic Changes in Highly Functioning Older Patients Post-Stroke during Obstacle-Crossing. Gait Posture 2010, 31, 511–516. [Google Scholar] [CrossRef] [PubMed]
- Devetak, G.F.; Bohrer, R.C.D.; Rodacki, A.L.F.; Manffra, E.F. Center of Mass in Analysis of Dynamic Stability during Gait Following Stroke: A Systematic Review. Gait Posture 2019, 72, 154–166. [Google Scholar] [CrossRef] [PubMed]
- Lundberg, S.; Lee, S.-I. A Unified Approach to Interpreting Model Predictions. In Proceedings of the Neural Information Processing Systems 30 (NIPS 2017), Long Beach, CA, USA, 4–9 December 2017. [Google Scholar]
| Disclaimer/Publisher’s Note: The statements, opinions and data contained in all publications are solely those of the individual author(s) and contributor(s) and not of MDPI and/or the editor(s). MDPI and/or the editor(s) disclaim responsibility for any injury to people or property resulting from any ideas, methods, instructions or products referred to in the content. |
© 2023 by the authors. Licensee MDPI, Basel, Switzerland. This article is an open access article distributed under the terms and conditions of the Creative Commons Attribution (CC BY) license (https://creativecommons.org/licenses/by/4.0/).


 ,
, 


