


A Cognitive Model to Anticipate Variations of Situation Awareness and Attention for the Takeover in Highly Automated Driving

Abstract
:1. Introduction
1.1. Cognitive Modeling in Highly Automated Driving
1.2. Situation Awareness
1.3. SEEV Theory
2. Materials and Methods
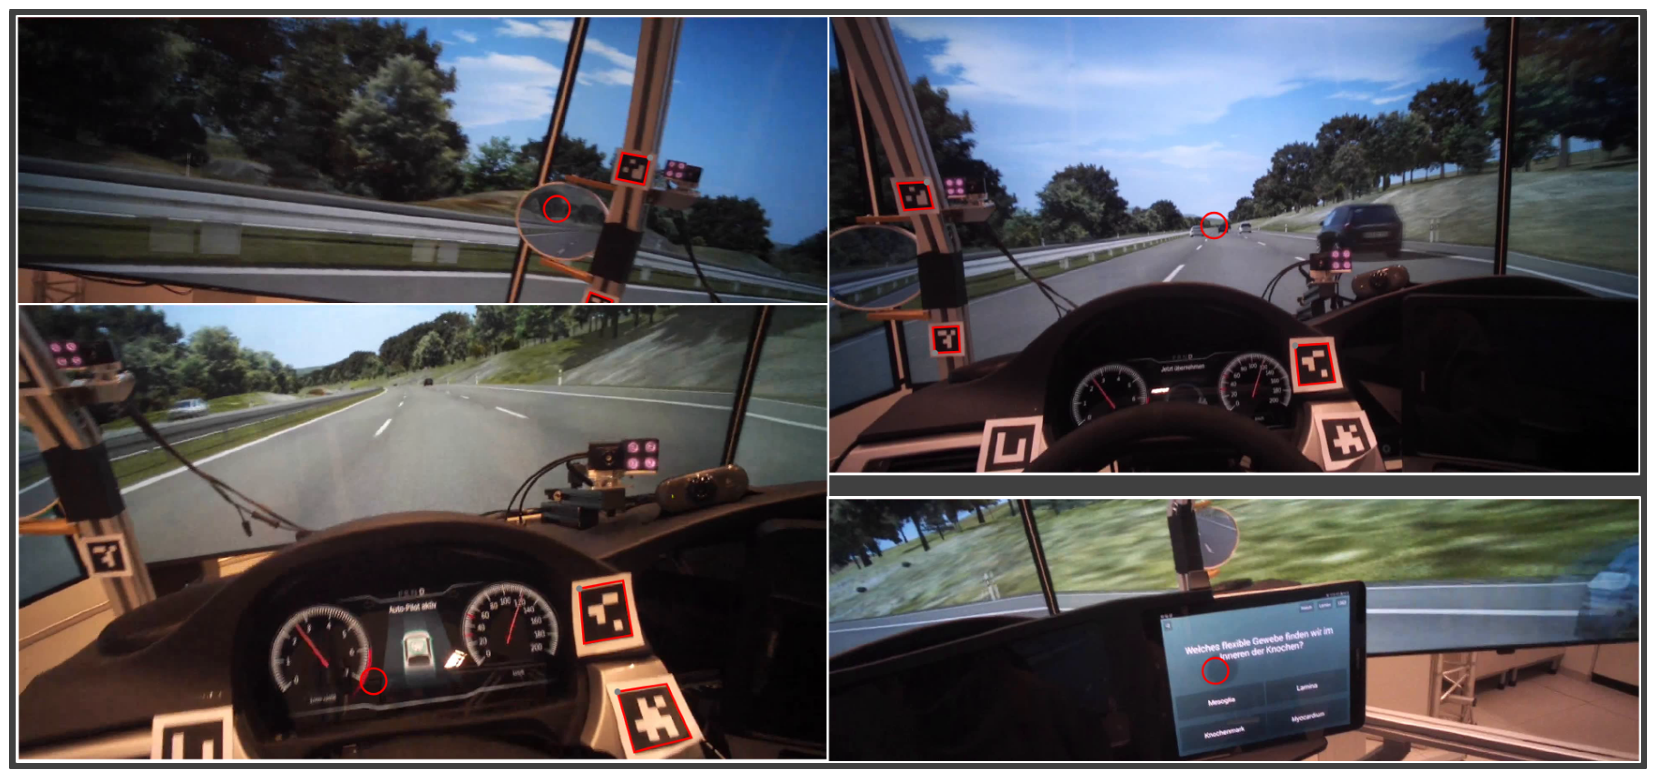
2.1. Graphical User Interface
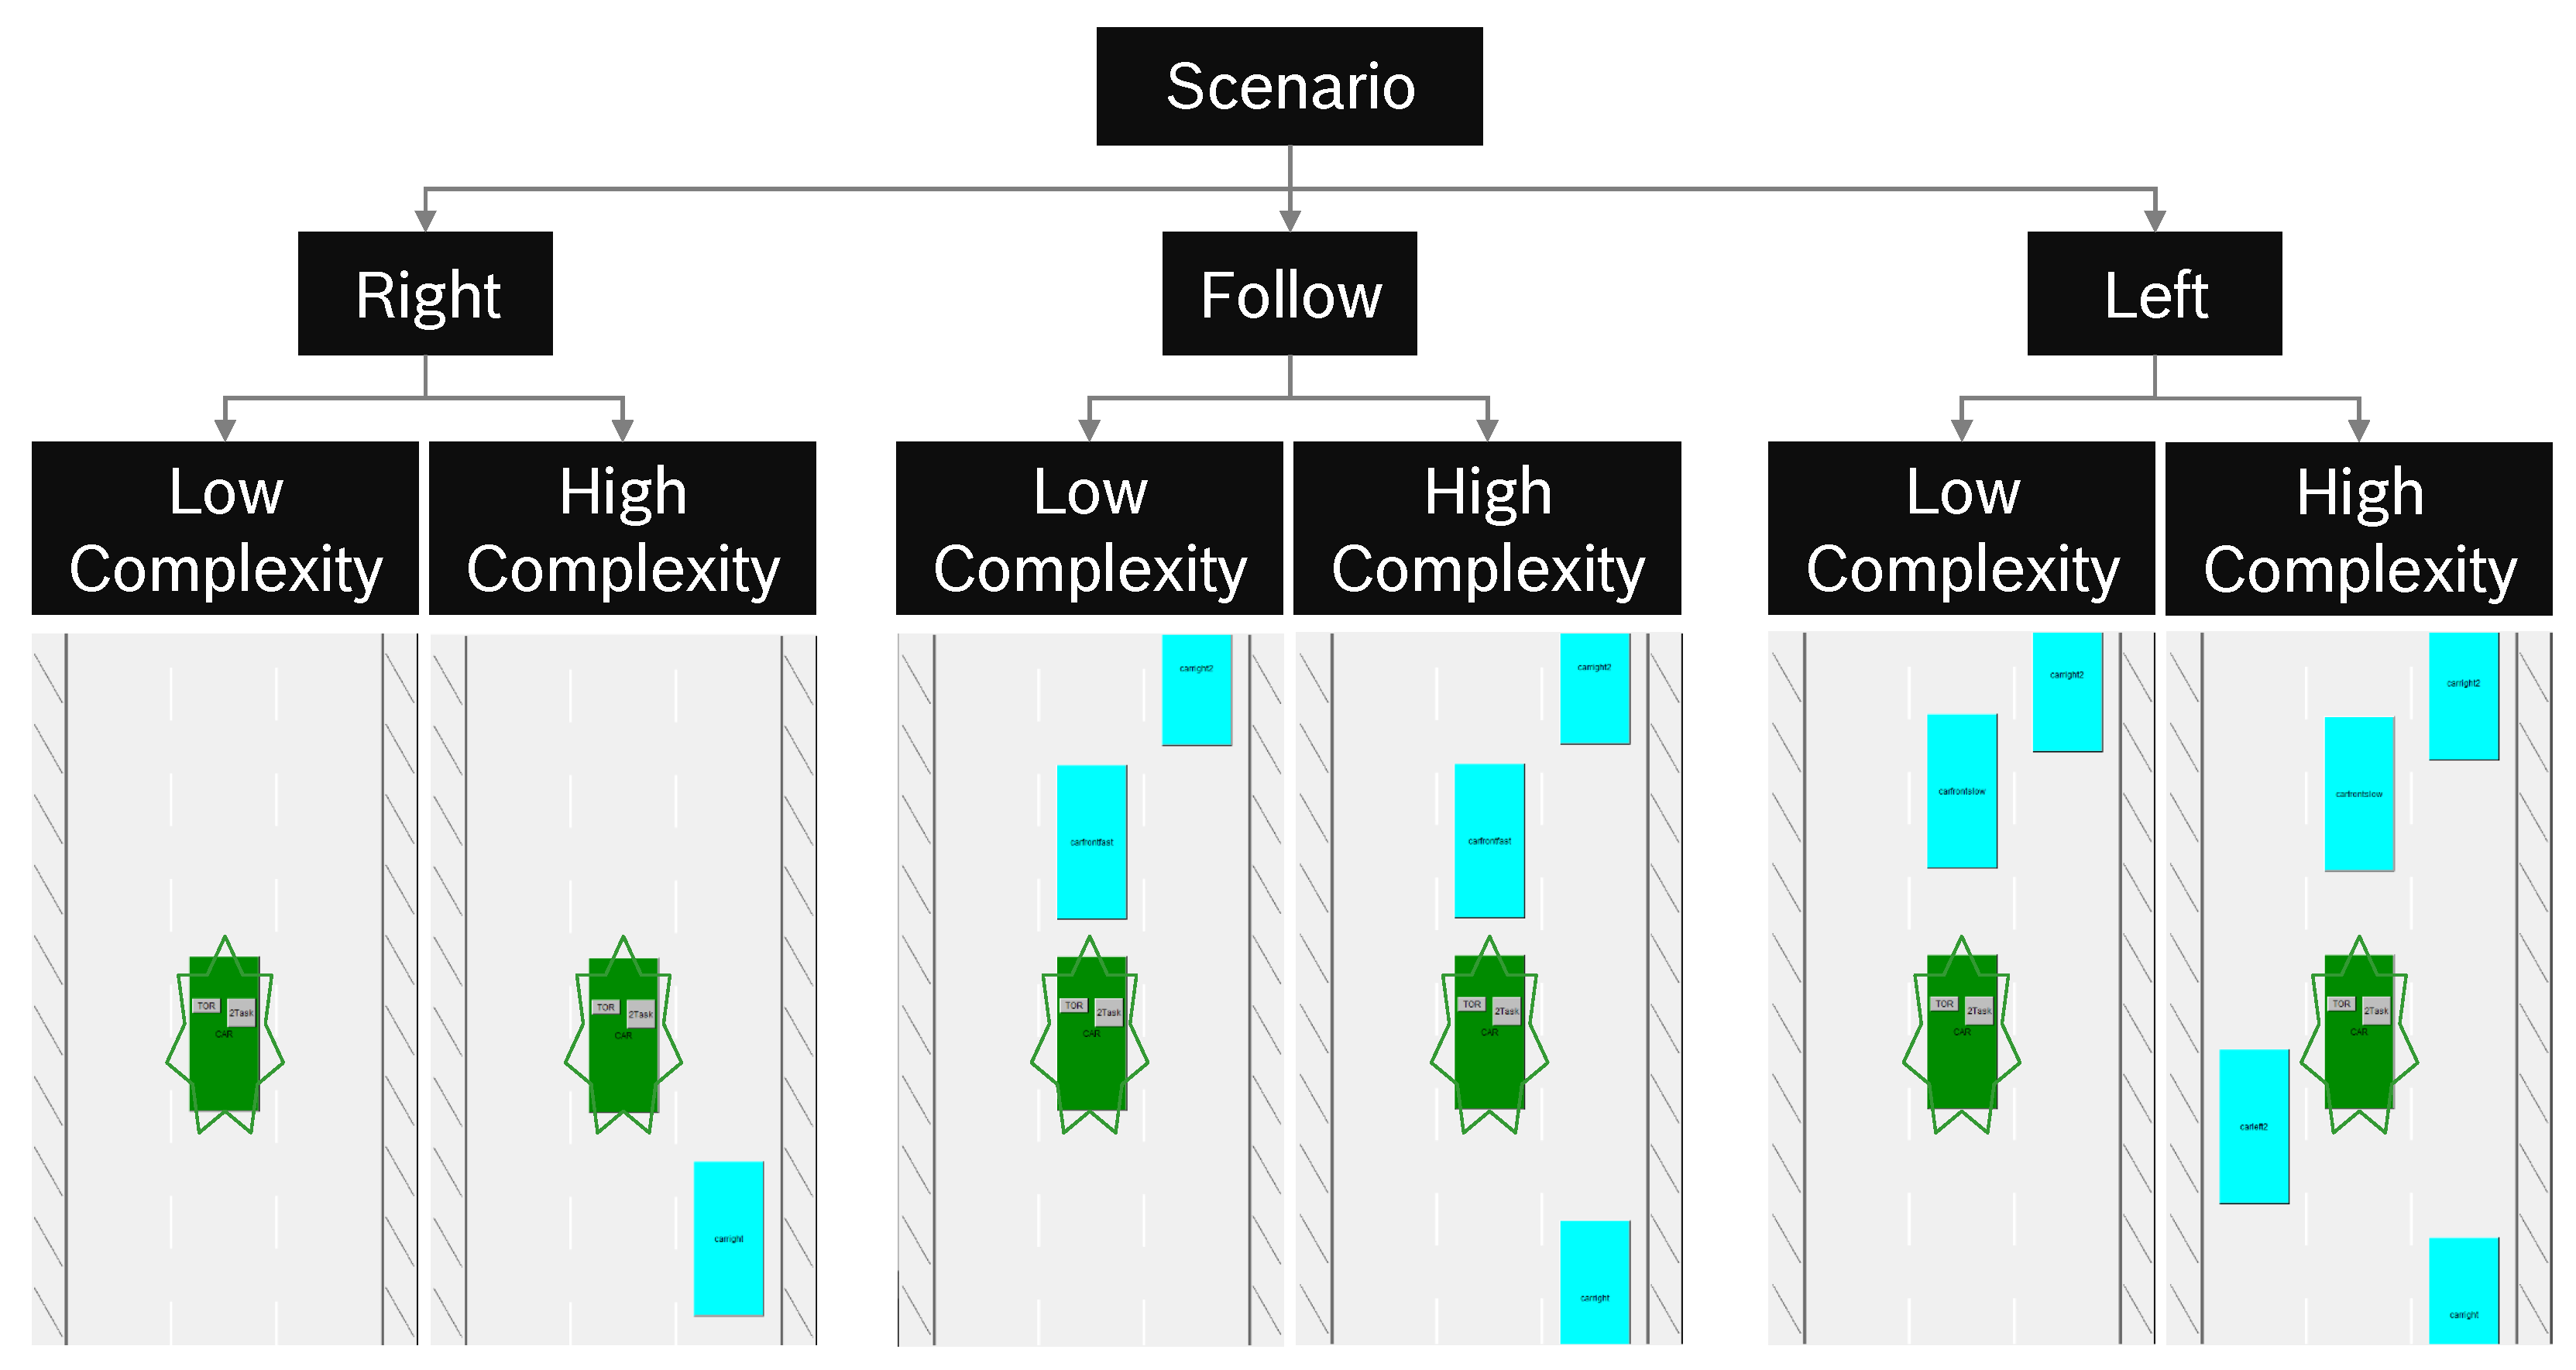
2.2. Scenarios
2.3. Cognitive Model
2.4. Visual Guidance
2.5. Situation Awareness Representation
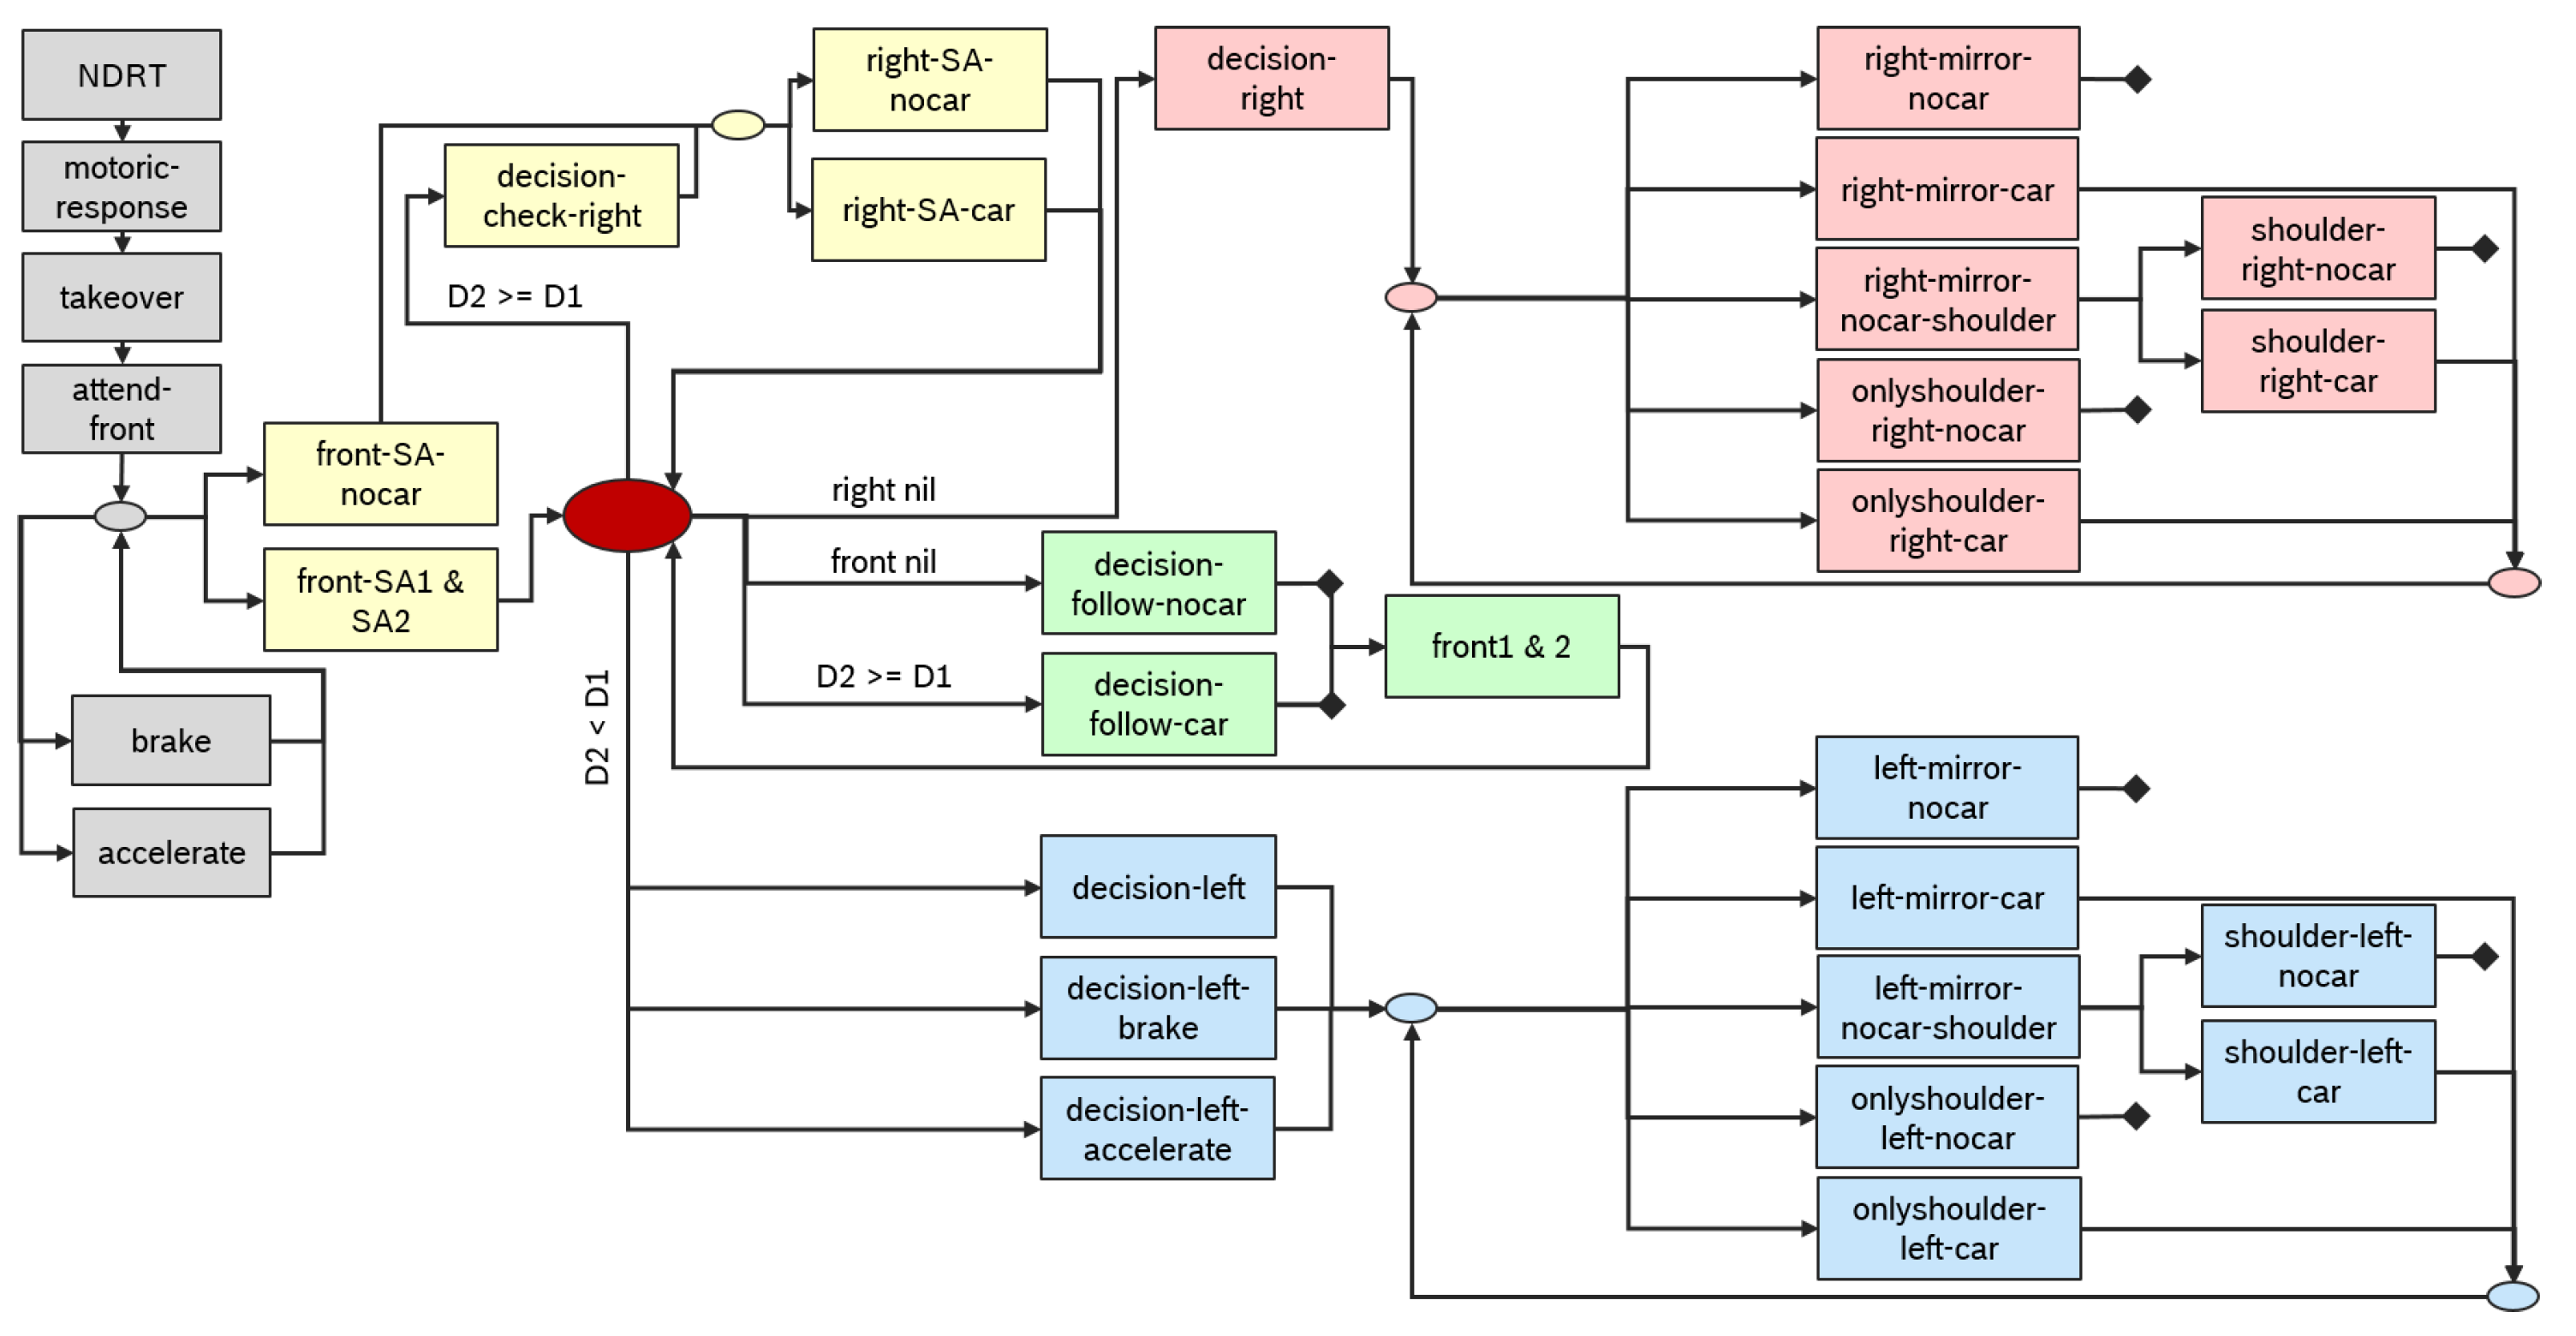
2.6. Decision Flow
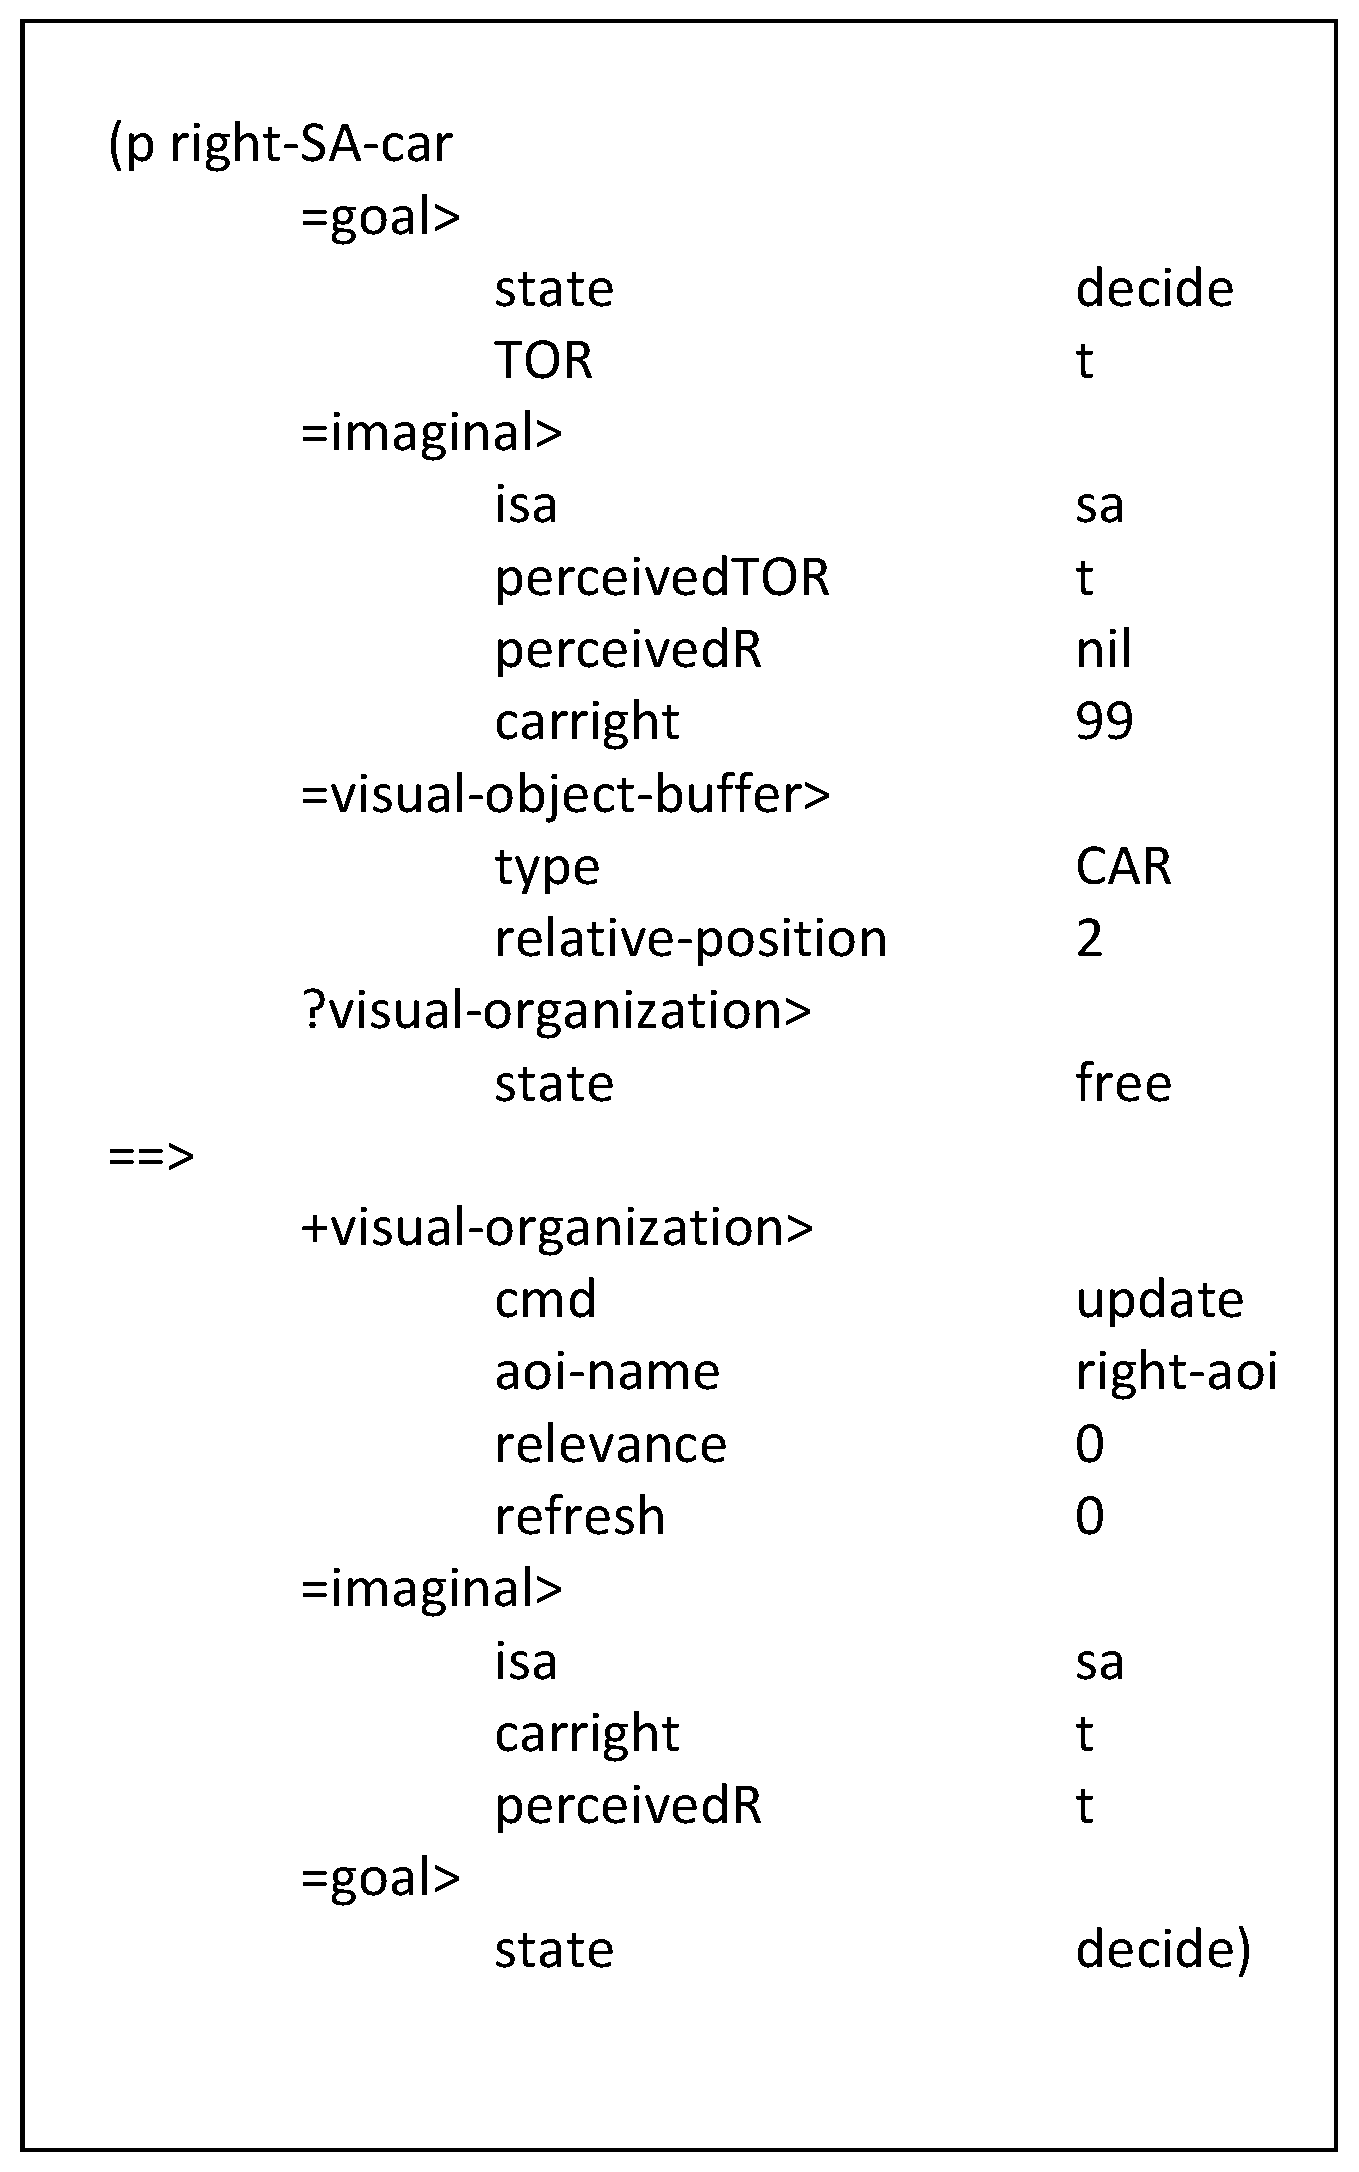
2.6.1. Maneuver Decision Lane-Change to the Right
2.6.2. Maneuver Decision Car Following
2.6.3. Maneuver Decision Lane-Change to the Left
2.7. Empirical Data
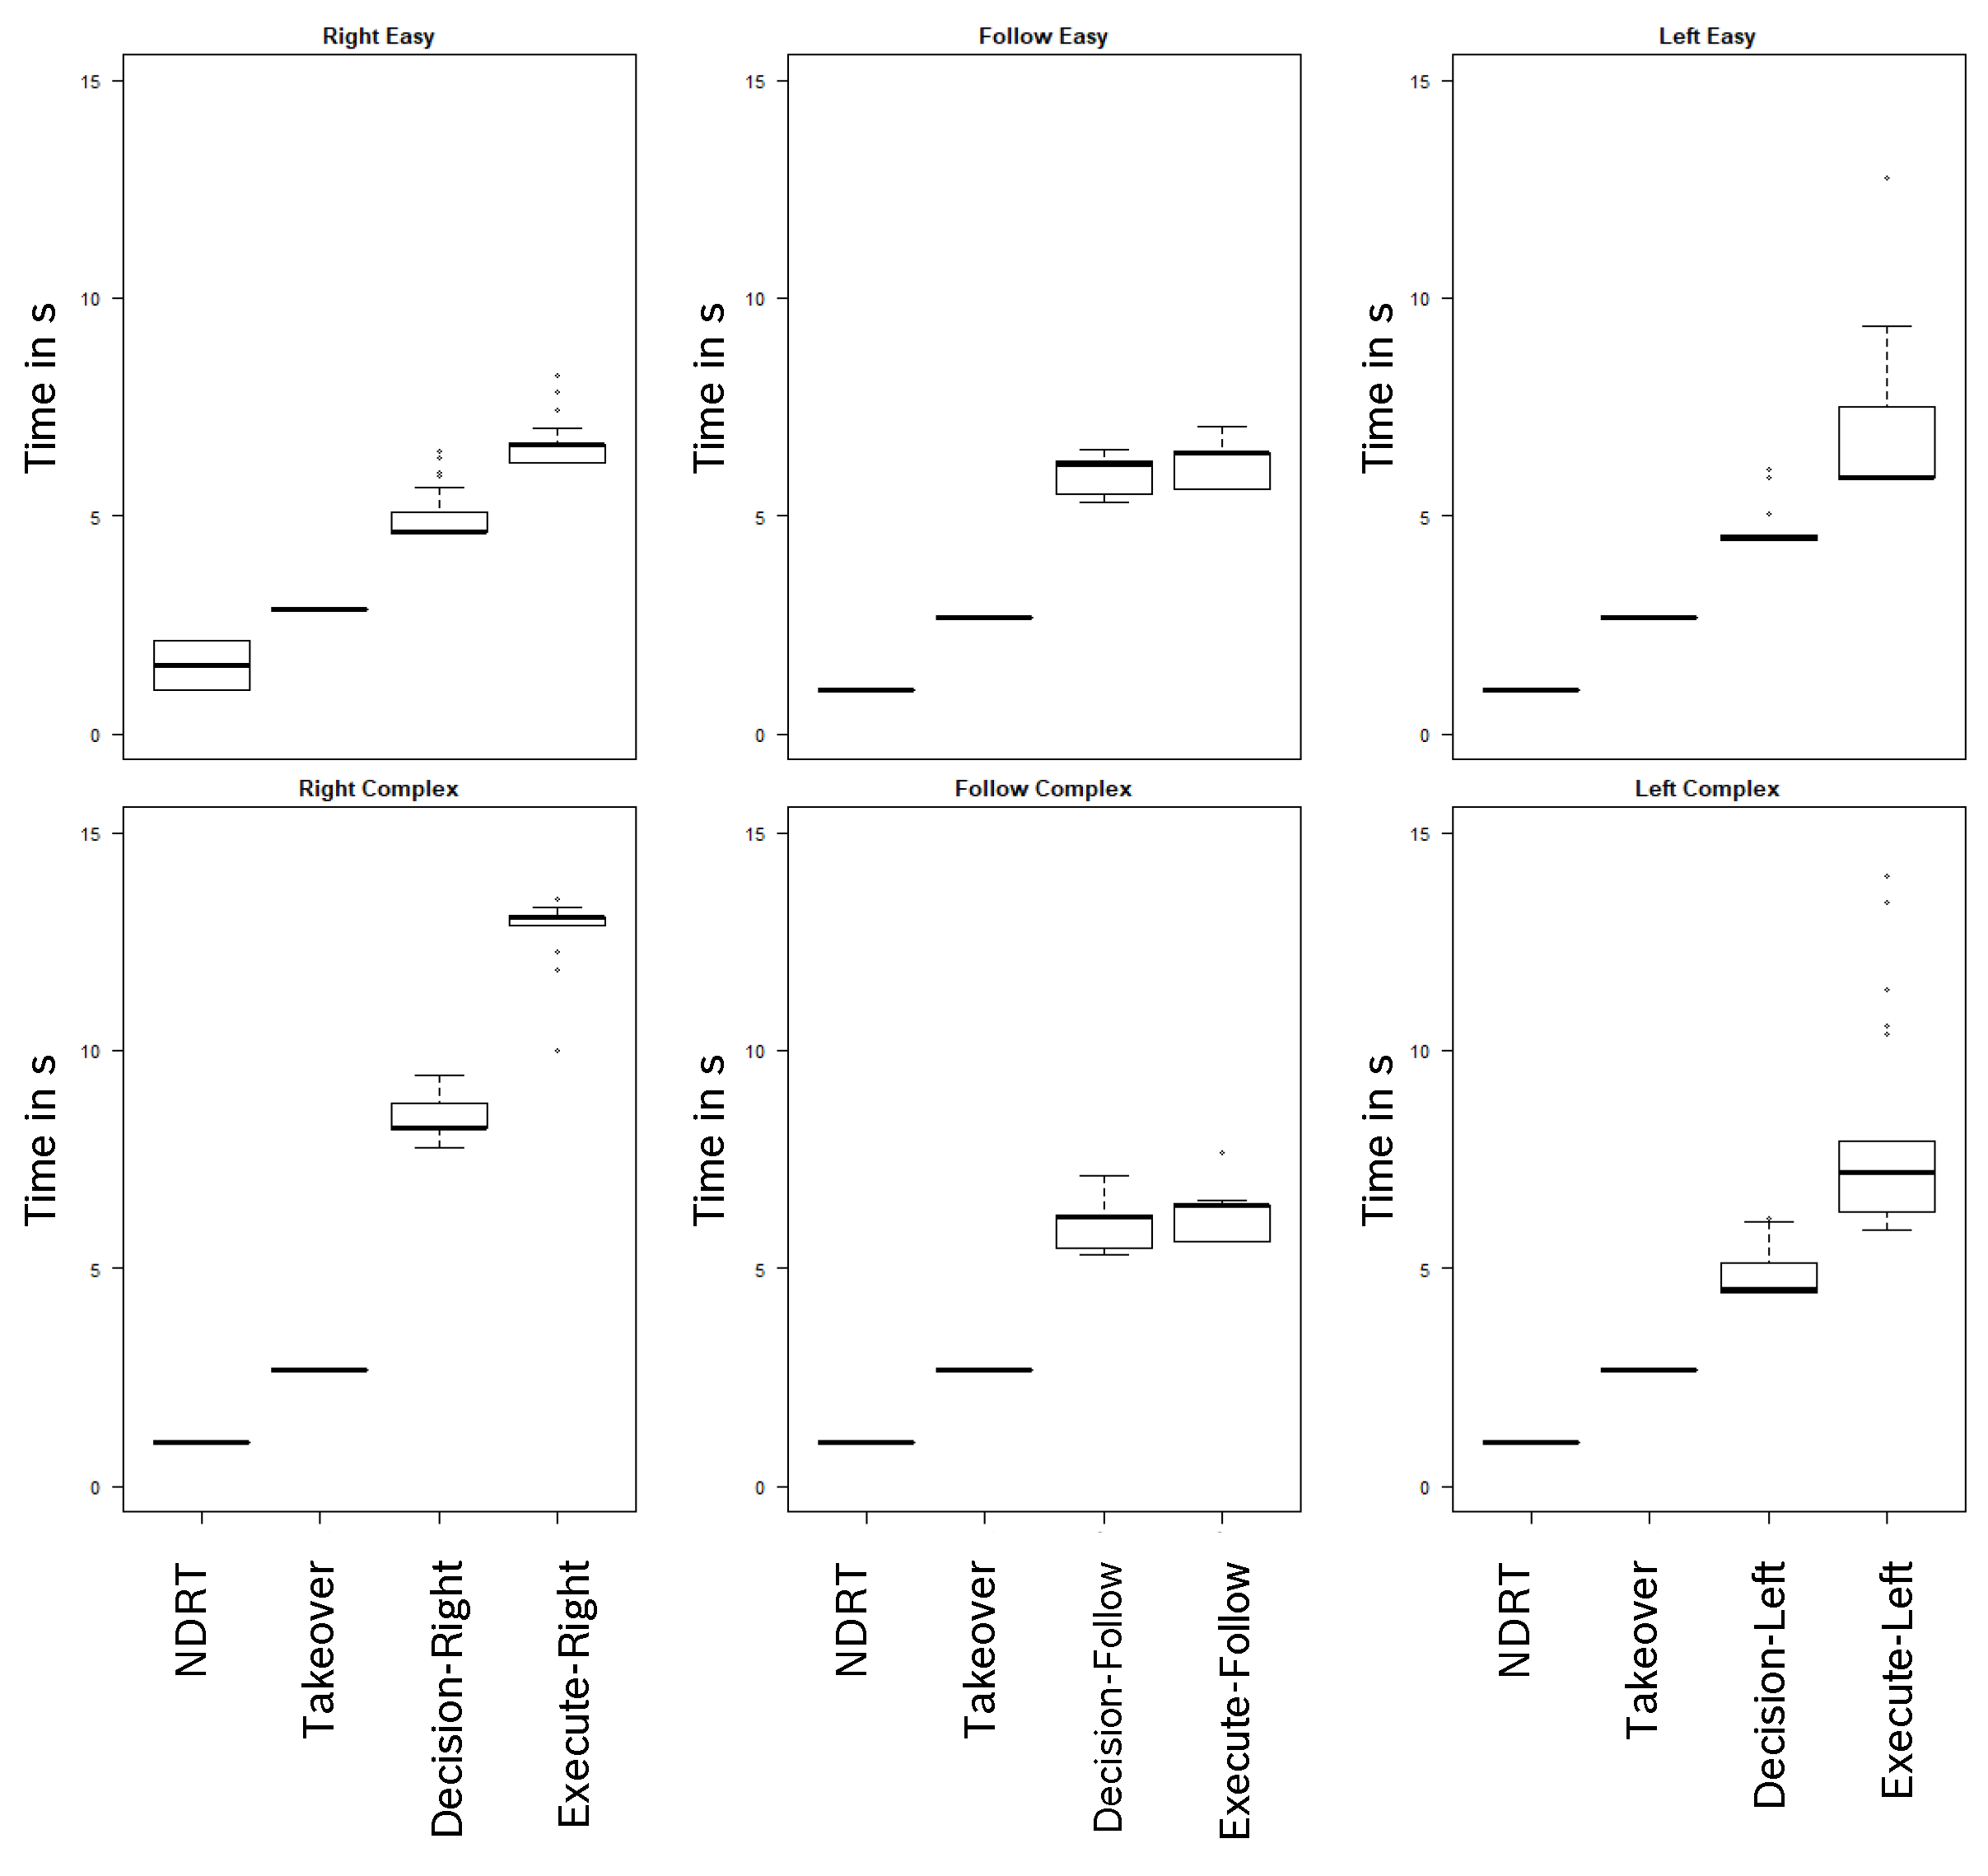
3. Results
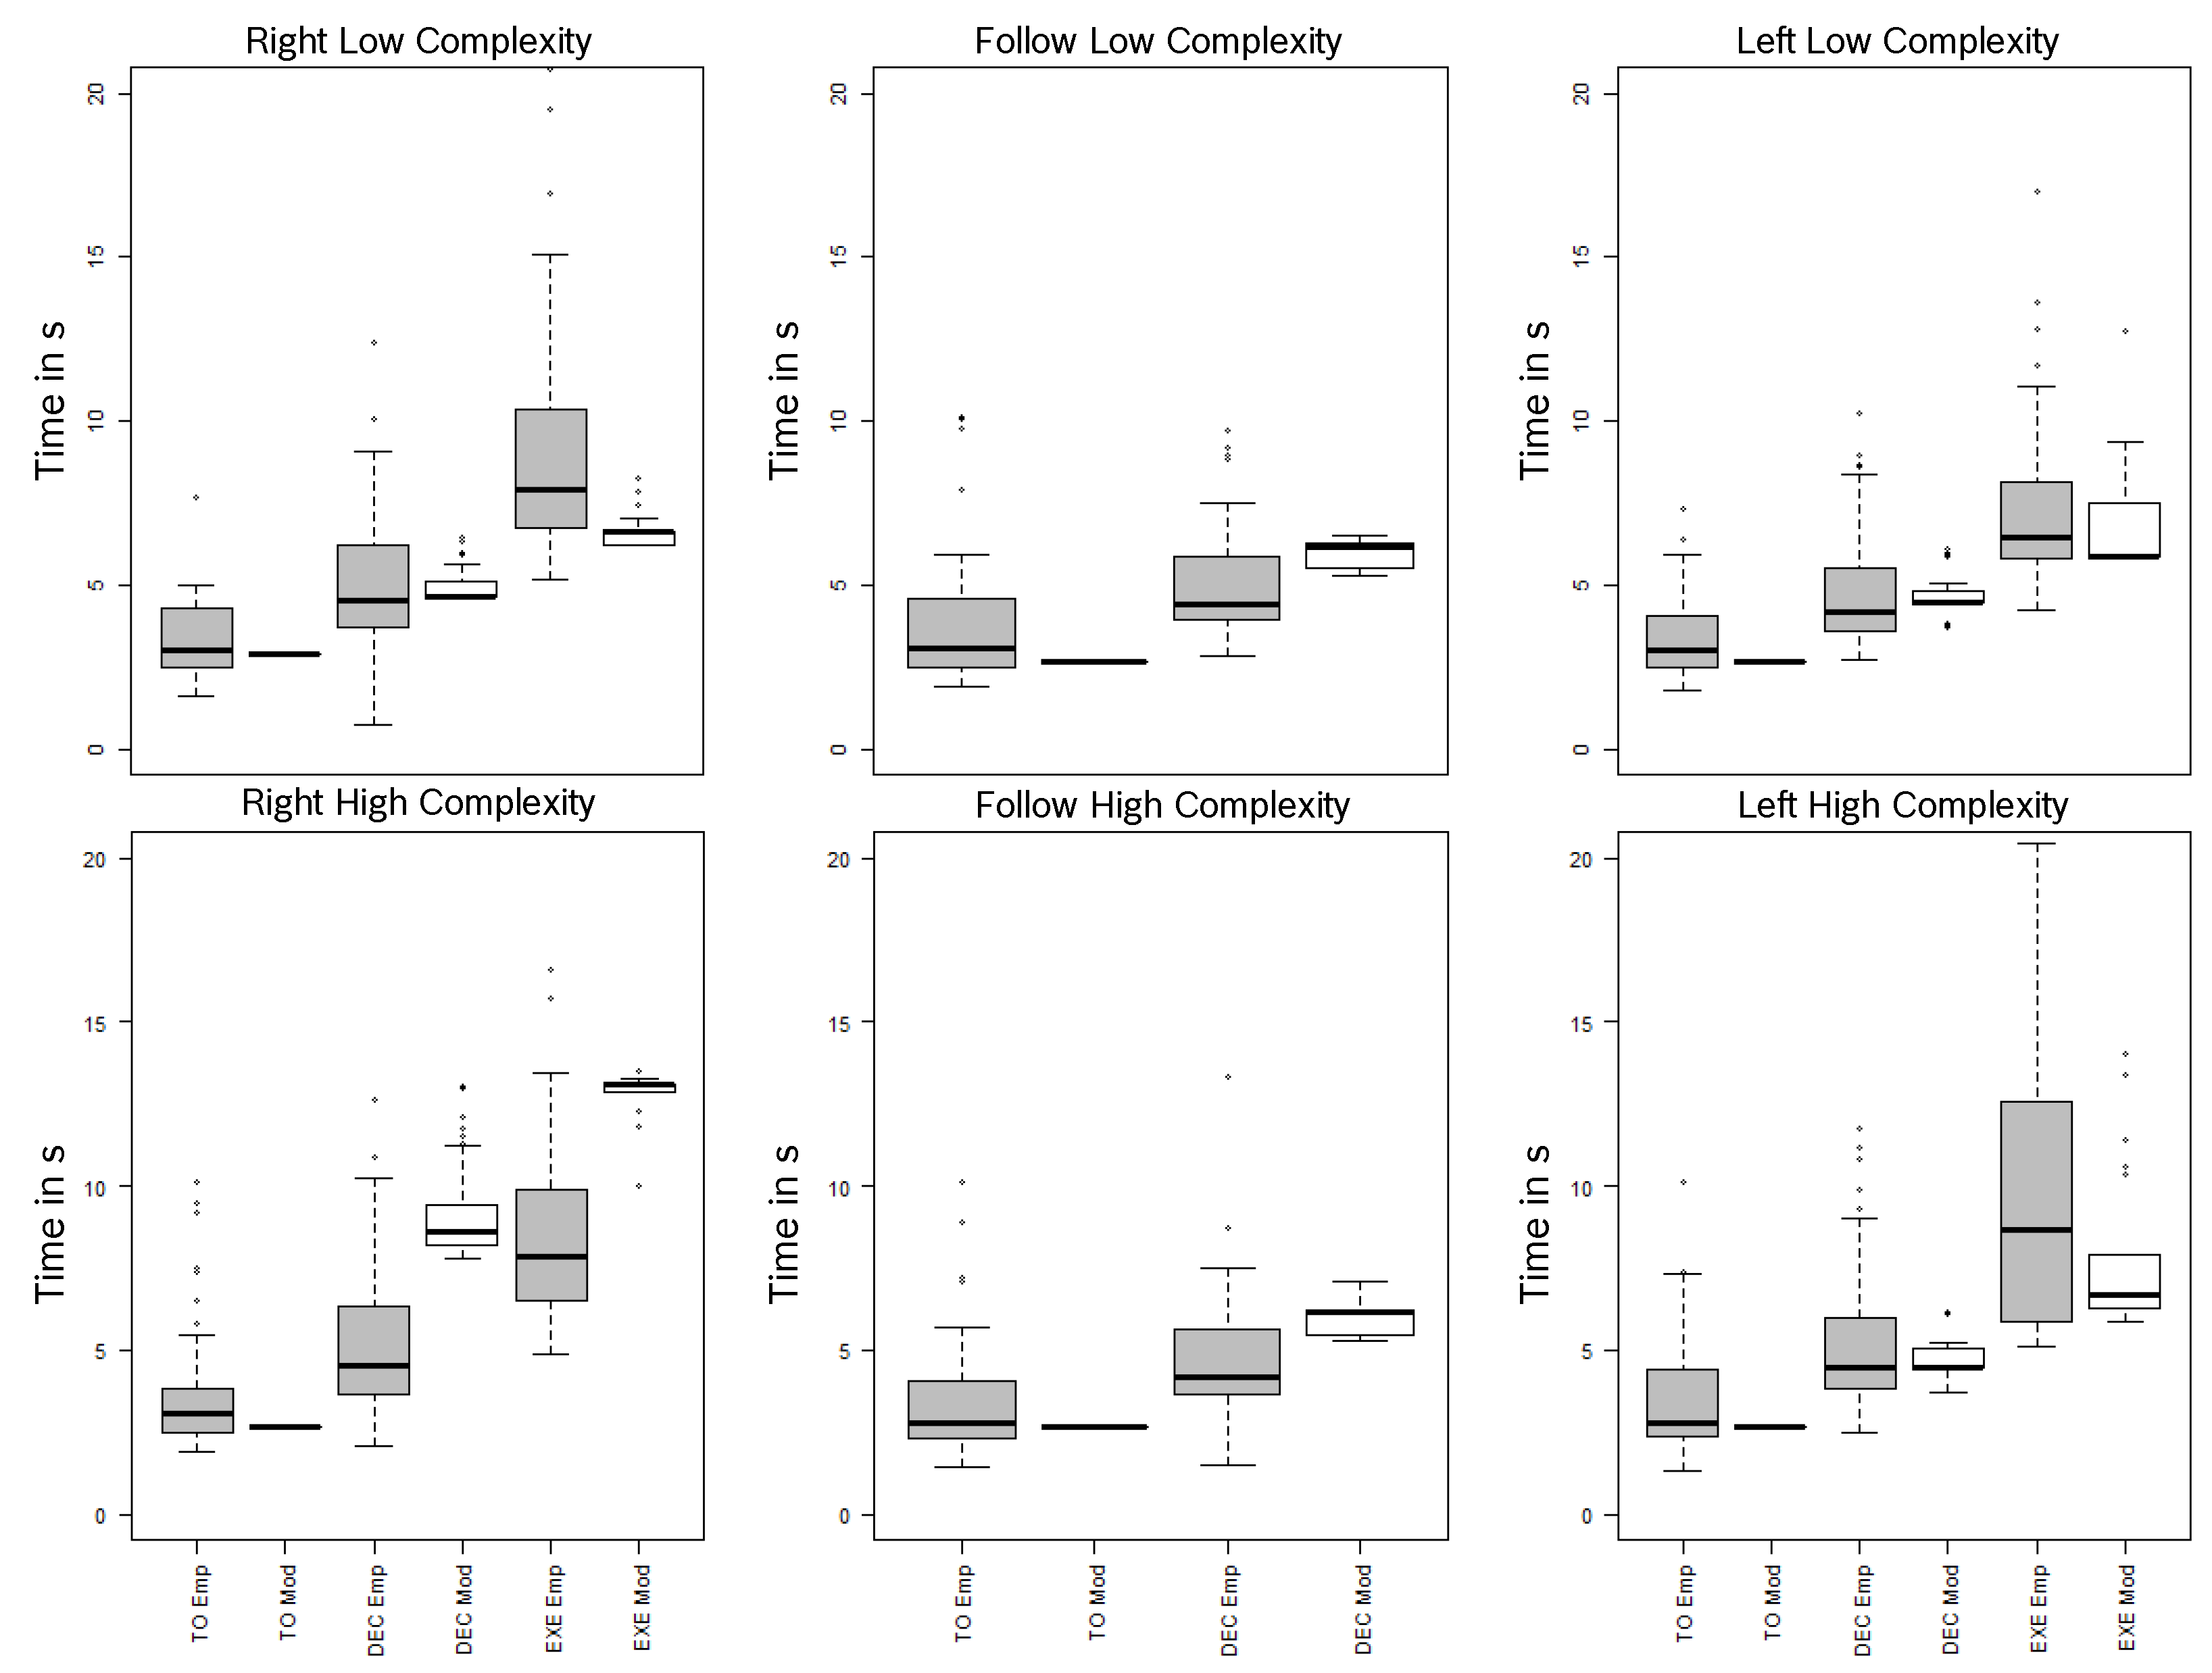
Comparison to Empirical Data
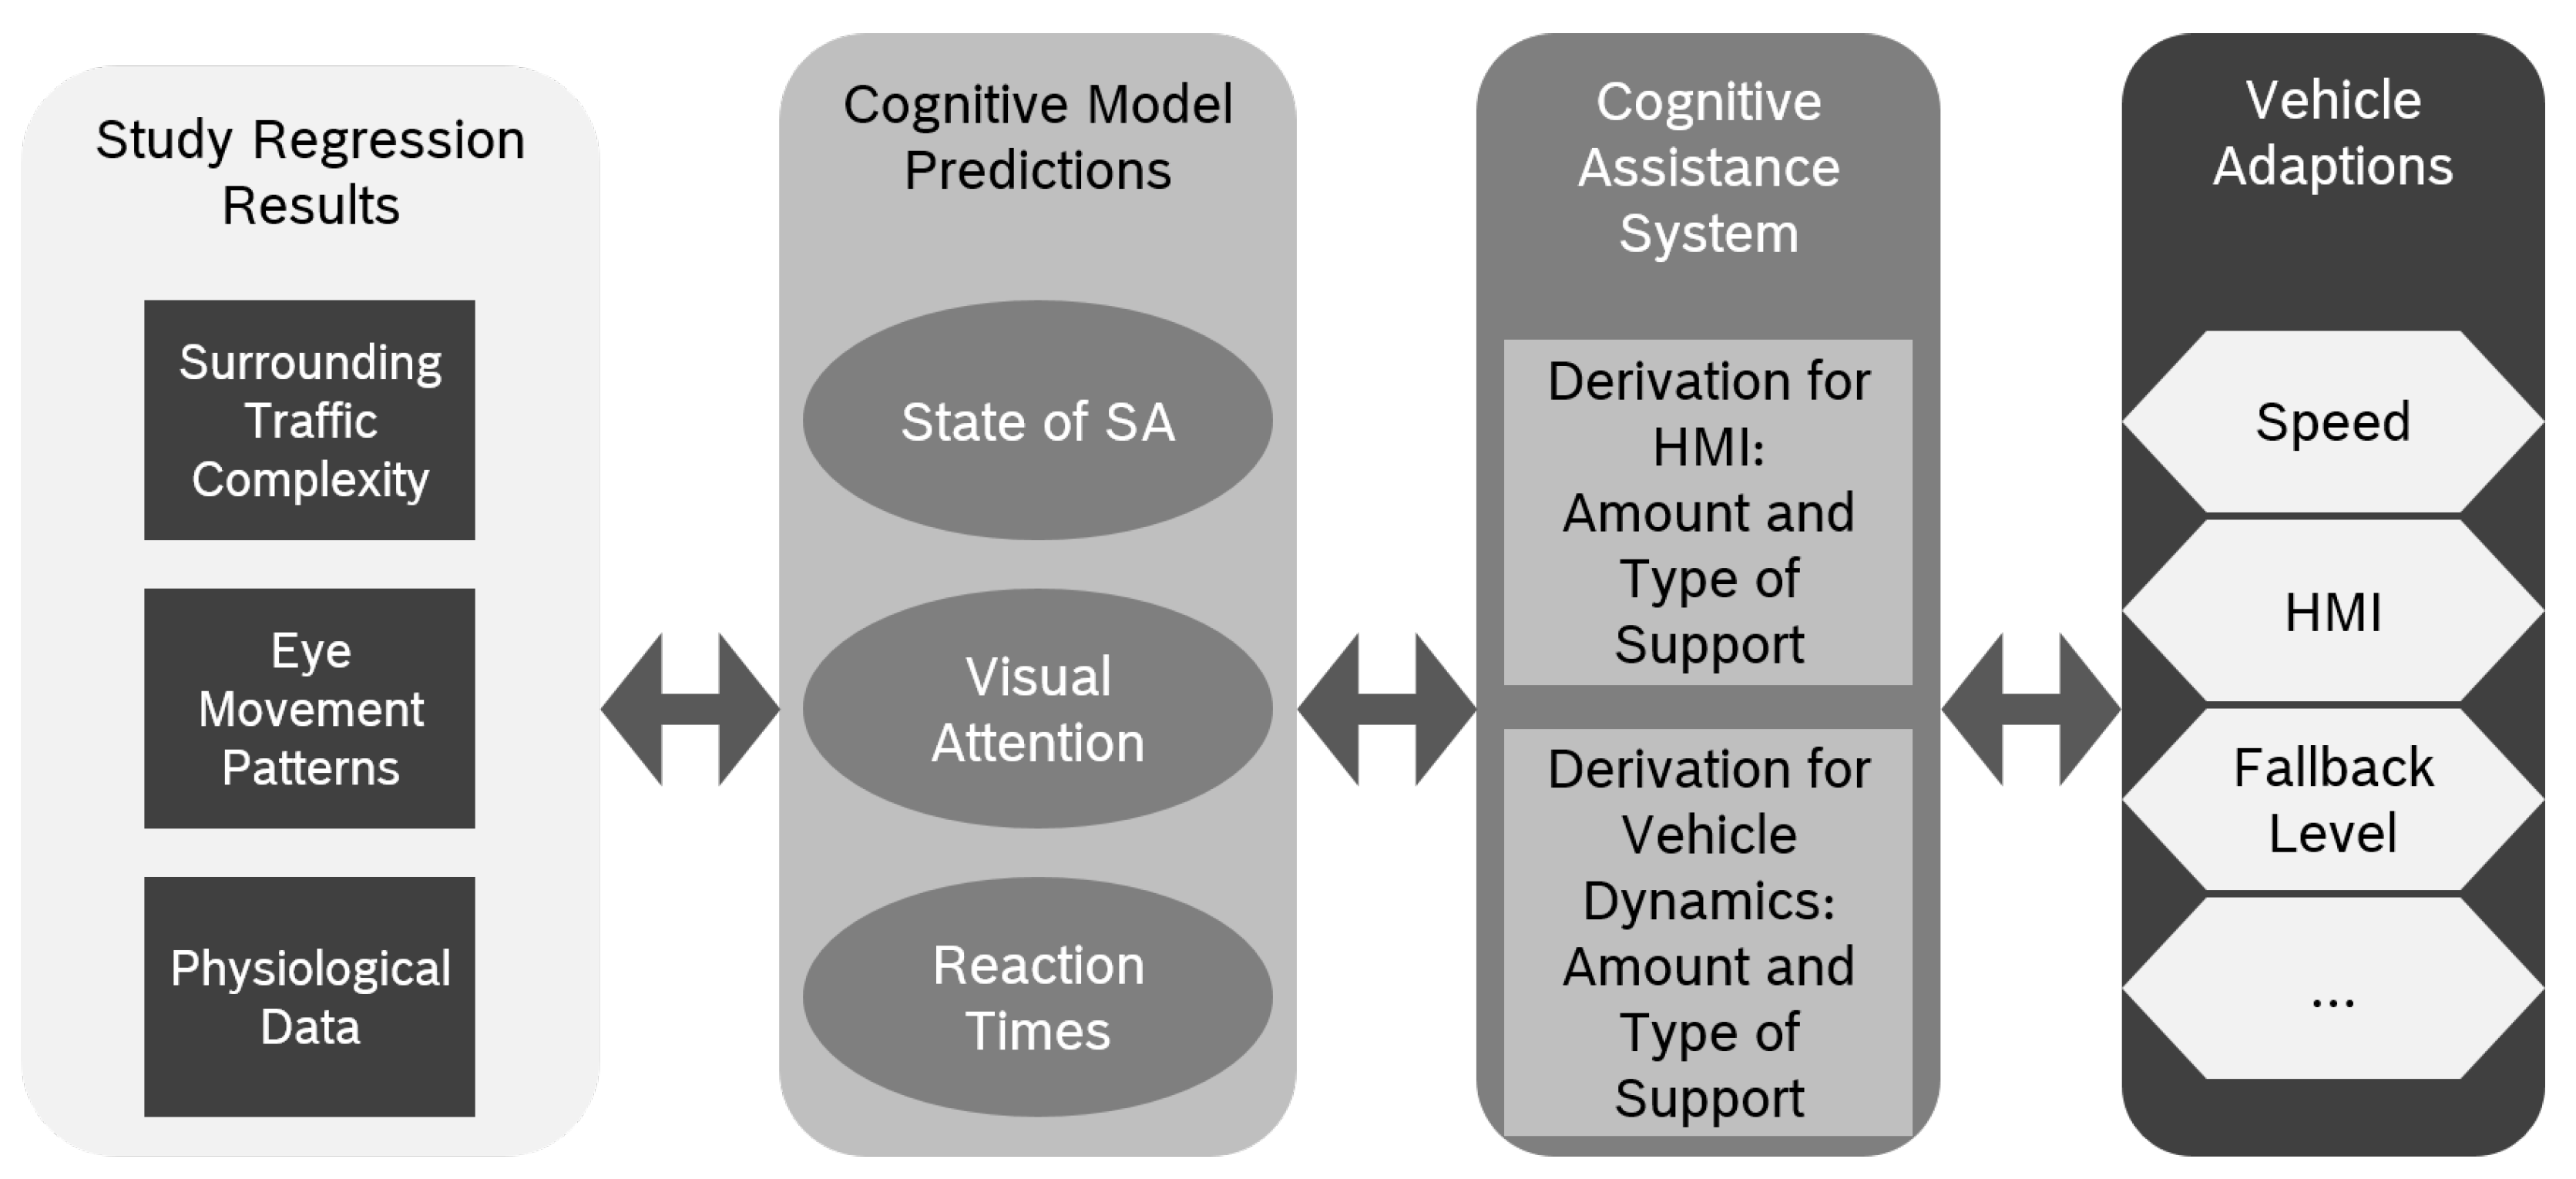
4. Discussion
5. Conclusions
Author Contributions
Funding
Institutional Review Board Statement
Informed Consent Statement
Data Availability Statement
Acknowledgments
Conflicts of Interest
References
- Sheridan, T.B. Human-robot interaction: Status and challenges. Hum. Factors 2016, 58, 525–532. [Google Scholar] [CrossRef] [PubMed]
- Louw, T.; Merat, N.; Jamson, A. Engaging with highly automated driving: To be or not to be in the loop? In Proceedings of the 8th International Driving Symposium on Human Factors in Driver Assessment, Training and Vehicle Design, Salt Lake City, UT, USA, 22–25 June 2015. [Google Scholar] [CrossRef]
- SAE-International. Surface vehicle recommended practice. Taxonomy and definitions for terms related to on-road motor vehicle automated driving systems. In Proceedings of the SAE International, Hong Kong, China, 4 May 2016. [Google Scholar]
- Kerschbaum, P.; Lorenz, L.; Bengler, K. A transforming steering wheel for highly automated cars. In Proceedings of the 2015 IEEE Intelligent Vehicles Symposium (IV), Seoul, Korea, 1–28 June 2015; pp. 1287–1292. [Google Scholar]
- Zeeb, K.; Buchner, A.; Schrauf, M. What determines the take-over time? An integrated model approach of driver take-over after automated driving. Accid. Anal. Prev. 2015, 78, 212–221. [Google Scholar] [CrossRef] [PubMed]
- Merat, N.; Seppelt, B.; Louw, T.; Engström, J.; Lee, J.D.; Johansson, E.; Green, C.A.; Katazaki, S.; Monk, C.; Itoh, M.; et al. The “Out-of-the-Loop” concept in automated driving: Proposed definition, measures and implications. Cogn. Technol. Work. 2019, 21, 87–98. [Google Scholar] [CrossRef]
- Bainbridge, L. Ironies of automation. In Analysis, Design and Evaluation of Man–Machine Systems; Elsevier: Amsterdam, The Netherlands, 1983; pp. 129–135. [Google Scholar]
- Braunagel, C.; Rosenstiel, W.; Kasneci, E. Ready for Take-Over? A New Driver Assistance System for an Automated Classification of Driver Take-Over Readiness. IEEE Intell. Transp. Syst. Mag. 2017, 9, 10–22. [Google Scholar] [CrossRef]
- Klimke, J.; Themann, P.; Klas, C.; Eckstein, L. Definition of an embedded driver model for driving behavior prediction within the DESERVE platform. In Proceedings of the 2014 International Conference on Embedded Computer Systems: Architectures, Modeling, and Simulation (SAMOS XIV), Samos, Greece, 14–17 July 2014; pp. 343–350. [Google Scholar] [CrossRef]
- Gold, C.; Happee, R.; Bengler, K. Modeling take-over performance in level 3 conditionally automated vehicles. Accid. Anal. Prev. 2018, 116, 3–13. [Google Scholar] [CrossRef]
- Naujoks, F.; Forster, Y.; Wiedemann, K.; Neukum, A. A human-machine interface for cooperative highly automated driving. In Advances in Human Aspects of Transportation; Springer: New York, NY, USA, 2017; pp. 585–595. [Google Scholar]
- Markkula, G.; Boer, E.; Romano, R.; Merat, N. Sustained sensorimotor control as intermittent decisions about prediction errors: Computational framework and application to ground vehicle steering. Biol. Cybern. 2018, 112, 181–207. [Google Scholar]
- Aasman, J.; Michon, J.A. Multitasking in driving. In Soar: A Cognitive Architecture in Perspective; Springer: New York, NY, USA, 1992; pp. 169–198. [Google Scholar]
- Cao, J.; Wang, H. Vision navigation for driver cognitive model in act-r architecture. In Proceedings of the 9th IEEE International Conference on Cognitive Informatics (ICCI’10), Beijing, China, 7–9 July 2010; pp. 946–951. [Google Scholar] [CrossRef]
- Salvucci, D. Modeling driver behavior in a cognitive architecture. Hum. Factors 2006, 48, 362–380. [Google Scholar] [CrossRef]
- Anderson, J.; Bothell, D.; Byrne, M.D.; Douglass, S.; Lebiere, C.; Qin, Y. An integrated theory of the mind. Psychol. Rev. 2004, 111, 1036. [Google Scholar] [CrossRef]
- Scharfe, M.S.L.; Russwinkel, N. Towards a cognitive model of the takeover in highly automated driving for the improvement of human machine interaction. In Proceedings of the International Conference on Cognitive Modelling, Montreal, QC, Canada, 30 July 2019; pp. 210–216. [Google Scholar]
- Morita, J.; Miwa, K.; Maehigashi, A.; Terai, H.; Kojima, K.; Ritter, F. Cognitive Modeling of Automation Adaptation in a Time Critical Task. Front. Psychol. 2020, 11, 2149. [Google Scholar] [CrossRef]
- Klaproth, O.W.; Halbrügge, M.; Krol, L.R.; Vernaleken, C.; Zander, T.O.; Russwinkel, N. A Neuroadaptive Cognitive Model for Dealing with Uncertainty in Tracing Pilots’ Cognitive State. Top. Cogn. Sci. 2020, 12, 1012–1029. [Google Scholar] [CrossRef]
- Endsley, M.R. Toward a theory of situation awareness in dynamic systems. Hum. Factors 1995, 37, 32–64. [Google Scholar] [CrossRef]
- Wickens, C. Noticing Events in the Visual Workplace: The SEEV and NSEEV Models; Cambridge University Press: Cambridge, UK, 2015; pp. 749–768. [Google Scholar] [CrossRef]
- Wickens, C.; McCarley, J.; Steelman-Allen, K. NT-SEEV: A model of attention capture and noticing on the flight deck. In Proceedings of the Human Factors and Ergonomics Society Annual Meeting; SAGE Publications: Los Angeles, CA, USA, 2009; Volume 53, pp. 769–773. [Google Scholar]
- Horrey, W.J.; Wickens, C.D.; Consalus, K.P. Modeling drivers’ visual attention allocation while interacting with in-vehicle technologies. J. Exp. Psychol. Appl. 2006, 12, 67. [Google Scholar] [CrossRef] [PubMed]
- Anderson, J.; Matessa, M.; Lebiere, C. act-r: A theory of higher level cognition and its relation to visual attention. Hum.-Comput. Interact. 1997, 12, 439–462. [Google Scholar] [CrossRef]
- Ritter, F.; Tehranchi, F.; Oury, J. ACT-R: A cognitive architecture for modeling cognition. Wiley Interdiscip. Rev. Cogn. Sci. 2019, 10, e1488. [Google Scholar] [CrossRef]
- Anderson, J. How Can the Human Mind Occur in the Physical Universe? Oxford University Press: Oxford, UK, 2007. [Google Scholar] [CrossRef]
- Wiese, S.; Lotz, A.; Russwinkel, N. SEEV-VM: ACT-R visual module based on SEEV theory. In Proceedings of the 17th International Conference on Cognitive Modeling, Montral, QC, Canada, 20 July 2019; pp. 301–307. [Google Scholar]
- Rauschke, J. Development, Implementation and Validation of a Simulation Environment for the Cognitive Modelling of the Driver-Vehicle-Interaction in Highly Automated Driving. Practical Training Thesis, Robert Bosch GmbH and Cooperative State University Baden-Württemberg, Stuttgart, Germany, 2019. [Google Scholar]
- Fu, W.T.; Bothell, D.; Douglass, S.; Haimson, C.; Sohn, M.H.; Anderson, J. Toward a real-time model-based training system. Interact. Comput. 2006, 18, 1215–1241. [Google Scholar] [CrossRef]
- Albers, D.; Radlmayr, J.; Loew, A.; Hergeth, S.; Naujoks, F.; Keinath, A.; Bengler, K. Usability evaluation—Advances in experimental design in the context of automated driving human–machine interfaces. Information 2020, 11, 240. [Google Scholar] [CrossRef]
- Scharfe-Scherf, M.S.L.; Russwinkel, N. Familiarity and Complexity during a Takeover in Highly Automated Driving. Int. J. Intell. Transp. Syst. Res. 2021, 19, 525–538. [Google Scholar] [CrossRef]
- Scharfe, M.S.L.; Zeeb, K.; Russwinkel, N. The Impact of Situational Complexity and Familiarity on Takeover Quality in Uncritical Highly Automated Driving Scenarios. Information 2020, 11, 115. [Google Scholar] [CrossRef]
- Ritter, F.; Schoelles, M.; Quigley, K.; Klein, L. Determining the number of model runs: Treating cognitive models as theories by not sampling their behavior. Hum. Loop Simul. Methods Pract. 2011, 11, 97–116. [Google Scholar]
- Li, G.; Li, S.E.; Jia, L.; Wang, W.; Cheng, B.; Chen, F. Driving maneuvers analysis using naturalistic highway driving data. In Proceedings of the 2015 IEEE 18th International Conference on Intelligent Transportation Systems, Gran Canaria, Spain, 15–18 September 2015; pp. 1761–1766. [Google Scholar]
- Lee, J.D.; McGehee, D.V.; Brown, T.L.; Reyes, M.L. Collision warning timing, driver distraction, and driver response to imminent rear-end collisions in a high-fidelity driving simulator. Hum. Factors 2002, 44, 314–334. [Google Scholar] [CrossRef]
- Daily, L.Z.; Lovett, M.C.; Reder, L.M. Modeling individual differences in working memory performance: A source activation account. Cogn. Sci. 2001, 25, 315–353. [Google Scholar] [CrossRef] [PubMed]
- Ritter, F.; Bibby, P.A. Modeling how, when, and what is learned in a simple fault-finding task. Cogn. Sci. 2008, 32, 862–892. [Google Scholar] [CrossRef] [PubMed]


| Production | Events | Predicted Time | |||
|---|---|---|---|---|---|
| Min | Mean | Max | SD | ||
| Right Low Complexity | |||||
| ACCELERATE | 74 | 3.07 s | 3.49 s | 4.86 s | 0.51 |
| BRAKE | 77 | 3.07 s | 3.4 s | 34.86 s | 0.37 |
| FRONT-SA-NOCARFRONT | 60 | 3.36 s | 3.62 s | 4.98 s | 0.44 |
| RIGHT-SA-NOCAR | 60 | 4.53 s | 4.83 s | 6.43 s | 0.49 |
| DECISION-RIGHT | 60 | 4.58 s | 4.92 s | 6.48 s | 0.61 |
| RIGHT-MIRROR-NOCAR | 19 | 6.16 s | 6.38 s | 6.97 s | 0.31 |
| RIGHT-MIRROR-NOCAR-SHOULDER | 19 | 6.16 s | 6.52 s | 7.78 s | 0.55 |
| ONLYSHOULDER-RIGHT-NOCAR | 22 | 6.16 s | 6.46 s | 7.78 s | 0.44 |
| SHOULDER-RIGHT-NOCAR | 19 | 6.57 s | 6.92 s | 8.19 s | 0.56 |
| EXECUTE-RIGHT | 60 | 6.21 s | 6.63 s | 8.24 s | 0.5 |
| Right High Complexity | |||||
| ACCELERATE | 154 | 2.87 s | 3.64 s | 7.75 s | 0.88 |
| BRAKE | 146 | 2.87 s | 3.58 s | 6.98 s | 0.78 |
| FRONT-SA-NOCARFRONT | 1 | 7.8 s | 7.8 s | 7.8 s | - |
| FRONT-SA-NOCARFRONT-PERCEIVED | 59 | 3.42 s | 3.92 s | 6.27 s | 0.62 |
| RIGHT-SA-NOCAR | 46 | 7.73 s | 8.41 s | 9.39 s | 0.43 |
| DECISION-RIGHT | 46 | 7.78 s | 8.49 s | 9.44 s | 0.44 |
| RIGHT-MIRROR-NOCAR | 16 | 9.95 s | 12.68 s | 13.02 s | 0.75 |
| RIGHT-MIRROR-NOCAR-SHOULDER | 16 | 11.38 s | 12.87 s | 13.23 s | 0.43 |
| ONLYSHOULDER-RIGHT-NOCAR | 14 | 9.95 s | 12.73 s | 13.23 s | 0.82 |
| SHOULDER-RIGHT-NOCAR | 16 | 11.79 s | 13.1 s | 13.43 s | 0.39 |
| EXECUTE-RIGHT | 46 | 10 s | 12.89 s | 13.48 s | 0.69 |
| decision-follow-nocar | 14 | 10.66 s | 11.55 s | 13.02 s | 0.71 |
| execute-follow | 14 | 10.71 s | 11.6 s | 13.06 s | 0.71 |
| Production | Events | Predicted Time | |||
|---|---|---|---|---|---|
| Min | Mean | Max | SD | ||
| Follow Low Complexity | |||||
| ACCELERATE | 84 | 2.87 s | 3.11 s | 3.37 s | 0.22 |
| BRAKE | 96 | 2.87 s | 3.12 s | 3.37 s | 0.2 |
| FRONT-SA1 | 60 | 3.42 s | 3.44 s | 3.47 s | 0.03 |
| FRONT-SA2 | 60 | 4.81 s | 5.28 s | 5.62 s | 0.4 |
| DECISION-CHECK-RIGHT | 376 | 4.86 s | 5.55 s | 6.37 s | 0.42 |
| RIGHT-SA-CAR | 59 | 5.26 s | 5.84 s | 6.42 s | 0.42 |
| DECISION-FOLLOW-CAR | 59 | 5.31 s | 5.94 s | 6.52 s | 0.43 |
| FRONT1 | 59 | 5.62 s | 6.13 s | 7.04 s | 0.42 |
| decision-right | 1 | 5.76 s | 5.76 s | 5.76 s | - |
| execute-right | 1 | 6.49 s | 6.49 s | 6.49 s | - |
| Follow High Complexity | |||||
| ACCELERATE | 87 | 2.87 s | 3.13 s | 3.37 s | 0.2 |
| BRAKE | 93 | 2.87 s | 3.01 s | 3.37 s | 0.21 |
| FRONT-SA1 | 60 | 3.42 s | 3.44 s | 3.47 s | 0.02 |
| FRONT-SA2 | 60 | 4.82 s | 5.3 s | 5.62 s | 0.4 |
| DECISION-CHECK-RIGHT | 388 | 4.86 s | 5.57 s | 7.02s | 0.45 |
| RIGHT-SA-CAR | 59 | 5.26 s | 5.86 s | 67.07 s | 0.43 |
| DECISION-FOLLOW-CAR | 59 | 5.31 s | 5.95 s | 7.12 s | 0.43 |
| FRONT1 | 59 | 5.62 s | 6.16 s | 7.65 s | 0.44 |
| decision-right | 1 | 5.81 s | 5.81 s | 5.81 s | - |
| execute-right | 1 | 7.51 s | 7.51 s | 7.51 s | - |
| Production | Events | Predicted Time | |||
|---|---|---|---|---|---|
| Min | Mean | Max | SD | ||
| Left Low Complexity | |||||
| ACCELERATE | 105 | 2.87 s | 3.18 s | 3.65 s | 0.23 |
| BRAKE | 93 | 2.87 s | 3.15 s | 3.65 s | 0.26 |
| FRONT-SA1 | 46 | 3.6 s | 3.64 s | 3.7 s | 0.05 |
| FRONT-SA2 | 46 | 4.41 s | 4.83 s | 5.83 s | 0.64 |
| DECISION-LEFT | 14 | 4.46 s | 4.74 s | 6.08 s | 0.55 |
| DECISION-LEFT-ACCELERATE | 12 | 4.46 s | 4.96 s | 5.98 s | 0.7 |
| DECISION-LEFT-BRAKE | 20 | 4.46 s | 5 s | 5.98 s | 0.69 |
| LEFT-MIRROR-NOCAR | 17 | 5.84 s | 6.73 s | 9.31 s | 1.37 |
| LEFT-MIRROR-NOCAR-SHOULDER | 12 | 5.84 s | 7.1 s | 9.31 s | 1.49 |
| ONLYSHOULDER-LEFT-NOCAR | 17 | 5.84 s | 6.34 s | 9.31 s | 1.18 |
| SHOULDER-LEFT-NOCAR | 12 | 6.66 s | 8.88 s | 12.7 s | 2.38 |
| EXECUTE-LEFT | 46 | 5.89 s | 7.2 s | 12.75 s | 1.91 |
| decision right | 14 | 3.7 s | 3.71 s | 3.85 s | 0.04 |
| execute right | 14 | 5.07 s | 5.14 s | 5.28 s | 0.1 |
| Left High Complexity | |||||
| ACCELERATE | 94 | 2.87 s | 3.15 s | 3.65 s | 0.24 |
| BRAKE | 103 | 2.87 s | 3.17 s | 3.65 s | 0.25 |
| FRONT-SA1 | 48 | 3.6 s | 3.64 s | 3.7 s | 0.04 |
| FRONT-SA2 | 48 | 4.41 s | 4.79 s | 6.03 s | 0.61 |
| DECISION-LEFT | 16 | 4.46 s | 4.86 s | 6.13 s | 0.66 |
| DECISION-LEFT-ACCELERATE | 15 | 4.46 s | 4.72 s | 6.13 s | 0.47 |
| DECISION-LEFT-BRAKE | 17 | 4.46 s | 5 s | 6.18 s | 0.68 |
| LEFT-MIRROR-CAR | 21 | 5.22 s | 5.65 s | 8.48 s | 0.98 |
| ONLYSHOULDER-LEFT-CAR | 23 | 5.22 s | 5.65 s | 8.48 s | 0.94 |
| LEFT-MIRROR-NOCAR | 23 | 5.84 s | 6.95 s | 13.36 s | 1.78 |
| LEFT-MIRROR-NOCAR-SHOULDER | 19 | 5.84 s | 7.6 s | 13.36 s | 2.37 |
| ONLYSHOULDER-LEFT-NOCAR | 9 | 5.84 s | 7.35 s | 13.36 s | 2.38 |
| SHOULDER-LEFT-NOCAR | 16 | 6.65 s | 8.74 s | 13.97 s | 2.36 |
| EXECUTE-LEFT | 48 | 5.89 s | 7.67 s | 14.02 s | 2.21 |
| decision-right | 12 | 3.7 s | 3.7 s | 3.8 s | 0.03 |
| execute right | 12 | 7.46 s | 7.63 s | 7.87 s | 0.21 |
| Scenario | Empirical Data | Model Predictions | ||||||
|---|---|---|---|---|---|---|---|---|
| Min | Mean | Max | SD | Min | Mean | Max | SD | |
| R E | 0.73 s | 5.06 s | 12.42 s | 2.07 | 4.58 s | 4.92 s | 6.48 s | 0.5 |
| R C | 2.1 s | 5.34 s | 12.63 s | 2.23 | 7.78 s | 9.2 s | 13.02 s | 1.4 |
| F E | 2.82 s | 5.09 s | 9.7 s | 1.79 | 5.31 s | 5.94 s | 6.52 s | 0.42 |
| F C | 1.5 s | 5.11 s | 23.54 s | 3.13 | 5.31 s | 5.95 s | 7.12 s | 0.43 |
| L E | 2.73 s | 4.84 s | 10.25 s | 1.73 | 3.7 s | 4.63 s | 6.08 s | 0.76 |
| L C | 2.5 s | 5.69 s | 21.1 s | 3.11 | 3.7 s | 4.63 s | 6.18 s | 0.72 |
Publisher’s Note: MDPI stays neutral with regard to jurisdictional claims in published maps and institutional affiliations. |
© 2022 by the authors. Licensee MDPI, Basel, Switzerland. This article is an open access article distributed under the terms and conditions of the Creative Commons Attribution (CC BY) license (https://creativecommons.org/licenses/by/4.0/).
Share and Cite
Scharfe-Scherf, M.S.L.; Wiese, S.; Russwinkel, N. A Cognitive Model to Anticipate Variations of Situation Awareness and Attention for the Takeover in Highly Automated Driving. Information 2022, 13, 418. https://doi.org/10.3390/info13090418
Scharfe-Scherf MSL, Wiese S, Russwinkel N. A Cognitive Model to Anticipate Variations of Situation Awareness and Attention for the Takeover in Highly Automated Driving. Information. 2022; 13(9):418. https://doi.org/10.3390/info13090418
Chicago/Turabian StyleScharfe-Scherf, Marlene Susanne Lisa, Sebastian Wiese, and Nele Russwinkel. 2022. "A Cognitive Model to Anticipate Variations of Situation Awareness and Attention for the Takeover in Highly Automated Driving" Information 13, no. 9: 418. https://doi.org/10.3390/info13090418
APA StyleScharfe-Scherf, M. S. L., Wiese, S., & Russwinkel, N. (2022). A Cognitive Model to Anticipate Variations of Situation Awareness and Attention for the Takeover in Highly Automated Driving. Information, 13(9), 418. https://doi.org/10.3390/info13090418