Abstract
This study explores how drivers of an automated vehicle distribute their attention as a function of environmental events and driving task instructions. Twenty participants were asked to monitor pre-recorded videos of a simulated driving trip while their eye movements were recorded using an eye-tracker. The results showed that eye movements are strongly situation-dependent, with areas of interest (windshield, mirrors, and dashboard) attracting attention when events (e.g., passing vehicles) occurred in those areas. Furthermore, the task instructions provided to participants (i.e., speed monitoring or hazard monitoring) affected their attention distribution in an interpretable manner. It is concluded that eye movements while supervising an automated vehicle are strongly ‘top-down’, i.e., based on an expected value. The results are discussed in the context of the development of driver availability monitoring systems.
1. Introduction
Driver availability monitoring systems (DAMS) are finding their way into consumer vehicles and will soon become mandatory for newly sold cars [1]. DAMS do not only have utility in manual driving but also in automated driving [2,3]. In particular, SAE Level 2 automated driving requires drivers to focus on the driving task, which can be verified using eye- and head-tracking [4,5] and hands-on-wheel detection technology [6,7].
One point of importance in the development of DAMS is what the driver should look at. Lappi et al. [8] noted that a vital regularity in eye movements in driving is that drivers’ “gaze is focused on task-relevant objects and locations … rather than the visually most salient ones…”. Research into hazard perception shows that more experienced drivers are better able to detect and respond to hazards and precursors of hazards [9,10]. Additionally, more experienced drivers have a larger horizontal variance of gaze and are less likely to look at the road center, which may be explained by their superior skills in identifying hazards or their higher spare mental capacity [11,12,13,14]. In short, a DAMS that merely measures whether the driver looks towards the forward roadway may not be optimal as drivers acquire situational awareness by perceiving various elements of the task environment. Furthermore, safe driving involves more than looking at relevant features. For example, previous research into highway hypnosis [15,16] and the looked-but-failed-to-see phenomenon [17] showed that looking does not imply that the driver comprehends the situation.
Another factor concerns the driving task itself. It can be expected that a driver’s attention distribution depends on whether the driver is driving manually or whether he or she is tasked to supervise an automated driving system. Previous research indicates that drivers of automated vehicles are less likely to glance at the forward roadway than manual drivers, which can be explained by the visual demands associated with manual lane-keeping [18,19,20,21,22,23].
When drivers supervise their automated vehicles, they still need to be situationally aware in order to be able to make an appropriate evasive maneuver after reclaiming control [24]. For example, the supervisor of the (SAE-2-level) automated vehicle may have to keep track of the speed of the vehicle and will need to be vigilant to other vehicles in the vicinity as these vehicles may have to be avoided after taking over control [25]. The extent to which drivers of automated vehicles should focus on the speedometer or hazards in the driving environment depends on the expected capabilities of the automated driving system. That is, relatively unreliable automated vehicles may require a higher level of alertness than others. In summary, there is no single definition of driving, but the goals the driver pursues may depend on the tasks the driver has. These statements resonate with classical research by Yarbus [26], which demonstrated that the task given to an observer affects eye movements to a great extent, although replication studies suggest that this finding is still contentious (see [27,28,29,30], for replication studies with mixed success).
The current study, conducted with a desktop-based eye tracker, aimed to explore how participants distribute attention while monitoring an automated car on a highway. Attentional distribution was investigated in three tasks: no extra task, an additional speed monitoring task, and an additional hazard detection task. Participants viewed the same non-interactive videos for the three tasks, allowing us to examine viewing behavior in a controlled and contextualized manner—that is, we examined how events in the environment, such as the proximity of other vehicles, affect viewing behavior. We end this work with a discussion of our findings, limitations, and recommendations for the development of DAMS.
2. Methods
2.1. Participants
Twenty students (seventeen males and three females) from the Delft University of Technology participated in the experiment. The participants had a mean age of 24.8 years (SD = 2.1) and were all in possession of a driver’s license. They held their license for an average of 5.8 years (SD = 3.2). The participants’ yearly driving distance was 3530 km per year (SD = 2621). All participants provided written informed consent before partaking in the experiment.
2.2. Experimental Setup
The experiment was performed on a 24-inch monitor with a resolution of 1920 × 1080 pixels (display area 531 × 298 mm). A head support was used to minimize participant head movements. The monitor was positioned at a distance of approximately 0.9 m from the head support; see Figure 1 for a photo of the experimental setup. Eye-tracking was performed using the SR Research EyeLink 1000 Plus eye-tracker, which recorded the right eye.
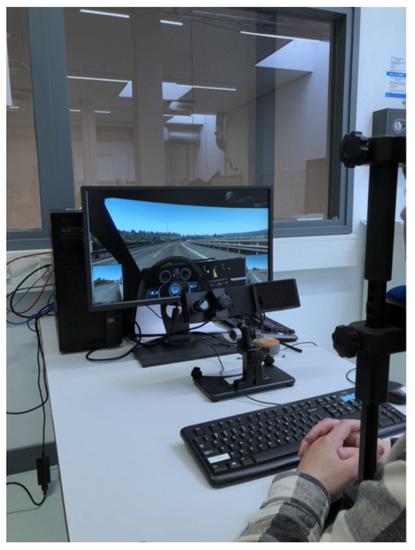
Figure 1.
Experimental setup. Shown from back to front is the monitor for displaying the videos, the eye-tracker camera with infrared illuminator, the keyboard used for pressing the spacebar and arrow keys, and the head support.
2.3. Stimuli
Videos were created in the Euro Truck Simulator 2, a virtual environment that offers realistically looking roads, environments, and road users (e.g., cars and trucks). The driving speed and lane position of other road users was simulated by the AI of the Euro Truck Simulator.
A total of three 120-s videos were used. In each of the pre-recorded videos, the experimenter drove the ego-vehicle by means of the keyboard. In all three videos, the ego-vehicle drove on a two-lane highway with a speed that varied between 80 and 130 km/h. The videos had a frame rate of 60 fps.
- In Video 1, the ego-vehicle overtook six vehicles and was overtaken by one vehicle. The speed of the ego-vehicle crossed the 100 km/h mark six times, and the vehicle changed lanes six times.
- In Video 2, the ego-vehicle overtook two vehicles and was overtaken by five vehicles. The speed of the ego-vehicle crossed the 100 km/h mark 13 times, and the vehicle changed lanes four times.
- In Video 3, the ego-vehicle overtook eight vehicles and was overtaken by two vehicles. The 100 km/h mark was crossed six times, and six lane changes occurred.
2.4. Experimental Task and Procedures
Participants were presented with instructions in written form on the computer monitor. It was mentioned that participants should act as if they were in a vehicle that drove itself and which they had to monitor. It was also mentioned that they should be able to take over control at any time. It was mentioned that the experiment comprised three different tasks:
- Baseline: You do not have any secondary tasks to perform.
- Speed Task: You should shortly press the spacebar every time the speed dial crosses the 100 km/h mark. This works two ways around, i.e., when the car is braking or accelerating. As soon as the dial is on the 100 km/h mark, you should press; as soon as the pointer has passed the mark, you should release the spacebar.
- Hazard Task: You will have to indicate whether a car or truck is driving in the lane next to you. As long as this is the case, you have to press the arrow key. Press the right arrow key when someone is driving on your right side and the left arrow key when someone is driving on your left. When there is nothing on your left or right, you have to release the arrow key.
Although the Speed Task and Hazard Task can reliably be performed by automation technology (namely through cruise control and blind-spot monitoring systems, respectively), supervisors of automated vehicles will still need to perform these tasks in order to stay situationally aware.
Next, the participants were shown a short (13 s) example video to give them an idea of the driving environment. Then, calibration of the eye-tracker was performed. Before each trial, the task for the upcoming trial was shown on the monitor. It was repeated that the primary task was to monitor the self-driving car, to stay aware of the state of the vehicles and traffic signs, and to be able to take over steering at any time. Furthermore, before the Speed Task trial, it was mentioned that the secondary task was to press the spacebar every time the speed crossed 100 km/h. Before the Hazard Task trial, it was mentioned that the secondary task was to hold the left/right arrow key as long as a vehicle was driving next to them.
Each participant performed eighteen 120-s trials. These trials comprised three different videos and three different task instructions, as specified above. Furthermore, half of the videos contained gaze-contingent visual feedback in the form of a red outline of the front windshield, speed dial, left mirror, or right mirror (for a similar approach, see [31]). The gaze-contingent feedback was based on an algorithm that kept track of the participants’ previous eye movements and accordingly aimed to guide their eye movements to relevant areas. The order of the 18 trials was randomized and different for each participant.
For this paper, results from nine of eighteen trials were used. The nine videos with gaze-contingent feedback were not analyzed because the onset and offset of the gaze-contingent feedback showed large individual differences, and preliminary analyses did not provide insights that contribute to the present paper’s purpose.
2.5. Data Processing
First, data gaps (e.g., due to blinks) in the horizontal and vertical gaze coordinates were filled through linear interpolation. Next, the horizontal and vertical gaze coordinates were filtered using a median filter with a time interval of 100 ms.
The attention distribution was determined by analyzing whether a participant’s gaze point fell within one of four areas of interest (AOIs): windshield, left mirror, right mirror, and dashboard (note that the rear-view mirror was not included in the animated video clips of this experiment). The AOIs for the left mirror, right mirror, and dashboard were pragmatically defined as rectangular shapes. All other gaze points were labeled as the windshield. Because of the aforementioned linear interpolation, there were no missing data—that is, for each frame, the percentage of participants looking at the left mirror, right mirror, dashboard, and windshield adds to 100%.
The number of participants who had their eyes in one of these four AOIs was counted for each time sample and moving-average-filtered with a time interval of 500 ms. Subsequently, the participants’ attention to the AOIs was graphically associated with events in the scenario, such as ego-vehicle lane changes, ego-vehicle speed, and vehicle size in the mirrors.
The driving simulator we used for creating the videos did not record the state of other vehicles (nor the view the ego-driver had of those vehicles). Additionally, future automated vehicles will likely rely on cameras to obtain information about surrounding traffic [32] and to replace the outside mirrors with screens [33]. Therefore, the size (~closeness) of vehicles visible in the left and right mirrors was obtained using a pre-trained YoloV4 model [34] (obtained from [35]). YoloV4 can detect 80 different object types. From these, we extracted the cars, trucks, and buses. The width of the object in the mirror that yielded the highest classification score was used as an index of vehicle size. Only objects yielding classification scores greater than 0.8 were taken into consideration, to exclude false-positive and low-quality detections (such as opposing traffic on the other side of the road).
3. Results
Figure 2 shows the heatmap for the three task conditions. It can be seen that the attention of participants was highly concentrated on either the left mirror, right mirror, the road ahead, or the speedometer. Participants also occasionally looked at the navigation display, which was ignored in the present analysis and grouped with the dashboard AOI. In summary, the heatmaps confirm that the use of four AOIs (windshield, left mirror, right mirror, dashboard) is appropriate.
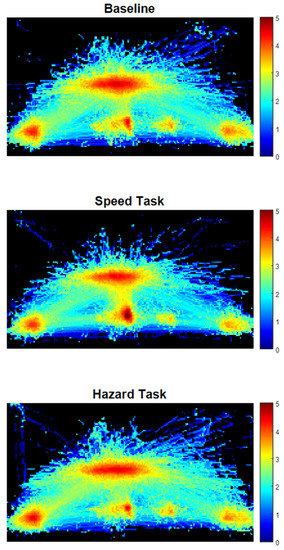
Figure 2.
Heatmap of gaze points for the three videos aggregated for the Baseline Task (top), Speed Task (middle), and Hazard Task (bottom). The heatmap was divided into 10 × 10-pixel squares and normalized. The colors are on a base-10 logarithmic scale. For example, a dark red color (value = 5) means there was 100 times more attention to that region than a yellow color (value = 3).
Figure 3 shows the attention distribution across the four AOIs for Videos 1, 2, and 3 in the Baseline condition, i.e., without a secondary task. It is noticeable that the attention distribution strongly fluctuated with elapsed time. In an attempt to elucidate the causes of these fluctuations, Figure 4, Figure 5, Figure 6 and Figure 7 show the moments in Video 3 when a maximal proportion of participants focused their attention on the windshield (t = 94.1 s), left mirror (t = 24.8 s), right mirror (t = 84.0 s), and dashboard (t = 17.0 s), respectively.
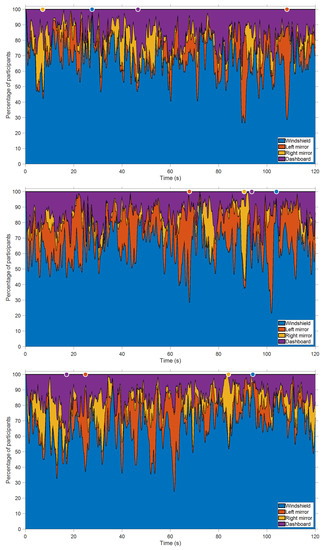
Figure 3.
Attention distribution across four areas of interest (AOIs) for Video 1 (top), Video 2 (middle), and Video 3 (bottom) in the Baseline task. The colored circular markers at the top of each figure represent the moments where the maximal number of participants glanced at the AOI.
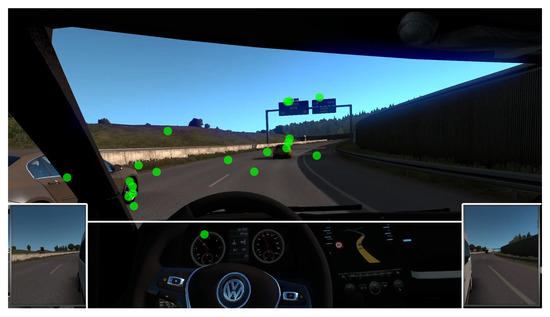
Figure 4.
Moment in Video 3 where most participants attended to the windshield (Baseline Task). The green markers represent the gaze coordinates of individual participants. White lines are drawn around the AOIs.
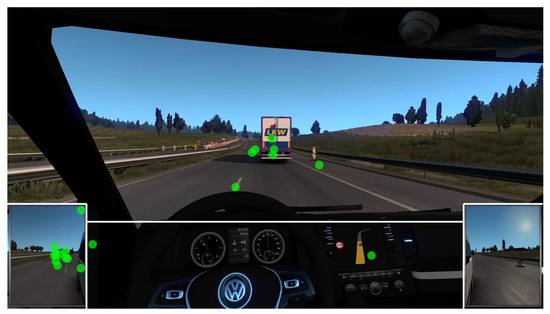
Figure 5.
Moment in Video 3 where most participants attended to the left mirror (Baseline Task). The green markers represent the gaze coordinates of individual participants. White lines are drawn around the AOIs.
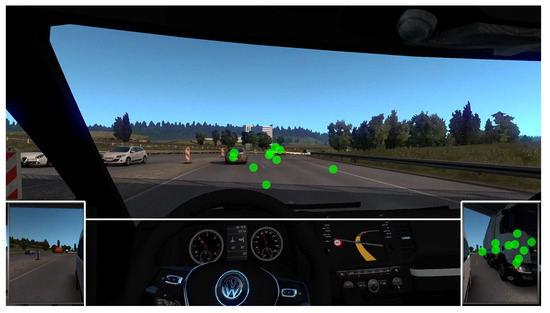
Figure 6.
Moment in Video 3 where most participants attended to the right mirror (Baseline Task). The green markers represent the gaze coordinates of individual participants. White lines are drawn around the AOIs.
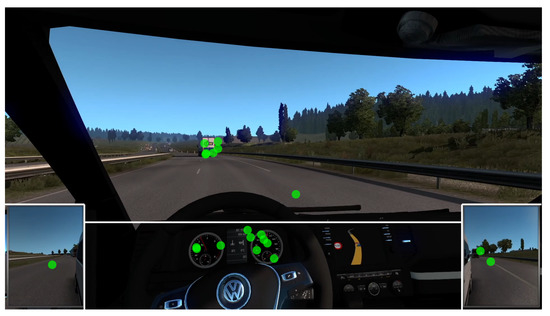
Figure 7.
Moment in Video 3 where most participants attended to the dashboard (Baseline Task). The green markers represent the gaze coordinates of individual participants. White lines are drawn around the AOIs.
- The windshield attracted attention when events (e.g., car in front, curve, road signs) were happening in that AOI (Figure 4).
- The left mirror attracted attention right before a lane change to the left lane and while a vehicle was visible in the left mirror (Figure 5). The participants may have anticipated that a lane change was about to happen based on the proximity of other vehicles as well as the turn indicator usage visible on the dashboard.
- The right mirror attracted attention right before changing lanes to the right after having overtaken another vehicle (Figure 6).
- Finally, the speedometer attracted attention in otherwise uneventful conditions while the road was relatively empty (Figure 7).
Figure 8 illustrates that vehicles in the mirror attracted attention—that is, when another vehicle was driving in the left lane to overtake the ego-vehicle, participants were increasingly likely to focus on the left mirror as this vehicle got closer.
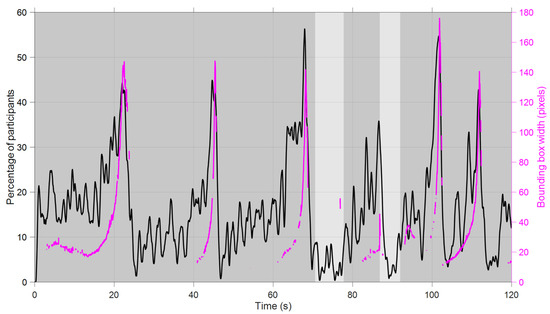
Figure 8.
Left axis (black): Percentage of participants with their eyes on the left mirror (Video 2; three tasks averaged). Right axis (magenta): Width of the bounding box of the detected vehicle in the left mirror. The shaded background indicates whether the ego-vehicle was driving on the right lane (dark gray) or left lane (light gray).
The effects of the three task-instruction conditions are shown in Table 1. The Speed Task caused attention to be focused on the dashboard (~40% vs. ~14% in the Baseline Task). In the Hazard Task, attention was directed away from the dashboard and towards the left mirror (13–21% vs. 10–17% in the Baseline Task).

Table 1.
Attention distribution to the four Areas of Interest (AOIs) for the nine trials.
The focus on the dashboard during the Speed Task fluctuated over time, with the peaks in attention to the dashboard corresponding to moments when the speed was close to 100 km/h (Figure 9 and Figure 10). In the same vein, in the Hazard Task, participants were relatively likely to attend to the mirrors when objects were visible in those mirrors (see Figure 11 for an illustration). Thus, this again shows that attention distribution is a function of the situation and task.
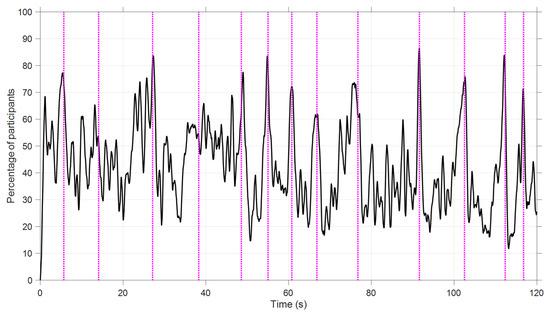
Figure 9.
Percentage of participants with their eyes on the dashboard (Video 2, Speed Task). The dotted vertical lines represent the moments of 100 km/h threshold crossings.
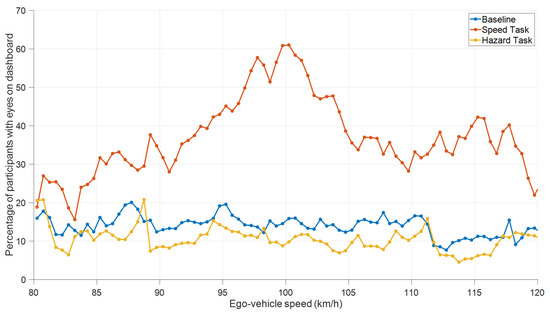
Figure 10.
Percentage of participants with their eyes on the dashboard as a function of vehicle speed in the Baseline Task, Speed Task, and Hazard Task (Videos 1–3 combined, first 5 s of each video excluded).
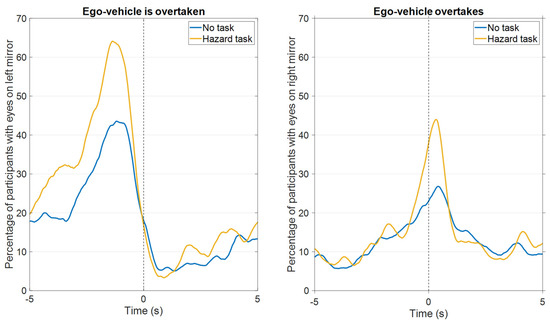
Figure 11.
Percentage of participants with their eyes on the left mirror when another vehicle overtook the ego-vehicle in the left lane (left panel) and with their eyes on the right mirror when the ego-vehicle overtook another vehicle in the right lane (right panel) (Videos 1–3 combined, 8 and 15 overtakes, respectively). The vertical line at t = 0 s represents the first moment when part of the overtaking car became visible in the left side window (left panel) or the last moment when part of the overtaken car was visible in the front window (right panel).
4. Discussion
This study examined participants’ viewing behavior when presented with videos depicting a simulated automated car. The use of videos enabled us to evaluate participants’ viewing behavior for three different task instructions under identical traffic conditions for all participants.
The results indicated that viewing behavior in driving is strongly top-down. More precisely, top-down attention refers to attention that is governed by task-related expectancies and the value of task components (i.e., expected value), as opposed to bottom-up attention, which is governed by salient stimuli and head/eye-movement effort [36]. In particular, the task given to drivers determined their attention distribution (speedometer, hazards), and the drivers’ eyes were directed towards task-relevant elements (e.g., overtaking cars) in a highly time-varying manner.
A relatively novel aspect of our work is that it focused on eye movements in relation to tasks and events in the environment. In comparison, research about eye movements in driving seems most developed in regard to curve driving on relatively uneventful roads (see [37] for a review). For example, there is research that reports that on curved roads, drivers focus on the tangent point [38,39], a future path [40,41], or the vanishing point [42]. That said, there is a growing body of research that examines eye movements in relation to the driving context [43] and specific driving events, such as overtaking and lane-changing [44,45], approaching road crossings and roundabouts [46], processing feedback and advice on the dashboard [47], responding to warnings [48,49], and reclaiming control from an automated vehicle (e.g., [50,51,52]). Especially noteworthy is research by Kircher and Ahlstrom [53], which provide similar figures as our Figure 11 but obtained in real traffic with the help of manual annotations of driving maneuvers. The participants’ eye movements in our study seemed aimed at predicting the behaviors of other road users, a finding consistent with earlier hazard perception research (e.g., [54]). For example, viewing behavior was forward-facing when events occurred that could be relevant to the driver, such as vehicles approaching or possibly planning to perform a lateral maneuver.
The present study also revealed indications of task prioritization. For example, participants were more inclined to look at less critical elements such as the speedometer when no hazards were present in the vicinity. In the Speed Task, participants looked at the speedometer considerably more often than in the Baseline task, but still in a functional manner—that is, attention seemed to be focused on the speedometer when there was a high probability that the threshold speed would be exceeded. This latter finding is in line with Senders’s [55] notion of conditional sampling and with Eisma et al. [56], who observed similar results when participants had to detect threshold crossings while watching an instrument panel of moving dials.
The current study revealed a congruence between environmental events and attention distribution. Future research could use more formal models, such as the Salience, Effort, Expectancy, Value (SEEV) model, which has been used before in various transportation research studies. Horrey et al. [57], for example, studied the SEEV model in a driving simulator, where participants had to maintain lane position while performing an in-vehicle technology task. Their results showed a high correlation between predicted and observed percentage dwell time. Other studies also showed high correlations between SEEV-predictive and observed dwell time percentages in various types of human–machine interaction tasks [58,59,60,61,62,63].
A limitation of this work is the small horizontal field of view of 30 degrees, which prevents the use of peripheral vision—an important component of driving [64,65]. In comparison, the human visual field is about 200 degrees [66], meaning that drivers could infer moving objects from, e.g., the side windows [67]. The participants also could not turn their heads—something that drivers normally do [68]. At the same time, there is ample research that claims valid results for movie clips. For example, there are studies on hazard perception (with and without eye-tracking) that use a small field of view and provide discriminative validity between beginner and expert drivers [69,70]. Additionally, our findings for lane changes resemble the findings of an on-road study by Kircher and Ahlstrom [53]. More classically, Hughes and Cole [71] claimed that “visual information presented by the movie film is sufficient to generate attentive processes characteristic of driving” (p. 377).
The use of short 2-min highway-driving trips only and the lack of a rear-view mirror are other limitations of the present study. Additionally, the participants were young engineering students, who can be expected to have fast response times and strong visual-spatial ability [72,73]. The current work could be replicated with older drivers. Finally, no sound, motion, or tactile cues were produced during the experiment. Future research into predicting eye movements in driving should be conducted in real vehicles (e.g., [43,74]).
What do the current findings mean for the development of DAMS? One interpretation of the results is that drivers’ attention should be distributed. For example, a DAMS could assess whether drivers look in the left or right mirrors when another car is passing or when they pass another car. This observation corresponds to earlier work on a gaze-based DAMS that was built on the assumption “that glances to the mirror and the speedometer are necessary for safe driving” [75] (p. 967). However, their DAMS was not contextualized; that is, it did not consider whether meaningful objects were present in the front view or mirrors. The present results may hold promise for object recognition in combination with eye-tracking. It is expected that future cars and trucks will be equipped with camera systems as a replacement for exterior mirrors in cars and trucks [76]. Object recognition on these camera images (such as using YoloV4 in this study) may prove useful input for DAMS.
Author Contributions
Conceptualization, Y.B.E., D.J.E. and J.C.F.d.W.; data curation, J.C.F.d.W. and Y.B.E.; formal analysis, J.C.F.d.W. and D.J.E.; funding acquisition, J.C.F.d.W.; investigation, D.J.E.; methodology, Y.B.E., D.J.E. and J.C.F.d.W.; resources, Y.B.E., D.J.E. and J.C.F.d.W.; software, Y.B.E. and D.J.E.; supervision, Y.B.E. and J.C.F.d.W.; validation, J.C.F.d.W.; visualization, J.C.F.d.W.; writing—original draft preparation, J.C.F.d.W., Y.B.E. and D.J.E.; writing—review and editing, J.C.F.d.W. and Y.B.E. All authors have read and agreed to the published version of the manuscript.
Funding
This research received no external funding.
Institutional Review Board Statement
The study was conducted in accordance with the Declaration of Helsinki, and approved by the Human Research Ethics Committee of the Delft University of Technology (approval number 1479, 22 March 2021).
Informed Consent Statement
Informed consent was obtained from all subjects involved in the study.
Data Availability Statement
Raw data, videos, and a MATLAB script that reproduces all figures can be found at https://doi.org/10.4121/20254071 (accessed on 8 May 2022).
Conflicts of Interest
The authors declare no conflict of interest.
References
- European Commission. Regulation (EU) 2019/2144. Type-approval requirements for motor vehicles and their trailers 2019, and systems, components and separate technical units intended for such vehicles, as regards their general safety and the protection of vehicle occupants and vulnerable road users. Off. J. Eur. Union 2019, L 325, 1–40. [Google Scholar]
- Cabrall, C.D.D.; Happee, R.; De Winter, J.C.F. From Mackworth’s clock to the open road: A literature review on driver vigilance task operationalization. Transp. Res. Part F Traffic Psychol. Behav. 2016, 40, 169–189. [Google Scholar] [CrossRef]
- Hecht, T.; Feldhütter, A.; Radlmayr, J.; Nakano, Y.; Miki, Y.; Henle, C.; Bengler, K. A review of driver state monitoring systems in the context of automated driving. In Proceedings of the 20th Congress of the International Ergonomics Association, Florence, Italy, 26–30 August 2018; Bagnara, S., Tartaglia, R., Albolino, S., Alexander, T., Fujita, Y., Eds.; Springer: Cham, Switzerland, 2018; pp. 398–408. [Google Scholar] [CrossRef]
- Cabrall, C.D.D.; Janssen, N.; De Winter, J.C.F. Adaptive automation: Automatically (dis)engaging automation during visually distracted driving. PeerJ. Comput. Sci. 2018, 4, e166. [Google Scholar] [CrossRef] [PubMed]
- Cadillac. CT6 (Owner’s Manual). 2020. Available online: https://www.cadillac.com/content/dam/cadillac/na/us/english/index/ownership/technology/supercruise/pdfs/2020-cad-ct6-owners-manual.pdf (accessed on 1 May 2022).
- Tesla. About Autopilot. 2022. Available online: https://www.tesla.com/ownersmanual/models/en_us/GUID-EDA77281-42DC-4618-98A9-CC62378E0EC2.html (accessed on 17 June 2022).
- Volvo. Pilot Assist. 2020. Available online: https://www.volvocars.com/en-th/support/manuals/v60/2018w46/driver-support/pilot-assist/pilot-assist (accessed on 1 May 2022).
- Lappi, O.; Rinkkala, P.; Pekkanen, J. Systematic observation of an expert driver’s gaze strategy—An on-road case study. Front. Psychol. 2017, 8, 620. [Google Scholar] [CrossRef] [PubMed]
- Garay-Vega, L.; Fisher, A.L. Can novice drivers recognize foreshadowing risks as easily as experienced drivers? In Proceedings of the Third Driving Assesment Conference, Rockport, ME, USA, 27–30 June 2005; Volume 3, pp. 471–477. [Google Scholar] [CrossRef]
- Malone, S.; Brünken, R. The role of ecological validity in hazard perception assessment. Transp. Res. Part F Traffic Psychol. Behav. 2016, 40, 91–103. [Google Scholar] [CrossRef]
- Falkmer, T.; Gregersen, N.P. A comparison of eye movement behavior of inexperienced and experienced drivers in real traffic environments. Optom. Vis. Sci. 2005, 82, 732–739. [Google Scholar] [CrossRef] [PubMed]
- Mourant, R.R.; Rockwell, T.H. Strategies of visual search by novice and experienced drivers. Hum. Factors 1972, 14, 325–335. [Google Scholar] [CrossRef]
- Underwood, G.; Crundall, D.; Chapman, P. Driving simulator validation with hazard perception. Transp. Res. Part F Traffic Psychol. Behav. 2011, 14, 435–446. [Google Scholar] [CrossRef]
- Van Leeuwen, P.M.; Happee, R.; De Winter, J.C.F. Changes of driving performance and gaze behavior of novice drivers during a 30-min simulator-based training. Procedia Manuf. 2015, 3, 3325–3332. [Google Scholar] [CrossRef]
- Cerezuela, G.P.; Tejero, P.; Chóliz, M.; Chisvert, M.; Monteagudo, M.J. Wertheim’s hypothesis on ‘highway hypnosis’: Empirical evidence from a study on motorway and conventional road driving. Accid. Anal. Prev. 2004, 36, 1045–1054. [Google Scholar] [CrossRef] [PubMed]
- Wertheim, A.H. Explaining highway hypnosis: Experimental evidence for the role of eye movements. Accid. Anal. Prev. 1978, 10, 111–129. [Google Scholar] [CrossRef]
- Herslund, M.B.; Jørgensen, N.O. Looked-but-failed-to-see-errors in traffic. Accid. Anal. Prev. 2003, 35, 885–891. [Google Scholar] [CrossRef]
- Damböck, D.; Weißgerber, T.; Kienle, M.; Bengler, K. Requirements for cooperative vehicle guidance. In Proceedings of the 16th International IEEE Annual Conference on Intelligent Transportation Systems, Hague, The Netherlands, 6–9 October 2013; pp. 1656–1661. [Google Scholar] [CrossRef]
- Goncalves, R.C.; Louw, T.L.; Quaresma, M.; Madigan, R.; Merat, N. The effect of motor control requirements on drivers’ eye-gaze pattern during automated driving. Accid. Anal. Prev. 2020, 148, 105788. [Google Scholar] [CrossRef]
- Louw, T.; Merat, N. Are you in the loop? Using gaze dispersion to understand driver visual attention during vehicle automation. Transp. Res. Part C Emerg. Technol. 2017, 76, 35–50. [Google Scholar] [CrossRef]
- Mackenzie, A.K.; Harris, J.M. Eye movements and hazard perception in active and passive driving. Vis. Cogn. 2015, 23, 736–757. [Google Scholar] [CrossRef]
- Miyajima, C.; Yamazaki, S.; Bando, T.; Hitomi, K.; Terai, H.; Okuda, H.; Hirayama, T.; Egawa, M.; Suzuki, T.; Takeda, K. Analyzing driver gaze behavior and consistency of decision making during automated driving. In Proceedings of the 2015 IEEE Intelligent Vehicles Symposium, Seoul, Korea, 28 June 2015; pp. 1293–1298. [Google Scholar] [CrossRef]
- Navarro, J.; Lappi, O.; Osiurak, F.; Hernout, E.; Gabaude, C.; Reynaud, E. Dynamic scan paths investigations under manual and highly automated driving. Sci. Rep. 2021, 11, 3776. [Google Scholar] [CrossRef]
- Lu, Z.; Happee, R.; de Winter, J.C. Take over! A video-clip study measuring attention, situation awareness, and decision-making in the face of an impending hazard. Transp. Res. Part F Traffic Psychol. Behav. 2020, 72, 211–225. [Google Scholar] [CrossRef]
- Gold, C.; Körber, M.; Lechner, D.; Bengler, K. Taking over control from highly automated vehicles in complex traffic situations: The role of traffic density. Hum. Factors 2016, 58, 642–652. [Google Scholar] [CrossRef] [PubMed]
- Yarbus, A.J. Eye Movements and Vision; Plenum Press: New York, NY, USA, 1967. [Google Scholar]
- Borji, A.; Itti, L. Defending Yarbus: Eye movements reveal observers’ task. J. Vis. 2014, 14, 29. [Google Scholar] [CrossRef]
- DeAngelus, M.; Pelz, J.B. Top-down control of eye movements: Yarbus revisited. Vis. Cogn. 2009, 17, 790–811. [Google Scholar] [CrossRef]
- Greene, M.R.; Liu, T.; Wolfe, J.M. Reconsidering Yarbus: A failure to predict observers’ task from eye movement patterns. Vis. Res. 2012, 62, 1–8. [Google Scholar] [CrossRef]
- Tatler, B.W.; Wade, N.J.; Kwan, H.; Findlay, J.M.; Velichkovsky, B.M. Yarbus, eye movements, and vision. i-Perception 2010, 1, 7–27. [Google Scholar] [CrossRef]
- Pomarjanschi, L.; Dorr, M.; Rasche, C.; Barth, E. Safer driving with gaze guidance. In Bio-Inspired Models of Network, Information, and Computing Systems; Suzuki, J., Nakano, T., Eds.; Springer: Berlin/Heidelberg, Germany, 2010; pp. 581–586. [Google Scholar] [CrossRef]
- Yeong, D.J.; Velasco-Hernandez, G.; Barry, J.; Walsh, J. Sensor and sensor fusion technology in autonomous vehicles: A review. Sensors 2021, 21, 2140. [Google Scholar] [CrossRef] [PubMed]
- Large, D.R.; Crundall, E.; Burnett, G.; Harvey, C.; Konstantopoulos, P. Driving without wings: The effect of different digital mirror locations on the visual behaviour, performance and opinions of drivers. Appl. Ergon. 2016, 55, 138–148. [Google Scholar] [CrossRef] [PubMed]
- Bochkovskiy, A.; Wang, C.Y.; Liao, H.Y.M. Yolov4: Optimal speed and accuracy of object detection. arXiv 2020, arXiv:2004.10934. [Google Scholar]
- sbairagy-MW. Pretrained-Deeplabv3plus. 2021. Available online: https://github.com/matlab-deep-learning/pretrained-deeplabv3plus (accessed on 1 May 2022).
- Wickens, C.D.; McCarley, J.S. Visual attention control, scanning, and information sampling. In Applied Attention Theory; CRC Press: Boca Raton, FL, USA, 2008; pp. 41–61. [Google Scholar]
- Lappi, O. Gaze strategies in driving–An ecological approach. Front. Psychol. 2022, 13, 821440. [Google Scholar] [CrossRef] [PubMed]
- Kandil, F.I.; Rotter, A.; Lappe, M. Driving is smoother and more stable when using the tangent point. J. Vis. 2009, 9, 11. [Google Scholar] [CrossRef]
- Land, M.F.; Lee, D.N. Where we look when we steer. Nature 1994, 369, 742–744. [Google Scholar] [CrossRef]
- Wann, J.P.; Swapp, D.K. Why you should look where you are going. Nat. Neurosci. 2000, 3, 647–648. [Google Scholar] [CrossRef]
- Wilkie, R.M.; Kountouriotis, G.K.; Merat, N.; Wann, J.P. Using vision to control locomotion: Looking where you want to go. Exp. Brain Res. 2010, 204, 539–547. [Google Scholar] [CrossRef]
- Deng, T.; Yang, K.; Li, Y.; Yan, H. Where does the driver look? Top-down-based saliency detection in a traffic driving environment. IEEE Trans. Intell. Transp. Syst. 2016, 17, 2051–2062. [Google Scholar] [CrossRef]
- Palazzi, A.; Abati, D.; Solera, F.; Cucchiara, R. Predicting the driver’s focus of attention: The DR (eye) VE project. IEEE Trans. Pattern Anal. Mach. Intell. 2019, 41, 1720–1733. [Google Scholar] [CrossRef]
- Lethaus, F.; Rataj, J. Do eye movements reflect driving manoeuvres? IET Intell. Transp. Syst. 2007, 1, 199–204. [Google Scholar] [CrossRef]
- Martin, S.; Trivedi, M.M. Gaze fixations and dynamics for behavior modeling and prediction of on-road driving maneuvers. In Proceedings of the 2017 IEEE Intelligent Vehicles Symposium, Los Angeles, CA, USA, 11–14 June 2017; pp. 1541–1545. [Google Scholar] [CrossRef]
- Abbasi, J.A.; Mullins, D.; Ringelstein, N.; Reilhac, P.; Jones, E.; Glavin, M. An analysis of driver gaze behaviour at roundabouts. IEEE Trans. Intell. Transp. Syst. 2021. [Google Scholar] [CrossRef]
- Ahlstrom, C.; Kircher, K. Changes in glance behaviour when using a visual eco-driving system–A field study. Appl. Ergon. 2017, 58, 414–423. [Google Scholar] [CrossRef]
- Lehtonen, E.; Malhotra, N.; Starkey, N.J.; Charlton, S.G. Speedometer monitoring when driving with a speed warning system. Eur. Transp. Res. Rev. 2020, 12, 16. [Google Scholar] [CrossRef]
- Morando, A.; Victor, T.; Dozza, M. Drivers anticipate lead-vehicle conflicts during automated longitudinal control: Sensory cues capture driver attention and promote appropriate and timely responses. Accid. Anal. Prev. 2016, 97, 206–219. [Google Scholar] [CrossRef]
- Louw, T.; Kuo, J.; Romano, R.; Radhakrishnan, V.; Lenné, M.G.; Merat, N. Engaging in NDRTs affects drivers’ responses and glance patterns after silent automation failures. Transp. Res. Part F Traffic Psychol. Behav. 2019, 62, 870–882. [Google Scholar] [CrossRef]
- Petermeijer, S.M.; Cieler, S.; De Winter, J.C.F. Comparing spatially static and dynamic vibrotactile take-over requests in the driver seat. Accid. Anal. Prev. 2017, 99, 218–227. [Google Scholar] [CrossRef]
- Goncalves, R.C.; Louw, T.L.; Madigan, R.; Quaresma, M.; Romano, R.; Merat, N. The effect of information from dash-based human-machine interfaces on drivers’ gaze patterns and lane-change manoeuvres after conditionally automated driving. Accid. Anal. Prev. 2022, 174, 106726. [Google Scholar] [CrossRef]
- Kircher, K.; Ahlstrom, C. Evaluation of methods for the assessment of attention while driving. Accid. Anal. Prev. 2018, 114, 40–47. [Google Scholar] [CrossRef] [PubMed]
- Lee, S.E.; Klauer, S.G.; Olsen, E.C.; Simons-Morton, B.G.; Dingus, T.A.; Ramsey, D.J.; Ouimet, M.C. Detection of road hazards by novice teen and experienced adult drivers. Transp. Res. Rec. 2008, 2078, 26–32. [Google Scholar] [CrossRef] [PubMed]
- Senders, J.W. Visual Sampling Processes. Ph.D. Thesis, Catholic University, Tilburg, The Netherlands, 1983. [Google Scholar]
- Eisma, Y.B.; Cabrall, C.D.D.; De Winter, J.C.F. Visual sampling processes revisited: Replicating and extending Senders (1983) using modern eye-tracking equipment. IEEE Trans. Hum. Mach. Syst. 2018, 48, 526–540. [Google Scholar] [CrossRef]
- Horrey, W.J.; Wickens, C.D.; Consalus, K.P. Modeling drivers’ visual attention allocation while interacting with in-vehicle technologies. J. Exp. Psychol. Appl. 2006, 12, 67–78. [Google Scholar] [CrossRef]
- Bos, A.J.; Ruscio, D.; Cassavaugh, N.D.; Lach, J.; Gunaratne, P.; Backs, R.W. Comparison of novice and experienced drivers using the SEEV model to predict attention allocation at intersections during simulated driving. In Proceedings of the Eighth International Driving Symposium on Human Factors in Driver Assessment, Training and Vehicle Design, Salt Lake City, UT, USA, 22–25 June 2015; pp. 120–126. [Google Scholar]
- Cassavaugh, N.D.; Bos, A.; McDonald, C.; Gunaratne, P.; Backs, R.W. Assessment of the SEEV model to predict attention allocation at intersections during simulated driving. In Proceedings of the Seventh International Driving Symposium on Human Factors in Driver Assessment, Training and Vehicle Design, Bolton Landing, NY, USA, 17–20 June 2013; pp. 334–340. [Google Scholar]
- Steelman-Allen, K.S.; McCarley, J.S.; Wickens, C.; Sebok, A.; Bzostek, J. N-SEEV: A computational model of attention and noticing. In Proceedings of the Human Factors and Ergonomics Society Annual Meeting, San Antonio, TX, USA, 19–23 October 2009; Volume 53, pp. 774–778. [Google Scholar] [CrossRef]
- Wickens, C.D.; Helleberg, J.; Goh, J.; Xu, X.; Horrey, W.J. Pilot Task Management: Testing an Attentional Expected Value Model of Visual Scanning; Technical Report No. ARL-01-14/NASA-01-7; Aviation Research Lab, Institute of Aviation: Savoy, IL, USA, 2001. [Google Scholar]
- Wickens, C.D.; Sebok, A.; Bagnall, T.; Kamienski, J. Modeling of situation awareness supported by advanced flight deck displays. In Proceedings of the Human Factors and Ergonomics Society Annual Meeting, Baltimore, MD, USA, 1–5 October 2007; Volume 51, pp. 794–798. [Google Scholar] [CrossRef]
- Wortelen, B.; Lüdtke, A.; Baumann, M. Simulating attention distribution of a driver model: How to relate expectancy and task value? In Proceedings of the 12th International Conference on Cognitive Modeling, Ottawa, ON, Canada, 11–14 July 2013. [Google Scholar]
- Kotseruba, I.; Tsotsos, J.K. Behavioral research and practical models of drivers’ attention. arXiv 2021, arXiv:2104.05677. [Google Scholar]
- Wolfe, B.; Dobres, J.; Rosenholtz, R.; Reimer, B. More than the useful field: Considering peripheral vision in driving. Appl. Ergon. 2017, 65, 316–325. [Google Scholar] [CrossRef]
- Strasburger, H. Seven myths on crowding and peripheral vision. i-Perception 2020, 11, 1–45. [Google Scholar] [CrossRef]
- Bickerdt, J.; Wendland, H.; Geisler, D.; Sonnenberg, J.; Kasneci, E. Beyond the tracked line of sight—Evaluation of the peripheral usable field of view in a simulator setting. J. Eye Mov. Res. 2021, 12. [Google Scholar] [CrossRef]
- Fridman, L.; Lee, J.; Reimer, B.; Victor, T. ‘Owl’ and ‘Lizard’: Patterns of head pose and eye pose in driver gaze classification. IET Comput. Vis. 2016, 10, 308–314. [Google Scholar] [CrossRef]
- Scialfa, C.T.; Deschênes, M.C.; Ference, J.; Boone, J.; Horswill, M.S.; Wetton, M. A hazard perception test for novice drivers. Accid. Anal. Prev. 2011, 43, 204–208. [Google Scholar] [CrossRef]
- Vlakveld, W.P. A comparative study of two desktop hazard perception tasks suitable for mass testing in which scores are not based on response latencies. Transp. Res. Part F Traffic Psychol. Behav. 2014, 22, 218–231. [Google Scholar] [CrossRef]
- Hughes, P.K.; Cole, B.L. What attracts attention when driving? Ergonomics 1986, 29, 377–391. [Google Scholar] [CrossRef] [PubMed]
- Salthouse, T.A. When does age-related cognitive decline begin? Neurobiol. Aging 2009, 30, 507–514. [Google Scholar] [CrossRef] [PubMed]
- Wai, J.; Lubinski, D.; Benbow, C.P. Spatial ability for STEM domains: Aligning over 50 years of cumulative psychological knowledge solidifies its importance. J. Educ. Psychol. 2009, 101, 817–835. [Google Scholar] [CrossRef]
- Fridman, L.; Langhans, P.; Lee, J.; Reimer, B. Driver gaze region estimation without use of eye movement. IEEE Intell. Syst. 2016, 31, 49–56. [Google Scholar] [CrossRef]
- Ahlstrom, C.; Kircher, K.; Kircher, A. A gaze-based driver distraction warning system and its effect on visual behavior. IEEE Trans. Intell. Transp. Syst. 2013, 14, 965–973. [Google Scholar] [CrossRef]
- Schmidt, E.A.; Hoffmann, H.; Krautscheid, R.; Bierbach, M.; Frey, A.; Gail, J.; Lotz-Keens, C. Camera-monitor systems as a replacement for exterior mirrors in cars and trucks. In Handbook of Camera Monitor Systems; Terzis, A., Ed.; Springer: Cham, Switzerland, 2016; pp. 369–435. [Google Scholar] [CrossRef]


Publisher’s Note: MDPI stays neutral with regard to jurisdictional claims in published maps and institutional affiliations. |
© 2022 by the authors. Licensee MDPI, Basel, Switzerland. This article is an open access article distributed under the terms and conditions of the Creative Commons Attribution (CC BY) license (https://creativecommons.org/licenses/by/4.0/).