Abstract
A potential myocardial injury can be induced by intensive sporting activities, which may be due to ventricular tachycardia or fibrillation when individuals continue to exercise during the maximum physical loading period (the aerobic capability plateau, ACP). Herein, we conducted an incremental exercise test with the RR-interval and SV-series measurements as the input and output of the circulatory system. Through time and frequency analyses, we aimed to identify the indicators for distinguishing the normal stage (S1), last stage before ACP (S2), and ACP stage (S3) during different incremental physical loads. The cross-correlation results of the RR interval and SV series showed that the maximum coefficient of S2 was significantly greater (p < 0.05) than that of S1 (median 0.91 to 0.87), and also significantly lower (p < 0.05) than that of S3 (median 0.87 to 0.60). The corresponding spectrum shows that the decreasing correlation coefficient of SVV and Heart rate variability can be used to assess whether the body has reached the ACP. These findings can be used as a guide for exercise healthcare. Pausing or reducing the exercise load before entering the ACP could effectively reduce the risk of myocardial injury.
1. Introduction
The World Health Organization (WHO) defines physical activity as any bodily movement produced by skeletal muscles, which requires energy expenditure. The term “exercise” should not be mistaken with “physical activity”. It is a subcategory of physical activity that is planned, structured, repetitive, and purposeful, in the sense that the objective is to maintain one or multiple components of physical fitness. In Taiwan, the Sports Administration, Ministry of Education, have announced several plans to promote exercise for general citizens since 1997. In Taiwan, the percentage of individuals who exercised increased from 76.7% in 2013 to 83.6% in 2019. In 2019, 33.6% of the total population of Taiwan exercised regularly. A study published in 2006 reported that 37% of men and 24% of women in the United Kingdom performed 30 min of moderate exercise five times a week [1]. In 2010, a study in Spain reported that the overall prevalence of men and women who actively played sports was 52.12% and 33.27%, respectively [2]. Exercise has become an increasingly popular trend in recent years, and cardiovascular response to exercise has become an interesting topic of research.
Circulatory changes increase blood flow, while maintaining adequate circulation during rest or exercise. There is an additional increase in the extra O2 from blood into the exercising muscle, which increases the ventilation or breathing rate (BR) and provides extra O2 (and also excretes extra CO2). To excrete extra CO2, it is necessary to increase the gas exchange rate or accelerate blood flow (increase in BR and heart rate (HR)) [3]. During exercise, an athlete breathes skillfully and regulates breathing patterns, such as breathing rhythms and stepping during running, breathing rhythms and pedaling during biking, and breathing action with front-crawl swimming [4,5,6].
The cardiovascular system transports O2 and nutrients to the target tissue through blood flow and performs aerobic metabolism to produce adenosine triphosphate (ATP) and bring waste and blood with higher CO2 concentration back to the heart. The cardiovascular system is a steady-state system. It can adjust in response to different conditions and environments to ensure that the target organ obtains sufficient blood perfusion and oxygen for conversion into energy through metabolism. As the pump of the blood circulation process, it continuously ejects blood and supports the circulatory system. The regulation of blood volume varies according to the state of the human body. In the exercise state, myocardial tension increases stroke volume (SV) [3]. However, the tension of muscle fibers is limited due to their length. For the myocardium, the length of the myocardial fiber is limited in proportion to the end-diastolic left ventricular volume [7]. When the intensity of exercise is too high or the duration is too long, the left ventricular volume cannot enlarge, which affects SV [7]. The speed of the heartbeat increases to provide sufficient perfusion to maintain sufficient cardiac output (CO). This is the period of maximum physical load, called the aerobic capability plateau (ACP), and ACP is usually judged by the maximum value of SV and oxygen consumption (VO2) in the clinic [8].
In recent years, there has been an increase in the occurrence of endurance sports activities, such as triathlons. It is especially important for triathletes to perform at sub-maximal physical load over a long period to avoid reaching a state of exhaustion in the ACP stage [9]. A potential myocardial injury could be induced by intensive sporting activities during ACP [10]. Moreover, in long-term exercises, issues related to the heart during ACP have been identified [11]. Myocardial injury may be due to ventricular tachycardia or fibrillation when an individual continues to exercise during ACP and concerns right ventricular overload or left ventricular dysfunction directly after physical activity [12]. Individuals avoiding the ACP stage has attracted widespread attention and has become an important research topic in exercise healthcare [12]. Although ACP can be judged based on physiological signals, there are currently very few methods to predict the period before ACP, to avoid ACP from occurring.
Recently, hemodynamic measurements have been developed as non-invasive, low-destructive, and continuous measurement methods to investigate the dynamic response of the circulatory system. Measurement of HR is a relatively mature technology. Additionally, an increasing number of noninvasive methods of SV measurement have been developed recently. In 1970, Kubicek summarized the methods for measuring electrical impedance, proposed the SV estimation formula, and proposed an impedance cardiogram (ICG) [13]. The ICG method works on the principle that blood has electrical impedance. During a heartbeat, a corresponding change occurs when the blood is ejected. After first-order differentiation, a characteristic comparison with the electrocardiogram was performed to obtain a more accurate SV value [14]. A follow-up study explored the feasibility of measuring ICG during exercise, and showed that ICG can be used during dynamic exercise [15]. CO and SV are measured using ICG, and the results are compared with the golden standard method [16]. In recent years, ICG technology has gradually matured, and modern technology can automatically detect the point C of ICG; the results show that the points were detected with high sensitivity and low detection error [17]. Moreover, other studies have shown that motion artifacts of ICG can be effectively eliminated [18], which makes the accuracy of ICG motion measurement more valuable. Some ICG products have been approved by the Food and Drug Administration, including Cheetah [19], Manatec Biomedical [20], and Osypka [21].
HR, SV, CO, and cardiovascular responses are affected by regulation of the autonomic nervous system, including the sympathetic nervous system (SNS) and parasympathetic nervous system (PNS). The functionality of the autonomic nervous system can be assessed using the variability analysis method, which uses heart rate variability (HRV) to assess the activity of the autonomic nervous system (ANS) and PNS. HRV indices have low frequency (0.04–0.15 Hz, LF) and high-frequency power (0.15–0.4 Hz, HF). LF power may be produced by both PNS and SNS. HF power reflects the PNS [22]. Similar to HRV, SV variability (SVV) was also used to observe changes in physical load, especially before and after coronary surgery in 1999 [23]. The assessment of SVV in the patient used the same bandwidth as HRV for calculations. In 2004, Liu analyzed the correlation between HRV and SVV, and estimated that the two provide different information on the autonomic nervous system [24]. Previous studies mostly calculated SVV to assessed physical load and compared SVV with HRV in the static state [23,24]. To the best of our knowledge, the maximum physical load (ACP) can only be evaluated using the maximum SV and VO2, and there are very few methods to evaluate the sub-maximum physical load. However, few studies have analyzed SVV during exercise and investigated the SVV bandwidth, phase, and physiological indicators represented by SVV. Therefore, this study aimed to find an indicator for the physical load of the body during incremental exercise. We also aimed to investigate the relationship between SVV and HRV during incremental cycle experiments, using ICG, measured HRV and SVV using fast Fourier transform (FFT), to investigate the response in the nervous system.
2. Materials and Methods
2.1. Participants
This study was conducted in accordance with the principles of the Declaration of Helsinki. The Research Ethics Committee for Human Subject Protection (REC) at the National Chiao Tung University (NCTU-REC-107-092) approved this study protocol, and informed consent was obtained from all participants. We enrolled 30 patients (17 men and 13 women) who were not experts in bicycle training, between December 2018 and November 2019. We excluded individuals with cardiovascular and respiratory diseases, cardiac arrhythmia, and those who were taking medication. All participants understood the experimental protocol and provided signed informed consent prior to starting the study.
2.2. Protocol
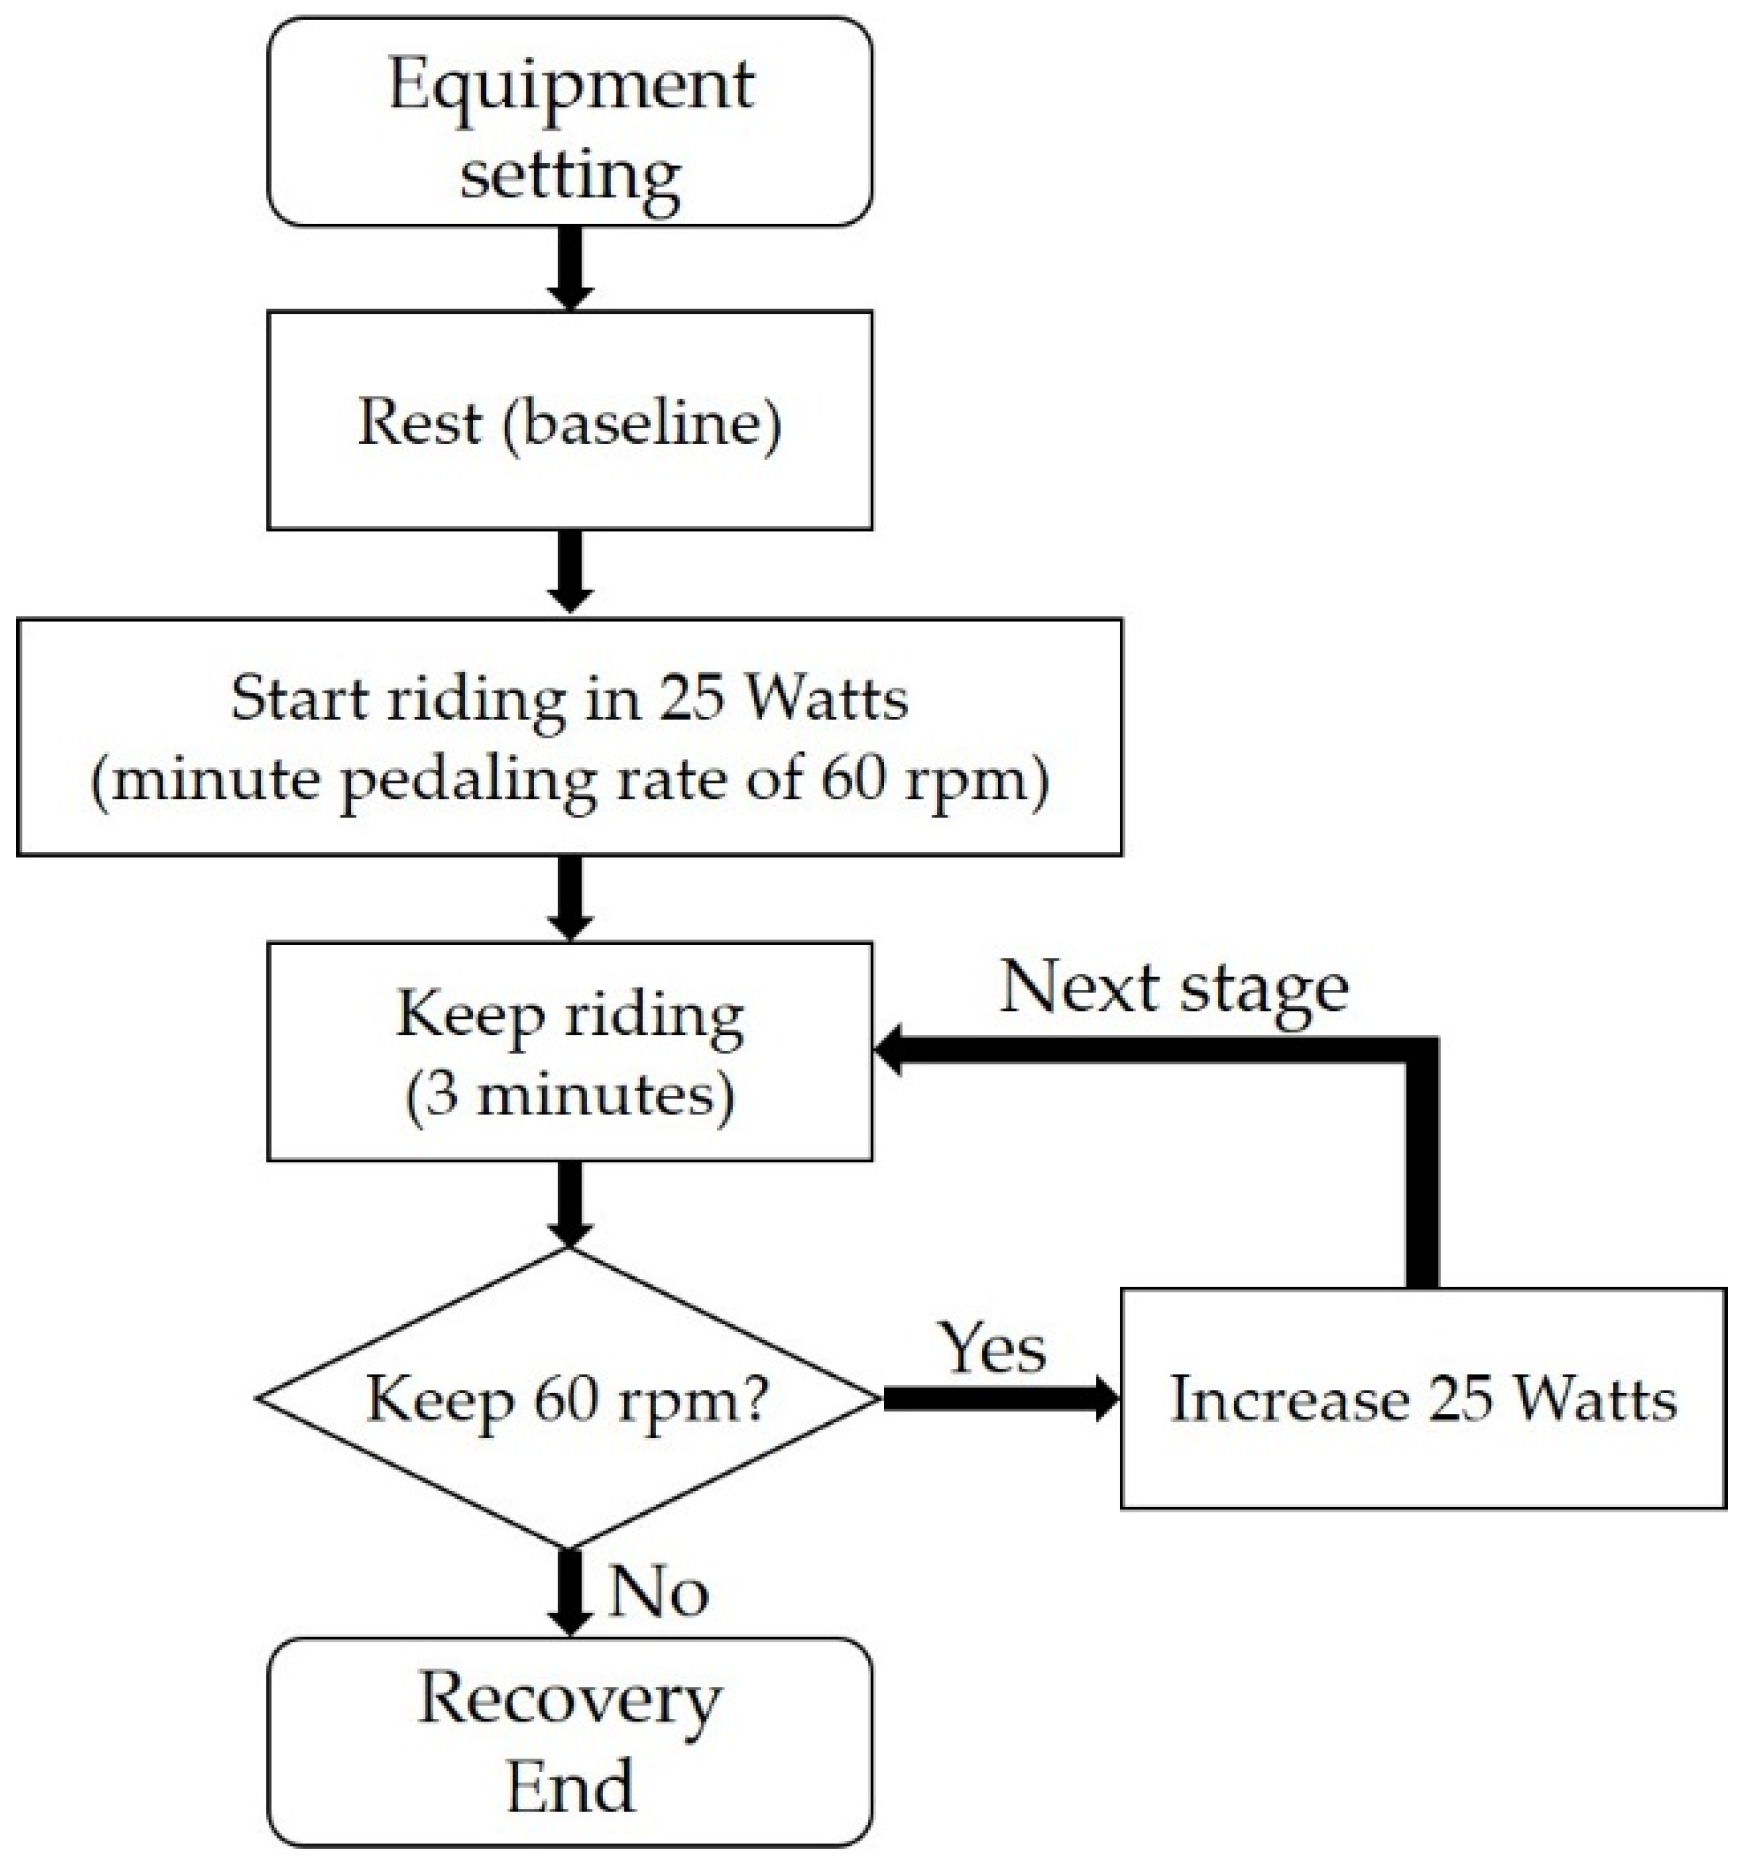
The protocol is shown in Figure 1. The patients were surveyed, and information on their exercise habits and physiological characteristics (height, weight, and age) was obtained; we ensured that they did not consume alcoholic or caffeine-containing drinks for at least 24 h prior to the measurement. An incremental cycle experiment with three-min at 25-watt per stage was conducted in this study. Participants performed on an air-braked cycle ergometer (Wattbike Pro, Nottingham, UK) and maintained a pedaling rate of 60 revolutions per minute (rpm) during cycling. The settings of the cycle ergometer were individually fitted to the height of the participant. The resting stage was zero watts, which was the baseline, and was then increased by 25 W in the consecutive stages. The physical load was increased by 25 W per stage until the participant was exhausted or was unable to maintain 60 rpm within one min. Subsequently, the patient was in a recovery state for three min at the end of the experiment.
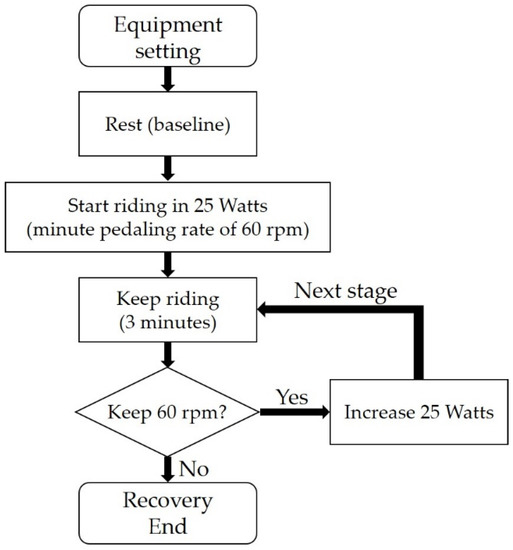
Figure 1.
Incremental cycle experiment. Prior to the resting stage, the setting of the indoor trainer was fitted to the patient’s height. The physical load was increased by 25 watts. The ICG measurement was performed from rest to recovery stages.
2.3. Measurement
The AESCULONTM ICG equipment (Osypka Medical, Berlin, Germany) was used for simultaneous SV and HR measurements in this study. According to the electrical bioimpedance, the thoracic time-variate bioimpedance was acquired by a set of four electrodes on each of the thorax and neck with a sampling frequency of 200 Hz. Due to the difference in the orientation of the erythrocyte changing when the aortic valves opened and closed, the corresponding change in impedance with each beat could be adopted for the SV estimation (called the electrical velocimetry model) [25]. The measured conductivity was higher, and a smaller impedance value could be obtained; the SV was then estimated. Conversely, a one-lead ECG was applied to the same equipment. The nth QRS wave in the ECG was marked, and the time-domain index of the R peak was recorded as Index[n].
The time difference was calculated in each heartbeat as:
∆Index[n] = Index[n] − Index[n − 1]
The beat-to-beat interval (also called the RR interval, RRI) was calculated, along with HR. HR was calculated as:
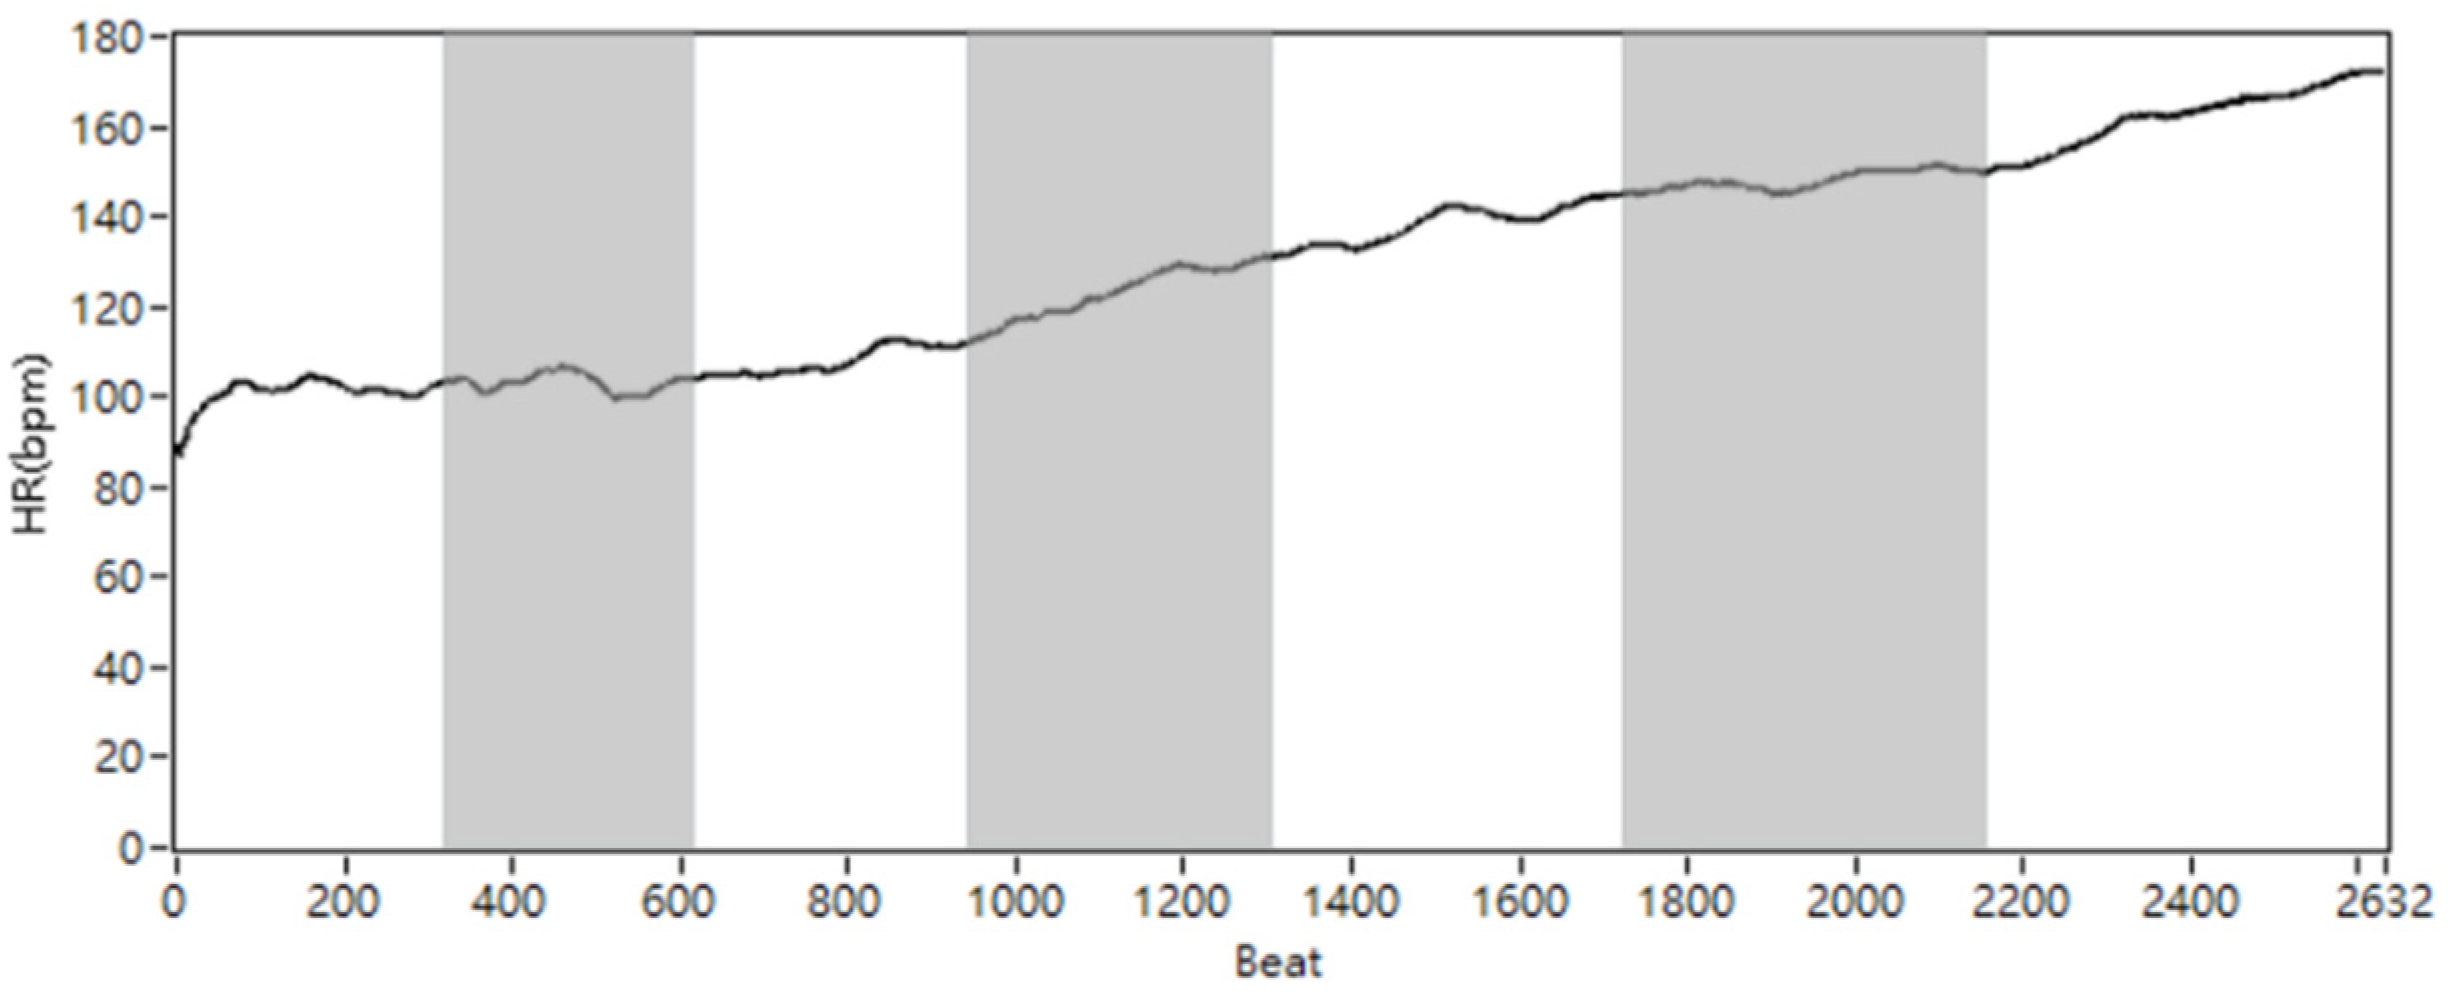
where the round{X,0} means the function of rounding X to a specified number of digits (0). The number would be rounded to the nearest integer. For example, round{108.98,0} = 109. The demonstration of modified beat-domain HR (beat per minute, bmp) and SV series (milliliter, mL) for a single participate is shown in Figure 2.
HR[n]= round{(60 × 200/∆Index[n]),0}
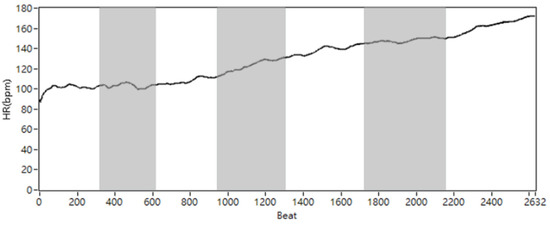
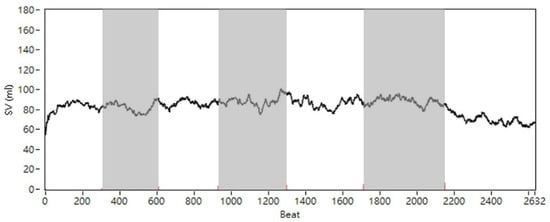
Figure 2.
The demonstration of modified beat-domain HR and SV from patient #9. The white and gray blocks represent each sequence stage.
2.4. Analysis
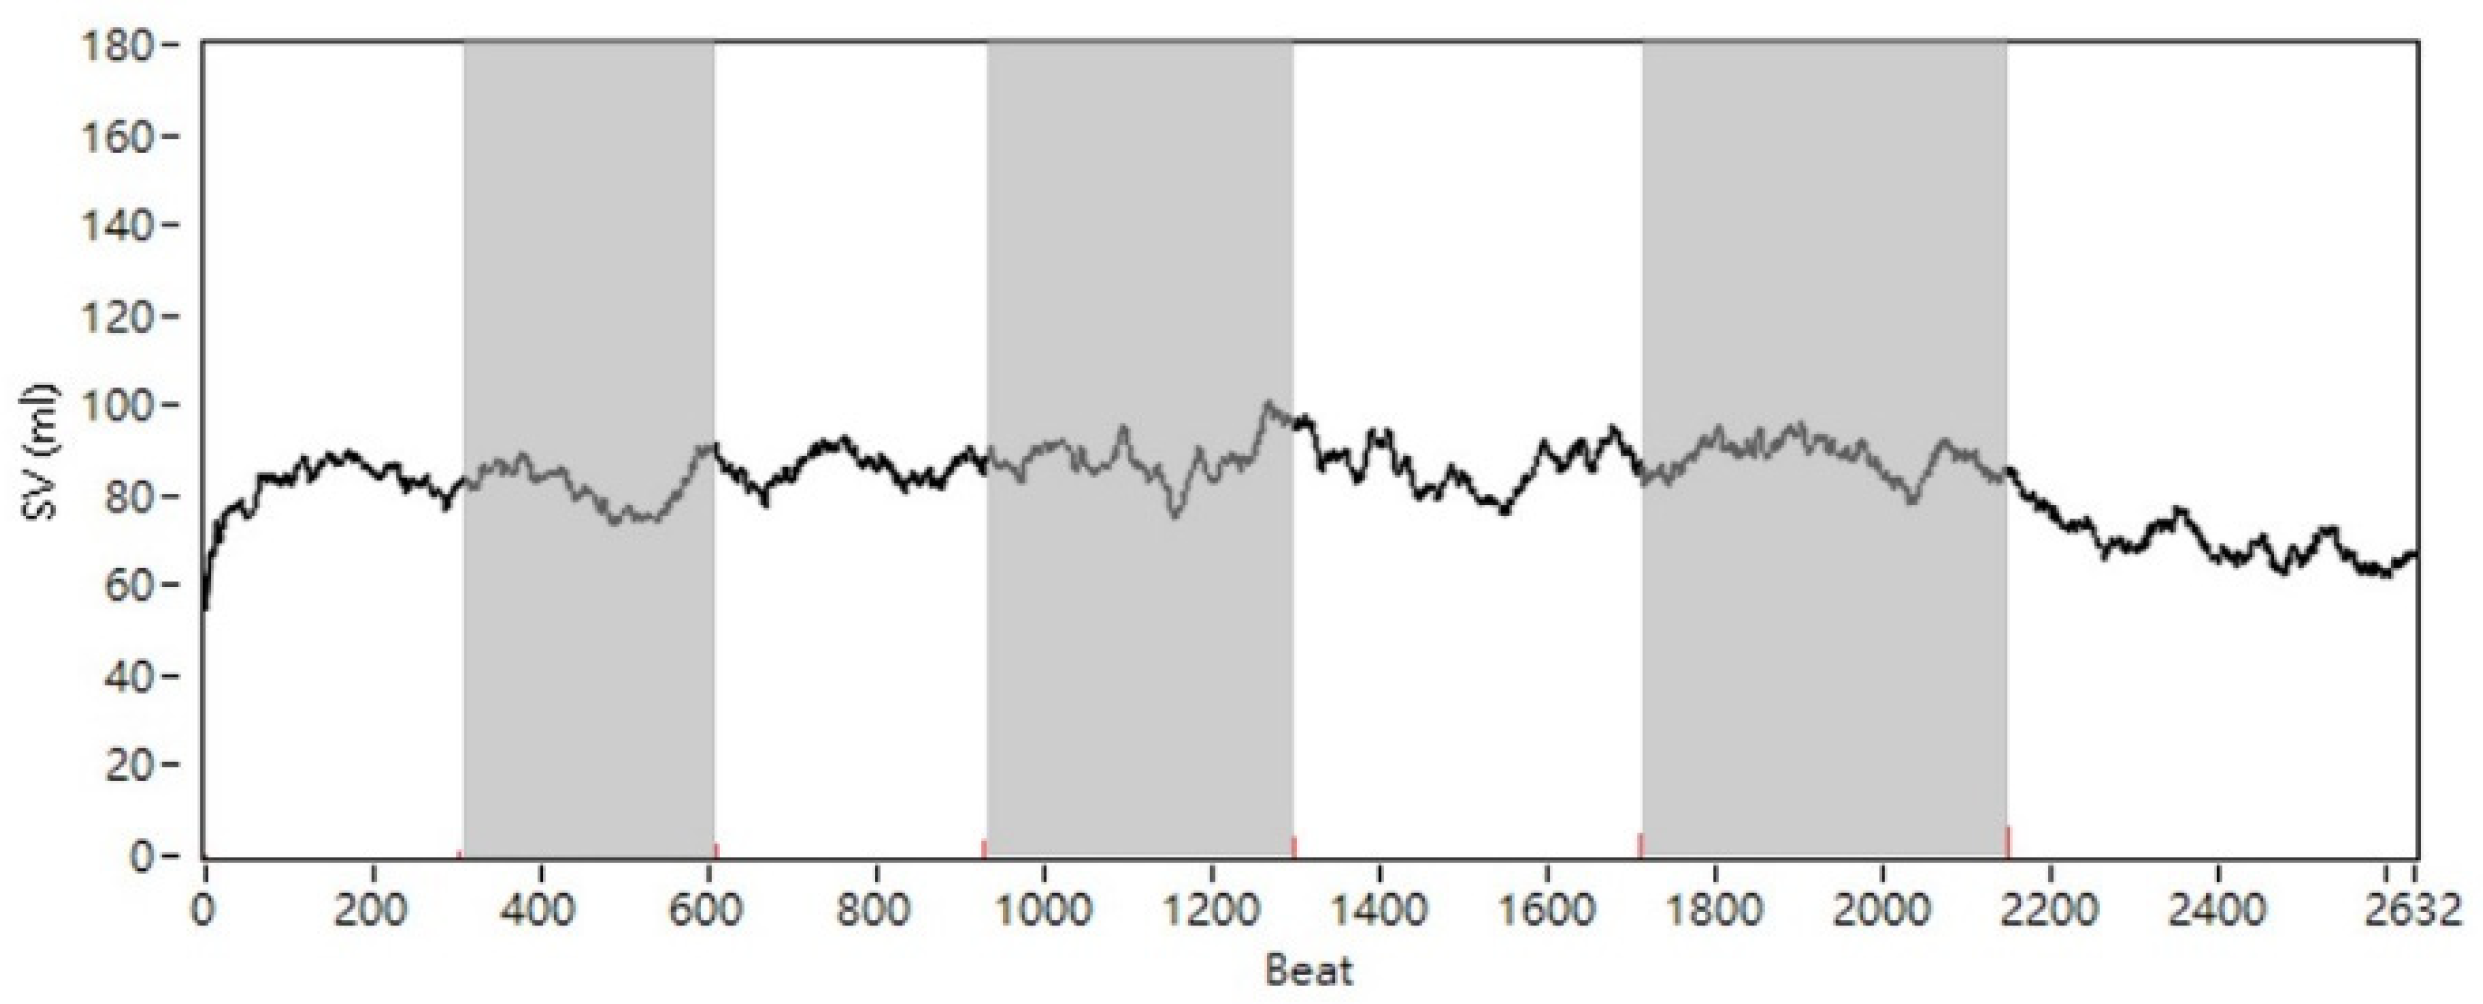
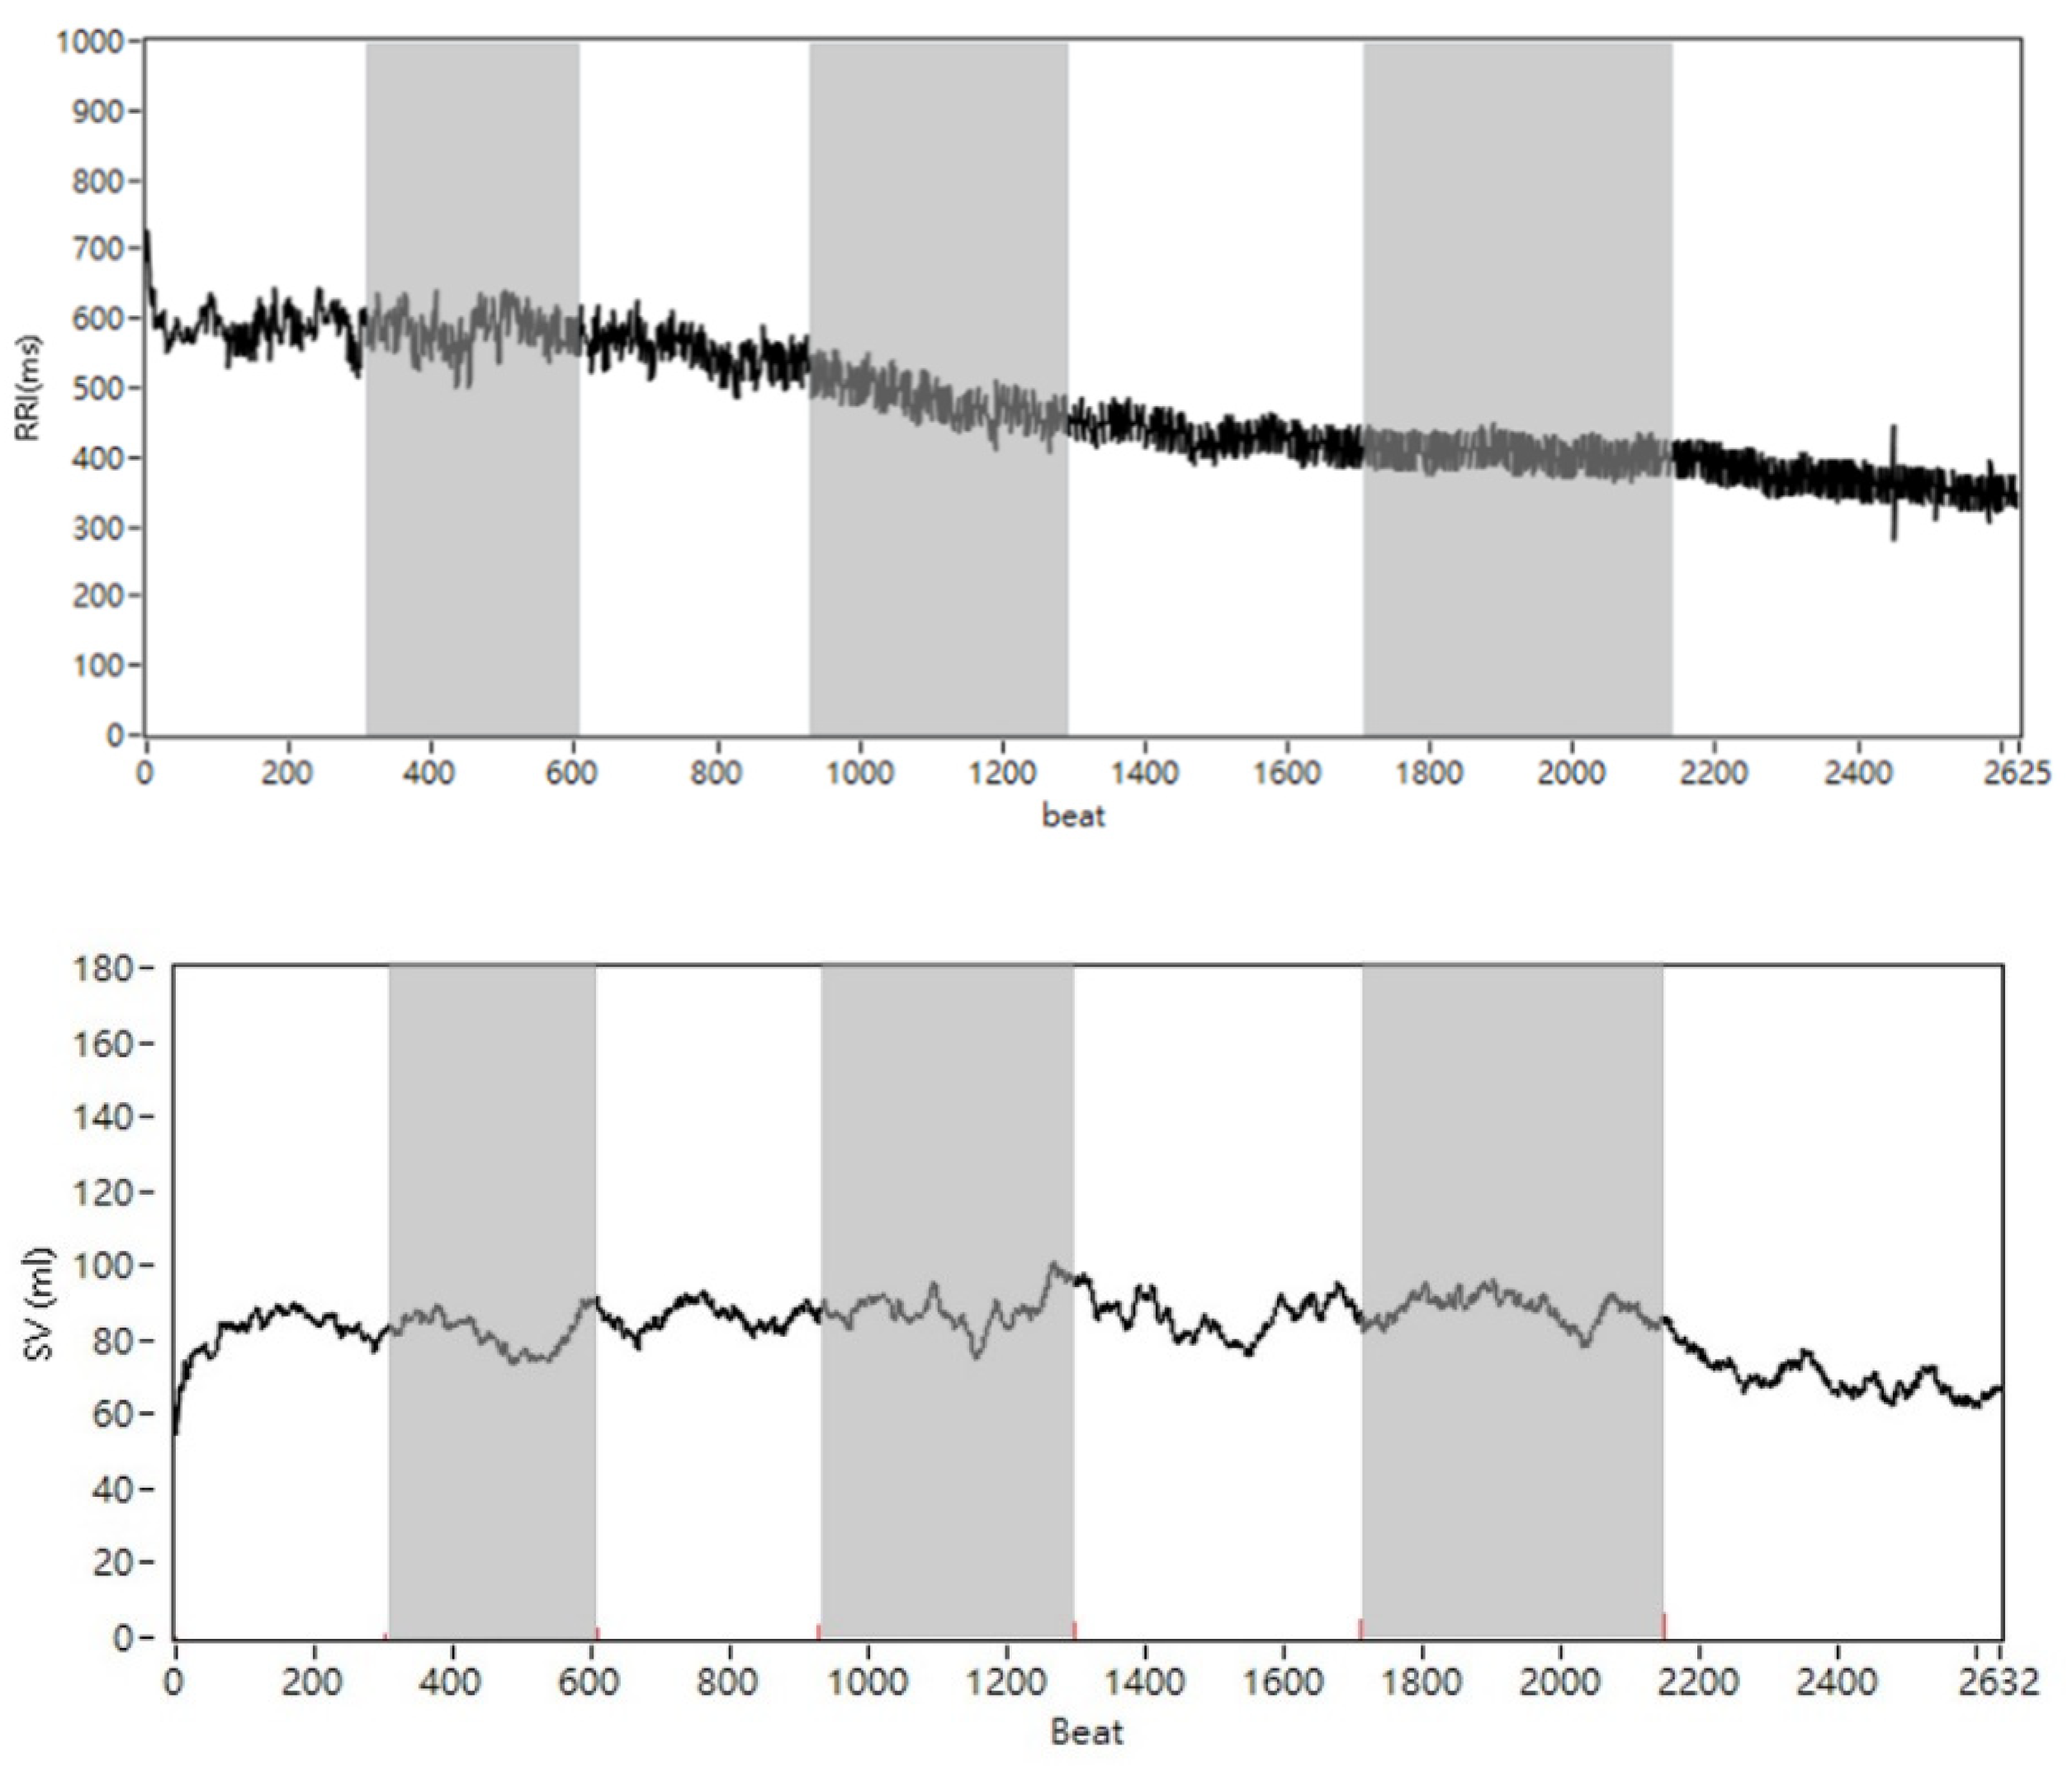
Owing to motion artifacts on impendence acquisition, the missing points of the RR interval and SV series would occur during the riding stages. If the HR was >200 bpm, the index of the R peak and adjacent SV was recalculated through interpolation. A beat-domain demonstration of the RR interval and SV series for patient #9 is shown in Figure 3. The CO(=SV × HR) series was calculated per beat, and the mean and standard deviation (SD) of SV, HR, and CO were calculated per stage. The maximum of (max) and the minimum of (min) were taken as a reference for the last and initial stages. In addition, the maximum of (max) indicates an important stage, in which SV changes can be observed, and left ventricular volume enlargement can be speculated. According to the time-domain results, responses during rest and exercise were compared. The SVV phase may affect the correlation between the SVV and HRV. To determine the correlation between SVV and HRV, cross-correlation was used to test the correlation between the RR interval and SV series.
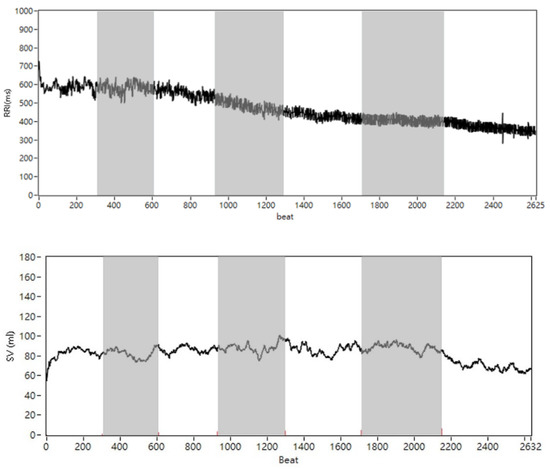
Figure 3.
The time-domain demonstration of RR interval (upper) and SV series (lower) for patient #9. The white and gray blocks represent each sequence stage.
In the frequency-domain analysis, the time sequences of SV and HR were analyzed using FFT, and the power spectrum was produced using spectral analysis. Based on the power spectrum, the power distribution was divided into HF (0.15–0.4 Hz) and LF (0.04–0.15 Hz) components, and both were reported as absolute values (ms2). The signal normalized from 0 to 100% is the conventional method in HRV analysis. They were reported in normalized units and were calculated as follows:
Normalized HF:
nHF = HF/(LF + HF)
Normalized LF:
nLF = LF/(LF + HF)
To determine the relationship between HRV and SVV, in addition to the conventional bandwidth, the power of different ranges of bandwidths in SVV was calculated to compare with the power of HF and LF in HRV. SVV LF bands were scanned from 0.03 to 0.15 Hz and HF was scanned from 0.2 to 0.4 Hz. The minimum resolution of the scanning LF bandwidth was 0.001, and that of the scanning HF bandwidth was 0.002.
2.5. Statistical Analysis
Data were analyzed using descriptive statistical methods (mean, SD, and median). Statistical analyses were performed using SPSS (SPSS Statistics 22, International Business Machines Corporation, Armonk, NY, USA) and LabVIEW (LabVIEW 2019, National Instruments Corp., Austin, TX, USA). The Wilcoxon test was used to test statistically significant differences between the effects of the response during exercise on the frequency component, and the SV, HR, and CO changes were compared at each stage. The correlation coefficient between HRV and SVV was calculated using the Spearman’s correlation coefficient. Statistical significance was set at p < 0.05.
3. Results
3.1. Participant Characteristics
Table 1 shows the participant characteristics (mean, SD, and median) and the final stage during cycling. The seventh and sixth of the final stage in the male and female groups presented a physical load of 175 and 150 W, respectively.

Table 1.
The phenotype information of all participants.
3.2. The Time-Domain Result
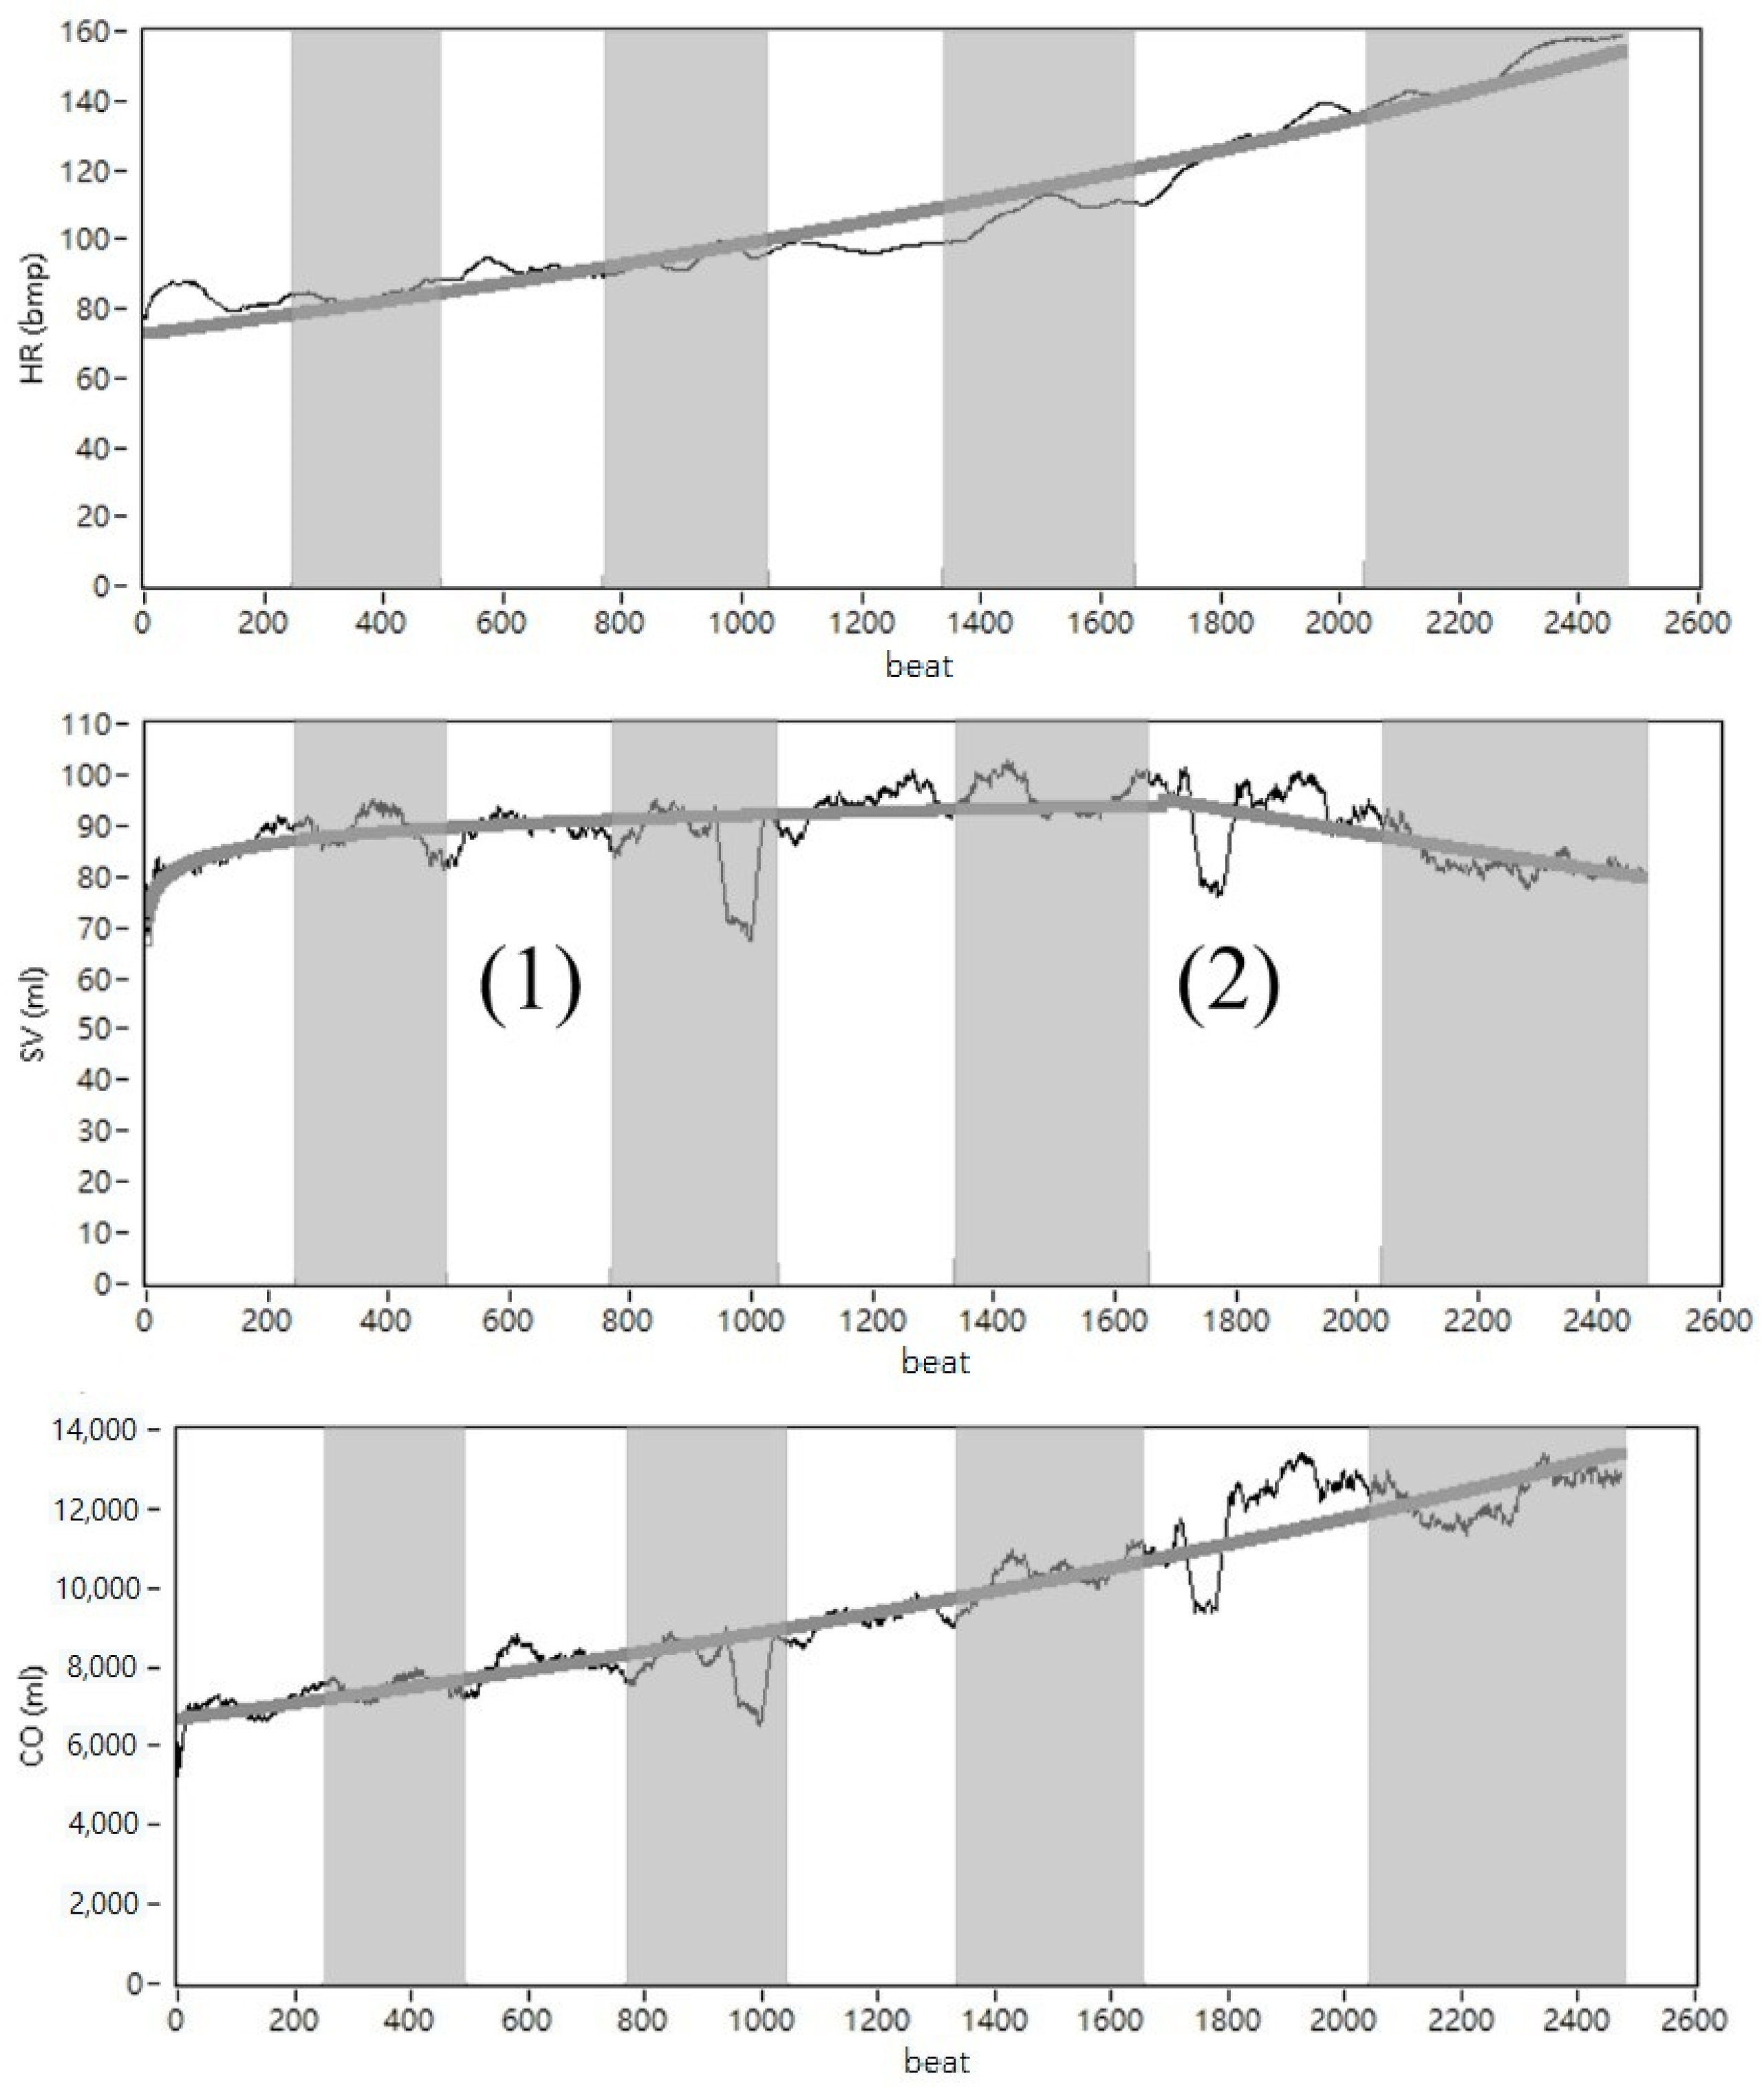
To observe the stage-variance trend of HR, SV, and CO during incremental exercise, the acquired data were expressed on the heartbeat cycle scale in this study. We used patient #24 as a reference. Figure 4 (upper) shows patient #25’s rising HR without exceeding the maximum heart rate of 220–22 (patient #25 was 22 years old). The SV in Figure 4 (middle) increased from the first to sixth stages and decreased from the sixth to the eighth (final) stage. As SV and HR increased, CO (=HR × SV) also increased. The results are shown in Figure 4 (lower). Curve fitting was used to investigate the trends in HR, SV, and CO. The fitting methods were based on calculating the root-mean-square error (RMSE). The fitting method of SV was log fitting, and the fitting methods of HR and CO were power fitting. The curve fitting of SV was divided into two stages: (1) The SV increased gradually as time increased to a maximum value; (2) Showing that SV decreases from the maximum value.
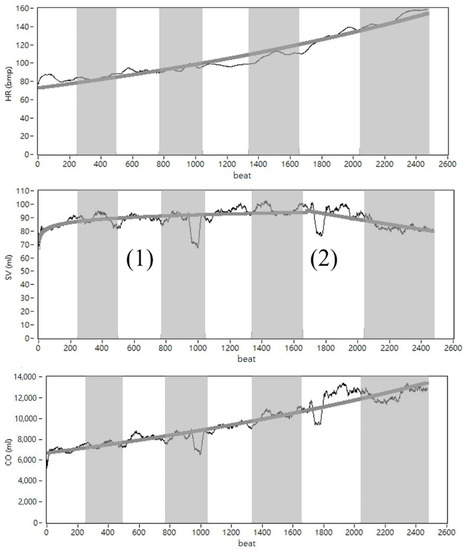
Figure 4.
The beat-domain demonstration of HR (upper), SV (middle), and CO (lower) for patient #25. The white and gray blocks represent each sequence stage.
3.3. Figures, Tables and Schemes
The mean values of the three-min data of each stage was merged into the line chart and is presented in Figure 5. The mean of HR increased from 87.87 to 148.96 bpm, the mean of SV increased 85.52 to 96.20 mL (6th stage) and decreased to 82.51 mL (final stage), and the mean CO increased from 7086.86 to 10,480.96 mL/min.
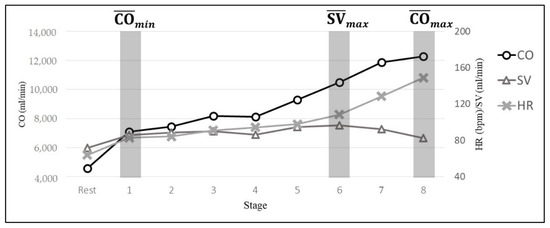
Figure 5.
The line chart of patient parameters during incremental physical load. Example from patient #25.
3.4. Results of the Frequency-Domain
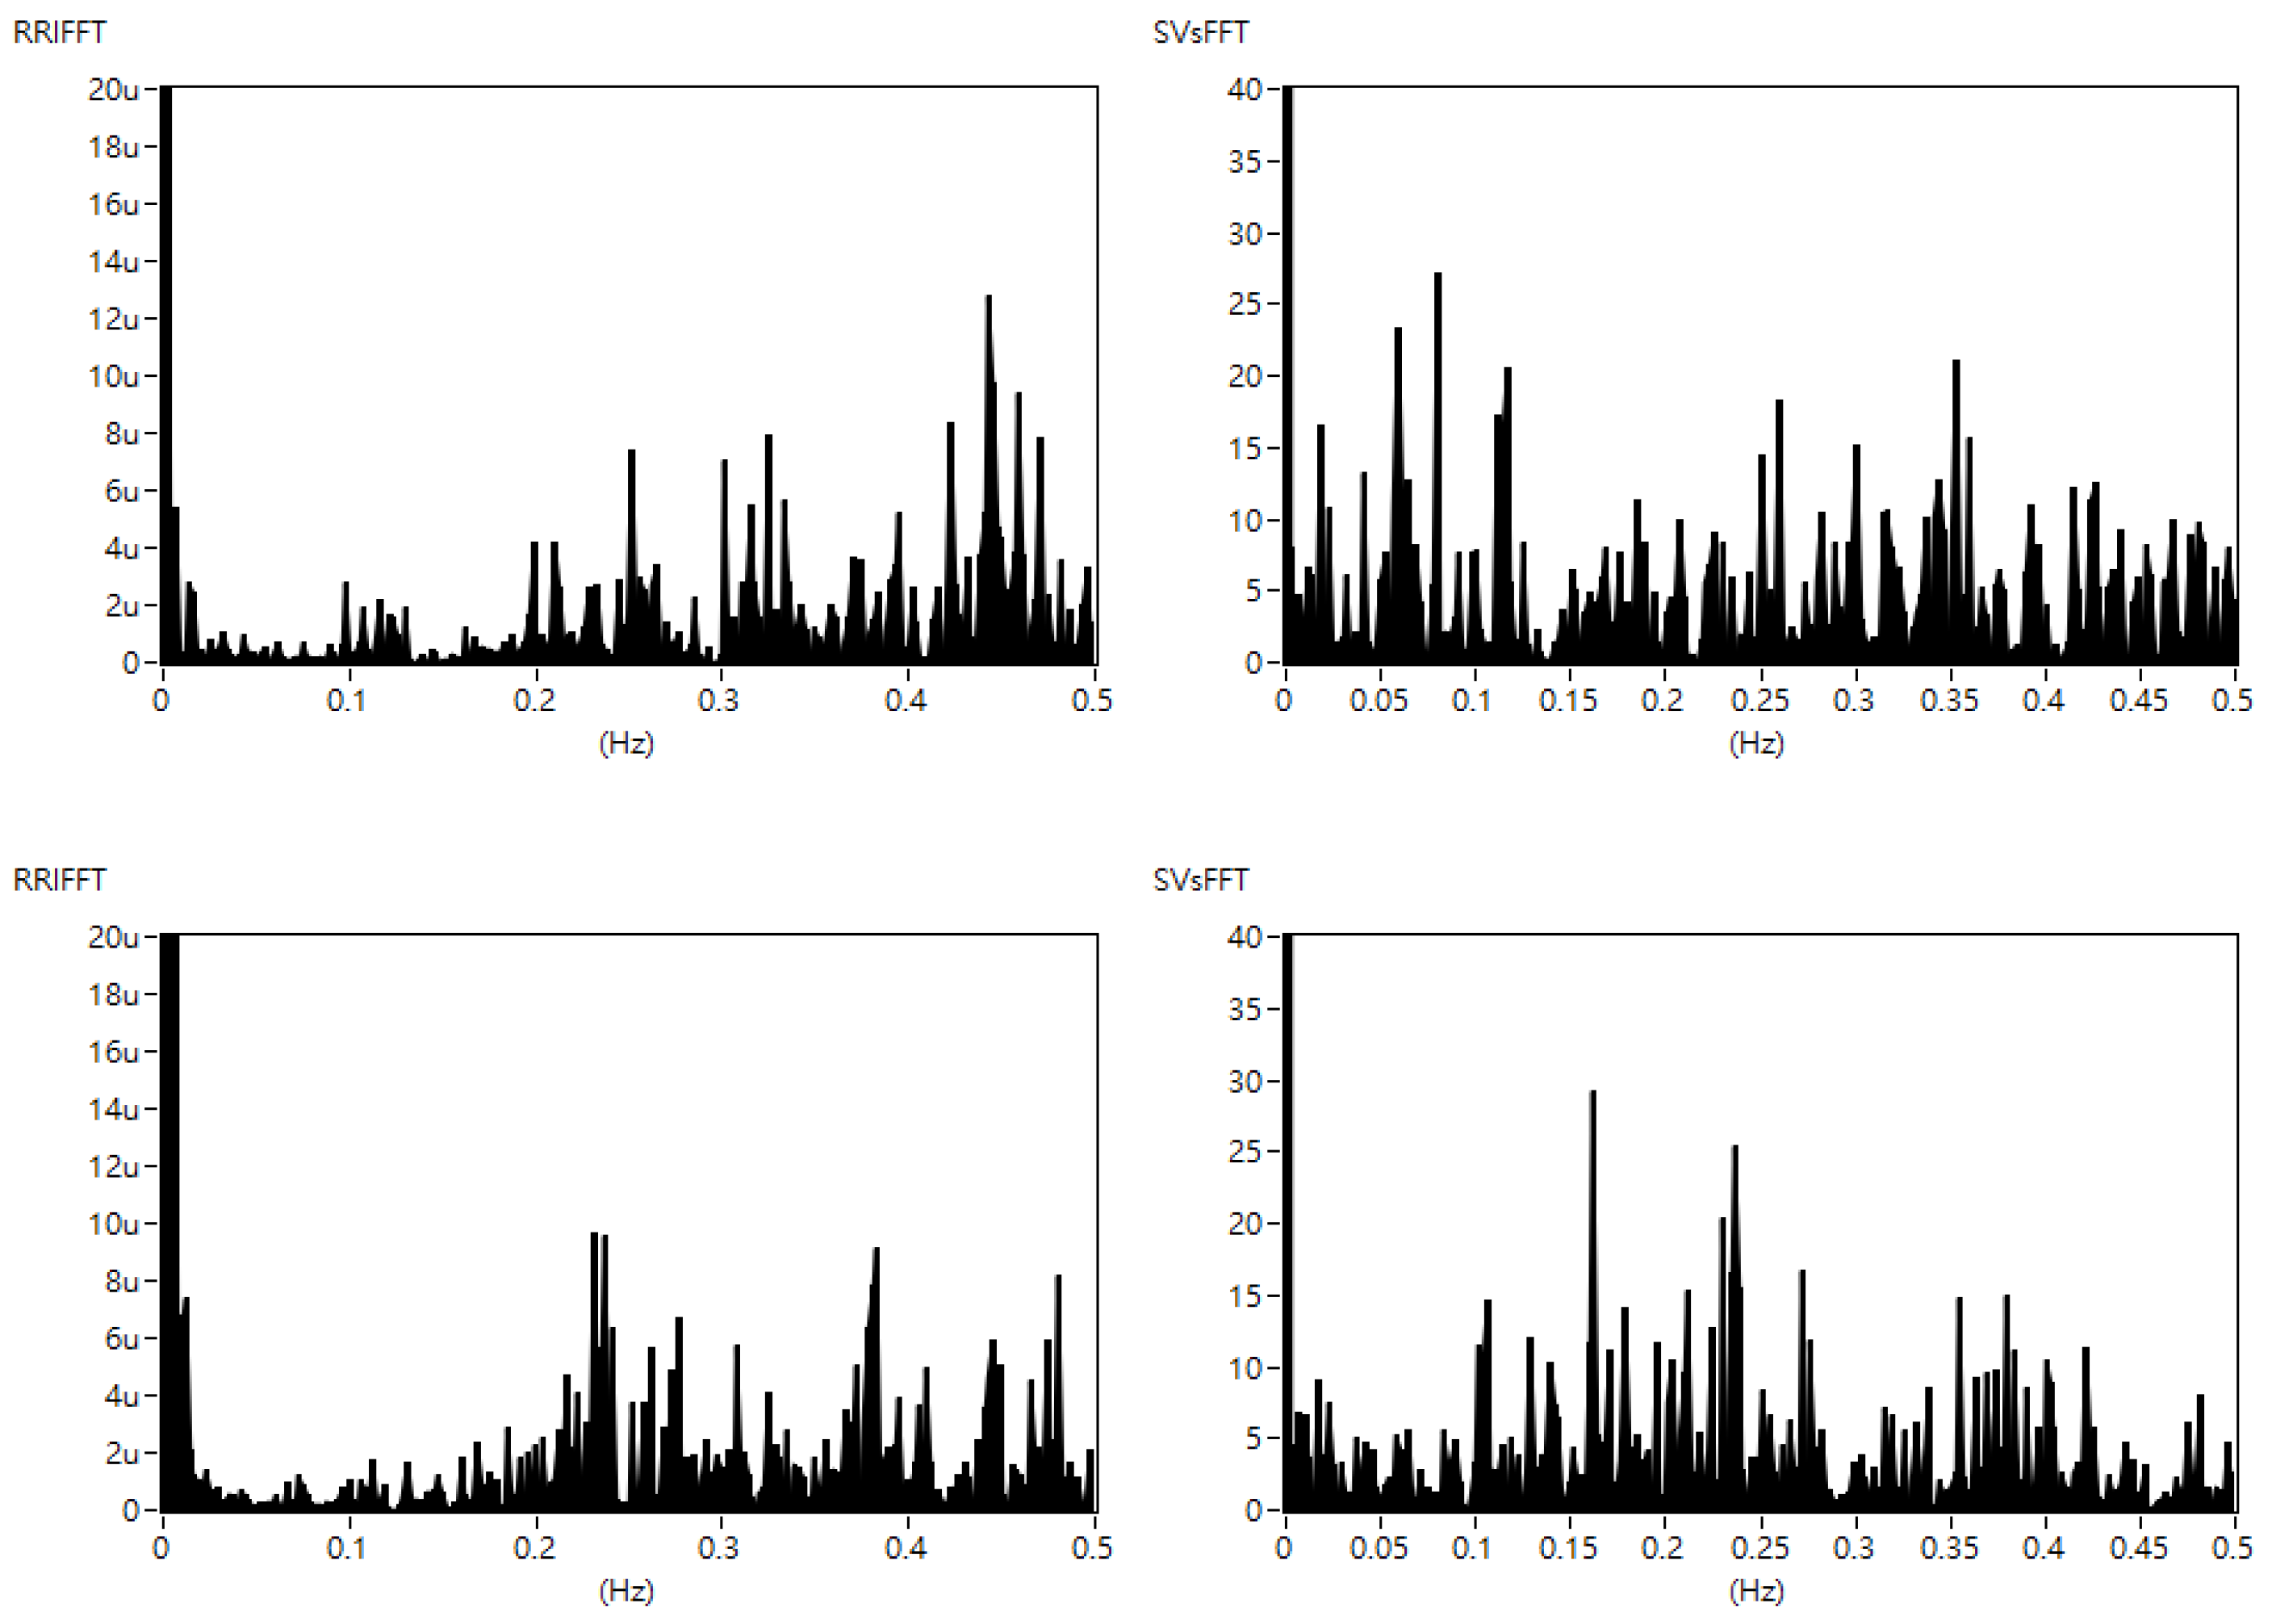
The demonstration of the frequency-domain of the RR interval and SV series for patient #9 in the sixth and seventh (ACP) stages is shown in Figure 6. To observe the changes in LF and HF components during the rest and exercise stages, spectral analysis of HRV and SVV was performed in this experiment. The results are shown in Figure 7. As shown in Figure 7, the nLF in HRV had a turning point in the sixth stage. The nLF in HRV was lower than 50%, and the nHF in HRV was greater than 50%. The nLF in the SVV was lower than that in the SVV during the rest and exercise stages.
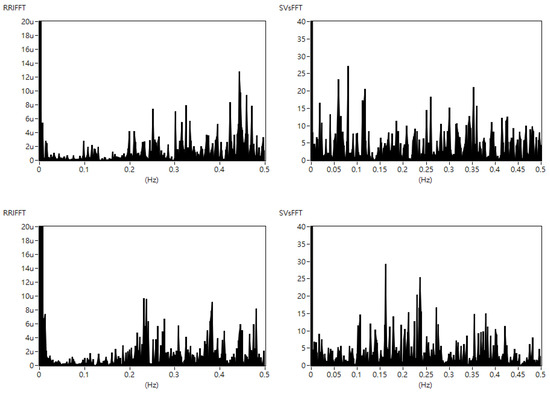
Figure 6.
The frequency-domain of RR interval (left) and SV series (right) for patient #9 in the sixth stage (upper) and the seventh (ACP) stage (lower).
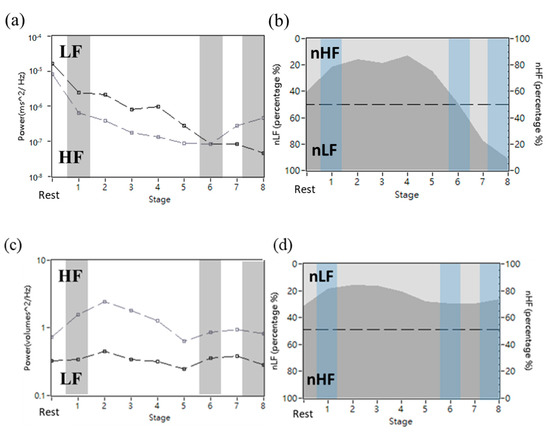
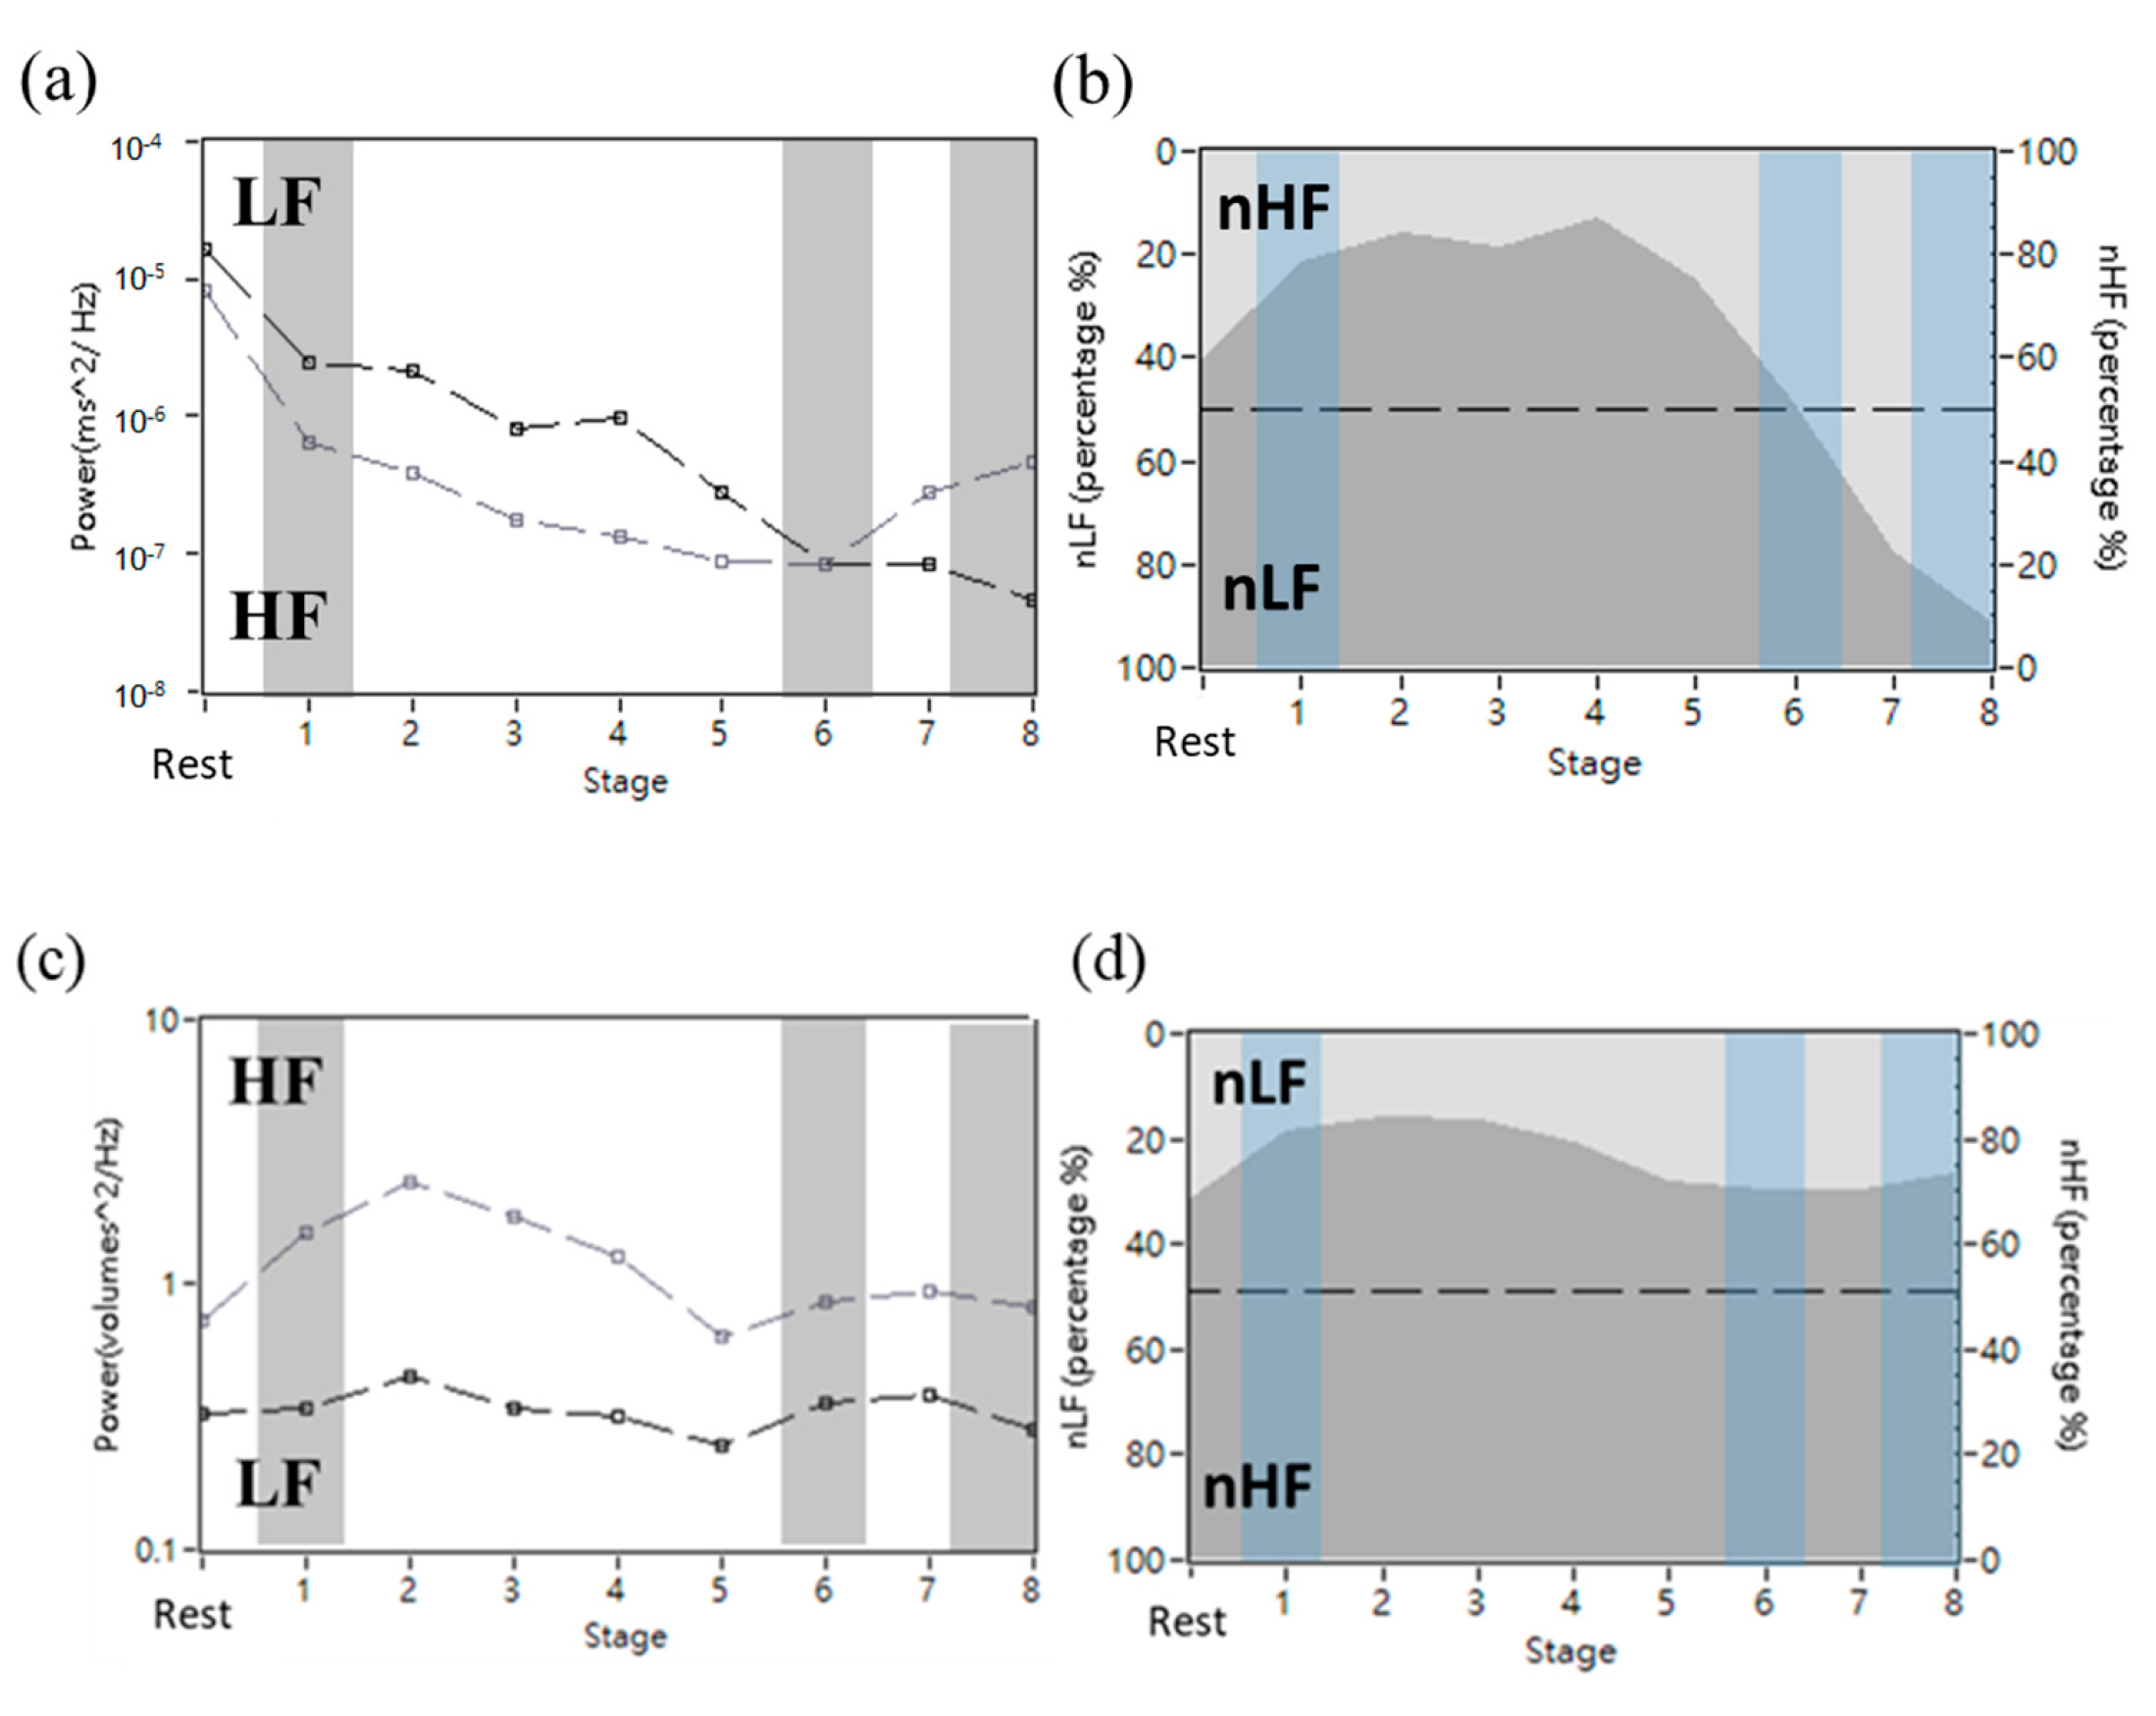
Figure 7.
HRV and SVV power spectrum in the rest and exercise stages. (a,b) were HRV power spectrum. (c,d) were SVV power spectrum. (a,c) had LF and HF power. (b,d) were processed by normalization and were expressed as percentage units. Example from patient #25.
3.5. Statistical Result
The results of HR, SV, and CO for all patients were calculated using the mean and standard deviation in each stage, and are shown in Table 2. In HR, the value increased from rest to the max stage (81 to 150 bpm). In SV, the value increased from rest to the max stage (71.70 to 78.26 mL) and decreased from the max to max stage. Although the SV decreased, the CO increased (5827.31 to 10,575.43 mL/min). According to the paired t-test results, all parameters at different stages were significantly different (p < 0.05), except for the comparison of SV at rest and the min stage.
Table 2.
The result of heart rate (HR), stroke volume (SV), and cardiac output (CO) at different stages during incremental exercise and rest.
The results of LF and HF in HRV and SVV for all patients were calculated by μ and SD in each stage, and are shown in Table 3. In HRV, the nLF was decreased from rest to the max stage (68.24% to 25.01%). The nHF of HRV was increased (31.76% to 74.99%). In SVV, the nLF increased from rest to the max stage (28.64% to 30.12%). The nHF in SVV was decreased (71.36% to 69.88%). According to the paired t-test results, nLF and nHF in HRV in the min to max stages and the max to max stages were significantly different (p < 0.05).
Table 3.
The result and comparison of normalized low frequency (nLF) and high frequency (nHF) with heart rate variability (HRV) and stroke volume variability (SVV) in different stages during incremental exercise and rest.
3.6. Correlation Coefficient Result
The results of the cross-correlation between SVV and HRV are shown in Table 4. Through time and frequency analysis, we aimed to identify an indicator for distinguishing the normal stage (S1), last stage before ACP (S2), and ACP stage (S3) during incremental exercise with different physical loads. The results showed that the SVV maximum cross-correlation of S2 was significantly greater (p < 0.05) than that of S1 (0.91 to 0.87), and that of S2 was also significantly lower (p < 0.05) than that of S3 (0.87 to 0.60).
Table 4.
The maximum r-value per stage using cross correlation coefficient in normal stages, the last stage before aerobic capability plateau (APC), and the APC stage.
To find the greatest correlation coefficient (r-value) between SVV and HRV in the frequency-domain analysis, the results of scanning the bandwidth LF from 0.03 to 0.15 Hz and HF from 0.2 to 0.4 Hz are shown in Table 5. The median distribution for LF was 0.035–0.11 and for HF was 0.11~0.29.
Table 5.
The bandwidth of the best correlation coefficient in each patient (low frequency [LF] and high frequency [HF]).
The highest r-values for each patient using different bandwidths are listed in Table 6. The greatest r-value median HF was 0.91 and LF was 0.73. The greatest HF was 0.94 and LF was 0.81. The greatest coefficient of determination of HF was 0.88 and LF was 0.65.
Table 6.
The correlation coefficient and coefficient of determination in different SVV bandwidth (low frequency [LF] and high frequency [HF]).
According to the results in Table 5, the SVVs in different bandwidths were compared with the HRV bandwidth (LF: 0.04–0.15, HF: 0.15–0.4). The spectral analysis of all the participants using the same bandwidth results is presented in Table 7. The first row bandwidth was the HRV bandwidth (LF: 0.04–0.15, HF: 0.15–0.4), and the second row was the bandwidth we tested (LF: 0.035–0.13, HF: 0.13–0.28). The results of the bandwidth we tested showed that the r-value of LF (0.12 to 0.46 Hz) and HF (0.10 to 0.31 Hz) was significantly greater (p < 0.05) than the HRV bandwidth; the coefficient of the of LF (0.37 to 0.53 Hz) and HF (0.30 to 0.58 Hz) was significantly greater (p < 0.05) than the HRV bandwidth; and the coefficient of determination (r2) of LF (0.14 to 0.28) was significantly greater (p < 0.05) than the HRV bandwidth.
Table 7.
The correlation between stroke volume variability (SVV) and heart rate variability (HRV) in all stages with different SVV bandwidths (Original bandwidth: LF: 0.04–0.15, HF: 0.15–0.4; New bandwidth: LF: 0.035–0.13, HF: 0.13–0.28) (low frequency [LF] and high frequency [HF]).
To find an indicator of physical load, the correlation between SVV and HRV in all stages without ACP stages (S1 + S2) and all stages (S1 + S2 + S3) in the bandwidth (LF: 0.035~0.13, HF: 0.13~0.28) were compared. The of HF (0.53 to 0.82 Hz) and LF (0.58 to 0.80 Hz) in the stages without ACP (S1 + S2) were significantly greater (p < 0.05) than those in all stages (S1 + S2 + S3), and the coefficient of determination (r2) in the stages without ACP (S1 + S2) of LF (0.28 to 0.66 Hz) and HF (0.34 to 0.64 Hz) was significantly greater (p < 0.05) than those in all stages.
4. Discussion
In 1964, Åstrand applied the invasive dye dilution method to CO measurement, the non-invasive ECG method to HR measurement, and the Douglas Bag method for oxygen uptake estimation. To normalize individual differences, the results were expressed as the percentage, with which all parameters were going to a maximum of 100%, and showed that the HR, SV, and CO were increased during incremental exercise, with SV increasing during the initial stage. The results also showed that the SV reached a maximum value and HR reached 110 bpm at 40% of maximal oxygen uptake [26].
The results of this study are presented in Table 2. In the initial state (rest to min stage), HR and CO increased significantly (p < 0.05), but SV decreased significantly (p < 0.05). In the middle stage (min to max stage), the HR increased, and the SV increased significantly (p < 0.05). At this stage, the HR gradually increased and the SV increased significantly to a maximum. The returned blood filled the left ventricle and the CO increased significantly. At this time, the physical load was 75 W and SV reached 100%. In the ACP stage (max to max stage), the HR increased significantly (p < 0.05), however, SV decreased significantly (p < 0.05). The maximum physical load was 150 W; HR still increased. SV decreased (100% to 89.86%) in the ACP stage. According to these results, heart pumping accelerated, and reflux blood failed to fill the left ventricle. Although a decrease in the SV was observed, the CO increased. SV did not increase when the physical load increased.
It had been pointed out that HRV could reflect SNS and PNS regulation. The LF energy is related to SNS and PNS activities. Moreover, HF energy is also related to PNS activity [22]. In sports-medicine research, Robinson pointed out that CO is regulated by heart regulation and not by blood pressure or blood volume. In the initial stage, HR increases owing to the withdrawal of PNS activity [27]. Perini et al. performed HRV analysis during exercise. The nLF and nHF power, LF/HF ratio, and oxygen uptake were analyzed in HRV during the rest, initial, middle, and fatigue stages of exercise. The results highlighted that the nLF power increased during low exercise-intensity. nLF decreased when oxygen uptake increased in oxygen uptake over 30%. nHF power during exercise was higher than that during rest [28]. Liu et al., applied SVV and HRV analysis and investigated their difference in the sitting position. They used ultrasound imaging to measure the left ventricular volume at rest in the sitting position to calculate the SV in each heartbeat. The SVV was analyzed and calculated in the same bandwidth as the HRV. Regression analysis was applied for nLF and nHF in SVV and HRV calculations [18].
The results of this study are presented in Table 2. In the initial stage, the nLF in HRV decreased, the nHF increased, and the LF/HF ratio decreased (from 3.54 to 3.02). The LF component was higher, which can be regarded as a response to the decreased PNS activity during the initial stage. In addition, there was no significant difference between the nLF at rest and the min stage, with a p-value of 0.29. In the SVV part, the nLF from the rest to the min stage was analyzed using a paired t-test. The p value was 0.70, indicating no significant difference. In the middle stage of exercise, nLF in HRV continued to decline, nHF increased, and the LF/HF ratio dropped to 1.72, which can be regarded as the result of a surge in SNS activity. The p-value was 0.001 between the min and the max stage, and indicated a significant difference. In the SVV section, the nLF and min to the max stage were analyzed using a paired t-test, a p-value of 0.80 was obtained, indicating no significant difference. In the ACP stage, the nLF in HRV decreased significantly, and the nHF increased significantly. There was a significant difference in the nLF between max and max stages (p = 0.001). There was still no significant difference in nLF in the SVV region (p = 0.87). Since this ACP period is during the post-exercise period, the reason for the significant increase in nHF was not only related to PNS, but also to exercise type and breathing. In another study, Samuel designed an experiment, in which patients were asked to perform high-intensity pedaling. The HR of the participants was measured during exercise. HRV analysis and comparison with respiratory frequency were performed using regression analysis. According to the results of the regression analysis between the HF and very high frequency spectrum and respiratory frequency, it was found that HF energy gradually increased, and respiratory frequency also increased with the duration of exercise. It is believed that HF energy is related to the respiratory frequency [29,30]. It is inferred that the increase in HF at this stage is not only caused by PNS, but may also be caused by the increase in respiratory frequency in the later stage of exercise. The results showed that LF and HF in SVV and HRV were not related, and that the LF/HF ratio in SVV was lower than that in HRV.
The correlation between HRV and SVV has been investigated in a previous study [18], which showed that the LF/HF ratios of the SVV and HRV were significantly different. There were some variables that affected the correlation between SVV and HRV, including phase in the time-domain analysis and bandwidth in the frequency-domain analysis. Cross-correlation tests can be used to measure the correlation between signals with a phase difference. Therefore, this study used cross-correlation analysis to test the correlation between SVV and HRV. We aimed to identify an indicator for distinguishing the normal stage (S1), the last stage before ACP (S2), and the ACP stage (S3) during incremental exercise with different physical loads. The results shown in Table 4 indicate that the SVV maximum cross-correlation of S2 was significantly greater (p < 0.05) than that of S1 (0.91 to 0.87), and that of S2 was also significantly lower (p < 0.05) than that of S3 (0.87 to 0.60). The decrease in the correlation between SVV and HRV can be used to assess whether the body has reached its maximum physical load. The ACP stage can be determined by the maximum SV value, and this finding can be used to predict the period before ACP to avoid ACP from occurring. Training with submaximal physical loads for extended periods of time is the most effective way, and it is especially important to avoid exhaustion during the ACP stage [9]. These findings can be used as a guideline for exercise healthcare. Pausing or reducing the load of exercise before entering the ACP could effectively reduce the risk of myocardial injury [10,11,12].
To our knowledge, this study is the first to examine the correlation between SVV bandwidth and HRV using spectral analysis. In previous studies, the bandwidth of SVV was the same as that of HRV [23]. However, the correlation between SVV and HRV was not statistically significant. We speculated that the heart may respond differently to HRV and SVV. To find the greatest r-value between SVV and HRV spectrum of SVV, LF was scanned from 0.03 to 0.15 Hz and HF from 0.2 to 0.4 Hz, and the best correlation coefficient (r-value) on each patient with different bandwidths is shown in Table 6. The highest correlation coefficient (r-values) for each participant is shown in Table 7. It can be found that although the optimal bandwidth of each person is not the same, the median distribution of LF was 0.035 to 0.11 and that of HF was roughly 0.11 to 0.29. The median value of the greatest correlation coefficient (r-value) for HF was 0.91 and for LF was 0.73. The greatest HF was 0.94 and LF was 0.81. The greatest coefficient of determination (r2) for HF was 0.88 and for LF was 0.65. Based on the results, HRV and SVV were highly correlated. We speculate that SVV and HRV had synchronization and might apply a different bandwidth with HRV bandwidth (LF: 0.04–0.15, HF: 0.15–0.4).
The SVV in different bandwidths was compared with the HRV bandwidth (LF: 0.04–0.15 and HF: 0.15–0.4) and is shown in Table 7. The results showed that the bandwidth we test at r-values of LF (0.12 to 0.46) and HF (0.10 to 0.31) are significantly greater (p < 0.05) than the HRV bandwidth, the coefficient of of LF (0.37 to 0.53) and HF (0.30 to 0.58) were significantly greater (p < 0.05) than the HRV bandwidth, and the coefficient of determination (r2) of LF (0.14 to 0.28 Hz) was significantly greater (p < 0.05) than the HRV bandwidth.
ANS affects cardiovascular responses, such as HR and SV, resulting in HRV and SVV in spectral analysis. However, the spectral analysis of SVV was significantly different from HRV in past studies, which suggested that SVV and HRV provide different information on the ANS [23]. In the time-domain analysis of this study, the cross-correlation analysis results showed that the maximum r-value of the analysis after deducting the phase was highly correlated. The results of this study showed that the r-value between the different bandwidths of SVV and HRV showed a weak-to-moderate correlation, and the |r-value| between the different bandwidths of SVV and HRV showed a moderate correlation. According to the results, we suggest that SVV is related to HRV, however, SVV and HRV are reflected in the ANS in different bandwidths and phases. To find an indicator to distinguish between the normal stage (S1), the last stage before ACP (S2), and the ACP stage (S3) during incremental exercise in the same bandwidth (LF: 0.035~0.13 and HF: 0.13~0.28) with different physical loads, the results of the spectrum analysis are shown in Table 8. The r-values of HF (0.53 to 0.82) and LF (0.58 to 0.80) in the stages without ACP (S1 + S2) were significantly greater (p < 0.05) than those in all stages (S1 + S2 + S3), and the coefficient of determination (r2) in the stages without ACP (S1 + S2) of LF (0.28 to 0.66) and HF (0.34 to 0.64) were significantly greater (p < 0.05) than those in all stages. This result indicates that the r-value of the ACP stage significantly affects the synchrony between SVV and HRV. Combined with the results of the time-domain analysis, the decrease in the correlation between SVV and HRV can be used to assess whether the body has reached its maximum physical load. A potential myocardial injury is induced by intensive sporting activities during ACP [10]. In addition, problems with the heart’s condition during long-term ACP exercise have been identified [11]. Intensive sporting activities should be stopped to avoid ventricular tachycardia or fibrillation during the exercise period (ACP) of the maximum physical load when the synchrony between SVV and HRV decreases. These findings can serve as a guideline for exercise healthcare. Pausing or reducing the exercise load before entering the ACP stage can effectively reduce the risk of myocardial injury [12].
Table 8.
The correlation between stroke volume variability (SVV) and heart rate variability (HRV) in all stage without aerobic capability plateau (ACP) stages of SVV bandwidth (low frequency [LF]: 0.035~0.13, high frequency [HF]: 0.13~0.28).
Limitation
This study has several limitations that are listed below:
1. Experimental design: Due to the rapid use of noninvasive technology in the development of sports medicine, many incremental exercises have been performed for different exercise patterns. A bicycle was used in this study. The experimental design, such as riding at a fixed time and increasing the intensity sequentially, allowed the patient to attain maximum oxygen uptake until fatigue. However, cycling is a common choice for exercise training. That said, the experimental process revealed that the riding process of those who had experience riding bicycles was different from that of inexperienced individuals. However, whether customary experimental forms such as treadmills and step climbing could be used to observe cardiopulmonary control ability during exercise can be included in future work;
2. Measurement environment: In the experimental environment, there was 60 Hz noise and an unstable power supply voltage, which caused a displacement signal of the chest and abdomen measured by the RIP belts and resulted in missing data. The use of a stabilized, uninterrupted power system provided a stable power supply and improved the experimental environment. In addition, to avoid the influence of physiological regulation caused by the experimental environment, the experiment was arranged in an indoor controllable environment;
3. Recruiting patients: Individual differences were observed between the recruited patients and those who had completed the experiment. The experiment required the patient to ride a bicycle until fatigue occurred, rather than the maximum oxygen uptake. However, when riding a bicycle, the legs of some participants could cause psychological effects, and when the pedaling rhythm did not meet the experimental requirements, the patient’s response would become fatigued. When the physiological signals were checked later, it was found that the maximum heartbeat was not reached. When recruiting test patients, one should consider recruiting a specific group of people, for example, people with a certain riding experience, people who could stabilize the rhythm or get used to high pedaling frequency, or design a two-stage experiment. The trainees were first fully trained, rested for a while, and then repeated the experiment to observe self-differentiation and reduce individual differences.
5. Conclusions
An incremental cycle experiment was designed, and 30 patients were recruited to participate in this experiment. This study aimed to find an indicator for the physical load of the body during incremental exercise and investigate the relationship between SVV and HRV during the incremental cycle experiment by ICG. We also explored HRV and SVV by FFT to investigate the response in the nervous system.
In the initial and middle stages, the HR continued to rise, SV initially declined and then increased, and CO continued to increase. In addition, the nLF energy in HRV was greater than the nHF energy, which suggests that the activity of SNS is greater than that of PNS. In the ACP stage, HR continued to increase, SV decreased, and CO showed a slow upward trend. According to these results, it can be inferred that SV is not an unlimited increment. Although SV decreased and CO continued to show an upward trend. It was inferred that the myocardium expanded to a certain volume during the exercise. If it could not increase, the heart rate was increased to maintain the rise of CO.
In the time domain analysis, the maximum cross-correlation r-value of the last stage before ACP (S2), between SV variability (SVV) and HR variability (HRV), was significantly greater than that of the normal stage (S1) and significantly lower than that of the ACP stage (S3). The spectral analysis correlation coefficient between SVV and HRV would be greater if the stages preceding the ACP stage were calculated, instead of all stages. The correlation coefficient r-value between SVV and HRV at different bandwidths was greater than the HRV bandwidth.
We suggest that SVV is related to HRV, however, SVV and HRV are reflected in the ANS in different bandwidths and phases. The result of the cross-correlation was suitable for judging whether the patient had reached ACP. Furthermore, the spectral analysis of SVV and HRV was associated with reduced physical load. The decrease in the correlation between SVV and HRV can be used to assess whether the body has reached its maximum physical load. These findings can be used as a guideline for exercise healthcare. Pausing or reducing the exercise load before entering the ACP could effectively reduce the risk of myocardial injury. The time-domain and spectral analyses of SVV should be a useful indicator of the physical load of the body, which can provide valid information for healthcare.
Author Contributions
Conceptualization, W.-C.L.; software, Y.-H.L., W.-C.L., P.-H.H. and T.-C.H.; validation, P.-H.H. and T.-C.H.; formal analysis, Y.-H.L.; investigation, Y.-H.L. and W.-C.L.; resources, T.-C.H.; data curation, Y.-H.L. and W.-C.L.; writing—original draft preparation, Y.-H.L. and W.-C.L.; writing—review and editing, P.-H.H. and T.-C.H.; visualization, Y.-H.L.; supervision, T.-C.H. All authors have read and agreed to the published version of the manuscript.
Funding
This research was funded by Ministry of Science and Technology, Taiwan under grant numbers MOST109-2221-E-009-117-MY3. This work was supported by the Higher Education Sprout Project of the National Yang Ming Chiao Tung University and Ministry of Education (MOE).
Institutional Review Board Statement
The study was conducted in accordance with the Declaration of Helsinki, and approved by the Research Ethics Committee for Human Subject Protection (REC) at the National Chiao Tung University (NCTU-REC-107-092).
Informed Consent Statement
Informed consent was obtained from all subjects involved in the study.
Data Availability Statement
The data presented in this study are available on request from the corresponding author. The data are not publicly available due to the privacy of subjects.
Acknowledgments
Special thanks to Tom Lai for his experimental equipment and professional riding skills.
Conflicts of Interest
The authors declare no conflict of interest.
References
- Allender, S.; Cowburn, G.; Foster, C. Understanding participation in sport and physical activity among children and adults: A review of qualitative studies. Health Educ. Res. 2006, 21, 826–835. [Google Scholar] [CrossRef] [PubMed] [Green Version]
- Palacios-Ceña, D.; Fernandez-de-las-Peñas, C.; Hernández-Barrera, V.; Jiménez-Garcia, R.; Alonso-Blanco, C.; Carrasco-Garrido, P. Sports participation increased in Spain: A population-based time trend study of 21 381 adults in the years 2000, 2005 and 2010. Br. J. Sports Med. 2012, 46, 1137–1139. [Google Scholar] [CrossRef] [PubMed]
- Fox, S.I. Human Physiology, 12th ed.; McGraw-Hill: New York, NY, USA, 2011. [Google Scholar]
- Garlando, F.; Kohl, J.; Koller, E.A.; Pietsch, P. Effect of coupling the breathing and cycling rhythms on oxygen uptake during bicycle ergometry. Eur. J. Appl. Physiol. Occup. Physiol. 1985, 54, 497–501. [Google Scholar] [CrossRef] [PubMed]
- Daley, M.A.; Bramble, D.M.; Carrier, D.R. Impact loading and locomotor-respiratory coordination significantly influence breathing dynamics in running humans. PLoS ONE 2013, 8, e70752. [Google Scholar] [CrossRef] [Green Version]
- Formosa, D.P.; Sayer, M.G.; Burkett, B. Front crawl stroke-coordination and symmetry: A comparison between timing and net drag force protocols. J. Sports Sci. 2013, 31, 759–766. [Google Scholar] [CrossRef]
- Ganong, W.F. Review of Medical Physiology, 21st ed.; McGraw-Hill: New York, NY, USA, 2003. [Google Scholar]
- Stöhr, E.; González-Alonso, J.; Shave, R. Left ventricular mechanical limitations to stroke volume in healthy humans during incremental exercise. Am. J. Physiol.-Heart Circ. Physiol. 2011, 301, H478–H487. [Google Scholar] [CrossRef] [Green Version]
- Leischik, R.; Spelsberg, N. Endurance sport and “Cardiac Injury”: A prospective study of recreational ironman athletes. Int. J. Environ. Res. Public Health 2014, 11, 9082–9100. [Google Scholar] [CrossRef] [Green Version]
- O’Keefe, J.H.; Patil, H.R.; Lavie, C.J.; Magalski, A.; Vogel, R.A.; McCullough, P.A. Potential adverse cardiovascular effects from excessive endurance exercise. Mayo Clin. Proc. 2012, 87, 587–595. [Google Scholar] [CrossRef] [Green Version]
- George, K.P.; Wolfe, L.A.; Burggraf, G.W. The ‘athletic heart syndrome’. A critical review. Sports Med. 1991, 11, 300–331. [Google Scholar] [CrossRef]
- Leischik, R. Endurance Sport and Cardiac Injury. Kardiol. Pol. (Pol. Heart J.) 2014, 72, 587–597. [Google Scholar] [CrossRef]
- Kubicek, W.G.; Patterson, R.P.; Witsoe, D.A. Impedance cardiography as a noninvasive method of monitoring cardiac function and other parameters of the cardiovascular system. Ann. N. Y. Acad. Sci. 1970, 170, 724–732. [Google Scholar] [CrossRef]
- Kubicek, W.G. On the source of peak first time derivative (dZ/dt) during impedance cardiography. Ann. Biomed. Eng. 1989, 17, 459–462. [Google Scholar]
- Denniston, J.C.; Maher, J.T.; Reeves, J.T.; Cruz, J.C.; Cymerman, A.; Gover, R.F. Measurement of cardiac output by electrical impedance at rest and during exercise. J. Appl. Physiol. 1976, 40, 91–95. [Google Scholar] [CrossRef] [PubMed]
- Northridge, D.B.; Findlay, I.N.; Wilson, J.; Henderson, E.; Dargie, H.J. Non-invasie determination of cardiac output by Doppler echocardiography and electrical bioimpedance. Br. Heart J. 1990, 63, 93–97. [Google Scholar] [CrossRef] [Green Version]
- Naidu, S.M.M.; Bagal, U.R.; Pandey, P.C.; Hardas, S.; Khambete, N.D. Detection of characteristic points of impedance cardiogram and validation using Doppler echocardiography. In Proceedings of the 2014 Annual IEEE India Conference, Pune, India, 11–13 December 2014. [Google Scholar]
- Sebastian, T.; Pandey, P.C.; Naidu, S.M.M.; Pandey, V.K. Wavelet based denoising for suppression of respiratory and motion artifacts in impedance cardiography. In Proceedings of the Computing in Cardiology 2011, Hangzhou, China, 18–21 September 2011. [Google Scholar]
- Trinkmann, F.; Schneider, C.; Michels, J.; Stach, K.; Doesch, C.; Schoenberg, S.O.; Borggrefe, M.; Saur, J.; Papavassiliu, T. Comparison of bioreactance non-invasive cardiac output measurements with cardiac magnetic resonance imaging. Anaesth. Intensive Care 2016, 44, 769–776. [Google Scholar] [CrossRef] [Green Version]
- Charloux, A.; Lonsdorfer-Wolf, E.; Richard, R.; Lampert, E.; Oseald-Mammosser, M.; Mettauer, B.; Geny, B.; Lonsdorfer, J. A new impedance cardiograph device for the non-invasive evaluation of cardiac output at rest and during exercise: Comparison with the “direct” Fick method. Eur. J. Appl. Physiol. 2000, 82, 313–320. [Google Scholar] [CrossRef]
- Schmidt, C.; Theilmeier, G.; van Aken, H.; Korsmeier, P.; Wirtz, S.P.; Berendes, E.; Hoffmeier, A.; Meissner, A. Comparison of electrical velocimetry and transesophageal Doppler Echocardiography for measuring stroke volume and cardiac output. Br. J. Anaesth. 2005, 95, 603–610. [Google Scholar] [CrossRef] [Green Version]
- Shaffer, F.; Ginsberg, J.P. An overview of heart rate variability metrics and norms. Front. Public Health 2017, 5, 1–17. [Google Scholar] [CrossRef] [Green Version]
- Siebert, J.; Wtorek, J.; Rogowski, J. Stroke volume variabilityCardiovascular—to orthostatic maneuver in patients with coronary artery diseases. Ann. N. Y. Acad. Sci. 1999, 873, 182–190. [Google Scholar] [CrossRef]
- Liu, H.; Yambe, T.; Sasada, H.; Nanka, S.; Tanaka, A.; Nagatomi, R.; Nitta, S.I. Comparison of heart rate variability and stroke volume variability. Auton. Neurosci. 2004, 116, 69–75. [Google Scholar] [CrossRef]
- Bernstein, D.P.; Fe, R.S.; Osypka, M.J. Apparatus and Method for Determining an Approximation of the Stroke Volume and the Cardiac Output of the Heart. U.S. Patent Application No. 6,511,438, 3 April 2001. [Google Scholar]
- Åstrand, P.O.; Cuddy, T.E.; Saltin, B.; Stenberg, J. Cardiac output during submaximal and maximal work. J. Appl. Physiol. 1964, 19, 268–374. [Google Scholar] [CrossRef] [PubMed]
- Robison, B.F.; Epstein, S.E.; Beiser, G.D.; Braunwald, E. Control of heart rate by the autonomic nervous system: Studies in man on the interrelation between baroreceptor mechanisms and exercise. Circ. Res. 1966, 19, 400–411. [Google Scholar] [CrossRef] [PubMed] [Green Version]
- Perini, R.; Veicsteinas, A. Heart rate variability and autonomic activity at rest and during exercise in various physiological conditions. Eur. J. Appl. Physiol. 2003, 90, 317–325. [Google Scholar] [CrossRef]
- Sarmiento, S.; Garcia-Manso, J.M.; Martin-Gonzalz, J.M.; Vaamonde, D.; Calderon, J.; da Silva-Grigoletto, M.E. Heart rate variability during high-intensity exercise. J. Syst. Sci. Complex. 2013, 26, 104–116. [Google Scholar] [CrossRef]
- Lai, W.-C.; Huang, P.-H.; Hsiao, T.-C. Relationship between breath regulation and stroke volume with exercise intensity: A pilot study. In Proceedings of the 12th International Conference on eHealth, Telemedicine, and Social Medicine (eTELEMED 2020), Valencia, Spain, 21–25 November 2020. [Google Scholar]

Publisher’s Note: MDPI stays neutral with regard to jurisdictional claims in published maps and institutional affiliations. |
© 2022 by the authors. Licensee MDPI, Basel, Switzerland. This article is an open access article distributed under the terms and conditions of the Creative Commons Attribution (CC BY) license (https://creativecommons.org/licenses/by/4.0/).