Abstract
As the economy grows in South Korea and the needs of consumers become increasingly diversified, various consumer markets are emerging. In this study, the reasons for customers’ intentions to revisit a franchise coffee shop were explored. Many researchers have found that customer satisfaction is a major factor in the intention to revisit, and the factors affecting this satisfaction have been presented as major research topics. However, in this study, in order to examine the consumers’ behavior toward revisit intentions, the results were analyzed by dividing the consumer data into a group of college students in their 20s and a group of office workers in their 30s and 40s. The results of this study found that in regard to customers’ habitual intentions to revisit, perceived product quality and brand awareness were more influential than service quality or the physical environment. In particular, before returning to a coffee shop, customers habitually recalled the coffee shop they wanted to revisit, suggesting that the taste of the coffee and the quality of the various products had a very important impact on their revisiting habits.
1. Introduction
Recently, the market war among franchise coffee shops has grown very heated in South Korea. As the economy grows in South Korea and the needs of consumers become increasingly diversified, various consumer markets are emerging. Franchise coffee shops, such as Starbucks, are some of the fastest-growing businesses in recent years [1]. Koreans drink 26.5 billion cups of coffee a year, which is equivalent to 512 cups of coffee per person, and the coffee market continues to grow [1]. In addition, Starbucks Korea’s sales are on course to exceed $1.7 billion in 2021, the largest-ever annual revenue for a coffee franchise operating in the country [2].
Many other coffee shop franchises are entering the Korean market. However, the needs of Korean consumers are becoming more diversified and are constantly changing. In order to satisfy consumers who change their preferences periodically, many companies are interested not only in brand quality but also in forming relationships with consumers.
As a wide variety of products appeared in the market and consumers’ choices were expanded, it became necessary to analyze consumer’s purchasing behavior from a realistic viewpoint. According to previous research, consumers act on reasonable decisions based on accurate information and knowledge. However, the behavior of actual consumers is limited in terms of economic rationality, and they often make unreasonable decisions.
Thus, this research examined the effects of brand awareness, perceived service quality, perceived product quality, the physical environment, customer satisfaction and mediation of the customer familiarity heuristic on intention to revisit in the franchise coffee shops market. In particular, research on customer psychology is actively underway to secure long-term competitive advantages through favorable relationships between companies and customers. In previous studies, researchers have shown that when customer satisfaction increases with the superior quality of products and services, they are more willing to revisit. Despite the importance of the intention to revisit, most research focuses on customer satisfaction as a factor of that intent. Therefore, it is necessary to study new factors that deviate from research regarding customer satisfaction-centered revisiting factors.
Thus, this paper addresses new factors affecting intention to revisit. The paper specifically focuses on the mediation effect of customer satisfaction and the familiarity heuristic on intention to revisit, as this is a very important factor in analyzing customers’ intention to revisit.
2. Literature Review and Development of Research Hypotheses
Based on previous research, a hypothesis to analyze the causal factors and factors affecting Korean customers’ intention to revisit franchise coffee shops has been developed for this study.
2.1. Theory of Reasoned Action (TRA)
Prior to building a research model based on the theory of reasoned action (TRA), a referenced research analysis of customers’ intentions to revisit franchise coffee shops was conducted. The TRA is a theoretical research model that many researchers refer to when studying customers’ purchasing intentions, and it is an important area in business for researching consumers through attitude and behavioral relationships. In other words, this theory provides a significant basis for understanding consumer behavior; however, it is limited in explaining human intuitive behavior because it is a model based on rational control of reason [3]. Behavior in TRA encompasses actions that can be controlled by will, i.e., through behavioral intentions. In addition, such intentions are influenced by personal factors, such as attitudes and social norms [4]. It is also important to measure behavior intention to predict an individual’s behavior, and as most human behavior can be controlled by the will of the actor, it is not the “attitude of action” but the “intention of action” to carry out the action. Thus, this paper will adopt the TRA as a basis from which to study the intention to revisit.
2.2. Heuristics Theory
Heuristic means intuitively thinking through an experience rather than analyzing conclusions based on rational thinking [5]. In other words, it is bias and the heuristic that expresses the human being who is satisfied with bounded rationality rather than pursuing the impossible true rationality [6].
It is necessary to apply the theory of behavioral economics to solve these problems [7]. Behavioral economics utilizes the dual process theory of psychology to analyze the causes of seemingly unreasonable behaviors. According to this theory, human decision -making can be said to be the result of two completely different processes: System I (intuitive decision-making by instinct) and System II (decision based on rational reasoning). The result is that two completely different processes are operated concurrently [7]. Thus, if the choice of low-involvement products and services, such as franchise coffee shops, is always a decision based on rational reasoning, as in System II, the psychological fatigue of a person can be maximized.
Familiarity heuristic means that the customer prefers a familiar brand or product [8]. However, Ouellette (1998) found that the familiarity heuristic might only occur in situations where the target behavior is habitual and occurs in a stable context. Thus, the familiarity heuristic could be limited to habits and behaviors in routine situations [9].
The mathematician, Polya, described the heuristic as “helpful in some discoveries” [10]. In addition, Hsee (1998) explained the irrational behavior of people using ice cream experiments as a heuristic [11]. Therefore, heuristics can be summarized as a convenient discovery method that is used to solve a problem when there is no clear evidence. The rational choice is to choose results based on the information given and on rational analysis. Therefore, it is necessary to consider different variables in the rational decision-making of consumers, but there are limitations in perfectly understanding decision-making due to lack of information and time constraints. Therefore, a feasible solution considering realistic constraints is required. However, many customers adopt behaviors, such as making decisions based on habits or beliefs or following others’ decisions. This is generally heuristic, that is, a process of simplification to avoid complications. Therefore, heuristic means to choose intuitive thinking rather than rational thinking.
2.3. Brand Awareness and Customer Satisfaction
High brand awareness can increase customers’ likelihood of choosing a particular brand, which can increase customer loyalty and alleviate the disadvantages of competitive marketing activities [12]. Brakus et al. (2009) studied the effect of brand awareness on customer satisfaction and loyalty [13]. Brand awareness can be a means to encourage customers to use products and services. It can also serve as a foundation for building customer relationships with a company’s brand. Therefore, customer brand knowledge is an important factor that should be actively pursued in business activities [14]. In this study, the following research hypothesis was established based on previous studies:
Hypothesis 1 (H1).
Brand awareness positively affects customer satisfaction.
2.4. Perceived Service Quality and Customer Satisfaction
Parasuraman and Zeithaml (2002) found that consumers’ positive perceptions of service quality provide a positive impact on companies and affect customer behavior [15]. In addition, Cronin, Brady and Hult (2000) conducted a large-scale survey of six industries and found that there is a significant relationship between perceived service, customer satisfaction and behavioral intentions. Chow-Chua and Komaran (2002) also found that a high level of service quality could lead to customer satisfaction [16]. Therefore, in this study, the following research hypothesis was established based on previous studies:
Hypothesis 2 (H2).
Perceived service quality has a positive effect on customers’ satisfaction.
2.5. Perceived Product Quality and Customer Satisfaction
Baker and Crompton (2000) found that satisfaction with perceived product quality was positively associated with future intentions, such as customer intention to revisit and intention to portray the product positively to others [17]. Tsiotsou (2006) determined that product quality perceived by customers is positively correlated with customer satisfaction [18]. In this study, the following research hypothesis was established based on previous studies:
Hypothesis 3 (H3).
Perceived product quality has a positive effect on customer satisfaction.
2.6. Physical Environment and Customer Satisfaction
Brady, Robertson and Cronin (2001) concluded that customer satisfaction increases as satisfaction with the environment in which services are provided increases [19]. Yoo, Park and Macinnis (1998) revealed that environmental factors, such as temperature, lighting, interior decoration, design and facility layout, could directly affect the revisiting of customers in the service space [20]. In addition, Baek et al. (2018) found that a shop’s atmosphere influences shoppers’ perceptions and behaviors [21]. That is, a warm visual atmosphere can induce psychological warmth between the store and the customer. In this study, the following research hypothesis was established based on previous studies.
Hypothesis 4 (H4).
The physical environment has a positive effect on customer satisfaction.
2.7. Physical Environment and Customer Satisfaction
Many researchers have studied consumers’ revisit behaviors. Um, Chon and Ro (2006) found that as overall consumer satisfaction increases, revisits also increase, resulting in a company’s improved performance [22]. Allameh, Khazaei, Jaberi, Salehzadeh and Asadi (2015) defined the intention to revisit as visitors recognizing value and satisfaction, returning to the destination in the future and recommending it to others [23]. Ting et al. (2018) defined revisiting as an intention to visit a particular coffee shop again based on consumers’ satisfaction in its products, services and empirical quality [24]. Oliver (1997) determined that customer satisfaction had a significant influence on intention to revisit [25]. In addition, customer satisfaction has been studied as a variable that influences the likelihood of customers to repurchase services [26]. In other words, these studies demonstrate that overall customer satisfaction with service is strongly related to behavioral intent to reuse the same service provider [27]. In this study, the following research hypothesis was established based on previous studies.
Hypothesis 5 (H5).
Customer satisfaction has a positive impact on the intention to revisit.
2.8. Customer Satisfaction and Habitual Behavior
Habit is a ‘‘learned sequence of acts that become automatic responses to specific situations which may be functional in obtaining certain goals or end states’’ [28]. When an individual repeats an action regularly and is satisfied with the outcome, the action then becomes habitual [29]. Triandis (1979) suggested that a habit may develop when it is associated with positive effects, e.g., repeated satisfaction over time [30]. That is, repetitive satisfaction leads to the formation of a habit. In addition, repeated satisfaction increases the likelihood that consumers will repurchase the brand, and such continuous behavior may appear as brand loyalty or habitual use depending on the level of involvement with the product [31]. Based on previous research results, the accumulated satisfaction of customers can make use of the product a habit. In particular, as the use of franchise coffee shops tends to have a higher purchase frequency than other products, it can be inferred that such repeated satisfaction will have a positive effect on habitual use. In this study, the following research hypothesis was established based on previous studies.
Hypothesis 6 (H6).
Customer satisfaction has a positive impact on customer habits.
2.9. Habitual Behavior and Retention
Khare and Inman (2006) realized that consumers purchase the same brand repeatedly or only try new product types within the same brand, depending on the situation [31]. It has also been determined that there are various types of habitual purchase patterns, such as purchasing various trademarks according to customers’ values [32].
Ji Song and Wood (2007) demonstrated similar results that consumers with a strong habit of fast food consumption repeat this behavior even when their intentions for such consumption change when the circumstances are stable [33]. Neail, Wood, Lally and Wu (2010) found that customers with a strong habit of eating popcorn ate the same amount of popcorn at the theater regardless of whether they received fresh or stale popcorn [34]. These results demonstrate that habitual customers repeat their consumption when situational cues are maintained (movie theater) without consulting their evaluation of the product (popcorn). Through the above research results, it can be inferred that habitual use will have a positive effect on repeated use. In this study, the following research hypothesis was established based on previous studies.
Hypothesis 7 (H7).
Customer habits have a positive impact on intention to revisit.
3. Research Methodology
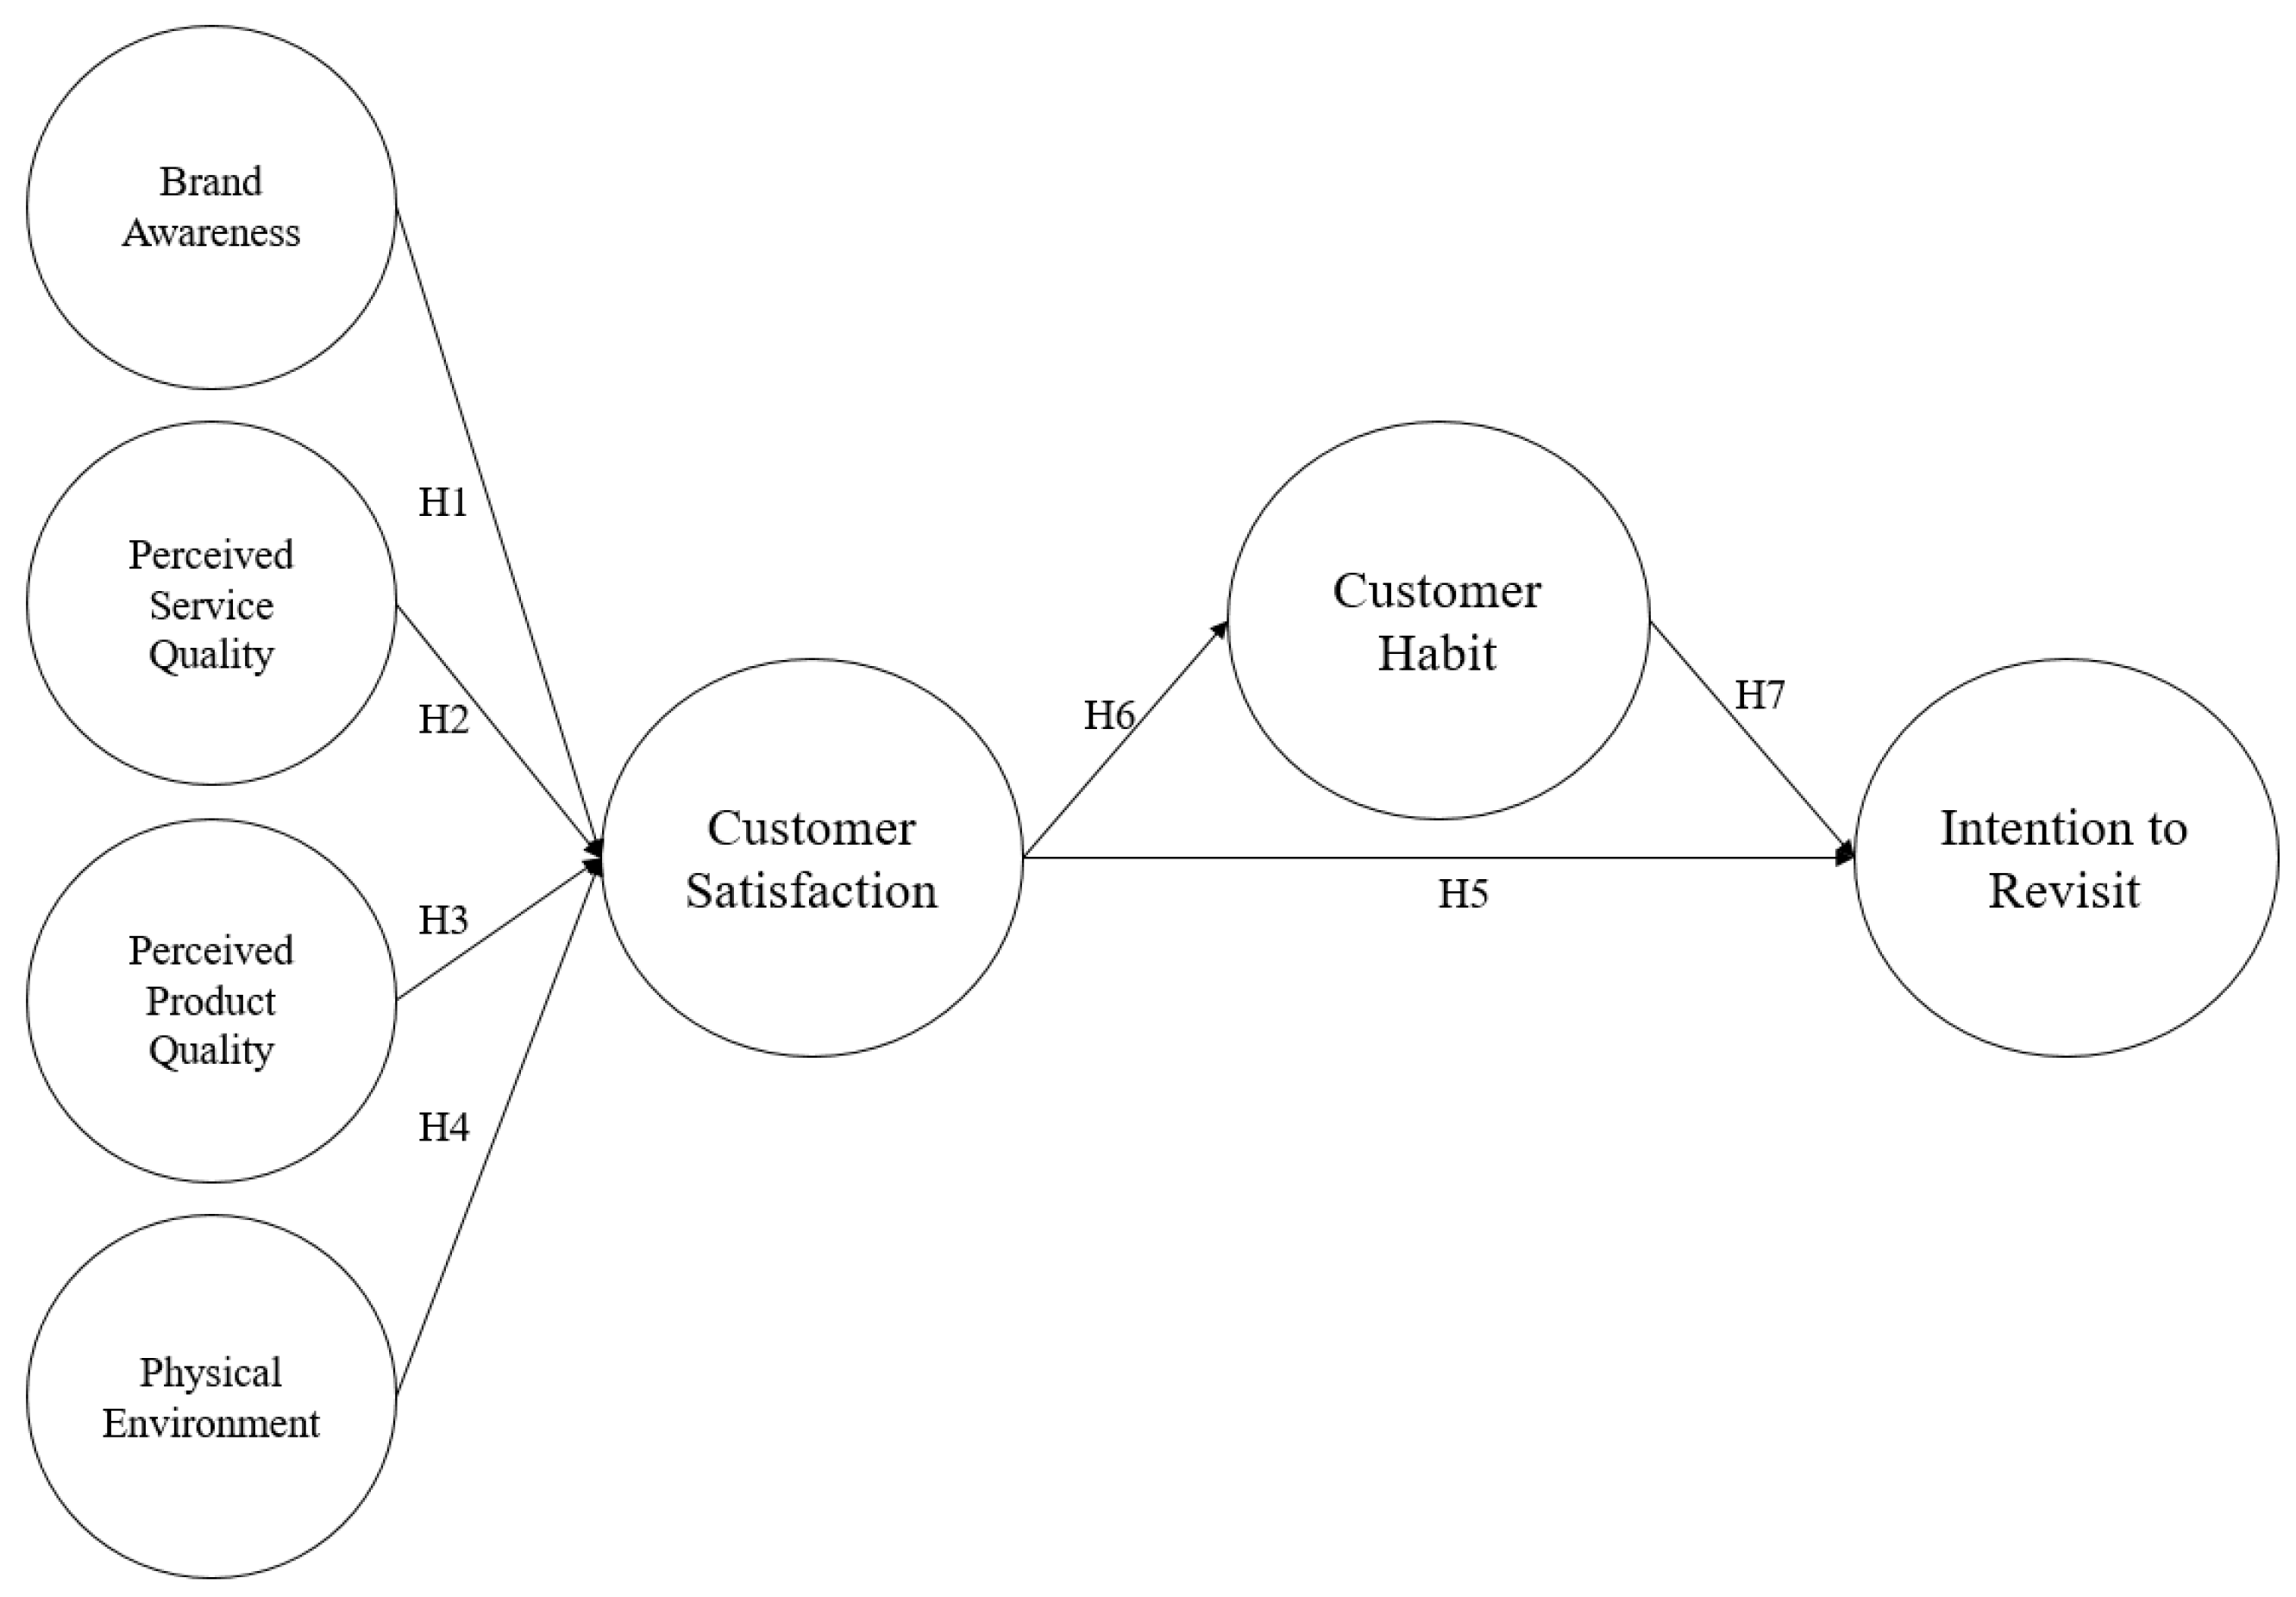
This study maintains that habit serves as a full mediator that transfers the effect of satisfaction with franchise coffee shop to continuance intention. This paper defines mediation as a situation wherein the satisfaction has a significant influence on the mediator (habit), which in turn has a significant influence on the criterion variable (continuance intention). Based on the hypotheses, the following research model was developed (Figure 1).

Figure 1.
Research model.
3.1. Structural Models
In this study, the structural equation modeling (SEM) analysis method was used to analyze the structural relationship of factors affecting the intention to repurchase. In the social sciences, SEM is used as a research method to analyze the multiple causal relationships between factors. SEM can analyze the theoretical concept of the research model and the complex relationship between concepts. It has potential advantages over linear regression models, which make use of the methods of choice in analyzing path diagrams when these involve latent variables with multiple indicators [35]. Therefore, it contributes to the verification and development of the theory by linking the empirical and theoretical aspects [36]. In addition, the structural equation model is useful in social science research fields, such as management, marketing, psychology, education and health to elucidate the relationship between various constructs [37].
3.2. Sample Size for Structural Equation Models Formulas
This study calculated the appropriate sample size for the analysis within the statistical significance level in the following structural equation model (SEM). According to Cohen (2013) and Westland (2010), the sample size was calculated by the following method [38,39]. Equations (1)–(3) were used to compute a priori sample sizes for structural equation models.
Error function:
Lower bound sample size for a structural equation model:
where:
where j is the number of observed variables, k is the number of latent variables, ρ is the estimated Gini correlation for a bivariate normal random vector, δ is the anticipated effect size, α is the Sidak-corrected Type I error rate, β is the Type II error rate and z is a standard normal score. Normal distribution cumulative distribution function:
where µ is the mean, σ is the standard deviation, and erf is the error function. The study model used had 7 latent variables and 20 observation variables. Therefore, at least 223 samples were required considering a 95% significance level. Therefore, the 460 surveys used in this study were considered to be within the significance level range.
n = max (n1, n2)
3.3. Data Collection
The survey was conducted among 460 adults who had visited a franchise coffee shop more than twice within a month in Seoul, South Korea. In addition, the two groups (230 college students and 230 office workers) were selected because, even though the customers were the same age, it was thought that students and workers would have different intentions for visiting. The survey employed a five-point Likert-type scale and a 20-item questionnaire. As a result of the survey, data were collected from 494 customers; the data for 34 customers who responded inappropriately were omitted. Then, the data were analyzed by applying statistical analysis and structural equation modeling using the AMOS 24.0 program.
3.4. Research Model Analysis
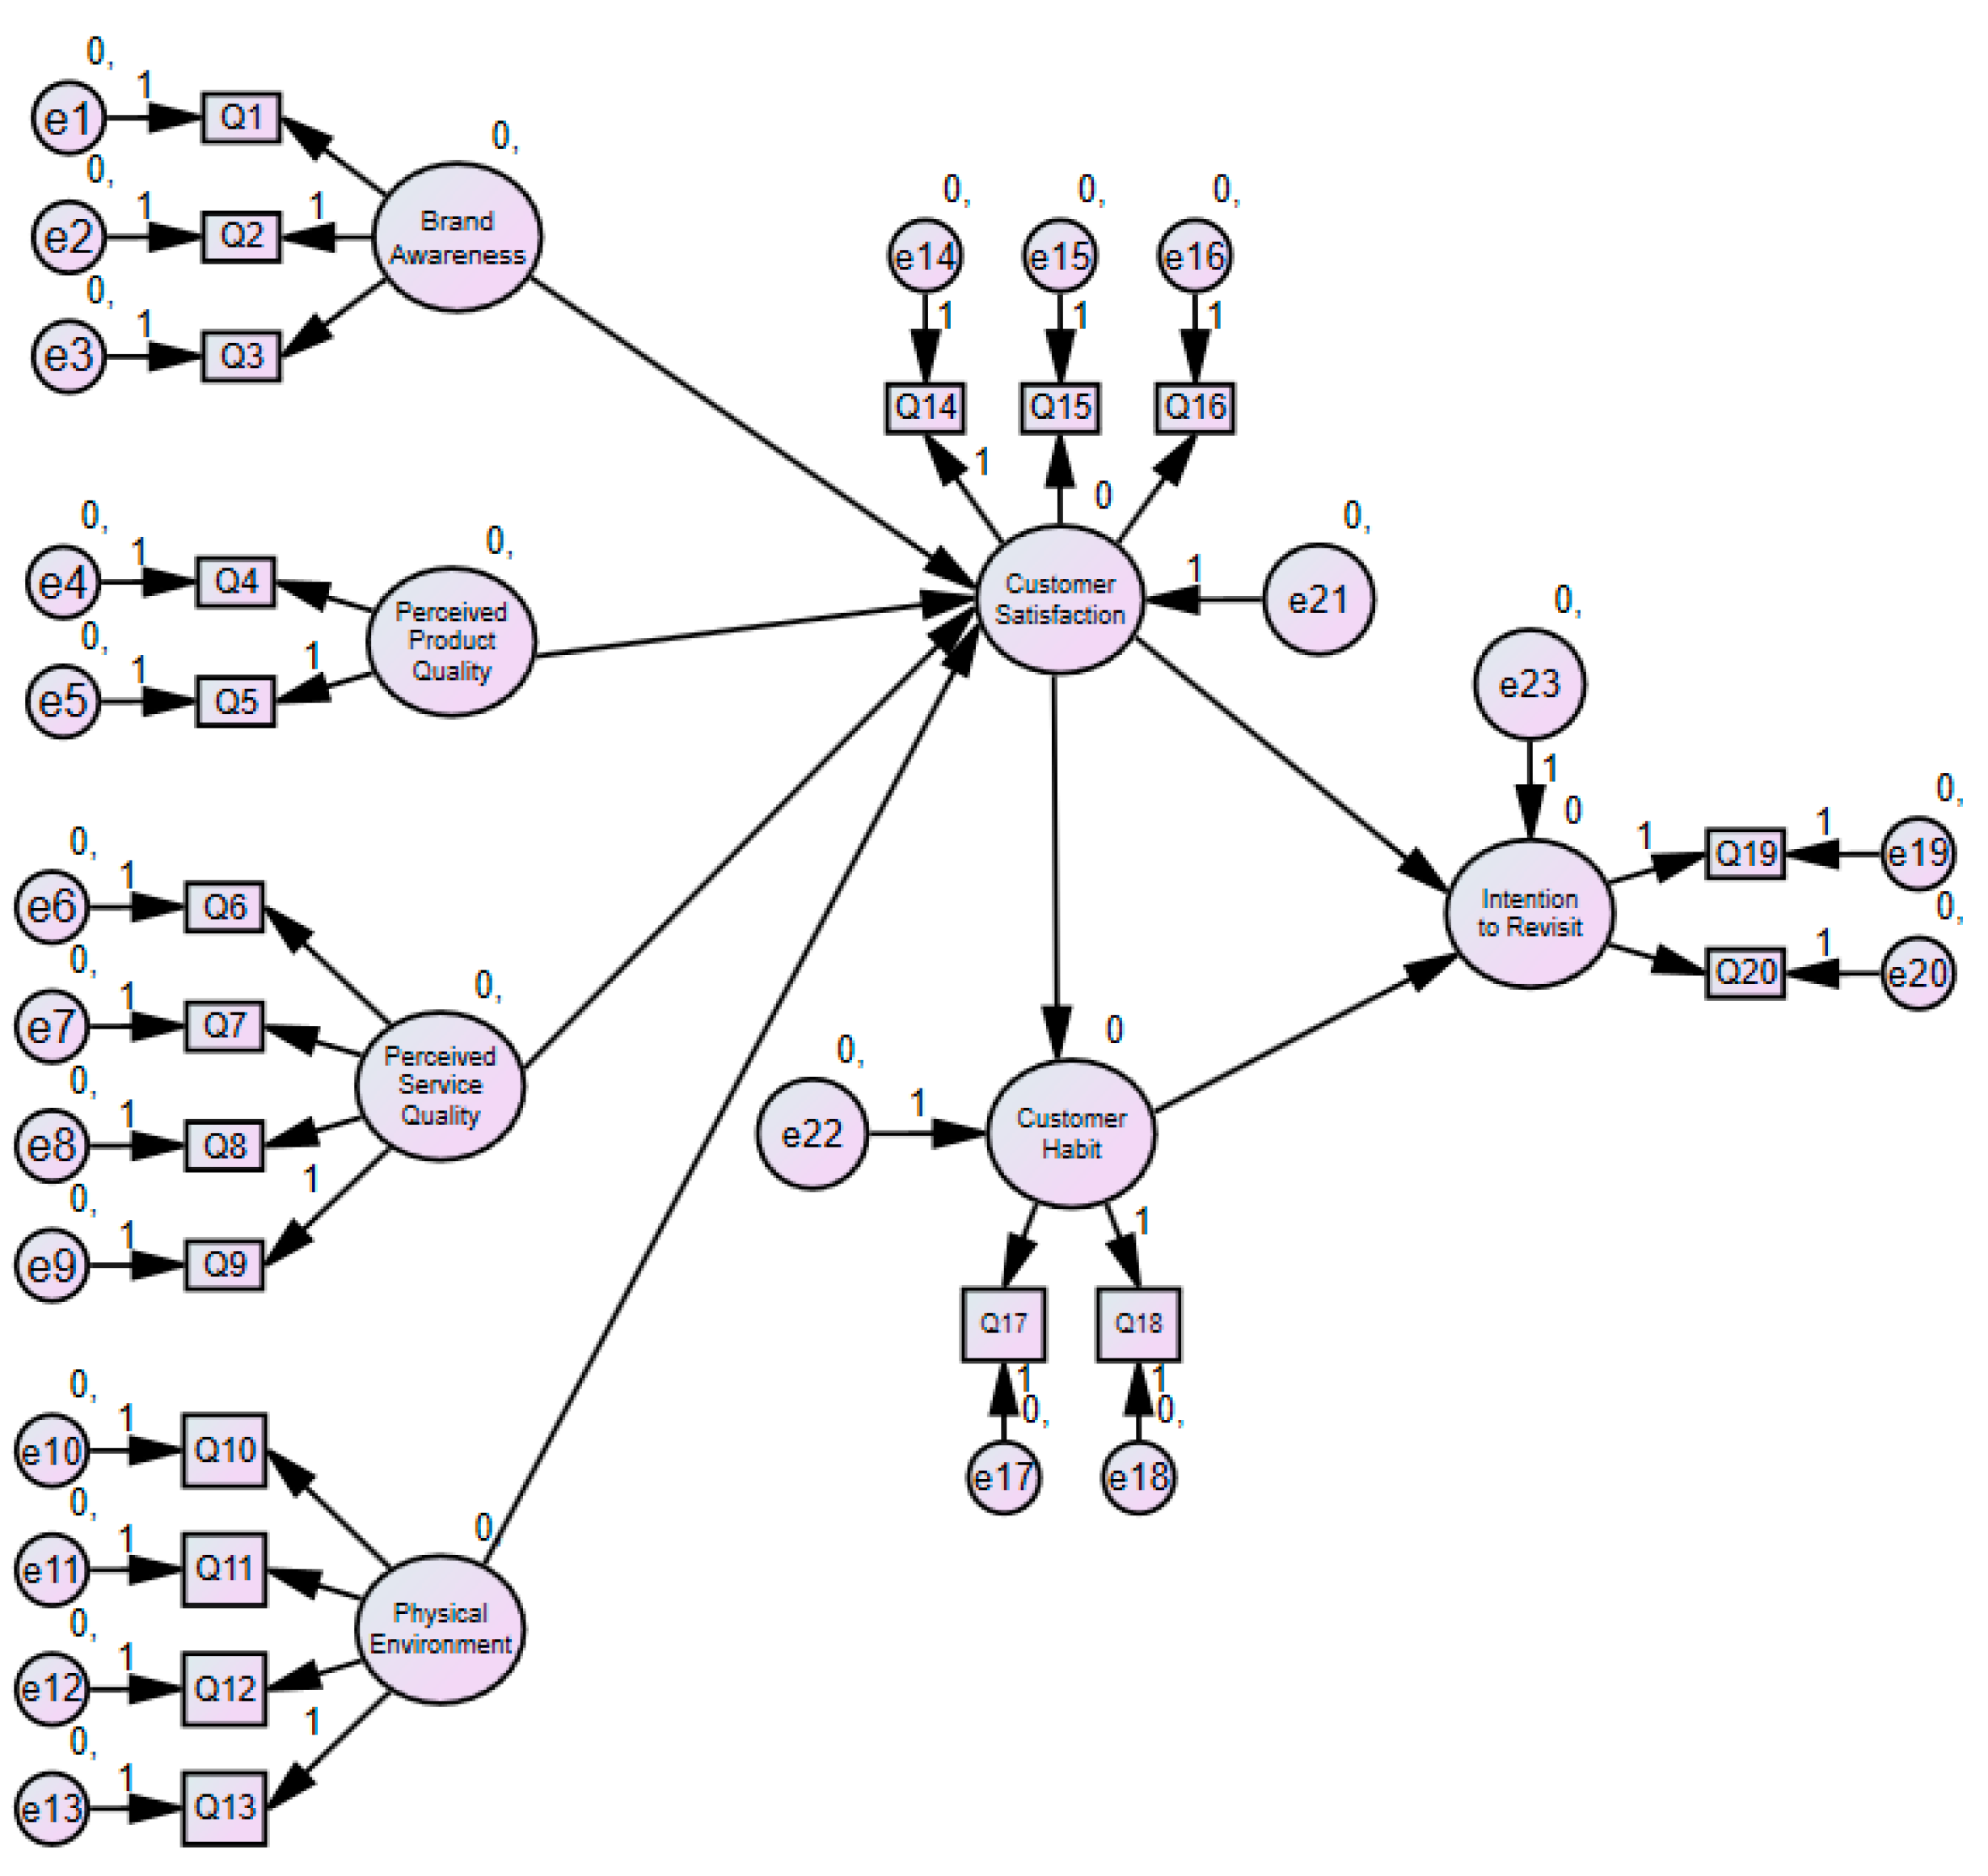
The research model shown in Figure 2 and its components are based on the experiences of customers using the franchise coffee shop. The research model was developed based on seven factors (brand awareness, perceived service quality, perceived product quality, physical environment, customer satisfaction, customer habits and the intention to revisit). Based on the research model, the effects of customers’ satisfaction and habits on the intention to revisit the franchise coffee shop were analyzed.
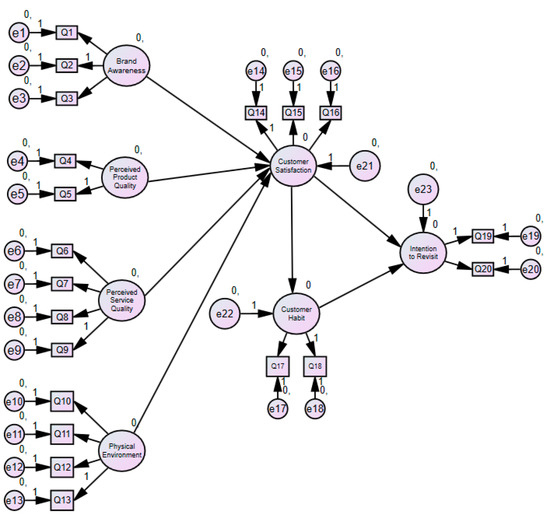
Figure 2.
Analysis of the research model.
3.5. Measurement
This study surveys the opinions of customers. Therefore, the research used a verified questionnaire based on previous research analysis. This study tests the research hypotheses and attempts to answer the research questions through the development of a questionnaire as a research instrument. The items of each construct were adopted from previous literature. This study analyzed the behavior of customers for this, the research used verified measurement items found in an analysis of previous research. And the results were summarized in Table 1.

Table 1.
Measurement items.
4. Research Results
4.1. General Characteristics of the Survey Respondents
In this study, the valid sample (460 respondents) was divided equally into college students (50%) and office workers (50%). Among the respondents, 207 (45%) were males and 253 (55%) were females. Regarding age, 66% were in their 20s, 24% were in their 30s and 10% were in their 40s or older. Table 2 presents the results that explain the characteristics of the respondents who participated in the survey.
Table 2.
Analysis of survey respondents.
Table 3 summarizes the arithmetical average of the latent variables of the study model.
Table 3.
Descriptive statistics of latent variables (overall customer group responding to the survey).
Table 4 summarizes the arithmetical average of the latent variables of the study model for two groups (office workers and college students).
Table 4.
Descriptive statistics of latent variables (office workers and college students).
4.2. Reliability and Validation of Factor Analysis
Table 5 shows 7 latent variables that represent the properties of observed variables and 20 observed variables by considering the characteristics of the factors with similar properties.
Table 5.
Squared multiple correlations.
The validity of the survey questionnaire for this study was examined through an analysis of average variance extracted (AVE) and construct reliability (CR). In order to test the validity of the survey questionnaire for statistical analysis, the CR for each item should be at least 1.95; the standardized regression weights should be at least 0.5; the AVE should be at least 0.5; and the constitutive reliability of the latent variables should be at least 0.7. The results are presented in Table 6, and all survey questionnaires in this study were found to be valid.
Table 6.
Validation of survey questionnaire (office worker group).
Table 7 is the result of analyzing the survey validation of the college student group.
Table 7.
Validation of survey questionnaire (college student group).
4.3. Research Model Fit
The criterion used for determining the fitness of the research model was the fit index, which is most commonly used in the social sciences. Table 8 shows the results of analyzing the fit of the research model.
Table 8.
Analysis of the fit of the research model.
For this study, the research model and hypotheses were analyzed through statistical analysis, and the results are presented in Table 9 and Table 10.
Table 9.
Research model analysis (office workers).
Table 10.
Research model analysis (college students).
4.4. Research Hypothesis Test (Multi-Group Analysis)
In this study, the customers who visited the franchise coffee shop were divided into two groups (office workers and college students). The results in Table 9 and Table 10 proved that the reasons the two groups intend to revisit the coffee shop differ. Table 9 displays the results of the research model analysis of office workers.
As a result, H2, H3, H6 and H7 in office workers group were accepted in the research hypotheses presented. Additionally, satisfaction with the franchise coffee shop did not affect the intention to revisit of office workers. The analysis further showed that the habits of office workers had a greater influence on their intention to revisit, more so than satisfaction. Satisfaction intention to revisit was rejected in statistical significance.
Table 10 displays the results of the research model analysis of college students.
All research hypotheses were accepted in the college students group. According to the analysis of the collected data, both customers’ habitual revisiting behavior and customers’ satisfaction had a positive effect on their intention to revisit. The analysis indicated that the intention to revisit due to customer satisfaction was greater than their intention to revisit due to habit.
Specifically, customers responded that they revisited a familiar coffee shop habitually to maintain their coffee shop loyalty program (membership program). Customers also responded that the excellent service of franchise coffee shop, brand awareness and their overall satisfaction with the physical environment affected their satisfaction. Customers’ preference for coffee and overall satisfaction with the product habitually induced revisiting. In addition, the analysis demonstrated that remaining at the coffee shop for extended periods posed no inconvenience to customers, and that various amenities (free Wi-Fi, décor of the coffee shop, comfortable seating, etc.) and cleanliness of the shop were all factors affecting customer satisfaction. Furthermore, it is evident that the attributes of the coffee shop’s environment had a greater influence on customer satisfaction than product quality.
College students preferred to enjoy good coffee in a shop that was easy to visit, clean and comfortable and one that offers a variety of additional amenities, such as Wi-Fi. In considering these reasons, college students’ intention to revisit the coffee shop was analyzed. This suggests that in order to encourage the intention to repurchase of low-involvement products, such as revisiting coffee shops, it is important to provide the factors that the customer can immediately think of when deciding to consume the product.
Perceived product quality as a positive influence on customers’ habits was also analyzed. Customer satisfaction caused the repurchasing of familiar brands among the various franchise coffee-shop brands they knew. Overall satisfaction with products, such as coffee taste, product diversity and brand awareness, as major factors influencing customer satisfaction, were also analyzed.
According to the findings discussed above, it is necessary to provide customers with a positive image by ensuring quality and convenience using various amenities in order to continuously encourage customers to revisit. In addition, this positive image results in the brand of the franchise coffee shop being perceived positively. Therefore it can be deduced that customers will habitually revisit the shop. This leads franchise coffee shops to infer that customers need to continually and consistently recognize their brand through ongoing public relations.
4.5. Analysis of Mediation Effect (Multi-Group Analysis)
In Table 11, the college student group was analyzed, and it was found that the mediating effect of habit on customer satisfaction and revisit intention was considered statistically significant. From this, it is evident that among the college student group, habits play a mediating role in customer satisfaction and revisit intentions.
Table 11.
Indirect effects—two-tailed significance (college students).
Table 12 shows the results of analyzing the mediating effect of customer habits.
Table 12.
Analysis of mediating effect of customer habits.
5. Conclusions
This research explored the reasons for customers’ intentions to revisit a franchise coffee shop. Many researchers have found that customer satisfaction is a major factor in the intention to revisit, and the factors affecting customer satisfaction have been presented as major research topics. Previous research has also identified the convenience of the space and friendly service as main factors of customer satisfaction.
This paper results demonstrate that coffee quality and satisfaction with the service quality have important roles in revisiting. Therefore, a coffee shop should respond quickly to customer complaints and provide services very quickly. Furthermore, the quality of the product should be continually maintained.
In addition, as a result of this multi-group analysis, it was determined that satisfaction with franchise coffee shops creates familiarity, and this affects revisits.
5.1. Research Implications
Consumers are limited in terms of economic rationality and often make irrational decisions. This is especially true for products that are not expensive and are consumed in everyday life. Through the research, it was studied that habits play an important role as well as satisfaction in consumers’ intention to repurchase. This study indicates that if a customer is satisfied with a franchise coffee shop (price, quality, space, etc.), there is a probability of purchasing the same brand again. From the customer’s point of view, purchasing products of the same brand is a means of reducing the risk of product failure [31]. Thus, habits become a means of reducing the risk of purchasing [31]. This is also consistent with the analysis of previous studies. However, a different research result was found in the college student group. In particular, it was studied that satisfaction with the physical environment of a coffee shop is important, and that customers of this group spend a lot of time in information search for new products and physical environment even though this involves a complex decision-making process. This is a different study result from the results of previous studies, in which the habitual behavior of the consumer is mainly applied to low-priced products and daily decision-making. In other words, this means that the characteristics of consumer behavior differ by generation.
5.2. Managerial Implications
Before revisiting a coffee shop, customers habitually recalled the coffee shop they wanted to revisit, suggesting that the taste of the coffee and the quality of the various products have a very important impact on customer habits. In other words, the franchise coffee shop needs to improve its brand awareness through continual promotion. In addition, ensuring coffee and beverage quality and the diversity of coffee sold are key points for attracting repeat customers. In addition, it is necessary to maintain a customer inducement program to make customers feel familiar with the coffee shop.
Moreover, the results of the present study indicate that office workers and college students have different intentions to revisit coffee shops. Office workers’ satisfaction is based on the quality of coffee, brands awareness and familiarity of the coffee shop, and these are the main factors for revisiting.
The satisfaction and habits of college students were observed to have an effect on revisiting. Of course, satisfaction was determined to be a greater factor than habits when deciding to revisit. In addition, it is the quality of the coffee and beverages sold at the shop that influences students’ revisiting habits.
6. Discussion
This study divided customers into groups of office workers and college students, but the fact that there were only 460 valid survey subjects remains a limitation of the study. Therefore, it is necessary to examine these questions with a larger sample and to study customers’ intention to revisit through various types of surveys, such as questionnaires and interviews.
In addition, it is necessary to consider the limitations of SEM applied as a research method in this study. In other words, latent variables and unmeasured variables that are not considered when developing a research model can create a more suitable research model than the current research model. In addition, an error in data measurement and an error in causality caused by it may be raised as problems. Moreover, even if the direction of the causal relationship between latent variables in SEM is changed, the effect on the fit of the research model is limited.
Further research is needed on the causal relationship between customer satisfaction and customer habits. The study found that customers’ habits influenced their intention to revisit. Therefore, companies need to identify strategies for creating and maintaining new habits. In addition, it is necessary to study how changes in customers’ habits affect repurchasing. A comprehensive study on customers’ purchase habits by analyzing their habitual purchase types, the factors influencing these habits and the role played by variables in influencing changes in habits is suggested. In addition, it is necessary to analyze the repurchase characteristics of consumers by diversifying the purchased product groups and the age groups of consumers.
Funding
This Research was supported by Sookmyung Women’s University Research Grants [1-2003-2017].
Institutional Review Board Statement
Not applicable.
Informed Consent Statement
Not applicable.
Data Availability Statement
Not applicable.
Conflicts of Interest
The author declares no conflict of interest.
References
- How Starbucks Captivated Picky Koreans. The Jeju Weekly. 3 April 2019. Available online: http://www.jejuweekly.com/news/articleView.html?idxno=6103 (accessed on 28 January 2022).
- Starbucks Korea Secures No.1 Spot in Crowded Market. The Korea Economic Daily. 15 December 2021. Available online: https://www.kedglobal.com/newsView/ked202112150008 (accessed on 8 January 2022).
- Ajzen, I. The theory of planned behavior. Organ. Behav. Hum. Decis. Processes 1991, 50, 179–211. [Google Scholar] [CrossRef]
- Ajzen, I.; Fishbein, M. Understanding Attitude and Prediction Social Behavior; Prentice Hall: Englewood Cliffs, NJ, USA, 1980. [Google Scholar]
- Kahneman, D.; Slovic, S.P.; Slovic, P.; Tversky, A. Judgment under Uncertainty: Heuristics and Biases; Cambridge University Press: Cambridge, UK, 1982. [Google Scholar]
- Simon, H.; Egidi, M.; Viale, R.; Marris, R. Economics, Bounded Rationality and the Cognitive Revolution, Aldershot; Edward Elgar: Cheltenham, UK, 1982. [Google Scholar]
- Kahneman, D. Thinking, Fast and Slow; Farrar, Straus and Giroux: New York, NY, USA, 2011; Volume 1. [Google Scholar]
- Park, C.W.; Lessig, V.P. Familiarity and its impact on consumer decision biases and heuristics. J. Consum. Res. 1981, 8, 223–230. [Google Scholar] [CrossRef]
- Ouellette, J.A.; Wood, W. Habit and intention in everyday life: The multiple processes by which past behavior predicts future behavior. Psychol. Bull. 1998, 124, 54. [Google Scholar] [CrossRef]
- Polya, G. How to Solve It: A New Aspect of Mathematical Method (No. 246); Princeton University Press: Princeton, NJ, USA, 2004. [Google Scholar]
- Hsee, C.K. Less is better: When low-value options are valued more highly than high-value options. J. Behav. Decis. Mak. 1998, 11, 107–121. [Google Scholar] [CrossRef]
- Keller, K. Strategic Brand Management: Building, Measuring, and Managing Brand Equity; Prentice Hall: Upper Saddle River, NJ, USA, 1998. [Google Scholar]
- Brakus, J.J.; Schmitt, B.H.; Zarantonello, L. Brand experience: What is it? How is it measured? Does it affect loyalty? J. Mark. 2009, 73, 52–68. [Google Scholar] [CrossRef]
- O’Neill, J.; Mattila, A. Hotel Brand Strategy. Cornell Hosp. Q. 2010, 51, 27–34. [Google Scholar] [CrossRef]
- Parasuraman, A.; Zeithaml, V.A. Understanding and improving service quality: A literature review and research agenda. Handb. Mark. 2002, 4, 339–367. [Google Scholar]
- Chow-Chua, C.; Komaran, R. Managing service quality by combining voice of the service provider and voice of their customers. Manag. Serv. Qual. Int. J. 2002, 12, 77–86. [Google Scholar] [CrossRef]
- Baker, D.A.; Crompton, J.L. Quality, satisfaction and behavioral intentions. Ann. Tour. Res. 2000, 27, 785–804. [Google Scholar] [CrossRef]
- Tsiotsou, R. The role of perceived product quality and overall satisfaction on purchase intentions. Int. J. Consum. Stud. 2006, 30, 207–217. [Google Scholar] [CrossRef]
- Brady, M.K.; Robertson, C.J.; Cronin, J.J. Managing behavioral intentions in diverse cultural environments: An investigation of service quality, service value, and satisfaction for American and Ecuadorian fast-food customers. J. Int. Manag. 2001, 7, 129–149. [Google Scholar] [CrossRef]
- Yoo, C.; Park, J.; MacInnis, D.J. Effects of store characteristics and in-store emotional experiences on store attitude. J. Bus. Res. 1998, 42, 253–263. [Google Scholar] [CrossRef]
- Baek, E.; Choo, H.; Oh, H.; Yoon, S. How consumers “see” a visually warm store: Differences between affective and cognitive processors. J. Consum. Behav. 2018, 17, 149–160. [Google Scholar] [CrossRef]
- Um, S.H.; Chon, K.; Ro, Y.H. Antecedents of revisit intention. Ann. Tour. Res. 2006, 33, 1141–1158. [Google Scholar] [CrossRef]
- Allameh, S.; Khazaei Pool, J.; Jaberi, A.; Salehzadeh, R.; Asadi, H. Factors influencing sport tourists’ revisit intentions. Asia Pacific J. Mark. Logist. 2015, 27, 191–207. [Google Scholar] [CrossRef]
- Ting, H.; Lau, W.M.; Cheah, J.H.; Yacob, Y.; Memon, M.A.; Lau, E. Perceived quality and intention to revisit coffee concept shops in Malaysia: A mixed-methods approach. Br. Food J. 2018, 120, 1106–1119. [Google Scholar] [CrossRef]
- Oliver, R. Satisfaction: A behavioral Perspective on the Consumer; McGraw Hill: New York, NY, USA, 1997; pp. 460–469. [Google Scholar]
- Szymanski, D.; Henard, M. Customer satisfaction: A meta-analysis of the empirical evidence. J. Acad. Mark. Sci. 2001, 29, 16–35. [Google Scholar] [CrossRef]
- Hellier, P.K.; Geursen, G.M.; Carr, R.A.; Rickard, J.A. Customer repurchase intention: A general structural equation model. Eur. J. Mark. 2003, 37, 1762–1800. [Google Scholar] [CrossRef] [Green Version]
- Verplanken, B.; Aarts, H.; Van Knippenberg, A. Habit, information acquisition, and the process of making travel mode choices. Eur. J. Soc. Psychol. 1997, 27, 539–560. [Google Scholar] [CrossRef]
- Verplanken, B.; Orbell, S. Reflections on past behavior: A self-report index of habit strength 1. J. Appl. Soc. Psychol. 2003, 33, 1313–1330. [Google Scholar] [CrossRef]
- Triandis, H.C. Values, attitudes, and interpersonal behavior. In Nebraska Symposium on Motivation; University of Nebraska Press: Lincoln, NE, USA, 1979. [Google Scholar]
- Assael, H. Consumer Behavior A Strategic Approach; Dreamtech Press: Daryaganj, Indian, 2005. [Google Scholar]
- Khare, A.; Inman, J. Habitual Behavior in American Eating Patterns: The Role of Meal Occasions. J. Consum. Res. 2006, 32, 567–575. [Google Scholar] [CrossRef]
- Ji Song, M.; Wood, W. Purchase and Consumption Habits: Not Necessarily What You Intend. J. Consum. Psychol. 2007, 17, 261–276. [Google Scholar]
- Neal, D.T.; Wood, W.; Lally, P.; Wu, M. Do Habits Depend on Goals? Perceived Versus Actual Role of Goals in Habit Performance. Univ. South. Calif. 2010, 48, 492–498. [Google Scholar]
- Gefen, D.; Rigdon, E.E.; Straub, D. Editor’s comments: An update and extension to SEM guidelines for administrative and social science research. MIS Q. 2011, 35, iii–xiv. [Google Scholar] [CrossRef]
- Martens, M. The use of structural equation modeling in counseling psychology research. Couns. Psychol. 2005, 33, 269–298. [Google Scholar] [CrossRef]
- Mueller, R. Structural equation modeling: Back to basics. Struct. Equ. Modeling 1997, 4, 353–369. [Google Scholar] [CrossRef]
- Cohen, J. Statistical Power Analysis for the Behavioral Sciences; Routledge: Abingdon, UK, 2013. [Google Scholar]
- Westland, J.C. Lower bounds on sample size in structural equation modeling. Electron. Commer. Res. Appl. 2010, 9, 476–487. [Google Scholar] [CrossRef]
- Park, K.H.; Yoon, J.H. Coffee SERV: Multiple-item scale for measuring service quality of specialty coffee shop. J. Foodserv Manag. 2006, 9, 7–26. [Google Scholar]
- Kim, H.B.; Lee, J.W.; Ro, Y.J. Impacts of choice attributes on customer loyalty in the coffee-shop restaurant. J. Foodserv Manag. 2007, 10, 237–252. [Google Scholar]
- Cadotte, E.R.; Turgeon, N. Key factors in guest satisfaction. Cornell Hotel. Restaur. Adm. Q. 1988, 28, 44–51. [Google Scholar] [CrossRef]
- Chen, P.T.; Hu, H.H. How determinant attributes of service quality influence customer-perceived value. Int. J. Contemp. Hosp. Manag. 2010, 22, 535–551. [Google Scholar] [CrossRef]
- Swinyard, W.R.; Struman, K.D. Market segmentation: Finding the heart of your restaurant’s market. Cornell Hotel. Restaur. Adm. Q. 1986, 27, 88–96. [Google Scholar] [CrossRef]
- Hart, C.W.; Casserly, G.D. Quality: A brand-new, time-tested strategy. Cornell Hotel. Restaur. Adm. Q. 1985, 26, 52–63. [Google Scholar] [CrossRef]
- Oliver, R. A Cognitive Model of the Antecedents and Consequences of Satisfaction Decisions. J. Mark. Res. 1980, 17, 460. [Google Scholar] [CrossRef]
- Kim, B.; Kang, M.; Jo, H. Determinants of postadoption behaviors of mobile communications applications: A dual-model perspective. Int. J. Hum.-Comput. Interact. 2014, 30, 547–559. [Google Scholar] [CrossRef]
- Chaudhuri, A.; Holbrook, M.B. The chain of effects from brand trust and brand affect to brand performance: The role of brand loyalty. J. Mark. 2001, 65, 81–93. [Google Scholar] [CrossRef] [Green Version]
Publisher’s Note: MDPI stays neutral with regard to jurisdictional claims in published maps and institutional affiliations. |
© 2022 by the author. Licensee MDPI, Basel, Switzerland. This article is an open access article distributed under the terms and conditions of the Creative Commons Attribution (CC BY) license (https://creativecommons.org/licenses/by/4.0/).