Article

FIRE: A Finely Integrated Risk Evaluation Methodology for Life-Critical Embedded Systems

1
Electrical and Computer Engineering Department, University of Arizona, Tucson, AZ 85719, USA
2
Department of Surgery, University of Arizona, Tucson, AZ 85719, USA
*
Author to whom correspondence should be addressed.
Information 2022, 13(10), 487; https://doi.org/10.3390/info13100487
Submission received: 12 August 2022 / Revised: 6 October 2022 / Accepted: 6 October 2022 / Published: 10 October 2022
(This article belongs to the Special Issue Secure and Trustworthy Cyber–Physical Systems)

Abstract

:
Life-critical embedded systems, including medical devices, are becoming increasingly interconnected and interoperable, providing great efficiency to the healthcare ecosystem. These systems incorporate complex software that plays a significantly integrative and critical role. However, this complexity substantially increases the potential for cybersecurity threats, which directly impact patients’ safety and privacy. With software continuing to play a fundamental role in life-critical embedded systems, maintaining its trustworthiness by incorporating fail-safe modes via a multimodal design is essential. Comprehensive and proactive evaluation and management of cybersecurity risks are essential from the very design to deployment and long-term management. In this paper, we present FIRE, a finely integrated risk evaluation methodology for life-critical embedded systems. Security risks are carefully evaluated in a bottom-up approach from operations-to-system modes by adopting and expanding well-established vulnerability scoring schemes for life-critical systems, considering the impact to patient health and data sensitivity. FIRE combines a static risk evaluation with runtime dynamic risk evaluation to establish comprehensive risk management throughout the lifecycle of the life-critical embedded system. We demonstrate the details and effectiveness of our methodology in systematically evaluating risks and conditions for risk mitigation with a smart connected insulin pump case study. Under normal conditions and eight different malware threats, the experimental results demonstrate effective threat mitigation by mode switching with a 0% false-positive mode switching rate.

1. Introduction

Life-critical embedded systems such as medical devices are becoming increasingly ubiquitous and interconnected with the digital health ecosystem. They provide great conveniences and benefits to patient care. This has been especially possible due to the extensive hardware, software, and network connectivity incorporated in such embedded systems. However, with such complexity and pervasive network access, life-critical embedded systems are exposed to security vulnerabilities throughout their lifecycle [1]. An inevitable side effect of such complex networked embedded systems is a wide security attack surface that may directly impact patients’ health and safety if a device is compromised. Several efforts have demonstrated that the vulnerabilities can be exploited to perform life-threatening hacks on pacemakers, implantable cardiac defibrillators, and insulin pumps [2,3]. Furthermore, as recently as August 2017, the U.S. Food and Drug Administration (FDA) recalled more than 465,000 implantable cardiac pacemakers after detecting vulnerabilities that could allow an attacker to reconfigure them. In addition, the FDA recalled several models of an insulin pump implanted in over 4000 patients that allowed an unauthorized person to wirelessly access it and change settings.
With enormous security threats looming and far-reaching impacts on patient safety, we posit that the design and development of such life-critical embedded system software should integrate automated methods for security risk assessment and management [4]. Moreover, to reinforce our position, regulatory bodies mandate following premarket and postmarket guidelines for managing security risks for medical device software [5]. A cybersecurity vulnerability assessment methodology, such as NIST’s Common Vulnerability Scoring System (CVSS), is utilized during design to quantify (i.e., score) vulnerabilities and determine an appropriate need for a response [6]. However, this specification does not provide a metric for scoring life-critical system security vulnerabilities for health and data sensitivity, and hence the CVSS-based Medical Vulnerability Scoring System (MVSS) was formalized [7].
These risk assessment schemes are static and used prior to deployment. Furthermore, they do not provide runtime risk assessments, which are quintessential for enabling life-critical embedded systems to automatically manage risks in the case of a security threat, particularly zero-day attacks. In addition, the postmarket management of cybersecurity vulnerabilities requires estimating the probability of the exploits, assessing and evaluating risks to patient safety, and timely risk management and mitigation. A proactive and comprehensive finely integrated risk evaluation methodology is essential. Tangentially, Boehm [8] emphasized the need for good risk management for successful software projects and security. This adds an additional design factor requiring a further expansion of risk assessment and control techniques for software. By carefully evaluating security risk impacts on health and data sensitivity from fine-grained device-level operations up to the system level and by incorporating adaptive risk evaluation schemes, security risks can be automatically managed throughout a device’s lifecycle.
Security risk assessment generally has two elements: (i) the probability of a security threat and (ii) the impact on patient safety if a vulnerability is exploited [5]. We assume that a threat detector is incorporated within the system, such as the probabilistic threat detection and estimation design described in [9]. Notably, the key benefit of the use of a threat detector is to provide an estimate of the threat probability at runtime, which can be used by an automated risk evaluation methodology to provide only the necessary amount of mitigation. In order for a system to automatically mitigate threats while ensuring that life-critical operations remain uninterrupted, software for such systems has been shown to be beneficial if designed in a multimodal fashion based on the works in [10,11]. Such multimodal systems can perform runtime threat mitigation by automatically switching operating modes based on the evaluated system risk while still maintaining necessary functionalities. However, the composite risk assessment model used in these works is a preliminary investigation and does not consider the impact on health and data sensitivity as per established risk assessment guidelines. Furthermore, it is important to manage the system end to end from threat detection to mitigation, especially to ensure that false positives in detection do not result in erroneous mode switching.
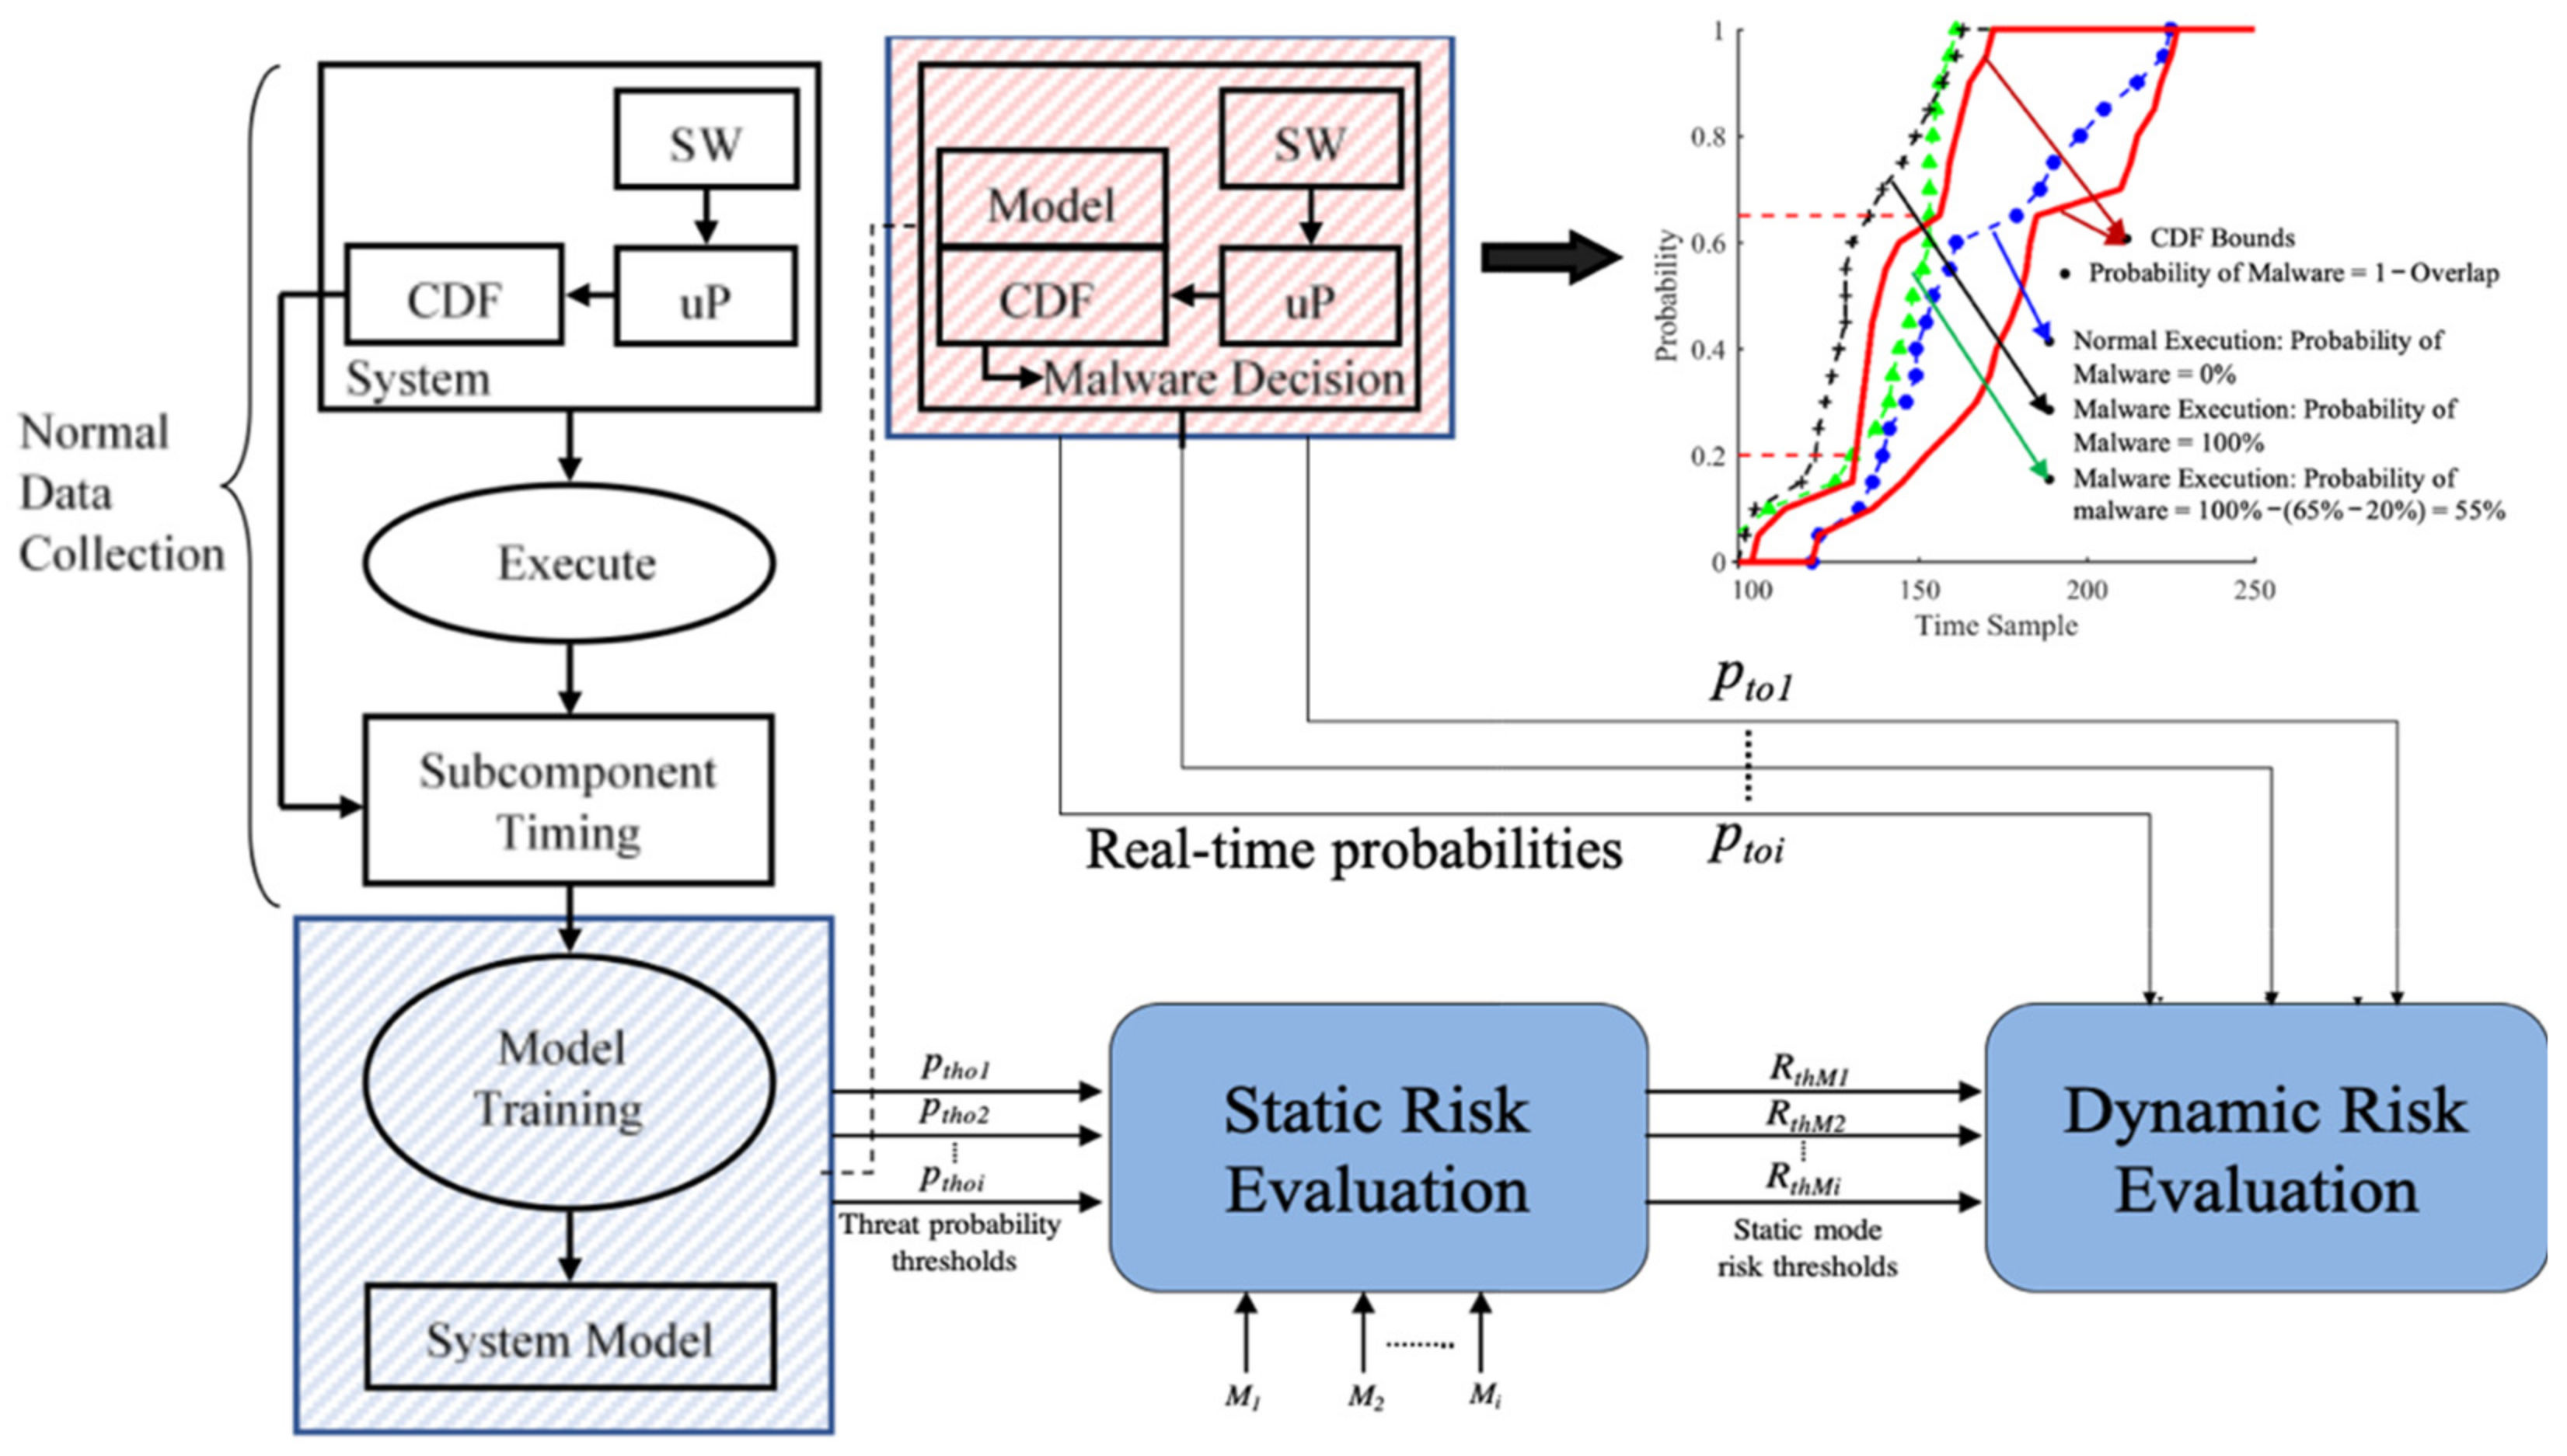
In this paper, we develop a reactive comprehensive risk evaluation approach by presenting FIRE, a finely integrated risk evaluation methodology for life-critical embedded system design (illustrated in Figure 1). To our knowledge, this is the first approach that considers security threat impacts on health and data sensitivity from fundamental operations to the system level and augments an adaptive risk evaluation scheme during runtime to assist in threat mitigation. Specifically, we make the following contributions:
  • During design—Static risk evaluation: (i) We assign baseline security-health and security-data-sensitivity impact scores in terms of confidentiality, integrity, and availability metrics to fundamental device operations [6,7]. These scores are aggregated to the composing software tasks using a fuzzy union to generate task impact scores. Task risks are calculated using these impact scores. The task risks are accumulated to the successive operating mode risks. Mode risks are normalized in the range of [0–10.0] to adhere to popular standards established in the Common Vulnerability Scoring System (CVSS) [6]. We build a weighted hierarchical control-flow risk graph (HCFRG) for static and dynamic risk evaluation. An HCFRG is defined as a control-flow graph where the nodes are operations, software tasks, and modes weighted by the calculated risk-impact scores. (ii) We utilize the threat probability thresholds of individual operations provided by a threat detector, such as described in [9], to establish static risk thresholds for each software mode. The calculated static risk thresholds assist in automatically ordering the operating modes in a monotonically increasing fashion of security risk impact. During deployment, these thresholds also establish the risks beyond which the mode is likely compromised by a security threat.
  • During deployment—Dynamic risk assessment: Using the HCFRG, the dynamic operations, tasks, and system-level risk are assessed using threat probabilities measured at runtime by the threat detector. This approach ensures robustness by utilizing the same static design time model at runtime to assess the risks of threats.
  • Systematic evaluation: With the static mode risk threat threshold and dynamic risk evaluation established, a systematic analysis is performed to analyze the impact of the overall system risk by potential security threats affecting differing numbers of operations and with a range of threat probabilities (from 0 to 1.0). This evaluation seeks to generalize our approach for a broad range of possible security threats and analyzing the criteria under which appropriate mitigative actions must be taken, independent of the threat detector utilized. In addition, the results and evaluation help in designing the modes of the system by providing tradeoff metrics for composing operations and their risk impacts to the system.
  • Experimental evaluation: We perform a model-based simulation to demonstrate and evaluate the FIRE methodology, provided that life-critical embedded systems’ (medical devices’) software is a protected IP by manufactures and lacks well-documented open-source medical device software, particularly in a multimodal fashion. We simulate FIRE in a multimodal software model of a smart connected insulin pump and evaluate it based on risk assessment and management, the false-positive mode switching rate, the mode switching latency, and deviations in threat probabilities by injecting the model with eight different malware samples.
The rest of the paper is organized as follows: We provide the related work in Section 2, the system overview and assumptions are described in Section 3, and detailed descriptions of the FIRE methodology and the static and dynamic risk evaluation are provided in Section 4, Section 5 and Section 6. We state our threat model in Section 7, showcase our methodology and its evaluation on a smart connected insulin pump case study in Section 8, and conclude with future work in Section 9.

2. Related Work

Embedded system security has been shown to be ad hoc, and the requirements for embedded systems to incorporate runtime monitoring and system-level visibility of components and activities to establish a cyber-resilient foundation are firmly posited in [12,13]. An expansive body of work exists in security risk assessment and management, but we limit our related work to the realm of adaptive risk assessment and management for embedded and cyber-physical system software.
Cybersecurity risk evaluation and management approaches have been discussed in critical infrastructure and cyber-physical systems (CPSs) [14,15,16,17]. Security challenges, requirements, and potential solutions for CPSs are discussed in [14]. A requirement for an integrated multilayered security and privacy solution for a CPS and its applications without disrupting real-time operation is strongly emphasized in the literature. Kure et al. [15] propose a framework for CPSs in critical infrastructures based on the key performance impact (KPI) and asset criticality of the infrastructure that provides guidance to organizations for analyzing known vulnerabilities and attack scenarios and provides security controls based on the identified risk levels. Bialas’s work [16] proposes a similar structured risk management tool (CIRAS) based on a bow-tie model of the impact of a hazardous event on the assets and processes of the infrastructure. It provides worst-case, total, and product models based on the category of impact. The tool provides necessary cost–benefit parameters to assist in the selection of an appropriate security measure along with risk reassessment when the countermeasure is implemented.
Similar approaches to our proposed framework have been discussed in critical infrastructures [17] and IT infrastructure networks [18]. Baiardi et al. [17] proposed a hierarchical model-based hypergraph where nodes are modeled as infrastructure components with security attributes (confidentiality, integrity, and availability) and arcs are representative of the security dependencies between the components. Hierarchical decomposition is utilized to compute attack paths and adopt defined risk mitigation plans. An analogous approach using fuzzy cognitive maps with an added asset utility value was demonstrated for an e-health system by Szwed and Skrzyński [19]. A dynamic security risk management method using Bayesian attack graphs was proposed by Poolsappasit et al. [18] that combines static risk assessment with dynamic risk evaluation in order to assist in efficient decision making for choosing security-hardening measures. The CVSS is used to estimate the attack likelihood to help network administrators pick optimal mitigation plans. However, in the context of life-critical systems, security scores need to consider the impacts on health and data sensitivity while ensuring the adaptive risk assessment and management method can assist in mitigating threats in real time to ensure the sustained life-critical functioning of the system.
In the area of life-critical systems and medical devices, security requirements are elicited based on a sequence-based enumeration of the medical device software to identify possible malicious events [20] and a preliminary hazard analysis to evaluate security hazards in a high-level hypothetical medical device [21]. Complementary approaches to our work have been detailed in [22,23]. Sango et al. [22] proposed a model-based design coupled with safety and security risk analyses for medical devices. Their work drives the need to consider security and safety analysis from the very design of medical devices. Alternatively, Ngamboe et al. [23] develop an analytical threat-based approach to analyze the impact risks of security attacks and the probability of the occurrence of such attacks. The authors determined and quantified the impacts of attacks, including health and privacy, along with identifying the threat vectors and their probability of occurrence in order to calculate the overall risk associated with their combination. Even though these methods provide viable risk assessment measures, they are designed only for known possible vulnerabilities, they are not deeply integrated into the system software, and they do not provide an adaptive risk model for automatic risk management by threat mitigation in real time. Such approaches only provide metrics and information about the system risk and rely on manual risk management and mitigation methods.
The closest works to our proposed methodology in this paper are the methods established in [24,25]. Ni et al. [24] proposed a formal object–message–role (OMR) model and a tightly coupled risk assessment method during the early-stage development of safety-critical real-time embedded systems. The OMR model establishes the fundamental operations, data transmissions, and respective roles and permissions that help to specify the functional and security aspects of the system. This model assists the risk evaluation algorithm to assess system risk in order to locate operations or data transmissions at risk. However, their risk assessment methodology is static and only valid during design to identify potentially risky components. Our previous works [10,11] align with the solution proposed by Easttom and Mei [25] to adopt a multimodal software design to mitigate security risks. However, their work is limited only to two modes and is restricted to the software libraries used in deployment. Moreover, life-critical systems require runtime threat detection to assist with risk assessment and mode switching when necessary.
Hence, we posit that life-critical system risk evaluation methodologies are needed such that they: (i) enable the derivation and analysis of risks at the operation, software task, and system levels based on established security scoring guidelines and (ii) enable the runtime adaptation of risks based on the runtime probabilistic detection of threats to assist in threat mitigation by mode switching.

3. System Overview and Assumptions

Figure 2 depicts the software architectural overview of the threat detection and estimation system with the finely integrated risk evaluation system as conceptualized by our framework. We assume that the life-critical system has an on-chip threat detector and estimator, as in [9,26], and its software is designed in a multimodal approach as discussed in the research works [10,11]. We summarize the details of one such on-chip threat detector and estimator and multimodal design as follows:
System Assumption 1—Threat Detector and Estimator: The threat detector, as illustrated in Figure 2, is a hardware-based cumulative distribution functions based (CDF-based) anomaly detection method using timing subcomponents. The system is first executed under normal circumstances to collect timing samples to create a model of the expected system execution behavior. A hardware component analyzes the system nonintrusively, measures the time each operation takes to execute, and extracts the timing data of the different subcomponents (e.g., the timing overhead due to cache misses). A sliding window with a fixed size is utilized to collect the timing samples, adhering to the resource restrictions of life-critical embedded systems.
Once the required amount of timing samples has been collected, the CDF analysis (highlighted in blue) creates the normal model of the system. The model is created by analyzing the timing distribution of the different subcomponents using CDFs. The CDF boundaries define the expected behavior of the system under normal circumstances, and the thresholds define the maximum deviation from the expected behavior, beyond which the execution is considered malicious. The CDF boundaries and thresholds of all operations are obtained by statistically analyzing the data collected under normal circumstances. The lower boundary is constructed by the points in the CDFs that have the lowest cumulative probability at each timing value, and the upper boundary is constructed by the points in the CDFs that have the highest cumulative probability at each timing value. These boundaries define the per-operation probability threshold, pth, that is configured into the threat detector and used at runtime to determine if the runtime execution matches the expected CDF model or if the timing deviation is due to malicious activities.
At runtime (highlighted in red), the execution CDF of an operation is obtained and compared against these bounds to obtain the estimated threat probability, pt, which is defined as the percentage of the CDF values that fall outside the CDF boundaries. The malware classification is performed by a path-based historical CDF (PHCDF) that aggregates the estimated probabilities of malware at the runtime of several operations inside an execution sequence path (defined as a set of operations). The PHCDF-based threat detector achieved an average malware detection rate of ~86% with a false-positive rate of 0.07% for a medical device system. Details of this implementation and these results are presented in [9,26]. While the threat detector is implemented in hardware here, a software-based implementation is possible as well.
Specifically, for FIRE (as represented in Figure 2), we assume that a threat detector provides the runtime probabilities of all monitored operations {po1, …, poi, …, pon} as well as the per-operation probability thresholds {ptho1, …, pthoi, …, pthon}; that represents the threshold probability value above which an operation is said to be compromised. It is key to note that FIRE can support any threat detection system that can provide runtime threat probabilities of its operations.
System Assumption 2—Multimodal design: Adaptive cyber-physical systems, such as life-critical embedded systems, are generally designed in a multimodal approach in order to operate in different modes based on environmental and system conditions [27]. Such multimodal systems can be decomposed into operational modes where each mode represents a different device operational state that is characterized by a unique set of resource configurations and tasks. These modes mainly facilitate embedded systems with the efficient use of resources, adaptability, schedulability, and system configurability. Mode switches are triggered by system and environmental changes that require software to orchestrate the modifications of the underlying embedded software tasks and operations. Our previous works [10,11] have showcased that such a multimodal software design can be utilized to incorporate trustworthiness while maintaining safety in medical devices. Hence, we assume that the system’s software is designed in a multimodal fashion to support several unique operational modes, M = {M0, …, Mi, …, Mk}, where each mode represents a software implementation of the system. M0 represents the essential mode for the baseline functioning of the system, and its implementation is contained in every other mode. Each mode is composed of a set of software tasks, T = {T1, …, Ti, …, Tl}. A software task or thread represents the execution context of a piece of software in a processor (for example, calculation_thread, communication_thread, etc.). Each software task, Ti, can have multiple different execution sequences that we call paths, i.e., Ti = {P1, …, Pi, …, Pm}. A path, Pi, is defined as a specific sequence of operations that execute at the same rate inside the task, Ti. Each task and, in turn, path represents a control-flow graph of the embedded system operations, O = {o1, …, oi, …, on}. An operation, oi, is defined as the low-level system or function call (for example, read_sensor, write_actuator, etc.).
System Assumption 3—System Hardware: The system hardware is implemented on a processor that has a secure enclave to establish trust for: (i) performing the safety-critical tasks in the essential mode, M0, and (ii) threat detection and estimation. This processor can be a single- or multicore that is capable of executing multiple software tasks, and the granularity of the threat detector is at the operation level. The runtime risk assessment component (i.e., FIRE) can be implemented on any such processor as long as it supports a trusted execution environment (as in [28]) such that it can securely access suitable APIs for assessing the system threats as well as provide system-wide risk mitigation actions by employing mode switching. We assume that the hardware and software implementation is capable of supporting multiple modes of operations and appropriate mode switching, as shown in the research works [29,30].

4. FIRE Methodology

As highlighted in Figure 1 and Figure 2, in this work we describe the FIRE methodology that integrates a comprehensive risk evaluation method into the multimodal design from the operations-to-modes level. During design, a static risk evaluation utilizes the estimated probability thresholds of the monitored operations to establish static mode risk threat thresholds. These risk thresholds automatically align the operating modes in a monotonically increasing fashion of risk impact. During deployment, a dynamic risk evaluation uses the estimated threat probabilities of the operations from the threat detector to calculate the dynamic mode risks. The dynamic mode risks and the established static thresholds provide a runtime risk assessment that aids in automatic risk mitigation. We evaluate the generalizability of FIRE by considering security threats across the entire range of threat probabilities to robustly establish risk assessment and the criteria for mitigation decisions.

4.1. Definitions

We adhere to the standard nomenclature and definitions as described in the CVSS but define the specifics pertaining to utilizing the MVSS in the FIRE methodology as follows:
  • Security Value: the security value is defined as the fuzzy value describing the impact of the security exploit to the health and data sensitivity of the life-critical system.
  • CIA Impact Score: The impact score is a weighted impact score of confidentiality, integrity, and availability based on the assigned security values for health (Ch, Ih, and Ah) and data sensitivity (Cs, Is, and As). The weights can be assigned by security standards such as the CVSS.
  • Security Risk: Security principles state the definition of security risk as the likelihood of a security threat times the impact that the threat causes to the system (i.e., Risk = impact score×p, where p represents the probability of a threat and impact score is the CIA value). In our work, the CIA impact score is assigned during static risk evaluation, and the probability of a threat is provided by the threat detector and estimator at runtime.
  • System Risk Threshold: the system risk threshold, RS, represents the system risk value beyond which the security threat impacts life criticality and threat mitigation by mode switching is needed.
  • Operational Threat Probability:ptoi is the threat probability of an operation that is provided by an on-chip threat detector and estimator.
  • Operation Threat Probability Threshold: pthoi represents the operation probability threat value beyond which the operation is said to be compromised.

4.2. Hierarchical Control-Flow Risk Graph

To finely integrate the risk methodology with the software of a multimodal life-critical system, we developed a formal representation that we call a hierarchical control-flow risk graph (HCFRG). The HCFR graph is a directed graph representing the augmentation of a control-flow graph with the evaluated risks across the hierarchical levels of the multimodal software design, viz. modes, tasks, and operations. It is illustrated in Figure 3 and is defined as a tuple HCFRG = (SL, P, I, R, π , τ), where:
(1)
SL represents a finite set of states, S, at the respective multimodal hierarchical levels, L, such that L {M     T     O}, where M is the set of modes, T is the set of tasks, and O is the set of operations.
(2)
P: (SL | L     O) is the labeling of the states at the operations level with the runtime threat probabilities from the threat estimator such that:
P   =     p thoi .. on ,   static   risk   evaluation   p toi .. on ,   dynamic   risk   evaluation  
(3)
I: (SL | L {O, T}) is the labeling of the states at the tasks and operations levels with the associated CIA impact scores.
(4)
R: (SL | L {T, M}) is the labeling of the states at the tasks and modes levels with the corresponding computed risks using the risk calculation function, π .
(5)
π is the FIRE risk calculation and assessment function given the CIA impact scores, I, and runtime threat probabilities, P, such that   π   (I, P) = R.
(6)
τ SL × S’L is the state (mode) switching transition from (SL | L Mi) (S’L | L M0, …, i−1), where i represents the current operating state of the system.
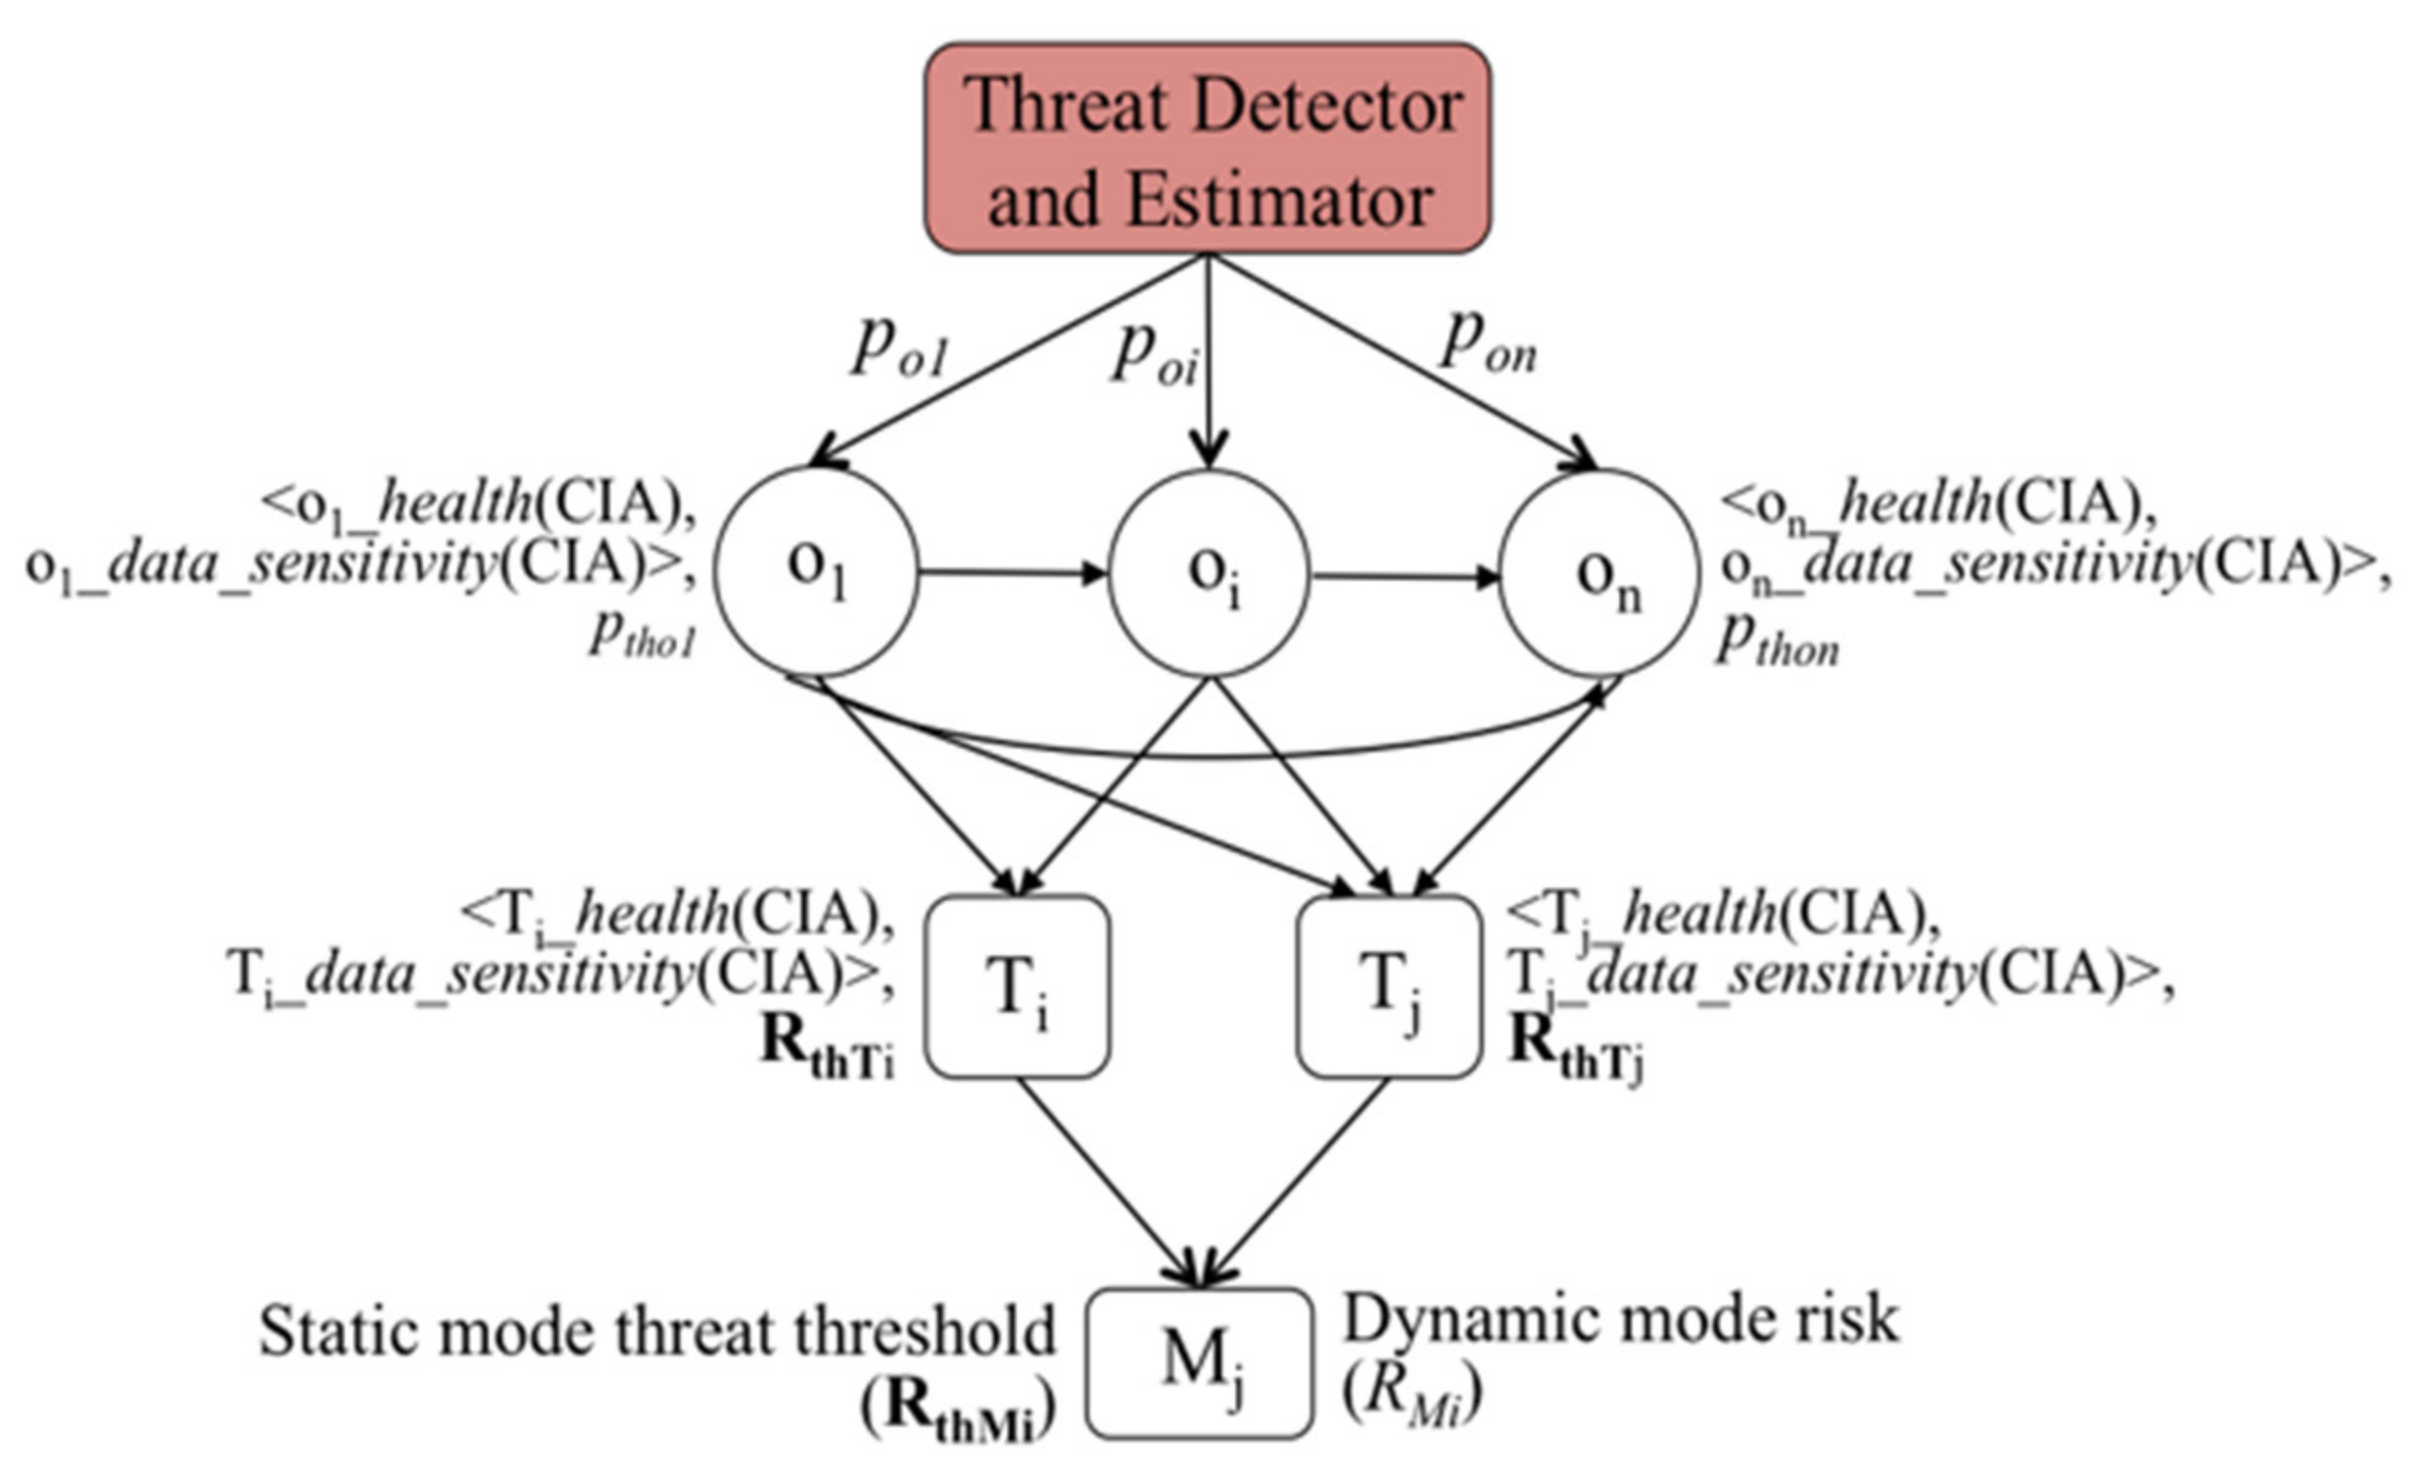
Figure 3. Illustration of the HCFR graph.
Information 13 00487 g003

5. Static Risk Evaluation

The HCFR graph is utilized for static risk evaluation during the multimodal software design.
Operation level: Every operation, oi, is assigned a tuple of standardized confidentiality, integrity, and availability (CIA) impact scores for health and data sensitivity as oi ~ <Ch, Ih, Ah, Cs, Is, As>. We incorporate CIA scores specifically for health (h) and data sensitivity (s) that are defined as the impact the compromise of the CIA values has on the health of the patient and the sensitivity of patient data, respectively. The assigned CIA impact scores are based on metrics defined in a variation of NIST’s standardized Common Vulnerability Scoring System (CVSS) extended for medical devices called the Medical Vulnerability Scoring System (MVSS) [7]. The MVSS’s efficacy in scoring vulnerability impacts on health and data sensitivity is demonstrated by: (i) showing an improvement in accuracy when scoring vulnerabilities for medical devices over the CVSS and two ranking systems targeting medical devices and (ii) evaluating the scoring by comparing the rankings of a list of assessed vulnerabilities against experts’ assessments to validate that it yielded a ranking closer to the experts’ opinions. Additional details on the MVSS metrics, results, and their scoring computations can be found in [7]. The MVSS provides standardized CIA impact values in the range of [0, 1.0] on health and data sensitivity. We summarize the values of data sensitivity and health impact metrics on CIA in Table 1.
Task level: With the operations’ impact scores assigned, these values are then propagated to the tasks in the FIRE graph by using a fuzzy aggregation operator [31]. Fuzzy methods have been commonly used for security risk evaluation, as they better represent the likelihoods of threats and impacts [32]. We utilize the Hamacher sum as the fuzzy aggregator operator. The Hamacher sum is a t-conorm operator that emphasizes highly possible values in the final aggregated value. For security risk evaluation in life-critical systems, it is important that operations with relatively higher security scores (even in one criterion such as confidentiality, integrity, and availability) contribute more strongly to the final risk value compared to other operations. This is particularly important because an impact to security directly affects health and privacy, which themselves are key considerations for the risk methodology. Since the Hamacher sum provides the characteristics required for security risk evaluation, it was chosen as the fuzzy aggregator operator. However, we wish to note that FIRE was designed to be a generalized risk assessment methodology that can utilize any relevant fuzzy aggregation operator or aggregation operator in general. However, a comparative study of utilizing a range of fuzzy aggregation operators is beyond the scope of this paper.
We calculate the aggregated task CIA impact scores as follows:
T i ~   < C h , I h , A h , C s , I s , A s >   = [   ( o 1 ~ < C h , I h , A h , C s , I s , A s >   ×   p o 1 )  
o i ~ < C h , I h , A h , C s , I s , A s >   ×   p oi )    
( on ~ < Ch , Ih , Ah , Cs , Is , As >   ×   p on )   ]
where ~ is the association of the right-hand side CIA tuple to the corresponding left-hand side task or operation, p is the threat probability of the operation provided by the threat detector, and represents the Hamacher sum. The Hamacher sum is calculated as:
x y = x + y ( 2 · x · y ) 1 ( x · y )
where x and y represent the fuzzy input values in the range of [0, 1.0]. A single task security impact score is calculated as:
T isi = C h + I h + A h + C s + I s + A s ,   for   T i ~ < C h , I h , A h , C s , I s , A s >
With security risk defined as in Section 4.1, the task risk is calculated as:
RTi = Tisi × sf
where, sf is a scaling factor to normalize the calculated risk in the range of [0–10.0] to conform to the established regulatory standards [5,6]. We calculate security risks at the task level, as they represent the basal abstraction level of the system’s software. The static task risk threat threshold, RthTi, is calculated by: (i) assigning poi..on = pthoi..on in (1), where pthoi..on are the operation threat thresholds provided by the threat detector during design and (ii) using (2) and (3) to calculate RthTi.
Modes level: A widely established security principle is “security is only as strong as the weakest link”. Taking this into consideration, the security risk of a mode is stated as the risk of the least secure task (i.e., the task with the highest inherent risk). Hence, the mode risk threshold of mode i, is calculated as follows:
R thMi   = max   ( R Te , .. ,   R Ti , .. ,   R Tl   )
where Mi = {Te,..,Ti,..,Tl} are the set of tasks in mode i. We calculate mode risk threat thresholds for all the modes of the system. The overall system risk threshold is defined as the risk threshold of the current operating mode of the system, RS = RthMi, where Mi is the current operating mode of the system.

6. Dynamic Risk Evaluation

The HCFRG is also utilized during deployment to calculate the dynamic system risk to assist in runtime risk management and automatic threat mitigation by mode switching. The advantage of the HCFRG is that the propagation equations are maintained for the dynamic risk calculation as in the static mode risk evaluation. This is specifically essential in life-critical systems that have limited computing resources. The dynamic risk evaluation equations follow (1)–(4) as:
T i ~ < C h , I h , A h , C s , I s , A s >   = [ ( o 1 ~ < C h , I h , A h , C s , I s , A s >   ×   p o 1 )  
( o i ~ < C h , I h , A h , C s , I s , A s >   ×   p oi )  
( on ~ < Ch , Ih , Ah , Cs , Is , As >   ×   p on ) ]
where poi = ptoi is the real-time threat probability of the operations.
RTi = Tisi × sf
R Mi   = max   ( R Te , .. ,   R Ti , .. ,   R Tl   )
Further, the dynamic risk evaluation is triggered only when the probability of the operations in real time is greater than the probability threshold of the operations, signifying the presence of a security threat.
Given the predefined thresholds of the operations, the dynamic risk evaluation filter condition (DREFilterCondition) can be evaluated at three levels: (i) per-operation (POT), (ii) per-task (PTT), and (iii) per-path (PPT). To evaluate the effectiveness of the three threshold conditions, we built a software framework incorporated with FIRE for a life-critical embedded system prototype and describe it below.
DRE Filter Condition Evaluation: The per-operation threshold condition is established as:
ptoipthoi
where an operation, oi, is considered compromised if the estimated real-time probability of the operation, ptoi, is greater than the predefined probability threshold of the operation, pthoi. The per-task threshold condition is defined as:
ptTipthTi
p thTi = 1 Π i = 0 j   ( 1 p thoi )
p tTi = 1 Π i = 0 j   ( 1 p toi )
where pthTi for Ti = { oi|i = 0,..,j } is the task threshold beyond which the task is compromised, defined as the probability that at least one operation in the task is compromised, and ptTi is the real-time estimated threat probability of the task. In our work presented in [26], we showed that a path-based threat detection yields higher detection rates and lower false-positive rates for several malware threats compared to making a decision using independent operations. Hence, we establish a per-path-based threshold condition defined as the probability threshold of the execution path beyond which the path is compromised. Each task, Ti = {P0,..,Pi,..,Pm}, is decomposed into its constituent execution paths based on the execution flow in the control-flow graph. The per-path-based threshold condition equations follow the per-task condition and are defined as:
pPipthPi
p thPi = 1 Π i = 0 l   ( 1 p thoi )  
p tPi = 1 Π i = 0 l   ( 1 p toi )
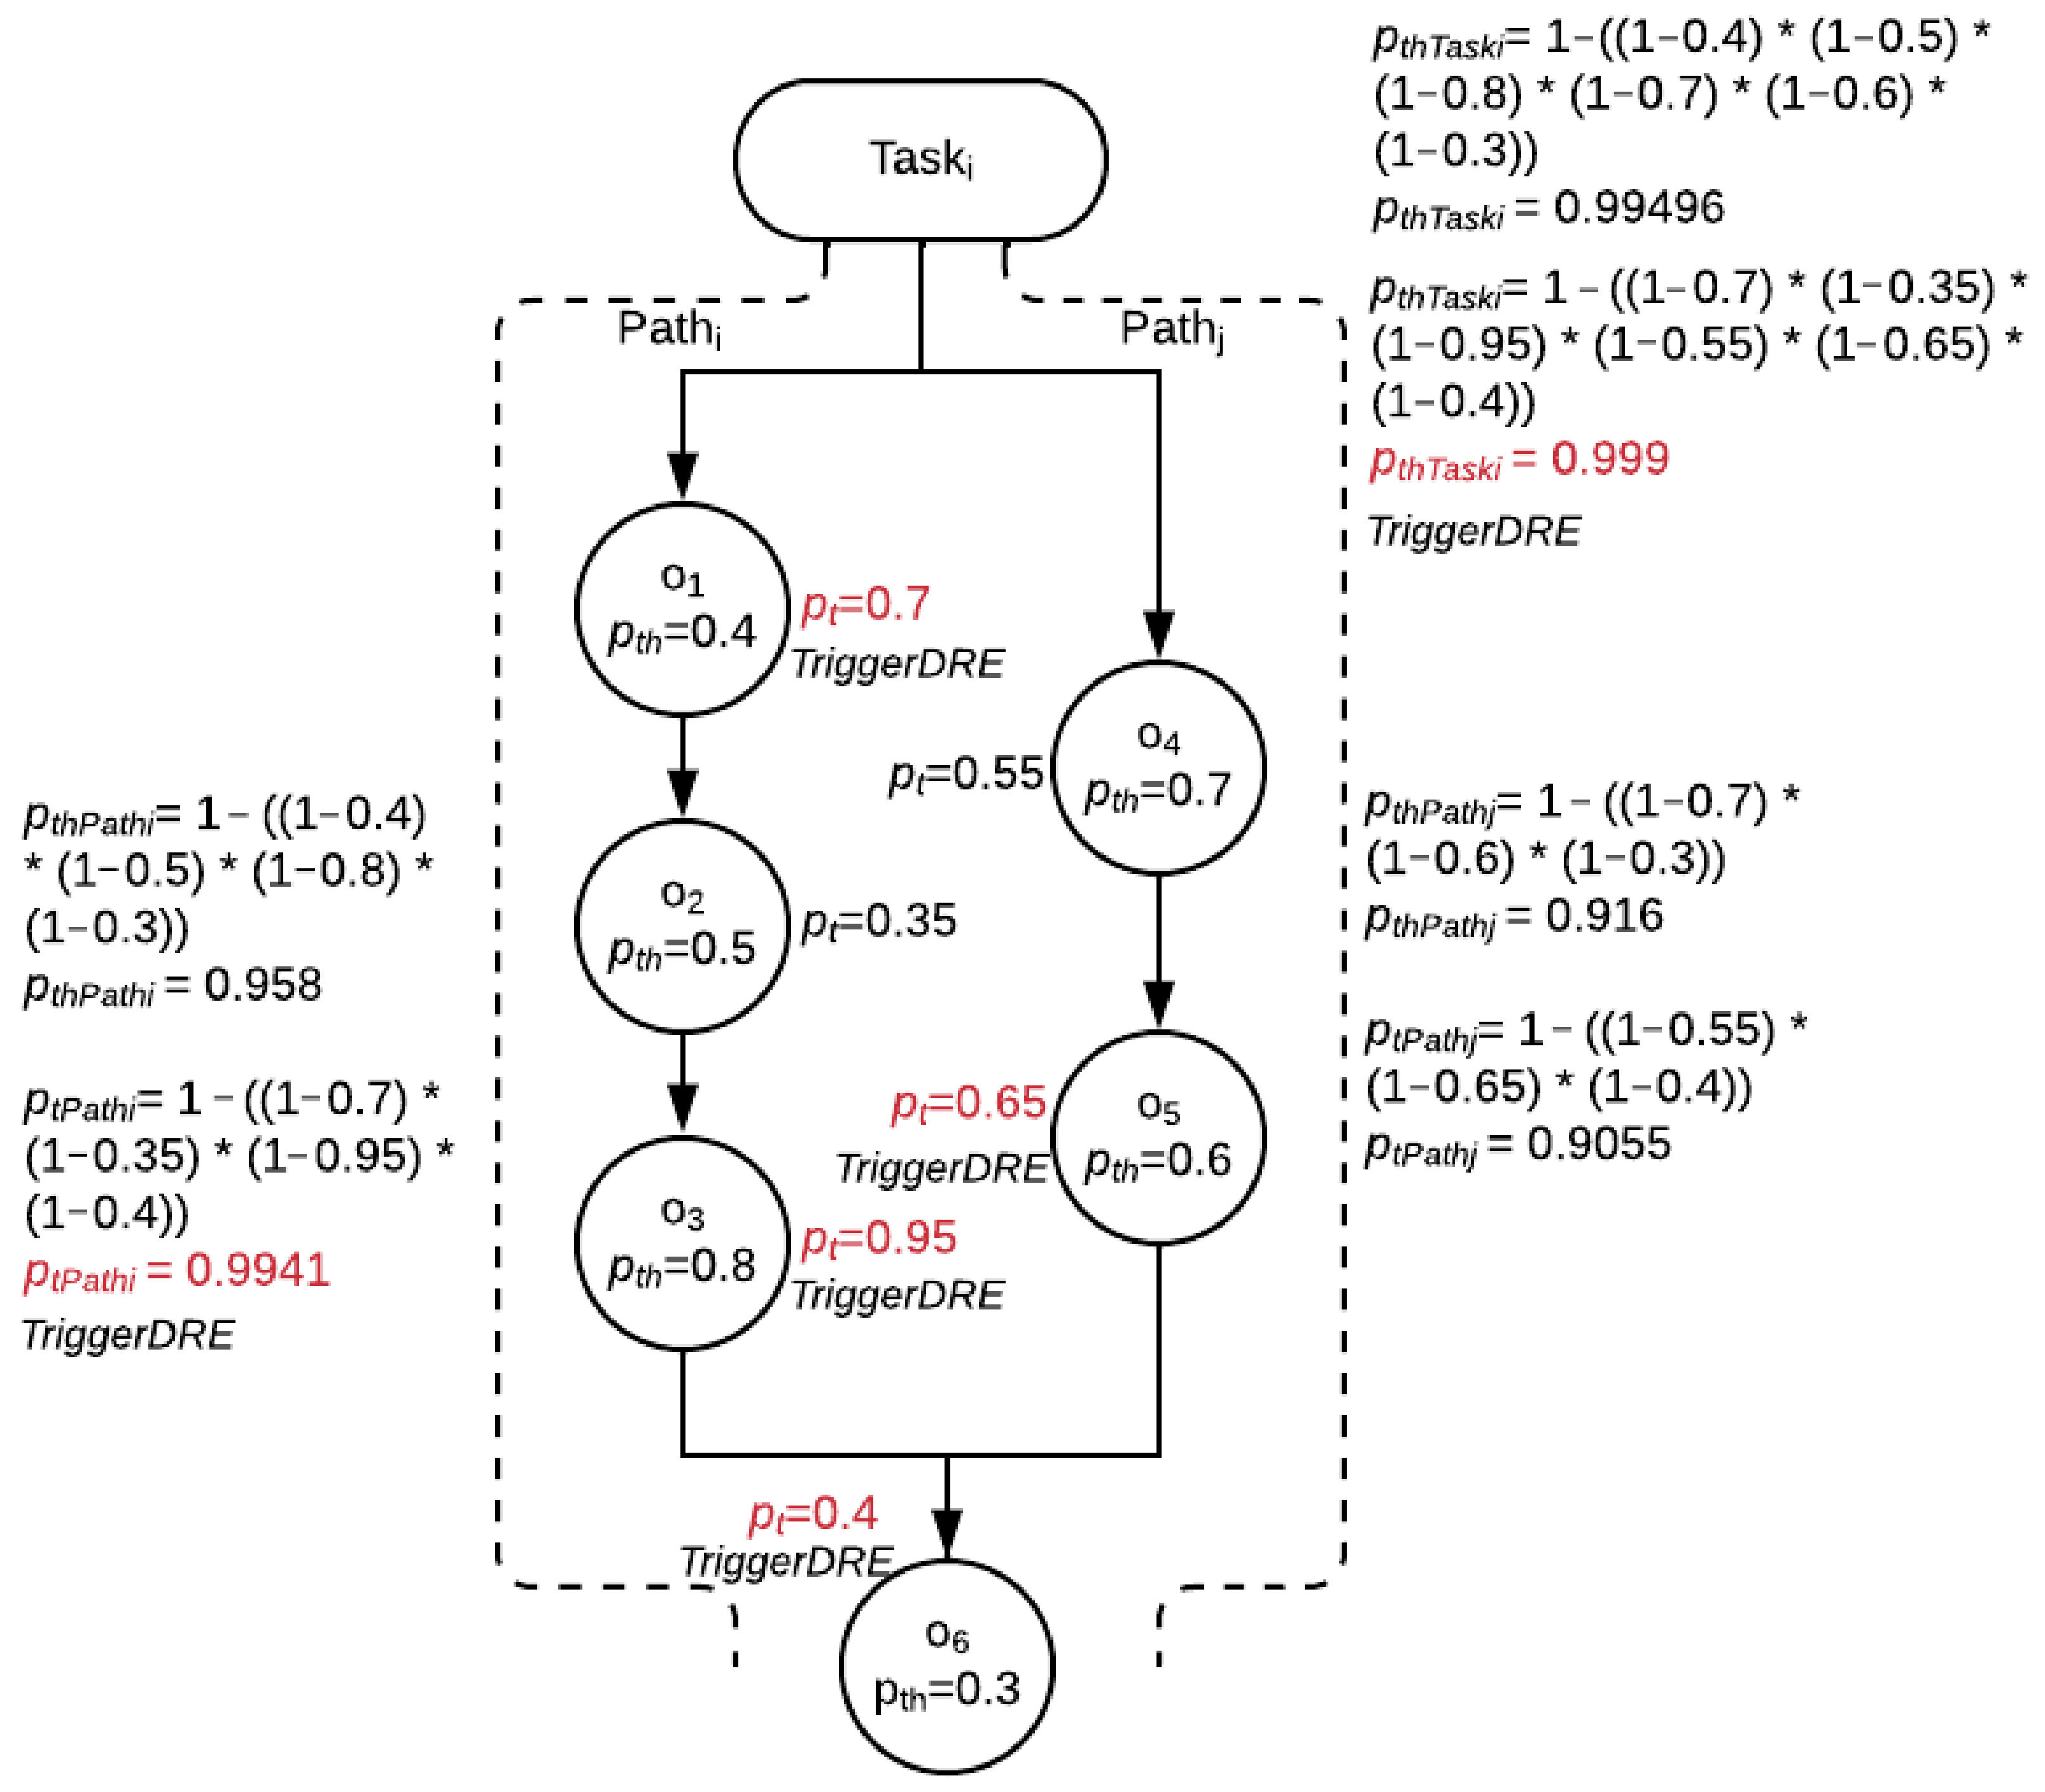
where pthPi for Pi = { oi|i = 0,..,m } is the path threshold beyond which the execution path is compromised and is defined as the probability that at least one operation in the execution path sequence is compromised, and ptPi is the real-time estimated threat probability of the path. An annotated illustration of the calculations as per POT, PPT, and PPT is shown in Figure 4.
Evaluation Setup: In order to evaluate the DRE filter conditions, we implemented a single-mode software model of an insulin pump that has one mode with seven tasks comprising 11 execution paths and 43 operations. To improve the threat detection and keep the overhead of the threat detector as minimal as possible, operations with false-positive rates greater than 5% are not good candidates and hence are not utilized for detection. Additionally, any operation with pthoi = 1.0 is also excluded. Irrespective of the operations not considered in threat detection, in our previous work [26] we demonstrated an average malware detection rate of 86%.
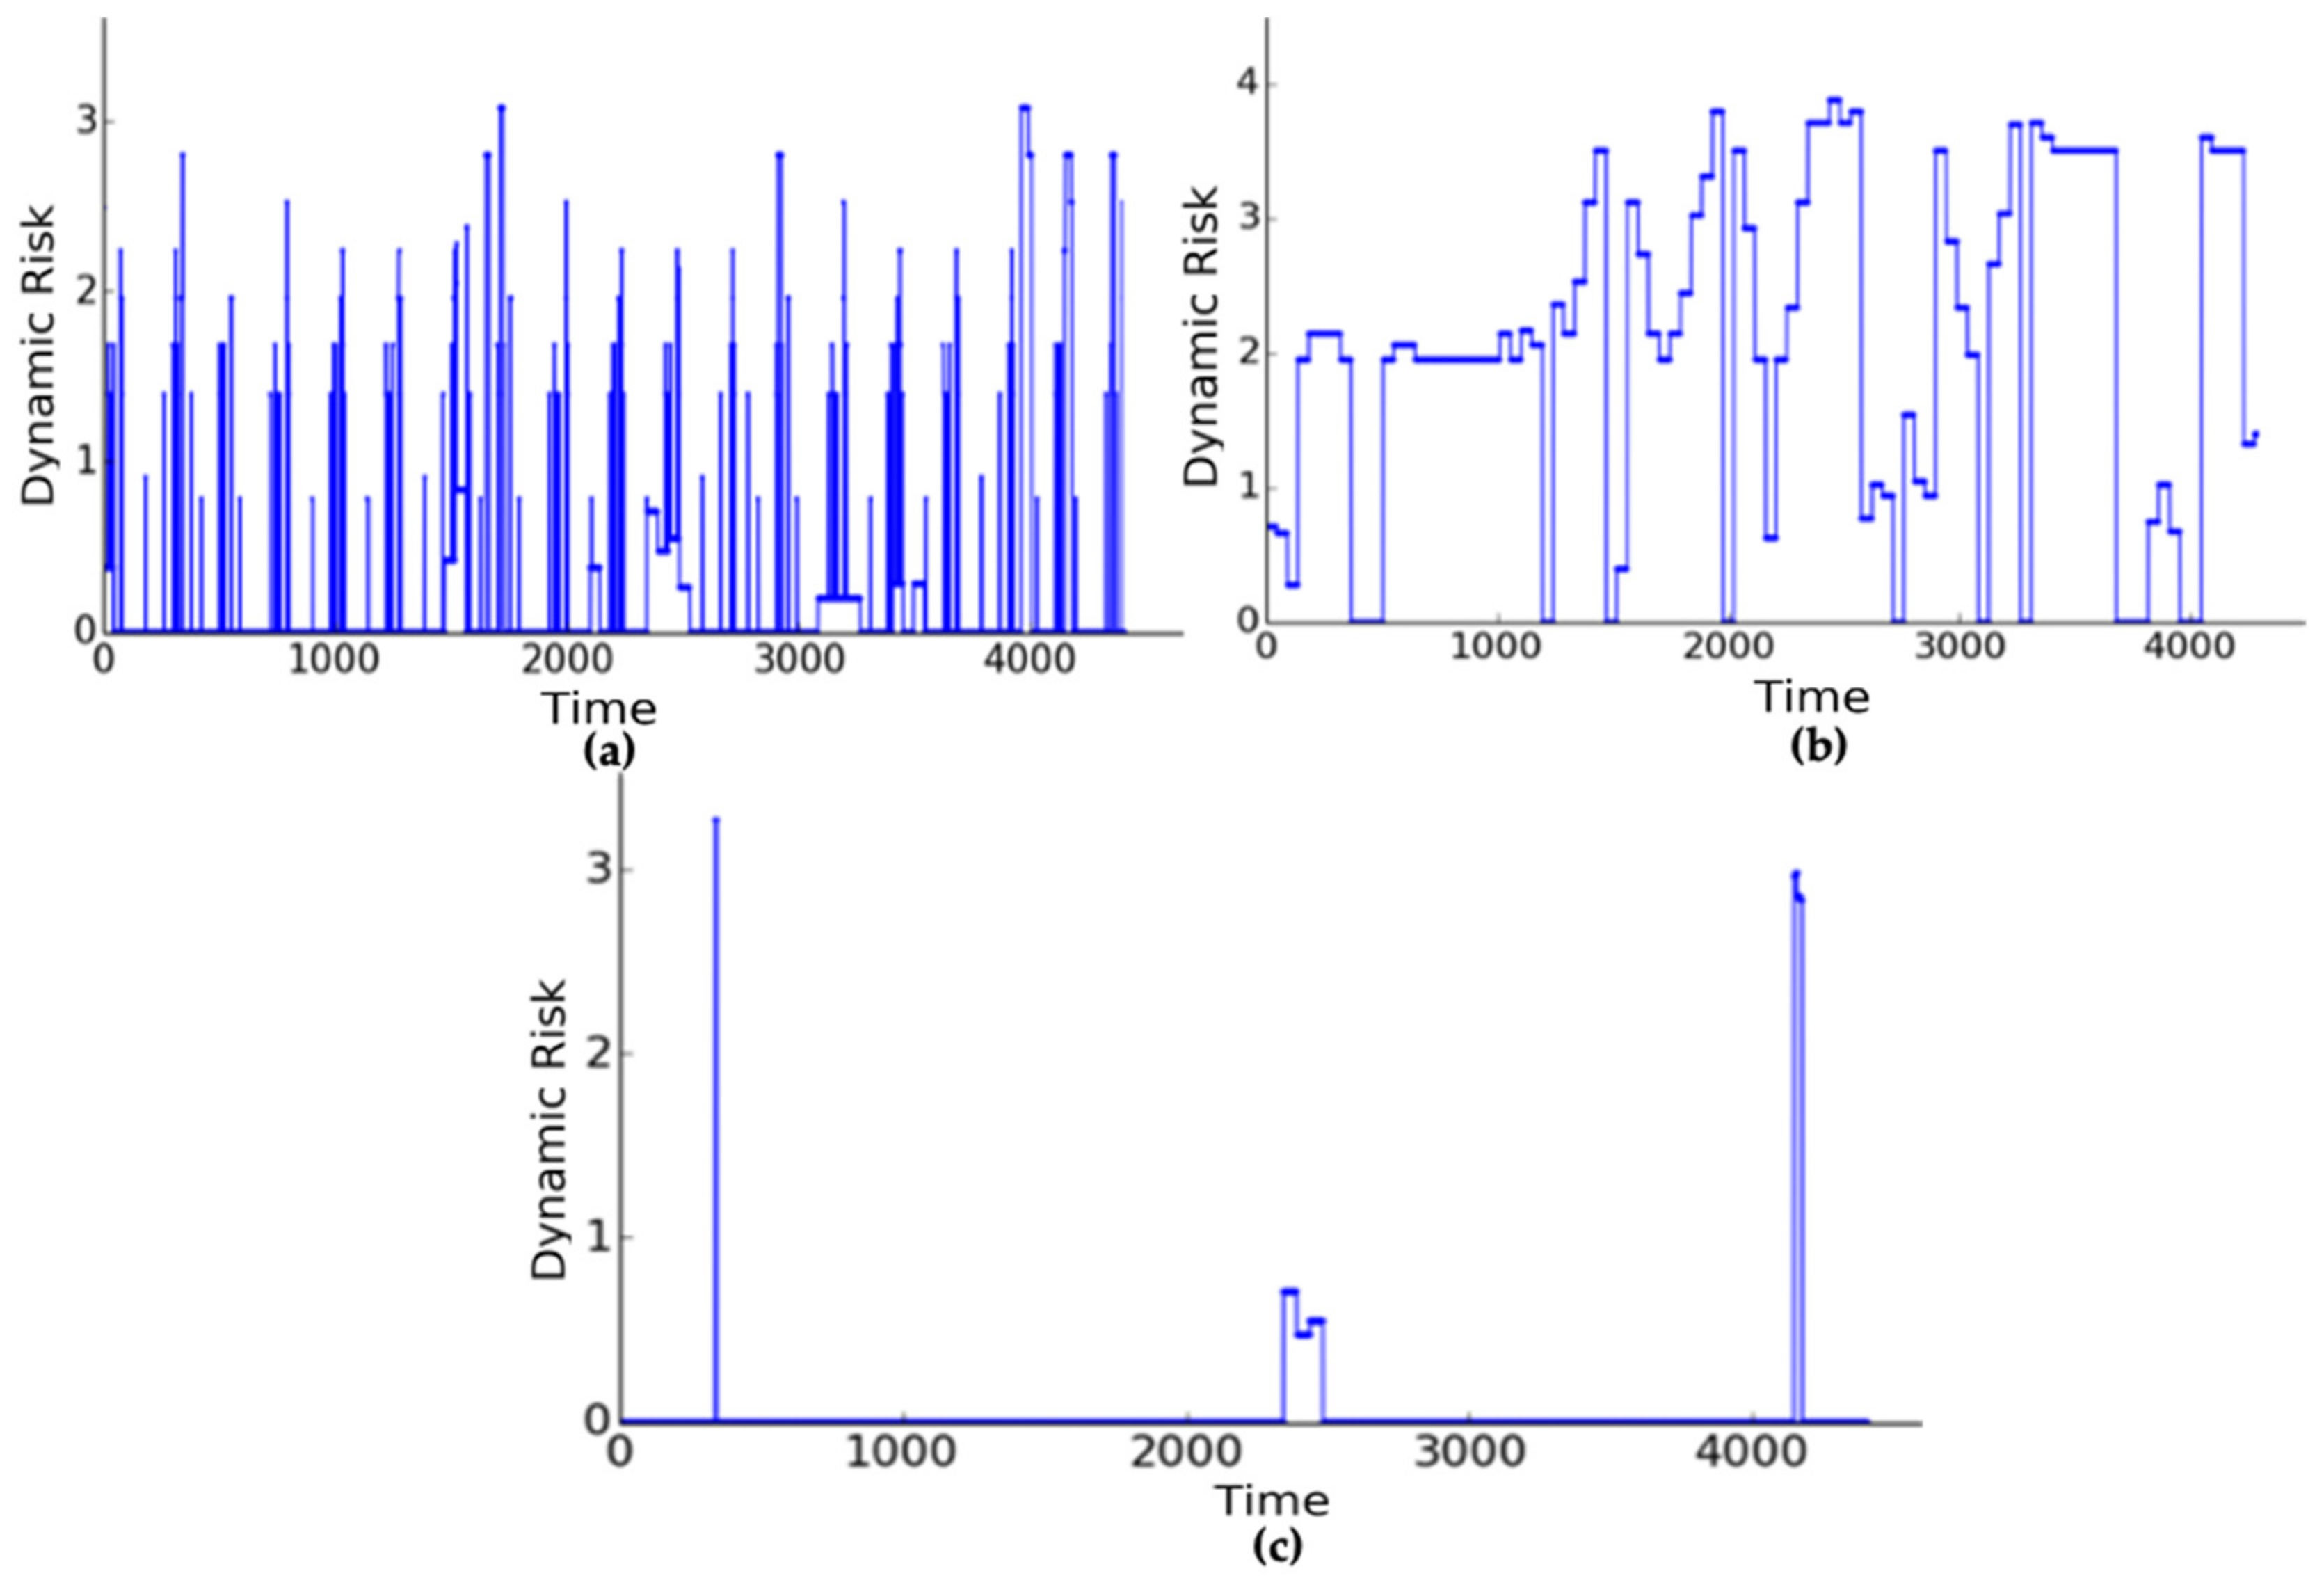
Analysis: The corresponding risks and successive static risk thresholds at the operating mode level are calculated as in Section 5. We evaluate the three DRE filter condition thresholds by running a normal execution trace of the insulin pump and calculating the dynamic real-time risks as in Equations (5)–(7). Under ideal normal operating conditions, DRE should not be executed (0% execution rate), as the real-time probability of an operation will always be less that the security risk threshold (i.e., RM1 = 0). The experimental results of utilizing POT, PTT, and PPT for a normal execution trace are shown in Figure 5, and the DRE execution rates are shown in in Table 2. The execution rates shown in Table 2 are attributed to the false-positive rate from the threat detector during normal operation, which has been shown to be up to 3.25% [26]. The dynamic risk evaluation in FIRE effectively assesses that the threat detector’s false positives from normal execution do not need mode switching mitigation. As shown, the PPT condition performs the best, with a 5.85% DRE execution rate, while the PTT condition performs the worst, with a 39% DRE execution rate. PTT has the worst performance because it accumulates the false positives of all its composing operations. By dividing the software tasks to individual execution paths, the execution rate is considerably reduced, as the false positives are isolated to their respective execution path, considering the behavior of the path.
Adaptive risk management is performed by the evaluation of the HCFRG during deployment, as shown in Algorithm 1. The inputs to the adaptive risk management algorithm are the current operating system mode and the static risk thresholds computed during design, as in Section 5. A dynamic risk evaluation is triggered by the DREFilterCondition (ptoi = 0,..,i,..,n, pthoi = 0,..,i,..,n) when the real-time threat probabilities of a path are greater than their respective thresholds. If the calculated dynamic risk of the system mode is greater than the established risk threshold of the mode, a significant security threat exists. The security threat is mitigated by switching the current operating mode to a lower mode such that the dynamic risk of the switched mode is less than its established threshold. We evaluate the boundary conditions of mode switching in our insulin pump case study in Section 8.3.2.
Algorithm 1: Adaptive Risk Management by Mode Switching
Static risk evaluation: evaluate (static_risk_thresholds)
RS = RthMs = k, k := highest operating mode
while (execution), do
if DREFilterCondition (ptoi = 0,..,i,..,n, pthoi = 0,..,i,..,n), do
  Dynamic risk evaluation: evaluate (RTi = 0,..,j,..,l)
 RMs = k = max (RTi = 0,..,j,..,l)
if RMk > RS do
    modeSwitch (Ms = e), e is switched mode | e < k
 RS = RthMs = e
end

7. Threat Model

The attacker is assumed to either have access to the system’s software or the ability to simulate the system execution to determine the execution sequence in order to create and inject the necessary security threat. We assume an attacker is able to remotely insert the malware into the system utilizing software that exploits a vulnerability, which may be known or unknown (simulating a zero-day vulnerability). Our simulation demonstrations are based on a compromised system where the vulnerabilities are already exploited by security threats (as in [3,33]). Three popularly established mimicry malwares are considered as threat scenarios, i.e., fuzz malware, data manipulation, and information leakage [9,34,35], and summarized below.
  • Health-Compromising Malware: In this category, we consider fuzz and data manipulation malware. The fuzz malware is a mimicry malware that interferes with a system’s predefined functionality by slightly changing (i.e., randomizing) data [34,35]. In our application, the fuzz malware is implemented at two levels, namely 20% and 100% randomization, which enables the evaluation of risk at different fuzzification levels. The data manipulation malware manipulates data within the target system to disrupt normal control-flow execution. These types of malwares can cause a direct threat to the health of a patient.
  • Data-sensitivity-Compromising Malware: the information leakage malware breaks confidentiality by covertly leaking private data stored in the system to an unauthorized party.
  • Synthetic Security Threats: We also implement synthetic security threat scenarios by injecting actual malware samples in specific execution paths. This is carried out to demonstrate the functionality of FIRE and how risks are managed by mode switching, which involves single- and multiple-mode switches based on the compromised operations/tasks.

8. FIRE Evaluation: Insulin Pump Case Study

We evaluate FIRE for a smart, connected, multimodal insulin pump case study. Since we are unaware of actual multimodal implementations of life-critical systems, we developed a control-flow graph (CFG) software model of a multimodal, smart, connected insulin pump to simulate and evaluate FIRE for various real-world security threats.

8.1. Multimodal Design

We showcase and evaluate the FIRE methodology with a smart connected insulin pump case study. An insulin pump is a life-critical embedded system that monitors the glucose level of a patient and injects a suitable amount of insulin into the blood stream when needed. We model our smart connected insulin pump on the design in [36]. The insulin pump is initially configured by a physician during implantation based on the patient’s history and insulin requirements. If necessary, the patient can manually inject a required dose of insulin using the on-device buttons. The glucose level of the blood stream can either be measured using a manual glucose meter or a continuous glucose monitor (CGM). The device and insulin temperature are monitored via sensors in the pump in order to maintain proper operation. The smart connected insulin pump features include: (i) the connection of the insulin pump to a smartphone via Bluetooth to keep track of the functionality, send alerts, and check dosage/glucose levels and (ii) wireless information transfer via WiFi to the healthcare cloud for remote monitoring and reconfiguration by a physician. With its wireless links and sensitive data, the smart connected insulin pump provides a wide attack surface that can be exploited for potentially life-threatening security attacks, as demonstrated in [3].
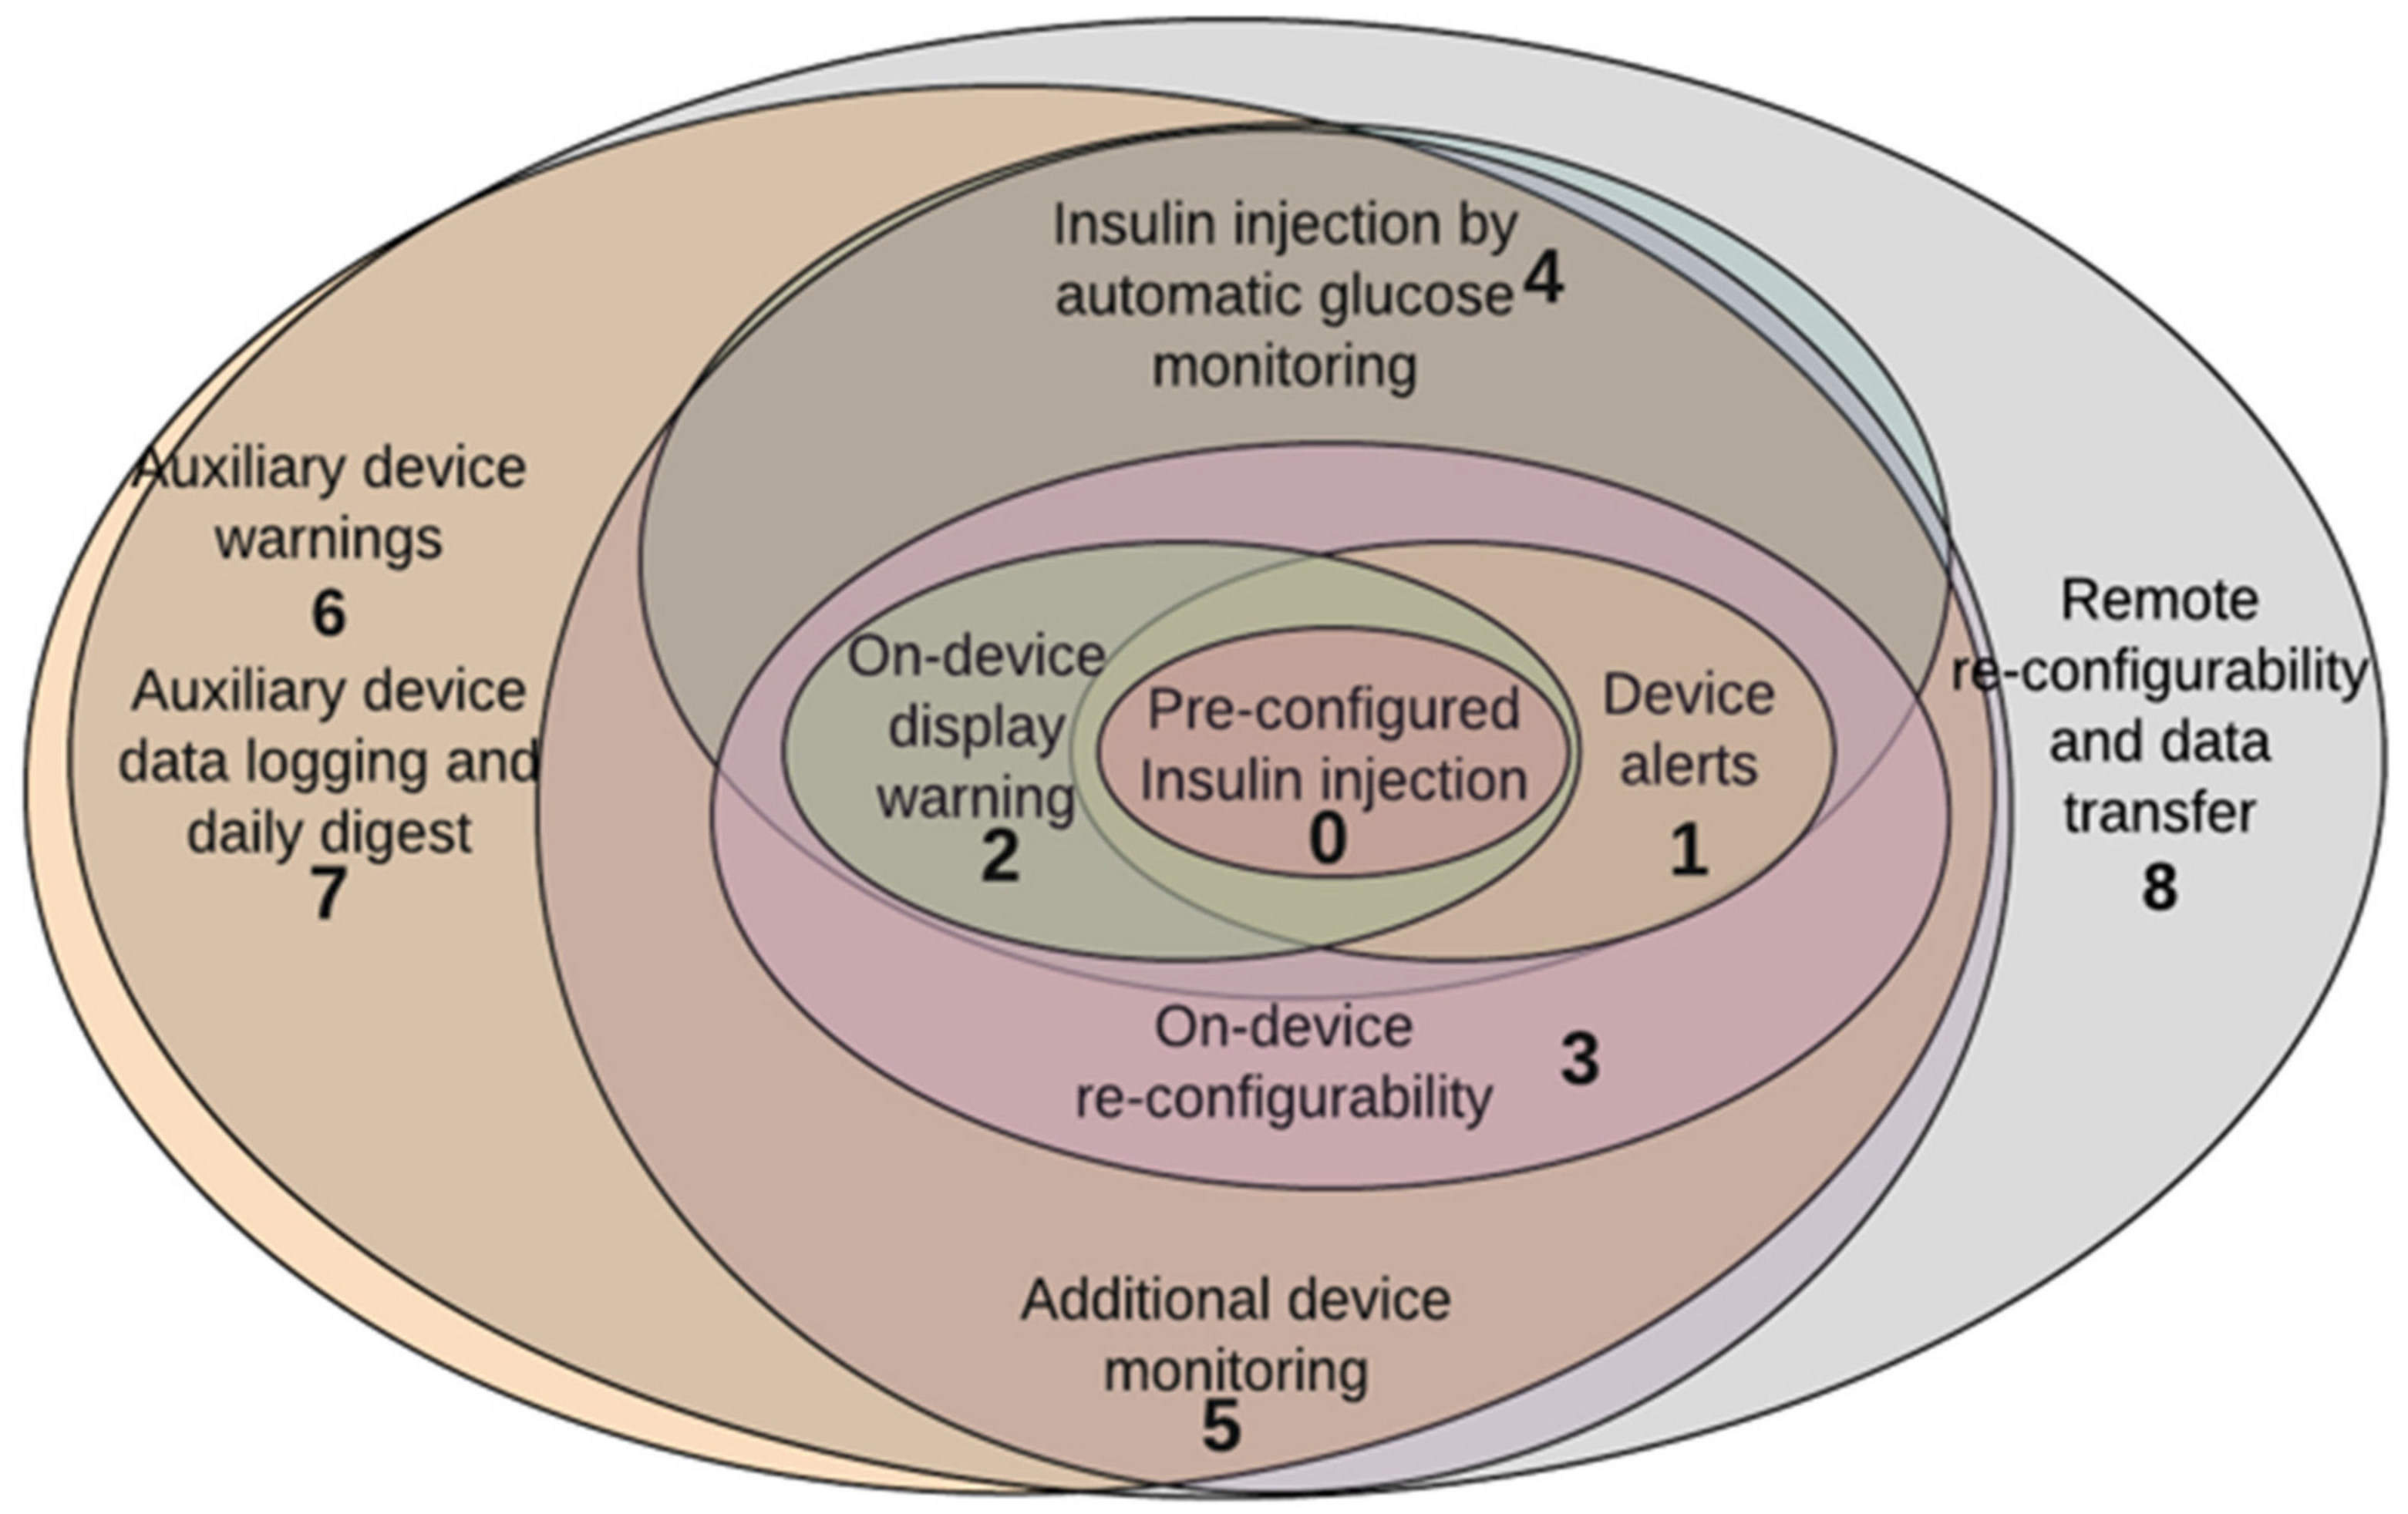
We used the multimodal framework to design the insulin pump software model in order to ensure security. An illustration of such a design paradigm is shown in Figure 6. The insulin pump has nine modes of operation {M0, …, M3, …, M8}, where M0 represents the essential mode that injects insulin into a patient based on a physician-predefined setting. The essential mode is assumed to be burnt onto the secure enclave of the microprocessor. We performed our evaluation and analysis on all other software modes of the system but the essential mode, as a compromise of M0 would undermine the entire secure system architecture. M8 represents the full-featured functionality of the insulin pump. There are a total of 79 operations, {o0,..,o7,..,o15,.., o78} (e.g., read glucose sensor and write actuator), in the insulin pump model and 11 software tasks, {T0, …, T6, …, T11} (e.g., calculation thread and warning thread), composed of 17 execution paths, {P0, …, P6, …, P16}. During design, the system was analyzed to obtain the average false-positive rates for all operations. Any operation with a false-positive rate greater than 5% or a probability threat threshold of 1 (i.e., the threat cannot be detected for that operation) was excluded from our model. This resulted in 46 effective operations being monitored.

8.2. Experimental Setup

An overview of our insulin pump model-based experimental setup, on which FIRE was simulated, is illustrated in Figure 7. We designed a multimodal software model of an insulin pump by modeling the CFGs of the software tasks’ implementation for each mode (as shown in Figure 6). This model and the subsequent simulation framework were built in Python. Subsequently, each operation in these task CFGs was implemented on an Artix 7 XC7A200T embedded device by identifying and implementing a standard C/C++ benchmark (for example, mutex_lock, file_read, etc.). These operations were executed according to the software flow in the CFG to obtain execution behavior and timing traces for both normal and malware-compromised behavior. For the compromised system, operations were re-executed to mimic the corresponding malware behavior [9]. The description of the corresponding impacted tasks for the malware simulation of the insulin pump are described in Table 3. This timing behavior was combined with the multimodal CFG model to simulate FIRE for the insulin pump under normal and compromised behaviors.

8.3. Static Risk Evaluation

We first describe the methodology for systematically calculating the static risk thresholds for each mode from the operations level to the modes. A systematic evaluation was performed to demonstrate the robustness of FIRE for a range of security threats that would result in a risk greater than the threshold for each mode. Experiments were conducted on the insulin pump model to analyze the impact of the number of operations in a mode and the threat probability of each operation on the overall effective risk of the mode. Thus, this analysis informs us about the circumstances under which risk mitigation is needed. The analysis enables us to consider how the proposed system reacts to potential security threats without restricting the analysis to one specific threat. It establishes the points at which a particular mode will classify the behavior of the system as a security threat that will require a mode switch to safely operate again. We quantified the measurable impact of the security threat using the number of operations and estimated the threat probability of the operations. The use of static risk analysis in our software design is twofold: (i) it helps in analyzing the tradeoffs between increased system functionality and the potential increase in the attack surface while designing the modes, and (ii) the calculated static mode risk thresholds assist in ordering the operating modes of the system in a monotonically increasing order of security risk and corresponding functionality.

8.3.1. Static Risk Threshold Calculation

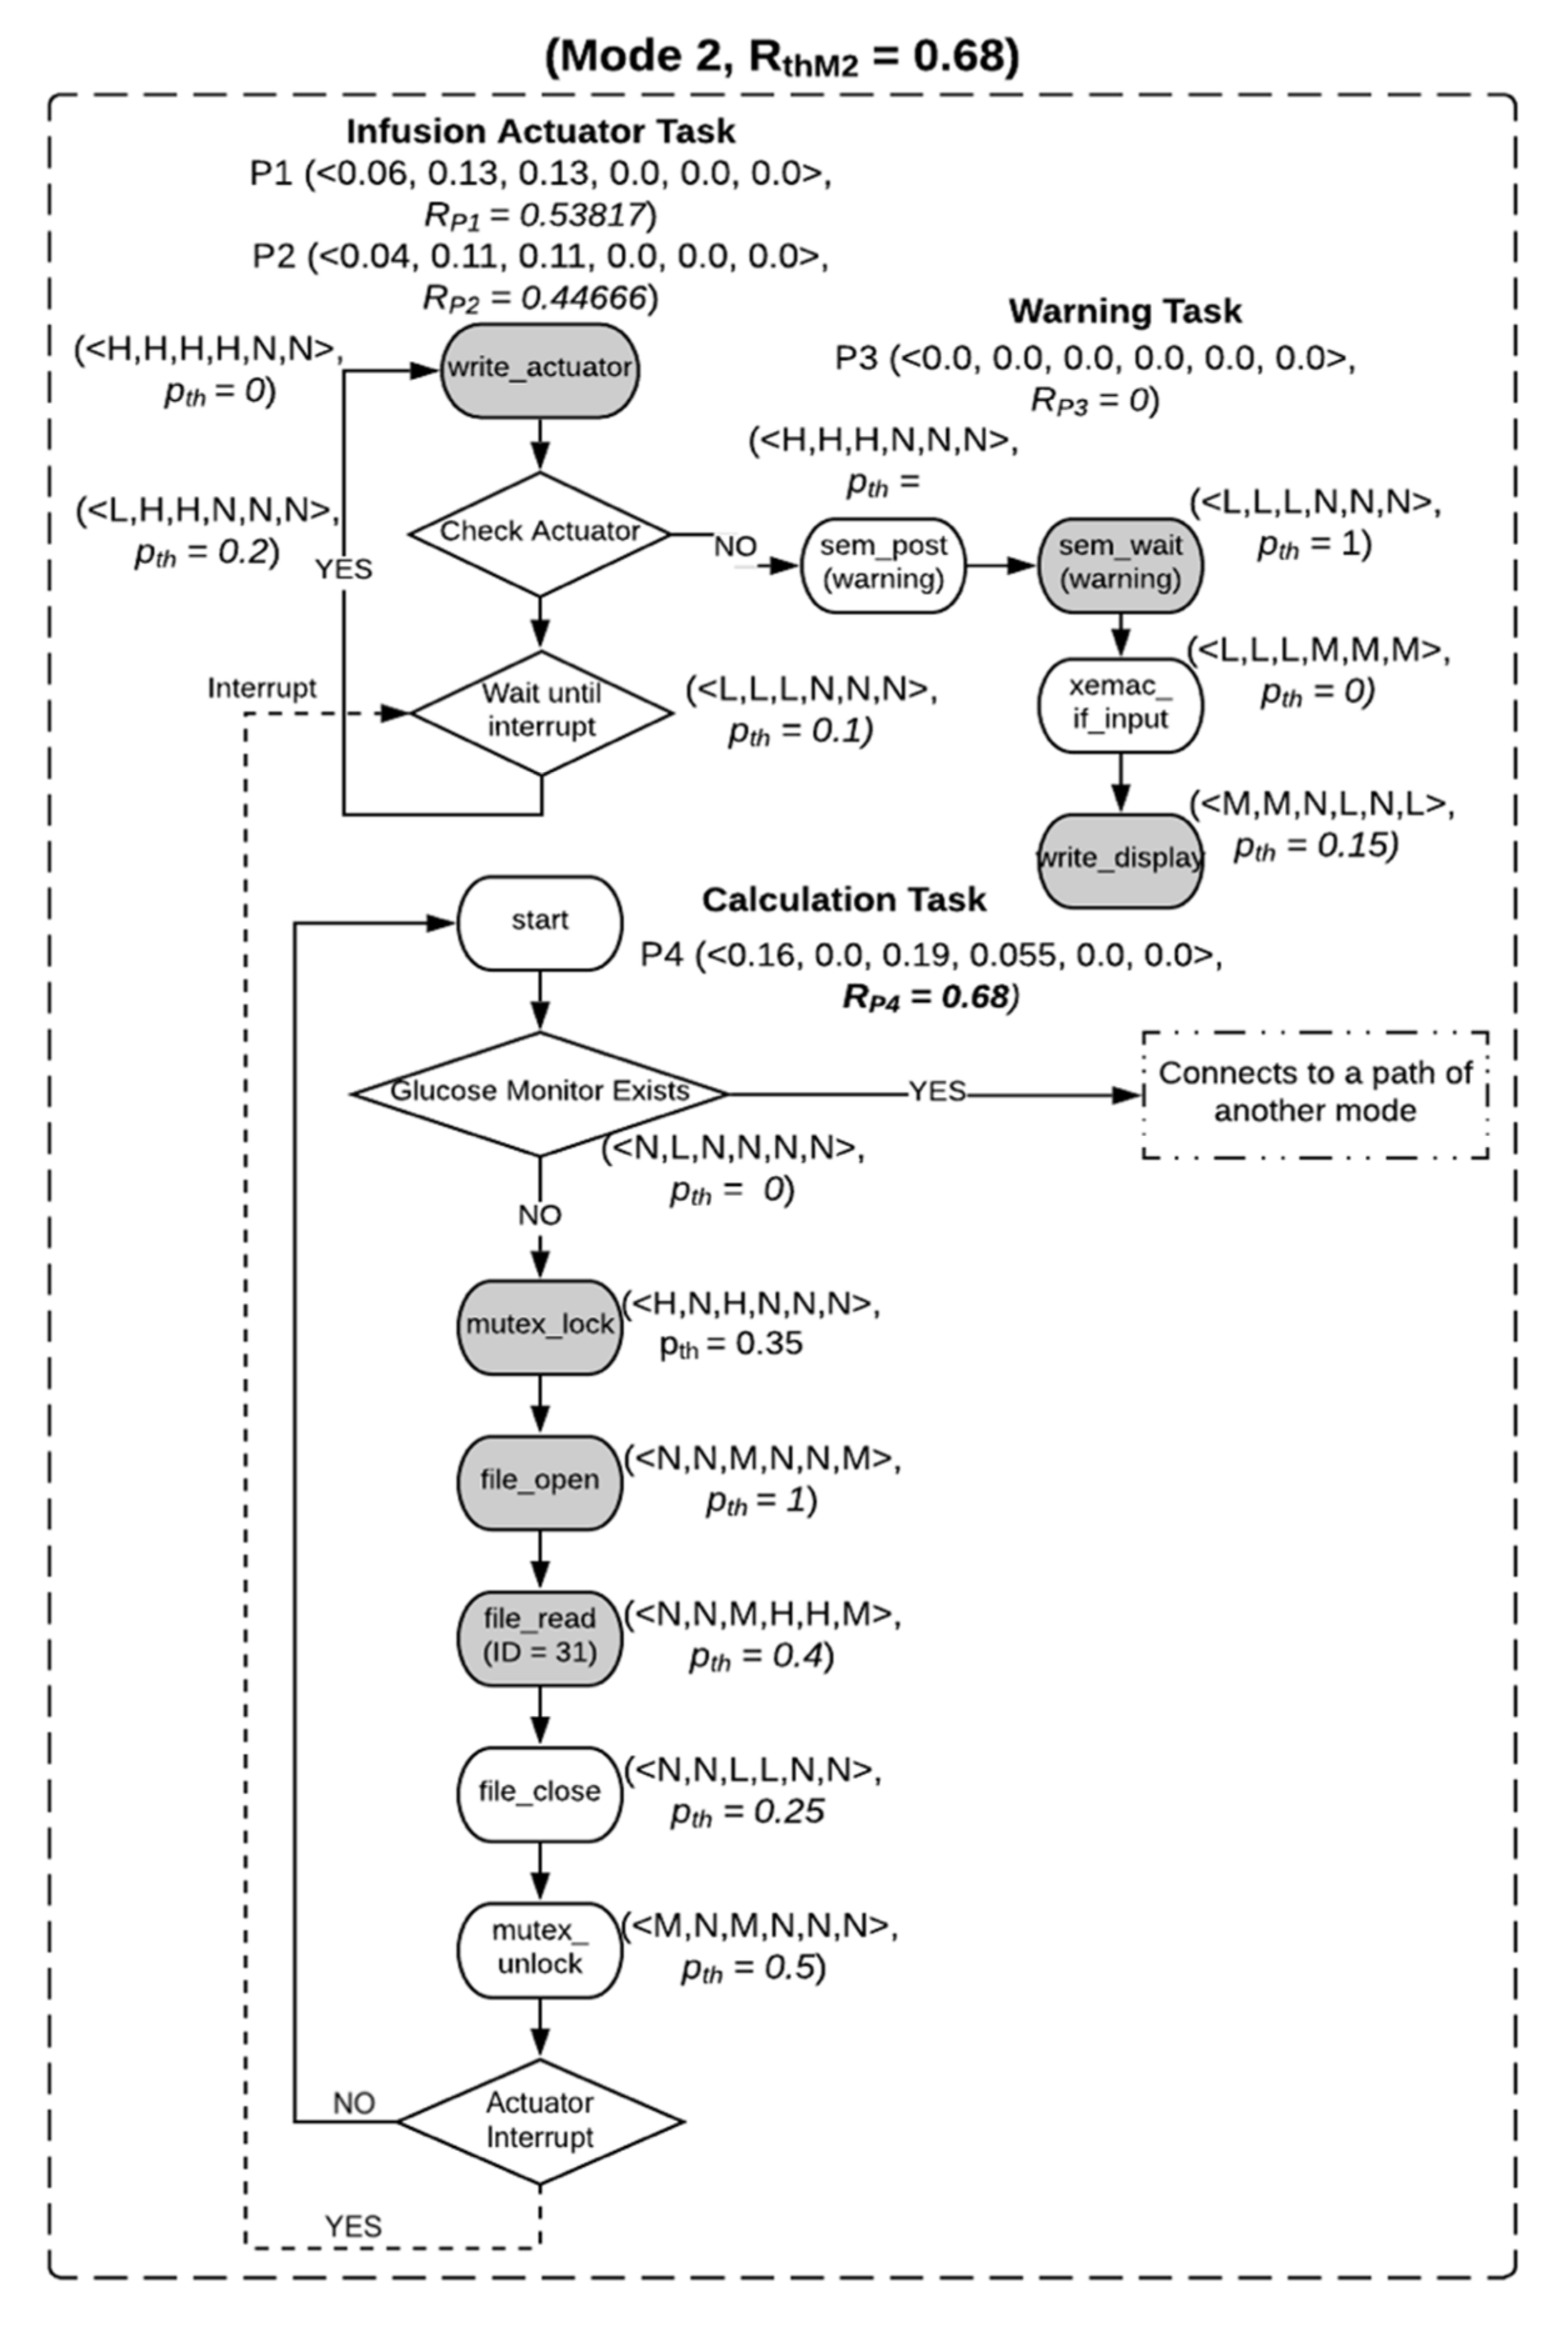
We calculated the static risk threat thresholds for all modes of the insulin pump during design. A sample annotated HCFR graph of M2 of the multimodal insulin pump is illustrated in Figure 8. Mode 2 consists of three tasks (warning, calculation, and infusion actuator) and four paths. We take the example of the calculation task in M2 to demonstrate the assignment of the CIA values and the calculation of the effective static risk. The calculation task has six operations, namely check_glucose_monitor, lock_mutex, open_file, read_file, close_file, and unlock_mutex. Each of these operations were assigned CIA values based on their impacts on health and data sensitivity. check_glucose_monitor was assigned <N,L,N,N,N,N>, lock_mutex was assigned <H,N,H,N,N,N>, open_file was assigned <N,N,M,N,N,M>, read_file was assigned <N,N,M,H,H,M>, close_file was assigned <N,N,L,L,N,N>, and unlock_mutex was assigned <M,N,M,N,N,N>. The CIA health values for lock_mutex are <H,N,H>, representing that a loss of confidentiality of the operation has a high impact on the health of the patient (H), a loss of integrity has no impact on health (N), and a loss of availability results in a critical impact on patient health (H). The CIA data sensitivity values for the same operation are <N,N,N>, representing that losses of confidentiality, integrity, and availability have no impact on the data sensitivity. However, for read_file the CIA data sensitivity values are <H,H,M> because losses of confidentiality and integrity lead to critical impacts on privacy while a loss of availability leads to a reasonable impact (M). The probability threat thresholds of these operations are provided by the threat detector and are shown in Figure 8. The CIA values are assigned scores as in Table 1. Based on the CIA security values for health and data sensitivity, the scaling factor in (3) is 1.667 as:
sf = 10   ( CVSS   standard ) 6   ( Total max CIA )
The calculation task risk was calculated using Equations (1)–(3) as:
T Calculation Task = [ < 0 , 0.22 , 0 , 0 , 0 , 0 >   ×   0.0  
< 0.56 , 0 , 0.56 , 0 , 0 , 0 >   ×   0.35    
< 0 , 0 , 0.3136 , 0 , 0 , 0.3136 >   ×   1.0  
< 0 , 0 , 0.3136 , 0.56 , 0.56 , 0.3136 >   ×   0.4  
< 0 , 0 , 0.22 , 0.22 , 0 , 0 >   ×   0.25  
<0.31,0,0.31,0,0,0> × 0.5]
TCalculation Task(si) = <0.16 + 0 + 0.19 + 0.055 + 0 + 0>,
= 0.405
RCalculation Task = 0.405 × 1.667 = 0.68
Since the calculation task has one path, P4, RP4 = RCalculation Task = 0.68.
The static risks of the other paths in M2 were similarly calculated (annotated in Figure 8). Using Equation (4), the static mode risk threat threshold of M2 was calculated as:
RthM2 = max(0.68, 0.538, 0, 0.446) = 0.68
Similarly, the risk threat thresholds for all eight modes of the insulin pump were determined. These risk thresholds were used to order the modes in a monotonically increasing order of risk impact. Ties were settled by considering functionality, i.e., the number of operations/tasks in a mode. The order of modes and their corresponding static risk thresholds are: {RthM1 = 0.68, RthM2 = 0.68, RthM3 = 0.958, RthM4 = 3.887, RthM5 = 3.887, RthM6 = 3.887, RthM7 = 4.144, and RthM8 = 4.144}. The insulin pump system risk threshold during normal operation is RS = RthM8 = 4.144.

8.3.2. Experimental Setup and Analysis

We implemented FIRE for the insulin pump software model and evaluated the static risk evaluation by analyzing the impact of a security threat on all operations in a mode. We conducted this analysis by varying the number of affected operations in a given mode from one to the maximum number of operations contained in that mode, and for each operation we increased the threat probability from 0 to 1.0 with a scaling interval of 0.05 for the visualization of trends. We computed the static risk thresholds of all nine modes using Equations (1)–(4). The dynamic risk was then calculated for this set of combinations using PPT Equations (12)–(14). We made a random selection of operations in our simulations and assumed that the considered security threats affected only this set of randomly chosen operations. We selected a random set of operations to best mimic the worst-case security threats that have the potential to compromise any set of operations.
Surface plots of the analysis for M1, M2, and M3 of the insulin pump are illustrated in Figure 9. The static risk thresholds for these three modes are {RthM1 = 0.68, RthM2 = 0.68, and RthM3 = 0.958}. In this case study, the thresholds for the three modes are the same, as they were computed as the maximum of their composing tasks/paths (as in Equation (4)). The highlighted heat map surface area represents the number of operations and the corresponding threat probabilities at which the risk of the mode is beyond its static threat threshold and would require risk management by mode switching. The extreme red region of the heat map shows the worst-case scenario where all the operations of the mode have been affected by a security threat with the maximum threat probability.
We discuss our analysis in detail for M3. Mode 3 has a total of 20 operations. The number of operations was incremented every run, and the threat probability was varied from 0 to 1.0 for each increment in every run. The heat map surface of M3 in Figure 9 represents the sensitivity of the mode to security threats by providing a set of points where the dynamic mode risk intersects the static mode risk threshold, beyond which a mode switch decision is needed. We observe that M3 is safe and secure to operate up to five operations, irrespective of a security threat affecting these operations. The minimum number of operations required to be affected to deem a mitigative mode switch decision from M3 is five, with a 0.75 threat probability. On the other hand, the minimum threat probability required to trigger a mitigative mode switch from M3 is 0.4, where the security threat would need to affect at least 16 operations. The intermediate points, as shown in Figure 10, represent a tradeoff between these extreme conditions. These baseline risk evaluation metrics provides a designer important tuning measures to design modes and analyze the corresponding security risk impacts of these modes.
Figure 10 showcases the intersection line of the dynamic mode risk with the static mode risk threat threshold for all modes of the insulin pump. This intersection line represents the lower bound beyond which there exists a combination of a number of operations and corresponding threat probabilities that would require mitigation by mode switching. It is important to note that this analysis generally shows how the risk assessment and mode switching would react to different types of security threats but does not evaluate all possible security threat scenarios, as we randomly selected operations to be affected.

8.4. Dynamic Risk Evaluation

We performed simulations of FIRE for the multimodal insulin pump under both normal execution and compromised execution scenarios with a variety of malware samples to assess and evaluate the dynamic risk in mitigating threats at runtime.

8.4.1. Normal Execution

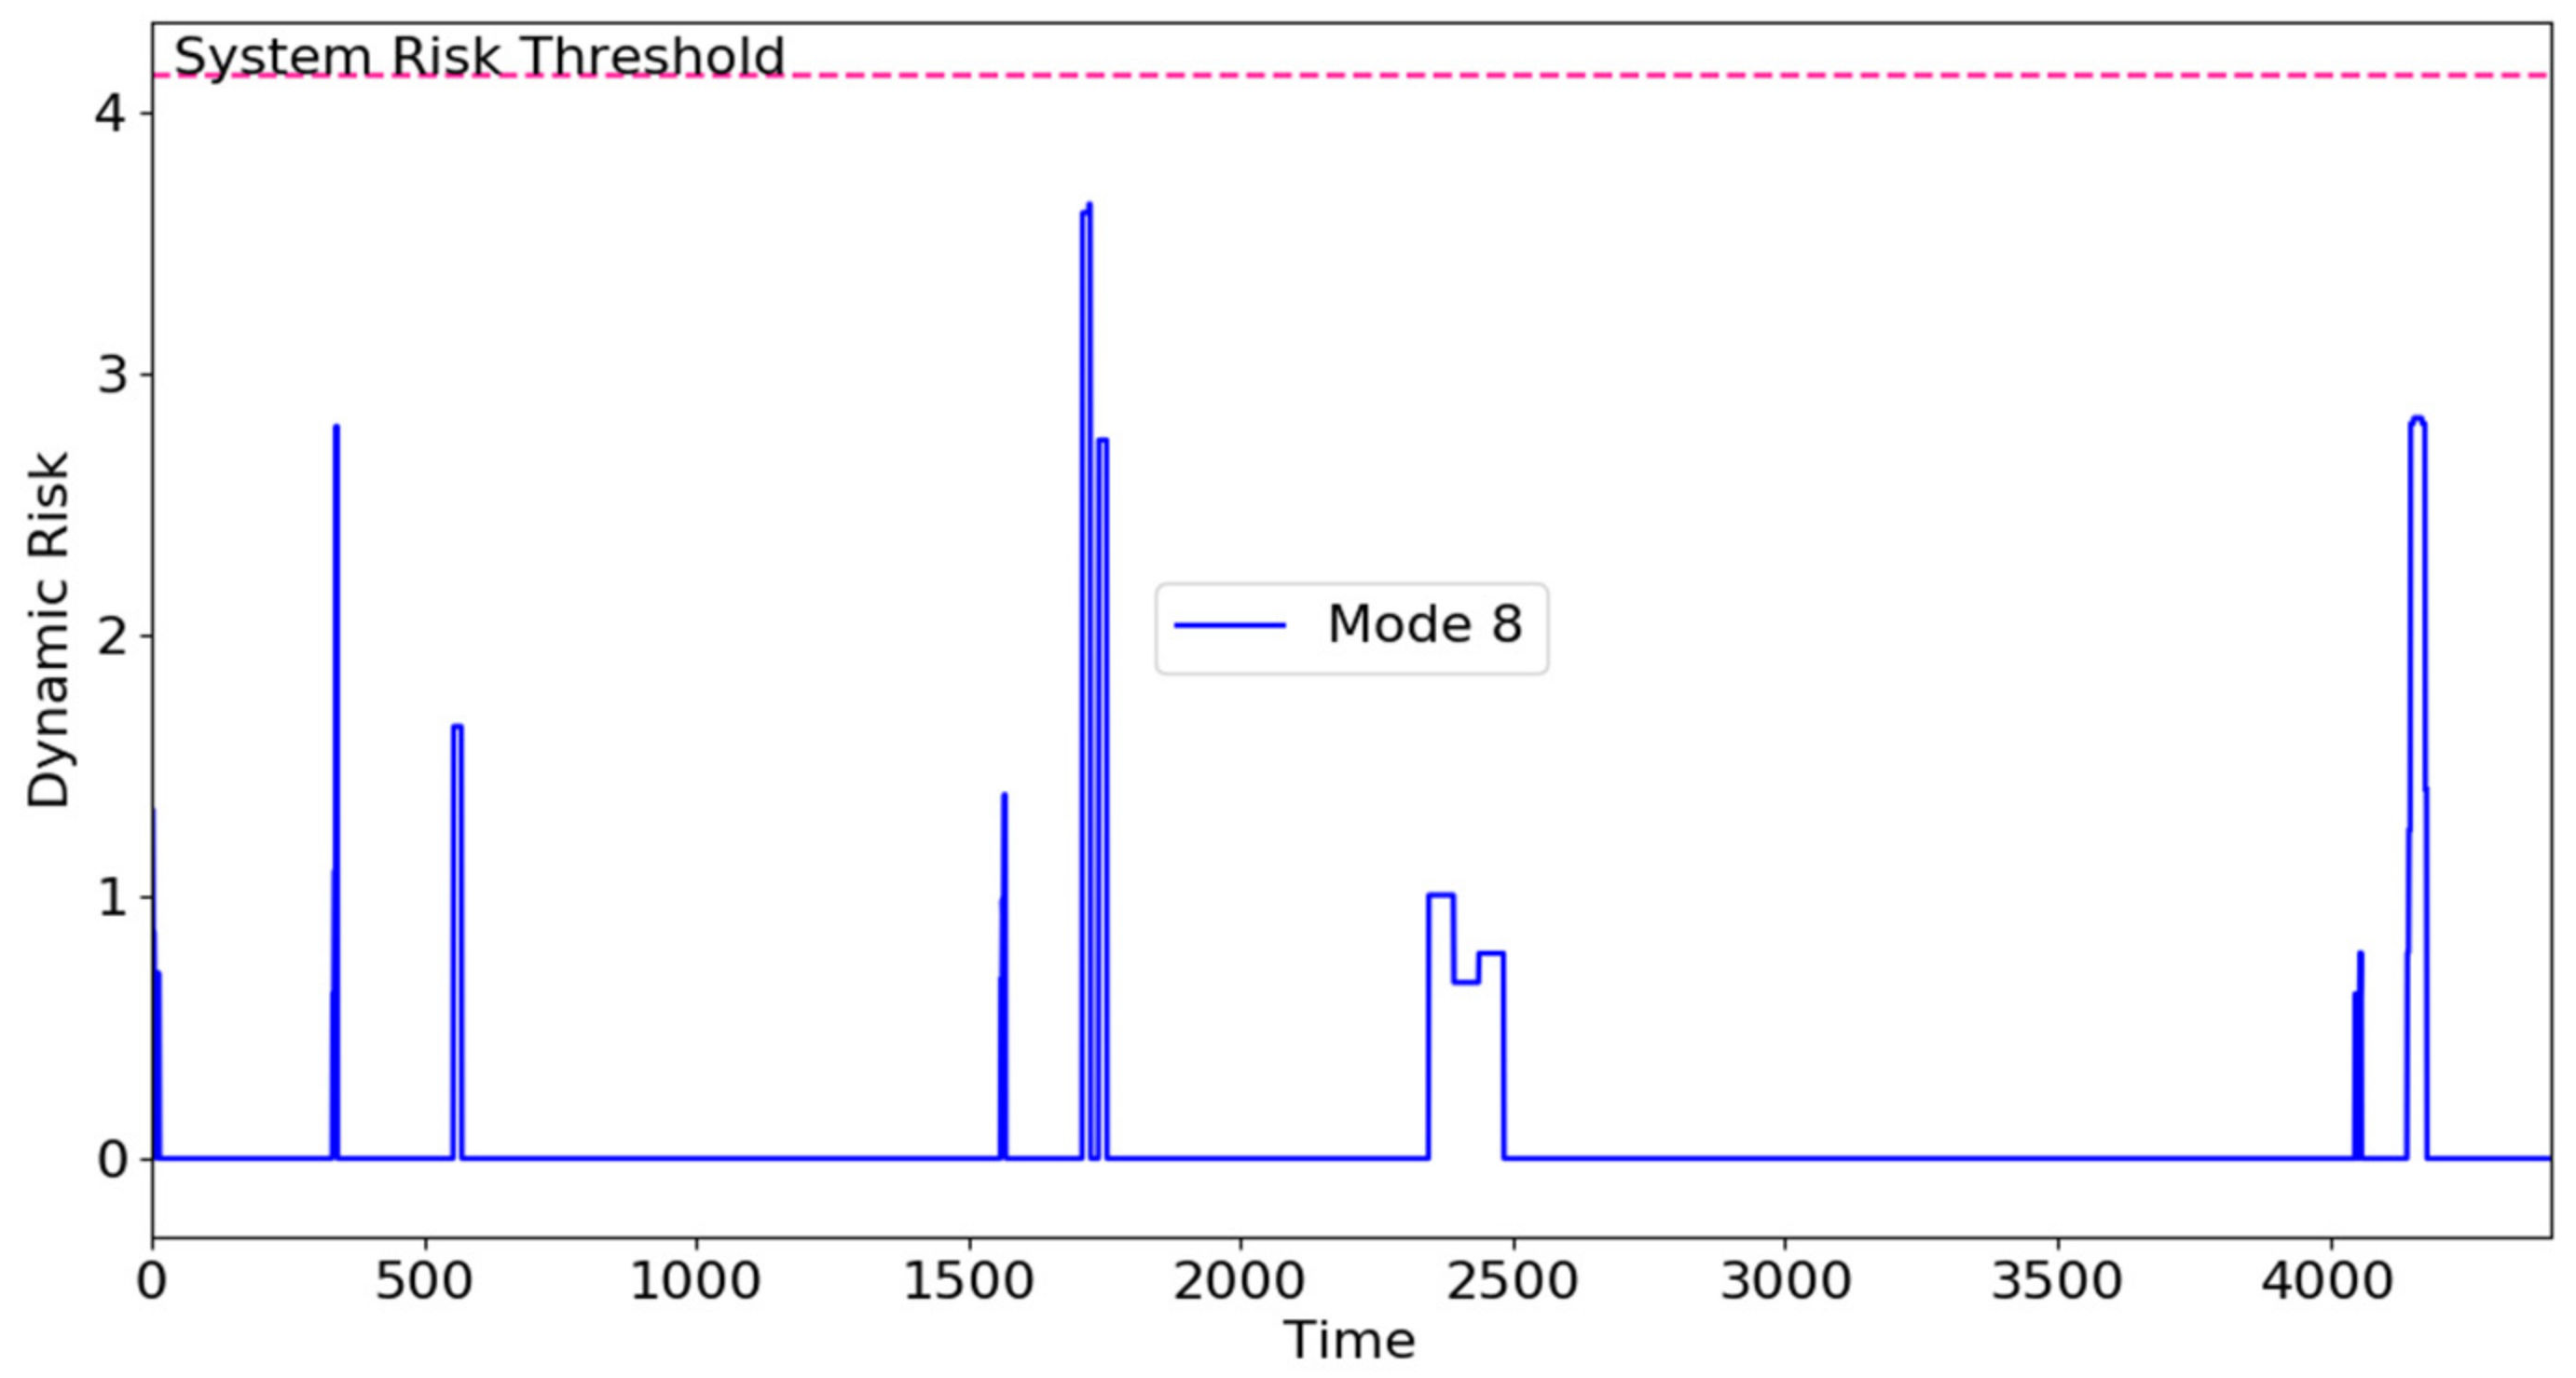
The normal execution of the insulin pump is in its highest operating mode, M8, and its execution trace is shown in Figure 11. We utilized the per-path-based threshold, as the DREFiltercondition was shown (in Section 6) to be the most effective in reducing the impact of false positives on the DRE execution rate. Ideally the normal system risk is 0. However, even with the false positives in the threat detector, FIRE successfully determined that it was not high enough to cause a mode switch and achieved an FP mode switching rate of 0%.

8.4.2. Malware

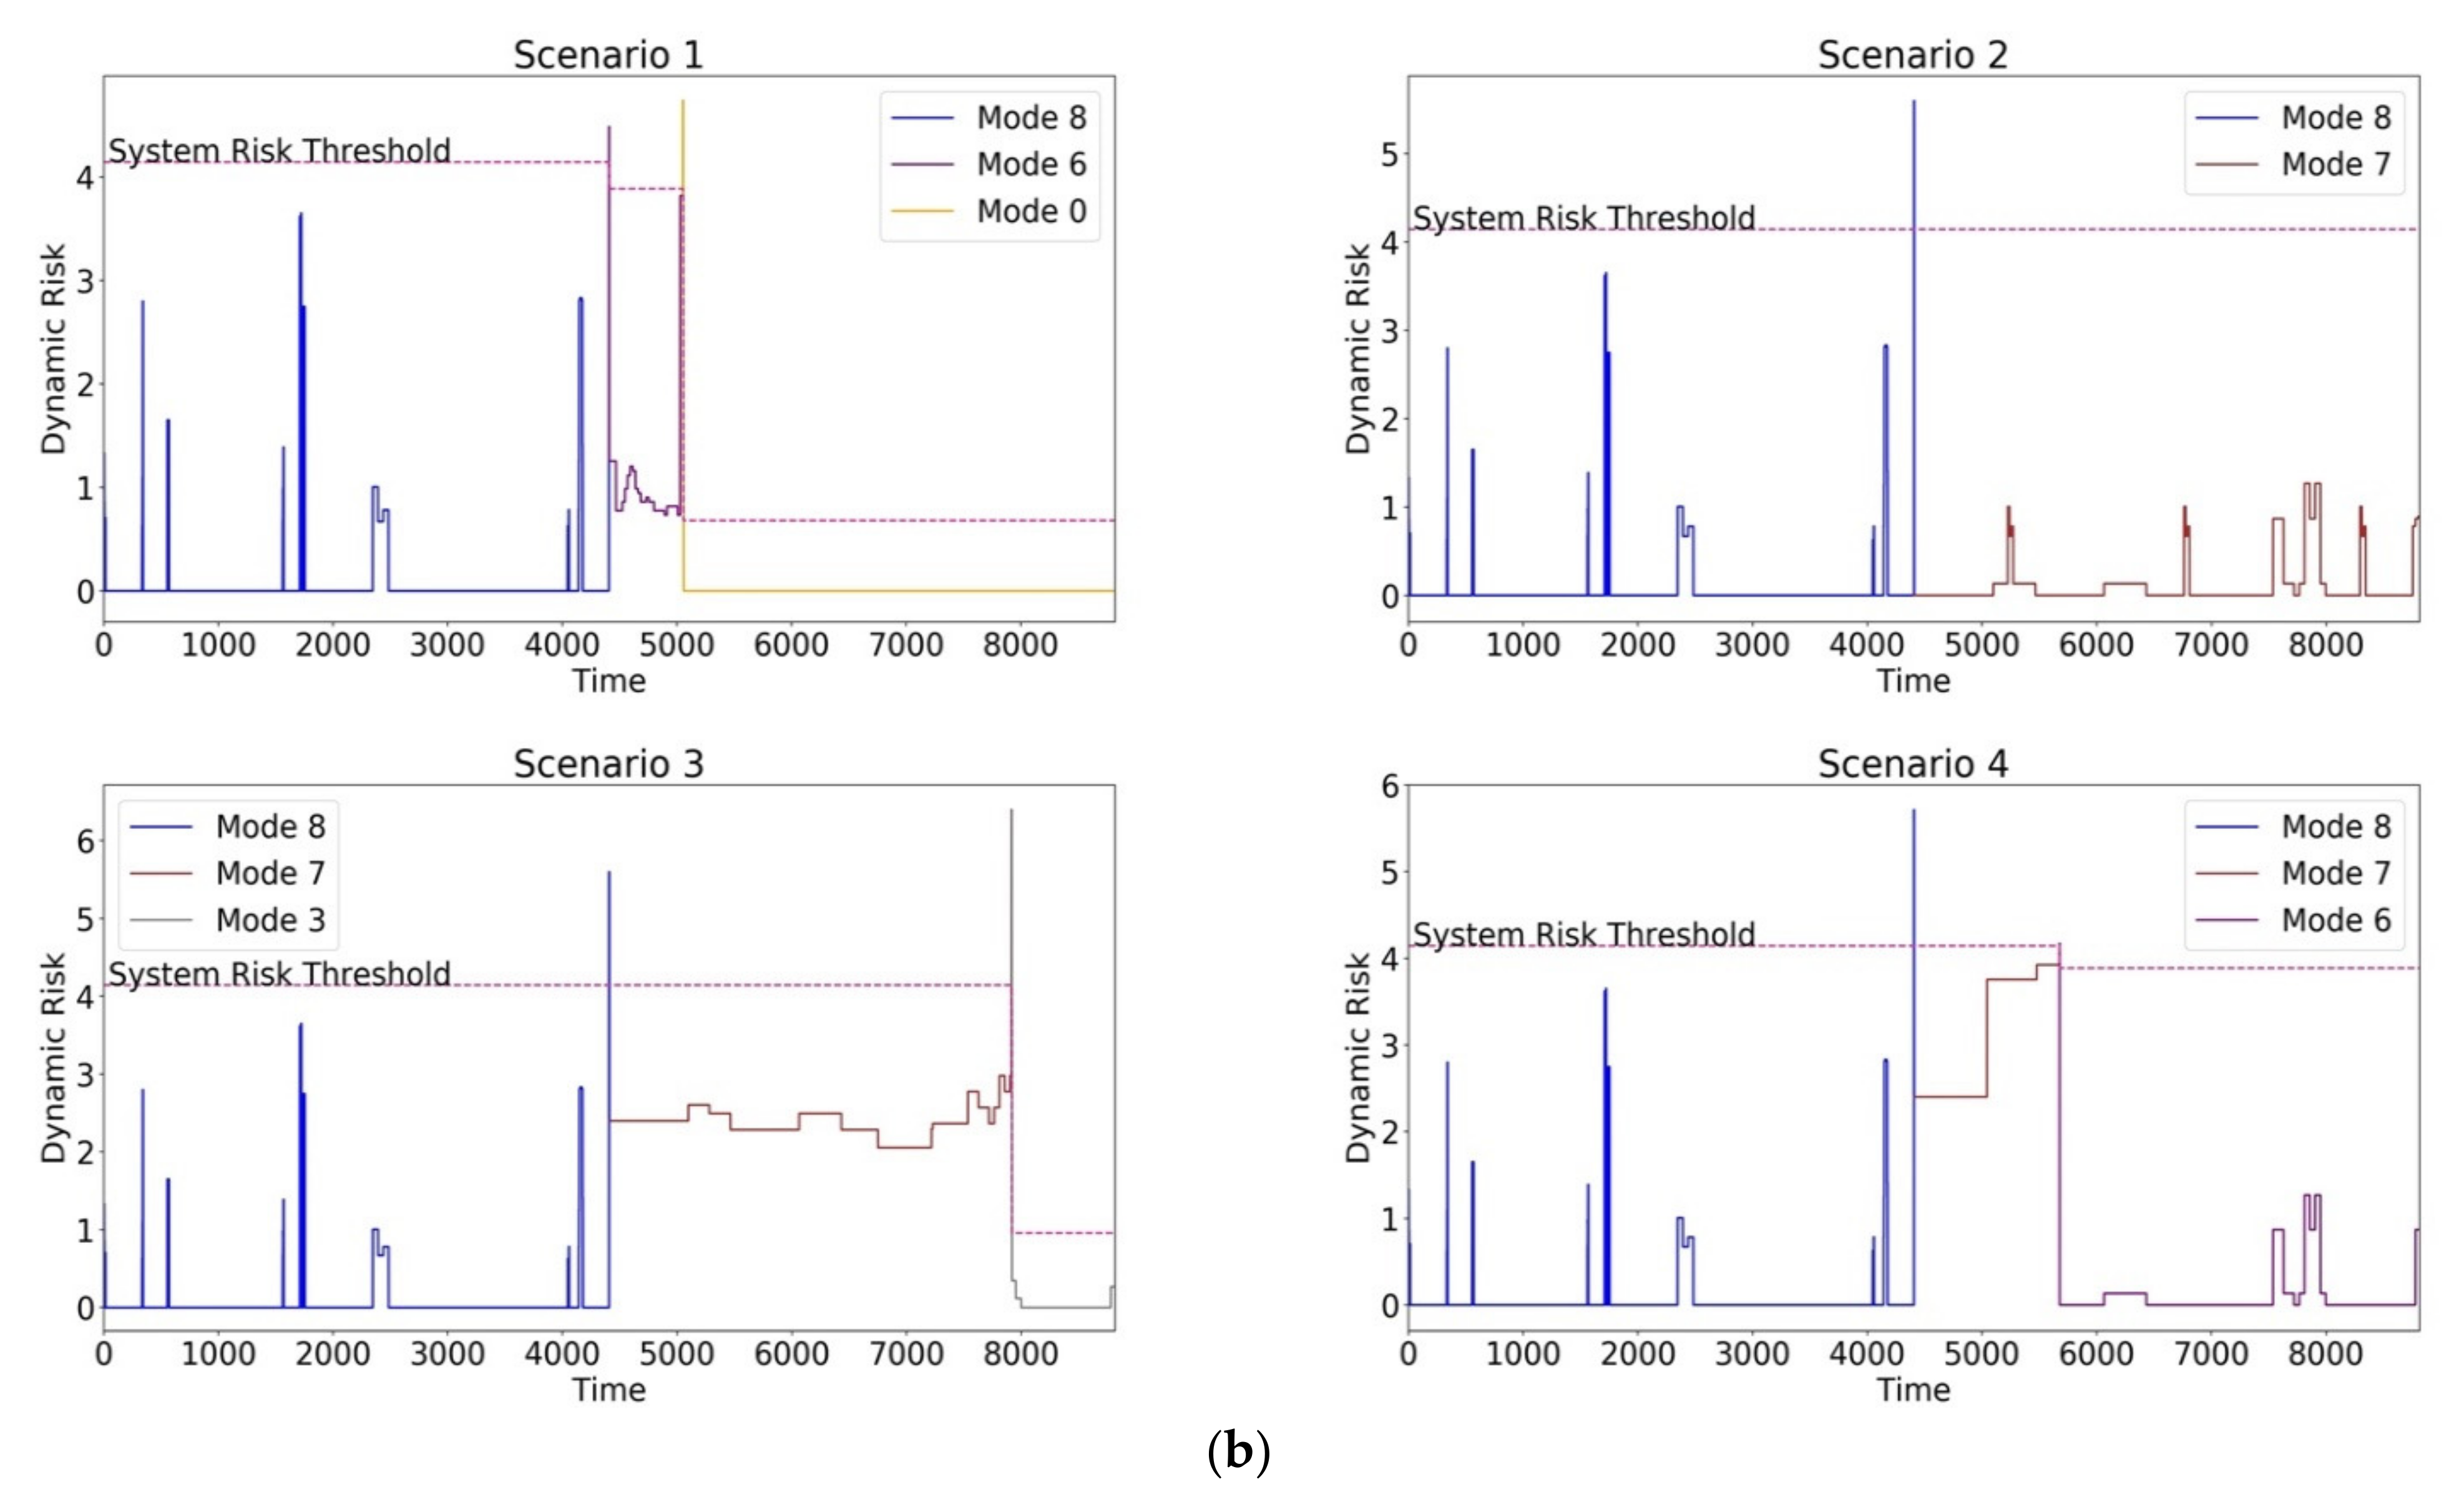
In all our experiments, we injected malware at a fixed time after a normal execution sequence. The simulation results of the execution traces of the malware scenarios (Table 3) are shown in Figure 12, with actual malware samples in Figure 12a and synthetic malware samples in Figure 12b.
  • Safety-Compromising Malware: The file manipulation malware impacted a few operations of one execution path of the communication, calculation, and display task. The operations in the communication and display task had high CIA impact scores and mandated mode switching to M6 (RthM6 = 3.887). The dynamic risk in M6 was still above the normal system risk because of the sustained threat to the calculation task. However, the compromised operations in M6 had lower CIA impact scores that did not significantly increase RM6. The expected mode to mitigate the file manipulation malware was mode 6, as this operating mode is the highest operating mode that does not contain the communication and display tasks that are responsible for transferring and displaying manipulated data (ref. Table 3). FIRE achieved the expected mode switch to M6.
  • Fuzz20 and Fuzz100 directly impacted the calculation, communication, display, and configuration write tasks. Since the fuzz malware is a randomization malware, an intermittent mode switch to M6 briefly occurred when the risk in the calculation and communication threat was mitigated by this switch. The malware persisted, as it impacted the execution path (ref. Table 3) responsible for computing the amount of insulin needed to be pumped based on the sensor and preconfigured inputs (M1, M2, M3, M4, and M5). Since these operations had the highest CIA impact on safety, a direct switch to M0 (essential mode) was needed. The expected ideal mode switch for both the Fuzz20 and Fuzz100 malwares was to M0 from the beginning of the execution, as the malwares impact safety-critical operations. However, FIRE overshot the execution times by 2.7% for Fuzz100 and 7.3% for Fuzz20 by switching to M6 before switching to the expected M0. Since Fuzz malwares are based on the time randomization of exploits, FIRE successfully recognized the impact of this compromise (system risk is higher than zero) but took a conservative approach in mode switching. We will analyze the impact of this overshooting and explore further heuristics to tune our mode switching algorithm in future work.
  • Data-sensitivity-Compromising Malware: The information leakage malware covertly transmitted sensitive information via a TCP channel in the warning task. The operations in the warning task had considerable impact on data sensitivity, which is shown in the consistent rise in the risk, RM8. However, the system risk was not high enough to mandate a mode switch, as this malware did not significantly impact safety and remained in M8. The expected mode switch for the information leakage malware was to remain in the highest operating mode, M8, as safety was not compromised, and FIRE achieved this expected mode while signifying a potential threat with higher system risk.
  • Synthetic Security Threat: The simulation traces of synthetic malware are shown in Figure 12b. Scenario 1 was similar to the Fuzz malware, requiring multiple multimode switches to M0 to ensure safe operation. Scenario 2 represented a synthetic malware injected only into operations in the communication thread and hence needing a single mode switch to M7 (RthM7 = 4.144) to ensure safe operation. Scenarios 3 and 4 represented monotonous mode switches where the synthetic malware targeted specific operations in M4 and M7, requiring the system to switch to M3 (RthM3 = 0.958) and M6 (RthM6 = 3.887), respectively.
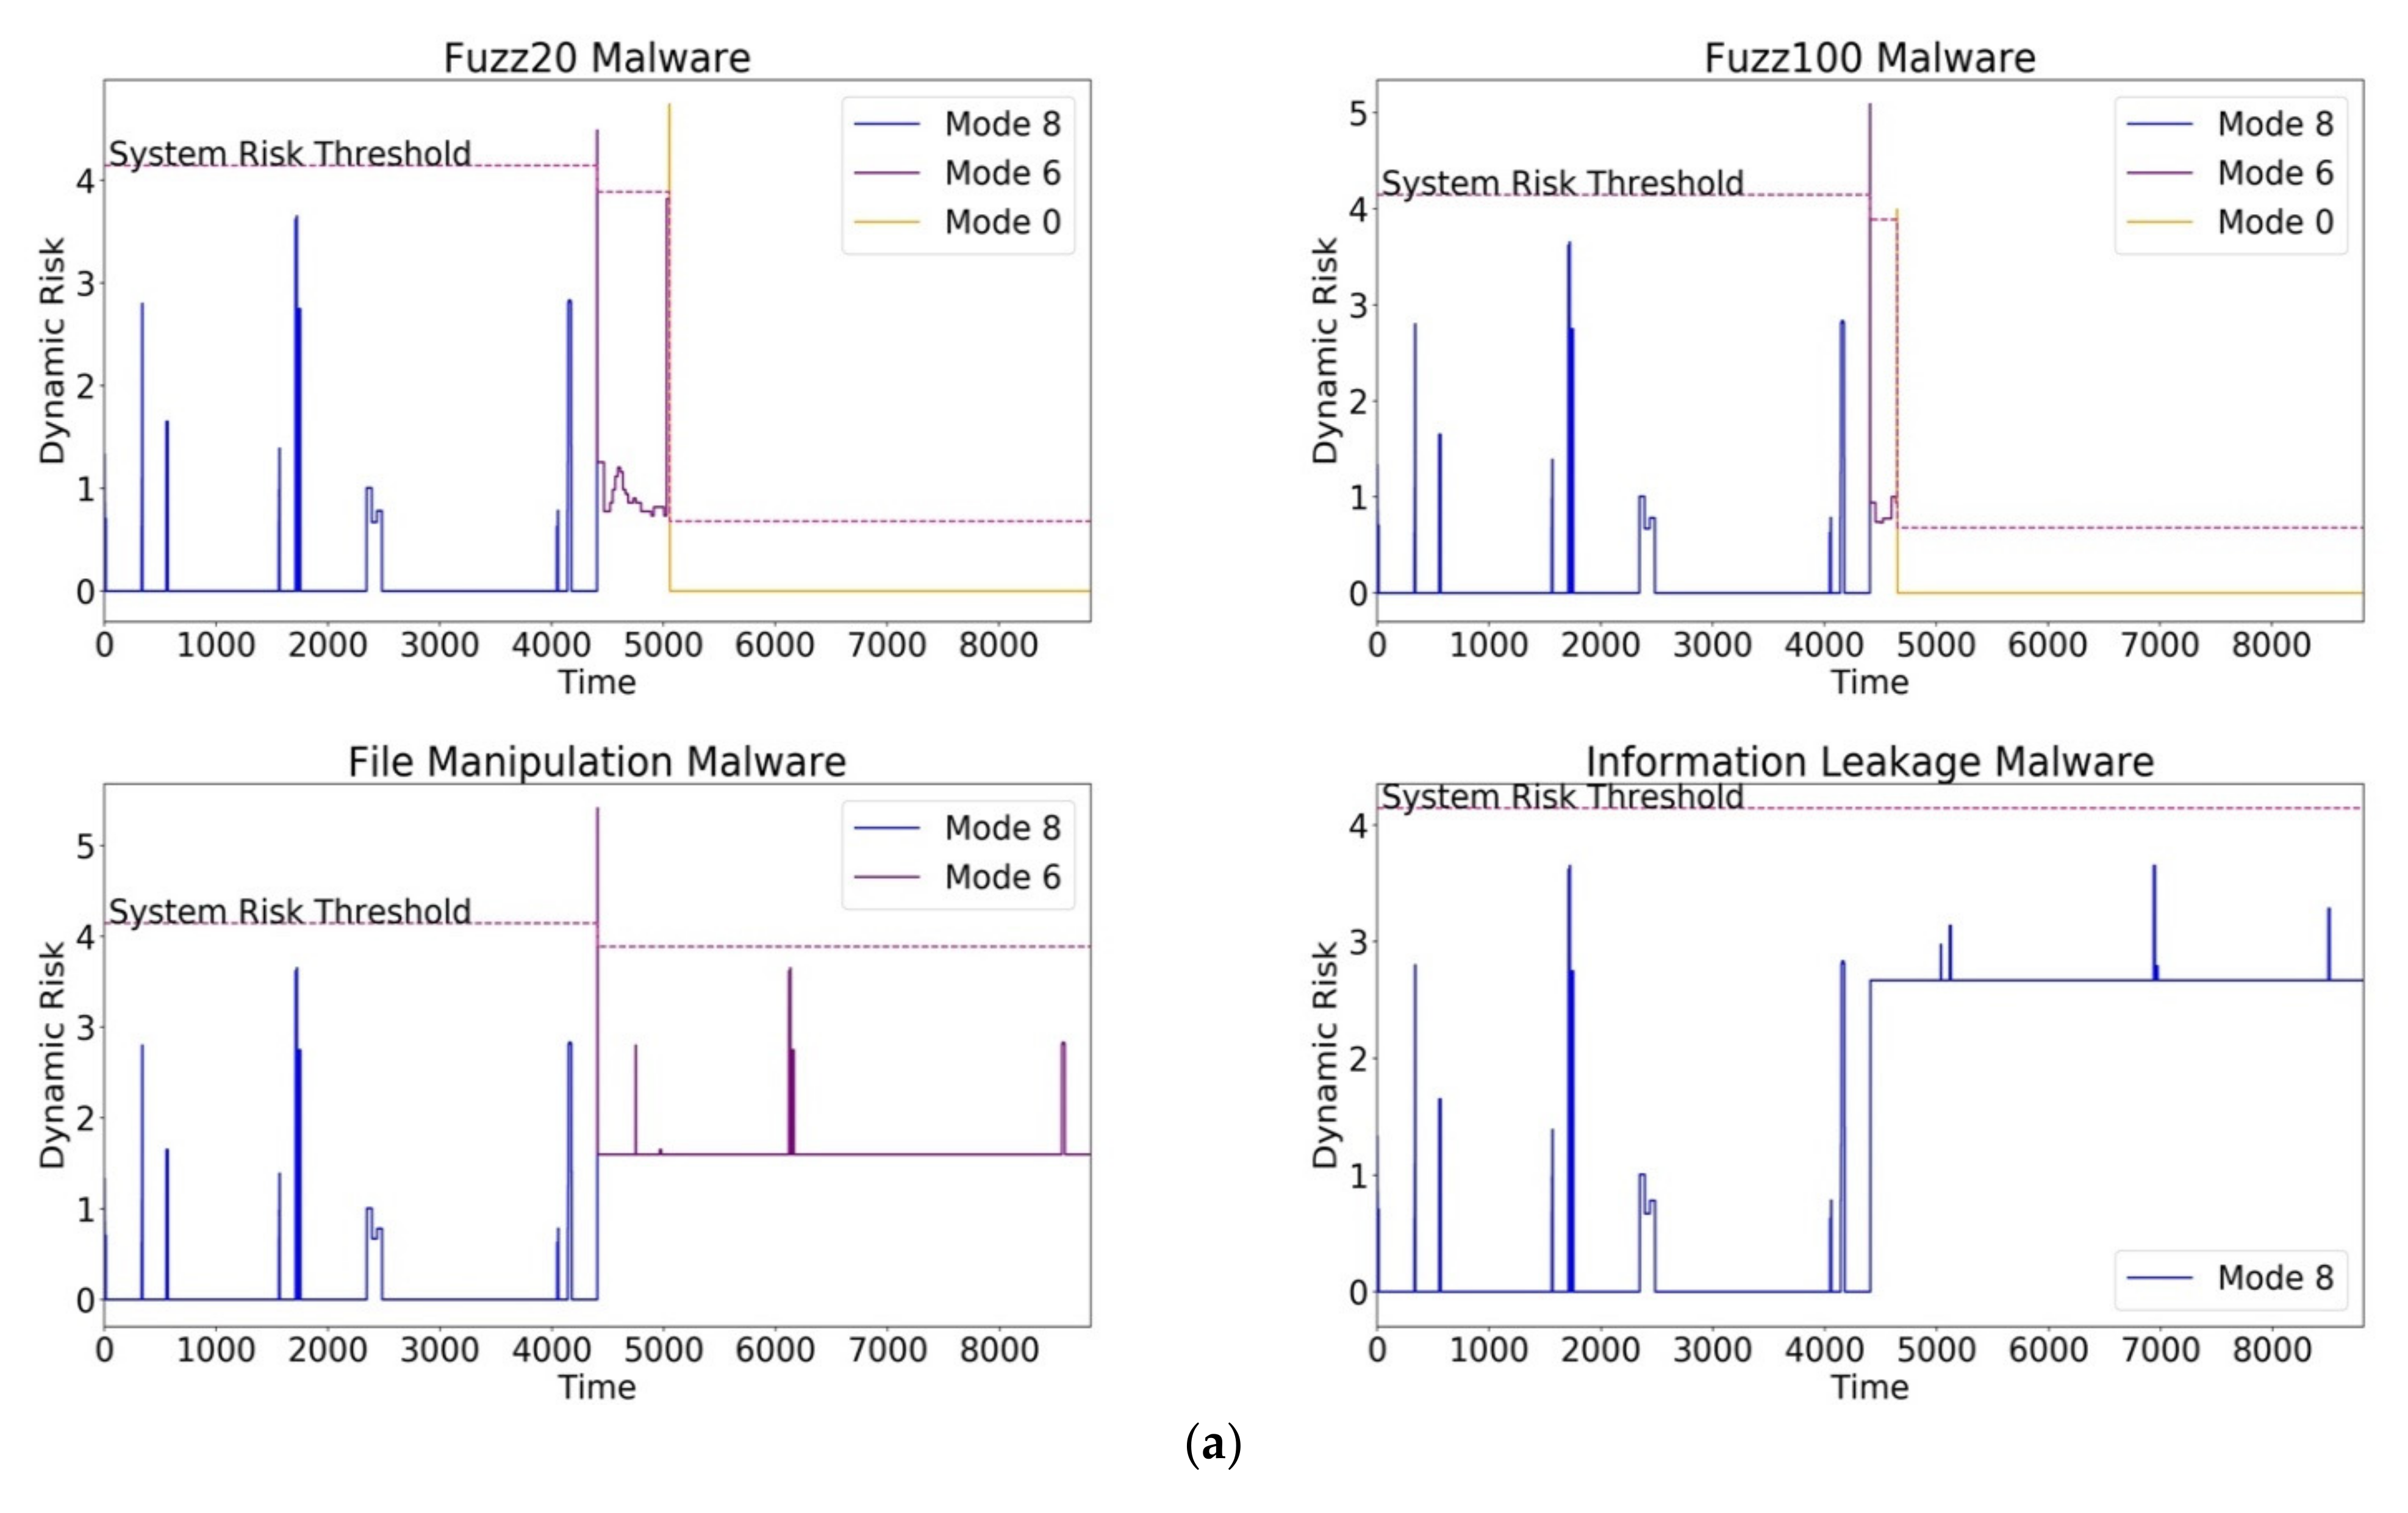
Figure 12. Simulation results plotting the insulin pump system dynamic risk vs. execution time for: (a) real security threat malware samples, including Fuzz20, Fuzz100, file manipulation, and information leakage, and (b) scenarios demonstrating automatic mode switching for synthesized security threats.
Information 13 00487 g012aInformation 13 00487 g012b
The malware simulations demonstrate that FIRE effectively determined that false positives in the threat detector are not high enough to mandate mode switching and maintained a stable system mode with a 0% FP mode switching rate in normal and malicious execution (for all malware samples). It is worth mentioning that, by establishing a multimodal system design integrated with the HCFR graph, designers can utilize the dynamic risk simulations to fine-tune the system modes and the CIA impact scores to achieve the desired tradeoff between functionality and the security threat impact.

8.4.3. Mitigation Latency

The mitigation latency is an important metric to evaluate FIRE, as the threat needs to be mitigated before essential functionality is compromised. Mitigation latency is defined as the time delay needed to switch from one mode to another and is represented as the “spike” in the simulation figures (shown as color changes in Figure 12). Since the insulin pump software model is directly mapped from an implemented prototype of a life-critical system, the simulation mitigation latency can be calculated as L = execution timeslowest task when malware is injected in Mi. The execution time of a task is:
te = nex × cpo × cc
where nex is the number of execution windows to provide a snapshot of the system, cpo is the number of cycles per operation, and cc is the clock cycle (i.e., 1/frequency). The life-critical system operations were implemented on an Artix 7 XC7A200T FPGA running at 100 MHz. Hence, cc = 10 ns. The cpo varies with the operations, and n in our experiment was one execution window. The worst-case simulation mitigation latency can be deduced as the execution time of the slowest task that is compromised by malware. We analyzed the execution cycles of all operations of all tasks/threads when the system was injected with the experimental malware, as in Section 8.4.2, and calculated the worst-case execution times of every task using Equation (20). The execution times of these tasks are shown in Table 4. The task with the lowest execution time was found to be the calculation thread when it was injected with the fuzz malware, with a worst-case simulation mitigation latency, tcal task, of 448.32 ms. It is important that this mitigation latency was within the essential functioning time of the insulin pump (i.e., the time required to infuse insulin into the body). The worst-case essential functioning time of insulin infusion for a bolus dosage is typically tIPe ~1 min [37]. The simulation mitigation latency (448 ms) of FIRE is well within the essential timing threshold, tcal task << tIPe, and hence can safely mitigate the security threat while ensuring that essential functionality is not interrupted.

8.4.4. Threat Probability Deviation Evaluation

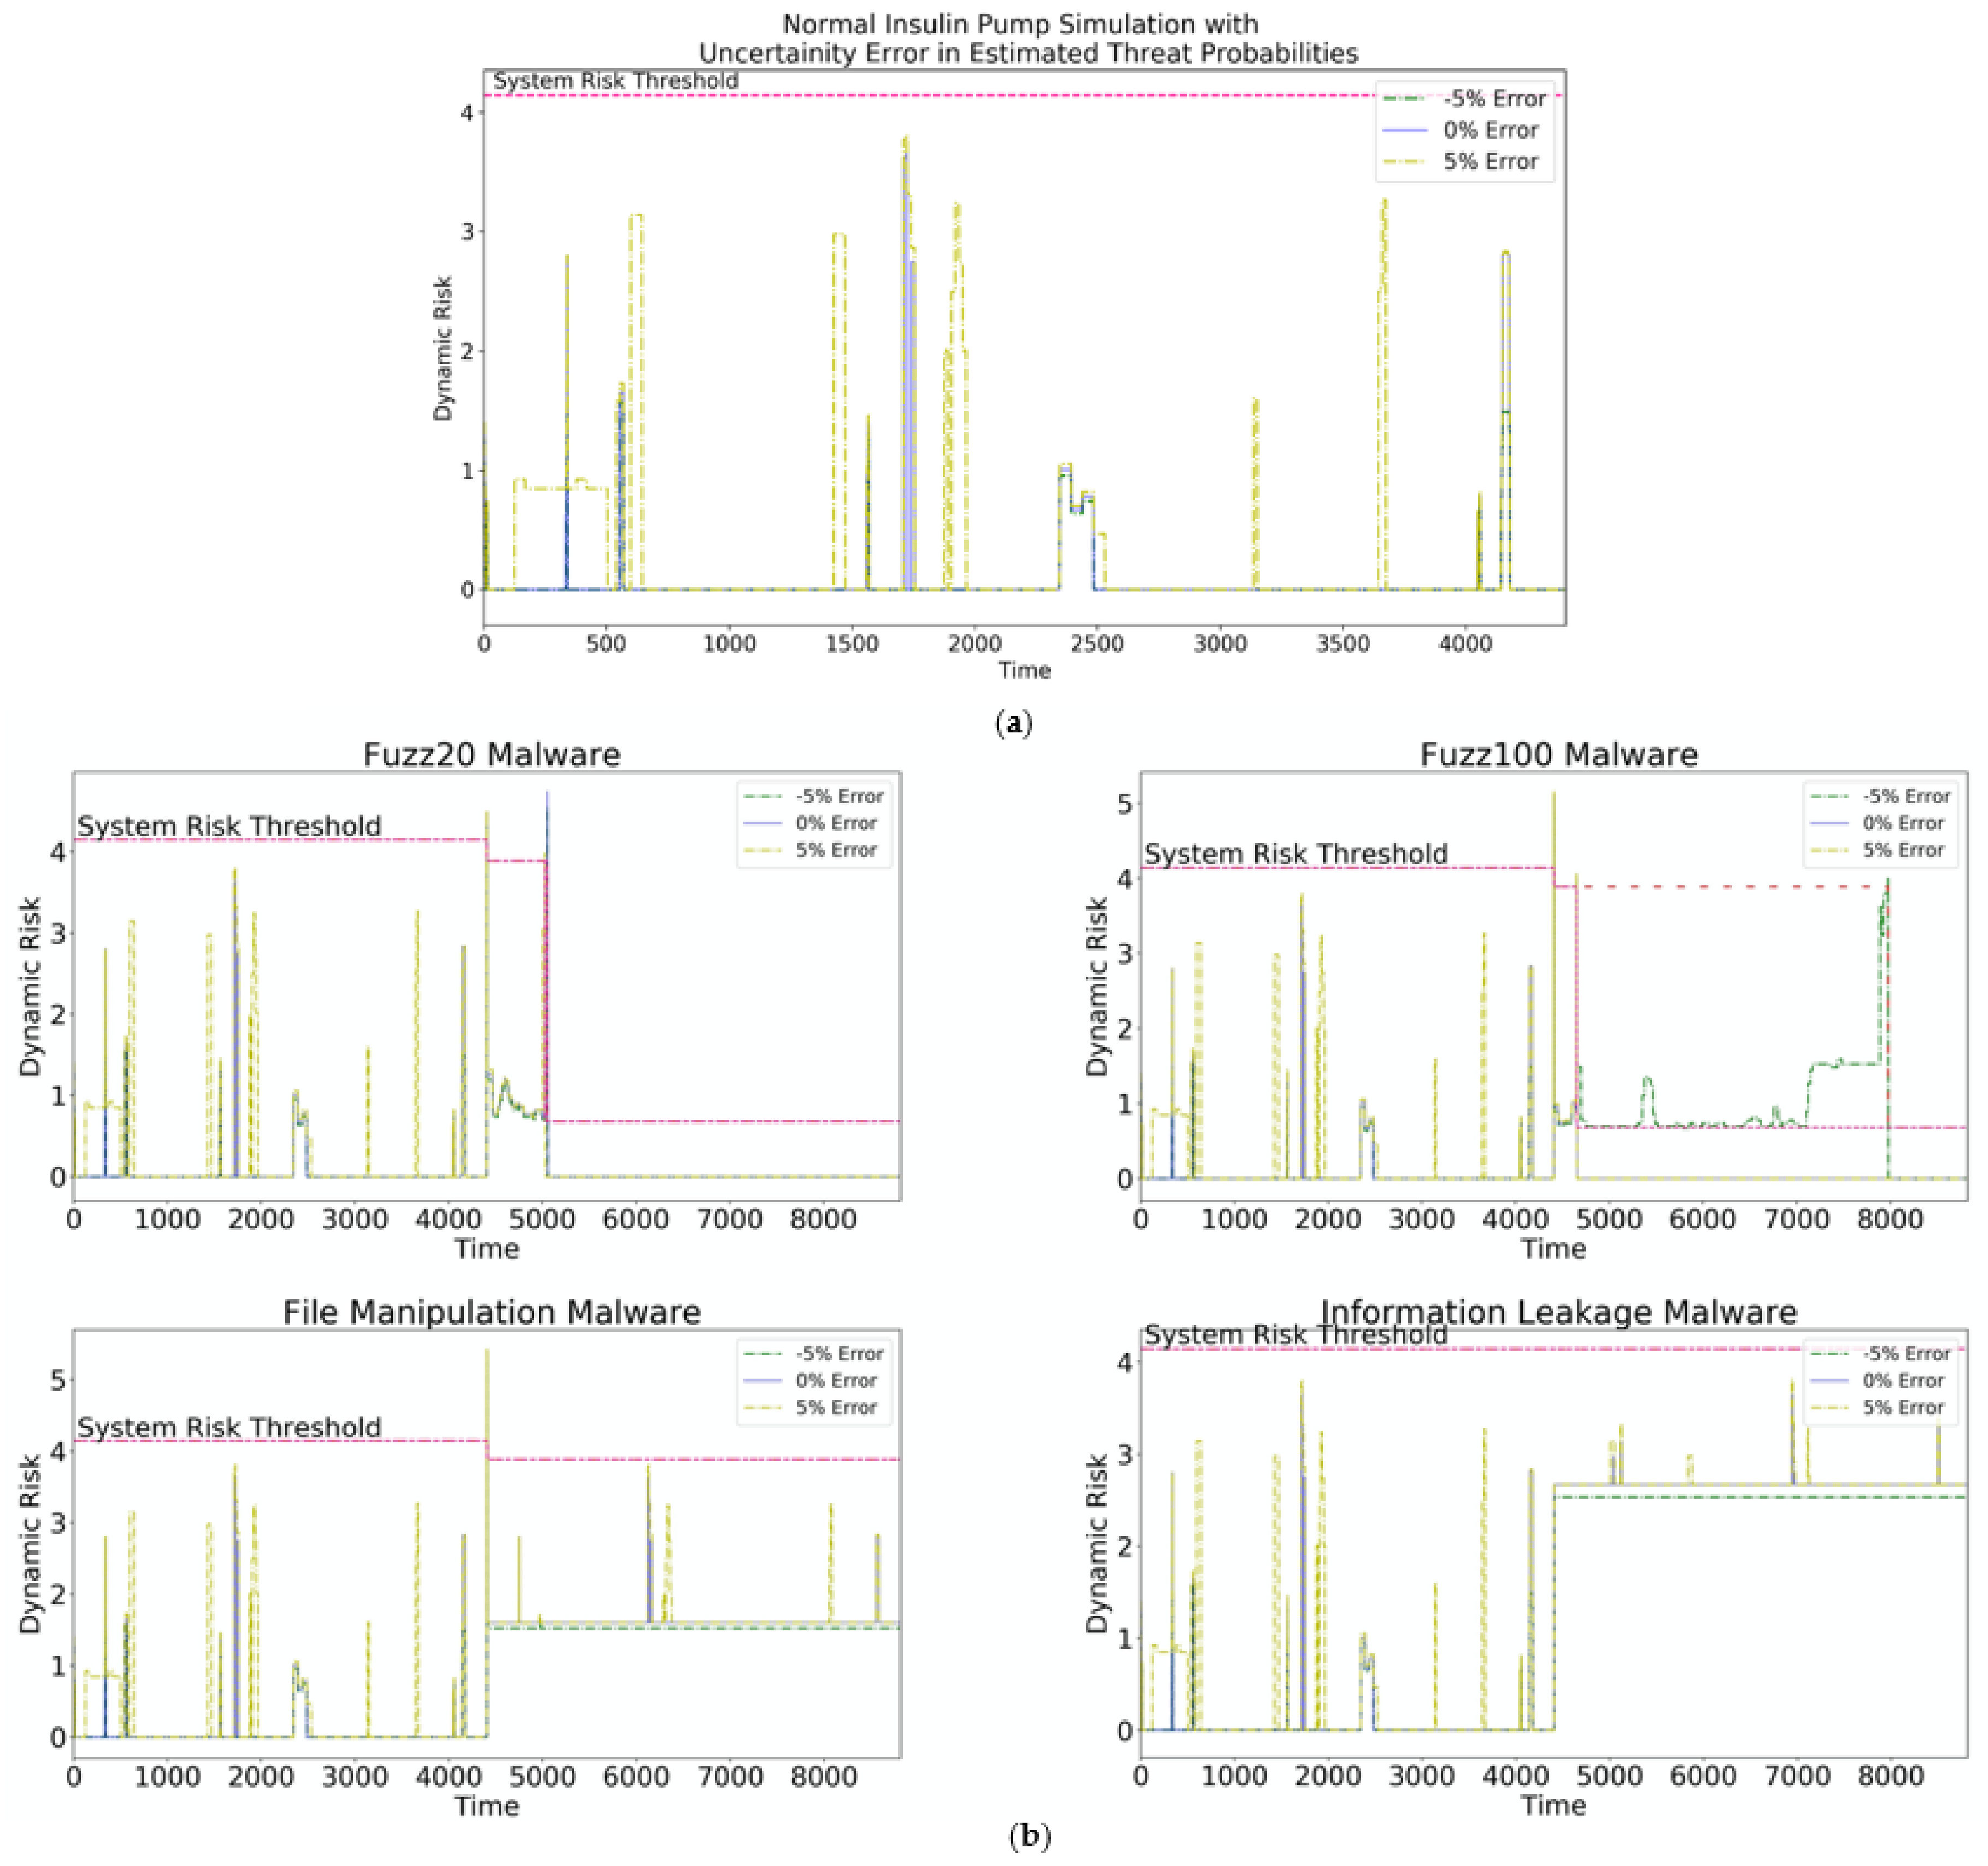
We evaluated the robustness of the dynamic risk evaluation against deviations in the detected and estimated threat probabilities by considering an error of +5%. The threat detector utilized disposed operations with false-positive rates above 5%. Hence, a deviation of +/−5% would suffice in evaluating its impact on dynamic risk evaluation. Simulations were performed for the insulin pump system under normal and real malware-compromised execution (as in Section 8.4.2) for deviations in threat probabilities and are represented in Figure 13. To evaluate the impact of the error on dynamic risk evaluation, we introduced the false-positive mode rate, defined as the rate at which the system is in an FP mode compared to the expected mode (0% error). FIRE demonstrated robustness to deviations in threat probabilities by achieving 0% FP mode rates for most malware, as summarized in Table 5. Our dynamic risk evaluation had a 0% FP mode rate for information leakage and file manipulation malware for a +/−5% deviation. For the Fuzz20 malware, +5% and −5% deviations resulted in 0.26% and 0% FP mode rates, respectively. The Fuzz100 malware had a 0% FP mode rate for a +5% deviation and a 37.7% FP mode rate for a deviation of −5%. Since our dynamic risk evaluation is formulated on the upper-bound PPT-based approach, the impact of the −5% deviation for the Fuzz100 malware is higher. However, it triggered an initial mode switch to M6 to alleviate the malware (at simulation time 4408) while switching to the expected mode (M0 at simulation time 7976) before the end of the malware execution.

9. Conclusions and Future Work

Security risk assessment and its continual management are essential in the ever-growing enterprise of connected embedded systems. In particular, they are crucial for life-critical embedded systems where a security threat directly translates to a compromise of patient safety and privacy. Risk evaluation in such systems presents several unique challenges that have to be addressed by all healthcare stakeholders. We presented FIRE, a finely integrated risk evaluation methodology for life-critical embedded system software design. FIRE assigns standardized security impact scores to the fundamental operations of the life-critical embedded system by carefully considering health and data sensitivity. Utilizing the developed HCFR graph, these scores are propagated from the ground up to the task and operating mode levels. Static risk evaluation methods are finely integrated in the software design with dynamic risk evaluation capabilities at runtime for a robust, comprehensive, and adaptive risk assessment. This aids in automatic risk mitigation when a security threat is detected in the system. We performed a model-based simulation to demonstrate and evaluate FIRE in a smart connected insulin pump case study and performed a systematic analysis that helped establish the circumstances and bounds for risk mitigation by mode. Our simulations have also shown the runtime risk assessment and management performed by FIRE in real and synthetic malware samples. We achieved a 0% false-positive mode switching rate, a 0% false-positive mode rate to deviations in threat probabilities for most malware, and a worst-case simulation mitigation latency of 448 ms, which is well within the bounds of the essential functioning time of the insulin pump.
In the future, we will explore the static risk analysis by considering security threats that affect any possible set of operations and not just a random set. We plan to pick these sets of operations by using optimization heuristics tailored to health and data sensitivity. We plan to develop heuristics during dynamic risk evaluation in order to make FIRE more robust to deviations in threat probabilities. We will also experimentally validate FIRE for a multimodal life-critical system by implementing the entire system on hardware. This will help in determining accurate latency, power, and energy overheads. In addition, it will address the challenge of certifying such a medical device software design.

Author Contributions

Conceptualization, A.R., R.L. and J.R.; methodology, A.R., R.L., N.A.C. and J.R.; software, A.R.; validation, A.R. and N.A.C.; formal analysis, A.R., R.L. and J.R.; investigation, A.R., R.L., N.A.C. and J.R.; resources, A.R.; data curation, A.R. and N.A.C.; writing—original draft preparation, A.R.; writing—review and editing, A.R., R.L., N.A.C. and J.R.; visualization, A.R.; supervision, R.L. and J.R.; project administration, R.L. and J.R.; funding acquisition, R.L. and J.R. All authors have read and agreed to the published version of the manuscript.

Funding

This research was supported by the National Science Foundation (NSF) under grant CNS-1615890.

Data Availability Statement

Not applicable.

Conflicts of Interest

The authors declare no conflict of interest.

References

  1. Williams, P.A.; Woodward, A.J. Cybersecurity Vulnerabilities in Medical Devices: A Complex Environment and Multifaceted Problem. Med. Devices 2015, 8, 305–316. [Google Scholar] [CrossRef] [PubMed] [Green Version]
  2. Halperin, D.; Heydt-Benjamin, T.S.; Ransford, B.; Clark, S.S.; Defend, B.; Morgan, W.; Fu, K.; Kohno, T.; Maisel, W.H. Pacemakers and Implantable Cardiac Defibrillators: Software Radio Attacks and Zero-Power Defenses. In Proceedings of the 2008 IEEE Symposium on Security and Privacy (sp 2008), Oakland, CA, USA, 18–21 May 2008; pp. 129–142. [Google Scholar]
  3. Li, C.; Raghunathan, A.; Jha, N.K. Hijacking an Insulin Pump: Security Attacks and Defenses for a Diabetes Therapy System. In Proceedings of the 2011 IEEE 13th International Conference on e-Health Networking, Applications and Services, Columbia, MD, USA, 13–15 June 2011; pp. 150–156. [Google Scholar]
  4. Maisel, W.H.; Kohno, T. Improving the Security and Privacy of Implantable Medical Devices. N. Engl. J. Med. 2010, 362, 1164–1166. [Google Scholar] [CrossRef] [PubMed] [Green Version]
  5. Postmarket Management of Cybersecurity in Medical Devices. Available online: https://www.fda.gov/regulatory-information/search-fda-guidance-documents/postmarket-management-cybersecurity-medical-devices (accessed on 5 August 2022).
  6. Mell, P.; Scarfone, K.; Romanosky, S. A Complete Guide to the Common Vulnerability Scoring System Version 2.0. In Proceedings of the Published by FIRST-Forum of Incident Response and Security Teams, 2007; pp. 1–23. Available online: https://tsapps.nist.gov/publication/get_pdf.cfm?pub_id=51198 (accessed on 11 August 2022).
  7. Carreón, N.A.; Sonderer, C.; Rao, A.; Lysecky, R. A Medical Vulnerability Scoring System Incorporating Health and Data Sensitivity Metrics. Int. J. Comput. Inf. Eng. 2021, 15, 458–466. [Google Scholar]
  8. Boehm, B.W. Software Risk Management: Principles and Practices. IEEE Softw. 1991, 8, 32–41. [Google Scholar] [CrossRef]
  9. Carreon, N.A.; Lu, S.; Lysecky, R. Hardware-Based Probabilistic Threat Detection and Estimation for Embedded Systems. In Proceedings of the 2018 IEEE 36th International Conference on Computer Design (ICCD), Orlando, FL, USA, 7–10 October 2018; pp. 522–529. [Google Scholar] [CrossRef] [Green Version]
  10. Rao, A.; Carreón, N.; Lysecky, R.; Rozenblit, J. Probabilistic Threat Detection for Risk Management in Cyber-Physical Medical Systems. IEEE Softw. 2018, 35, 38–43. [Google Scholar] [CrossRef]
  11. Rao, A.; Rozenblit, J.; Lysecky, R.; Sametinger, J. Trustworthy Multi-Modal Framework for Life-Critical Systems Security. In Proceedings of the Annual Simulation Symposium: Society for Computer Simulation International, San Diego, CA, USA, 15 April 2018; pp. 1–9. [Google Scholar]
  12. Lyu, X.; Ding, Y.; Yang, S.-H. Safety and Security Risk Assessment in Cyber-Physical Systems. IET Cyber-Phys. Syst. Theory Appl. 2019, 4, 221–232. [Google Scholar] [CrossRef]
  13. Siddiqui, F.; Hagan, M.; Sezer, S. Establishing Cyber Resilience in Embedded Systems for Securing Next-Generation Critical Infrastructure. In Proceedings of the 2019 32nd IEEE International System-on-Chip Conference (SOCC), Singapore, 3–6 September 2019; pp. 218–223. [Google Scholar] [CrossRef]
  14. Ashibani, Y.; Mahmoud, Q.H. Cyber Physical Systems Security: Analysis, Challenges and Solutions. Comput. Secur. 2017, 68, 81–97. [Google Scholar] [CrossRef]
  15. Kure, H.I.; Islam, S.; Razzaque, M.A. An Integrated Cyber Security Risk Management Approach for a Cyber-Physical System. Appl. Sci. 2018, 8, 898. [Google Scholar] [CrossRef] [Green Version]
  16. Bialas, A. Risk Management in Critical Infrastructure—Foundation for Its Sustainable Work. Sustainability 2016, 8, 240. [Google Scholar] [CrossRef]
  17. Baiardi, F.; Telmon, C.; Sgandurra, D. Hierarchical, Model-Based Risk Management of Critical Infrastructures. Reliab. Eng. Syst. Saf. 2009, 94, 1403–1415. [Google Scholar] [CrossRef] [Green Version]
  18. Poolsappasit, N.; Dewri, R.; Ray, I. Dynamic Security Risk Management Using Bayesian Attack Graphs. IEEE Trans. Dependable Secur. Comput. 2012, 9, 61–74. [Google Scholar] [CrossRef]
  19. Szwed, P.; Skrzyński, P. A new lightweight method for security risk assessment based on fuzzy cognitive maps. Int. J. Appl. Math. Comput. Sci. 2014, 24, 213–225. [Google Scholar] [CrossRef] [Green Version]
  20. Lindvall, M.; Diep, M.; Klein, M.; Jones, P.; Zhang, Y.; Vasserman, E. Safety-Focused Security Requirements Elicitation for Medical Device Software. In Proceedings of the 2017 IEEE 25th International Requirements Engineering Conference (RE), Lisbon, Portugal, 4–8 September 2017; pp. 134–143. [Google Scholar] [CrossRef]
  21. Jagannathan, S.; Sorini, A. A Cybersecurity Risk Analysis Methodology for Medical Devices. In Proceedings of the 2015 IEEE Symposium on Product Compliance Engineering (ISPCE), Chicago, IL, USA, 18–20 May 2015; pp. 1–6. [Google Scholar]
  22. Sango, M.; Godot, J.; Gonzalez, A.; Ruiz Nolasco, R. Model-Based System, Safety and Security Co-Engineering Method and Toolchain for Medical Devices Design. In Proceedings of the 2019 Design for Medical Devices Conference, Minneapolis, MN, USA, 15 April 2019. [Google Scholar] [CrossRef] [Green Version]
  23. Ngamboé, M.; Berthier, P.; Ammari, N.; Dyrda, K.; Fernandez, J.M. Risk Assessment of Cyber-Attacks on Telemetry-Enabled Cardiac Implantable Electronic Devices (CIED). Int. J. Inf. Secur. 2021, 20, 621–645. [Google Scholar] [CrossRef]
  24. Ni, S.; Zhuang, Y.; Gu, J.; Huo, Y. A Formal Model and Risk Assessment Method for Security-Critical Real-Time Embedded Systems. Comput. Secur. 2016, 58, 199–215. [Google Scholar] [CrossRef]
  25. Easttom, C.; Mei, N. Mitigating Implanted Medical Device Cybersecurity Risks. In Proceedings of the 2019 IEEE 10th Annual Ubiquitous Computing, Electronics & Mobile Communication Conference (UEMCON), New York, NY, USA, 10–12 October 2019; pp. 0145–0148. [Google Scholar] [CrossRef]
  26. Carreón, N.A.; Gilbreath, A.; Lysecky, R. Statistical Time-Based Intrusion Detection in Embedded Systems. In Proceedings of the 23rd Conference on Design, Automation and Test in Europe, Grenoble, France, 9–13 March 2020; pp. 562–567. [Google Scholar] [CrossRef]
  27. Phan, L.; Lee, I. Towards a Compositional Multi-Modal Framework for Adaptive Cyber-Physical Systems. In Proceedings of the 2011 IEEE 17th International Conference on Embedded and Real-Time Computing Systems and Applications, Toyama, Japan, 28–31 August 2011; Volume 2, pp. 67–73. [Google Scholar]
  28. Pinto, S.; Gomes, T.; Pereira, J.; Cabral, J.; Tavares, A. IIoTEED: An Enhanced, Trusted Execution Environment for Industrial IoT Edge Devices. IEEE Internet Comput. 2017, 21, 40–47. [Google Scholar] [CrossRef]
  29. Chen, T.; Phan, L.T.X. SafeMC: A System for the Design and Evaluation of Mode-Change Protocols. In Proceedings of the 2018 IEEE Real-Time and Embedded Technology and Applications Symposium (RTAS), Porto, Portugal, 11–13 April 2018; pp. 105–116. [Google Scholar]
  30. Eidson, J.C.; Lee, E.A.; Matic, S.; Seshia, S.A.; Zou, J. Distributed Real-Time Software for Cyber–Physical Systems. Proc. IEEE 2012, 100, 45–59. [Google Scholar] [CrossRef]
  31. Liu, P. Some Hamacher Aggregation Operators Based on the Interval-Valued Intuitionistic Fuzzy Numbers and Their Application to Group Decision Making. IEEE Trans. Fuzzy Syst. 2014, 22, 83–97. [Google Scholar] [CrossRef]
  32. de Gusmão, A.P.H.; e Silva, L.C.; Silva, M.M.; Poleto, T.; Costa, A.P.C.S. Information Security Risk Analysis Model Using Fuzzy Decision Theory. Int. J. Inf. Manag. 2016, 36, 25–34. [Google Scholar] [CrossRef]
  33. Yaqoob, T.; Abbas, H.; Atiquzzaman, M. Security Vulnerabilities, Attacks, Countermeasures, and Regulations of Networked Medical Devices—A Review. Commun. Surv. Tuts. 2019, 21, 3723–3768. [Google Scholar] [CrossRef]
  34. Wasicek, A.; Derler, P.; Lee, E.A. Aspect-Oriented Modeling of Attacks in Automotive Cyber-Physical Systems. In Proceedings of the 51st Annual Design Automation Conference, New York, NY, USA, 1 June 2014; Association for Computing Machinery: New York, NY, USA; pp. 1–6. [Google Scholar]
  35. Lu, S.; Lysecky, R. Time and Sequence Integrated Runtime Anomaly Detection for Embedded Systems. ACM Trans. Embed. Comput. Syst. 2017, 17, 38:1–38:27. [Google Scholar] [CrossRef]
  36. MiniMedTM 770G System. Available online: https://www.medtronicdiabetes.com/products/minimed-770g-insulin-pump-system (accessed on 6 August 2022).
  37. Walsh, J.; Roberts, R.; Heinemann, L. Confusion Regarding Duration of Insulin Action. J. Diabetes Sci. Technol. 2014, 8, 170–178. [Google Scholar] [CrossRef] [PubMed]
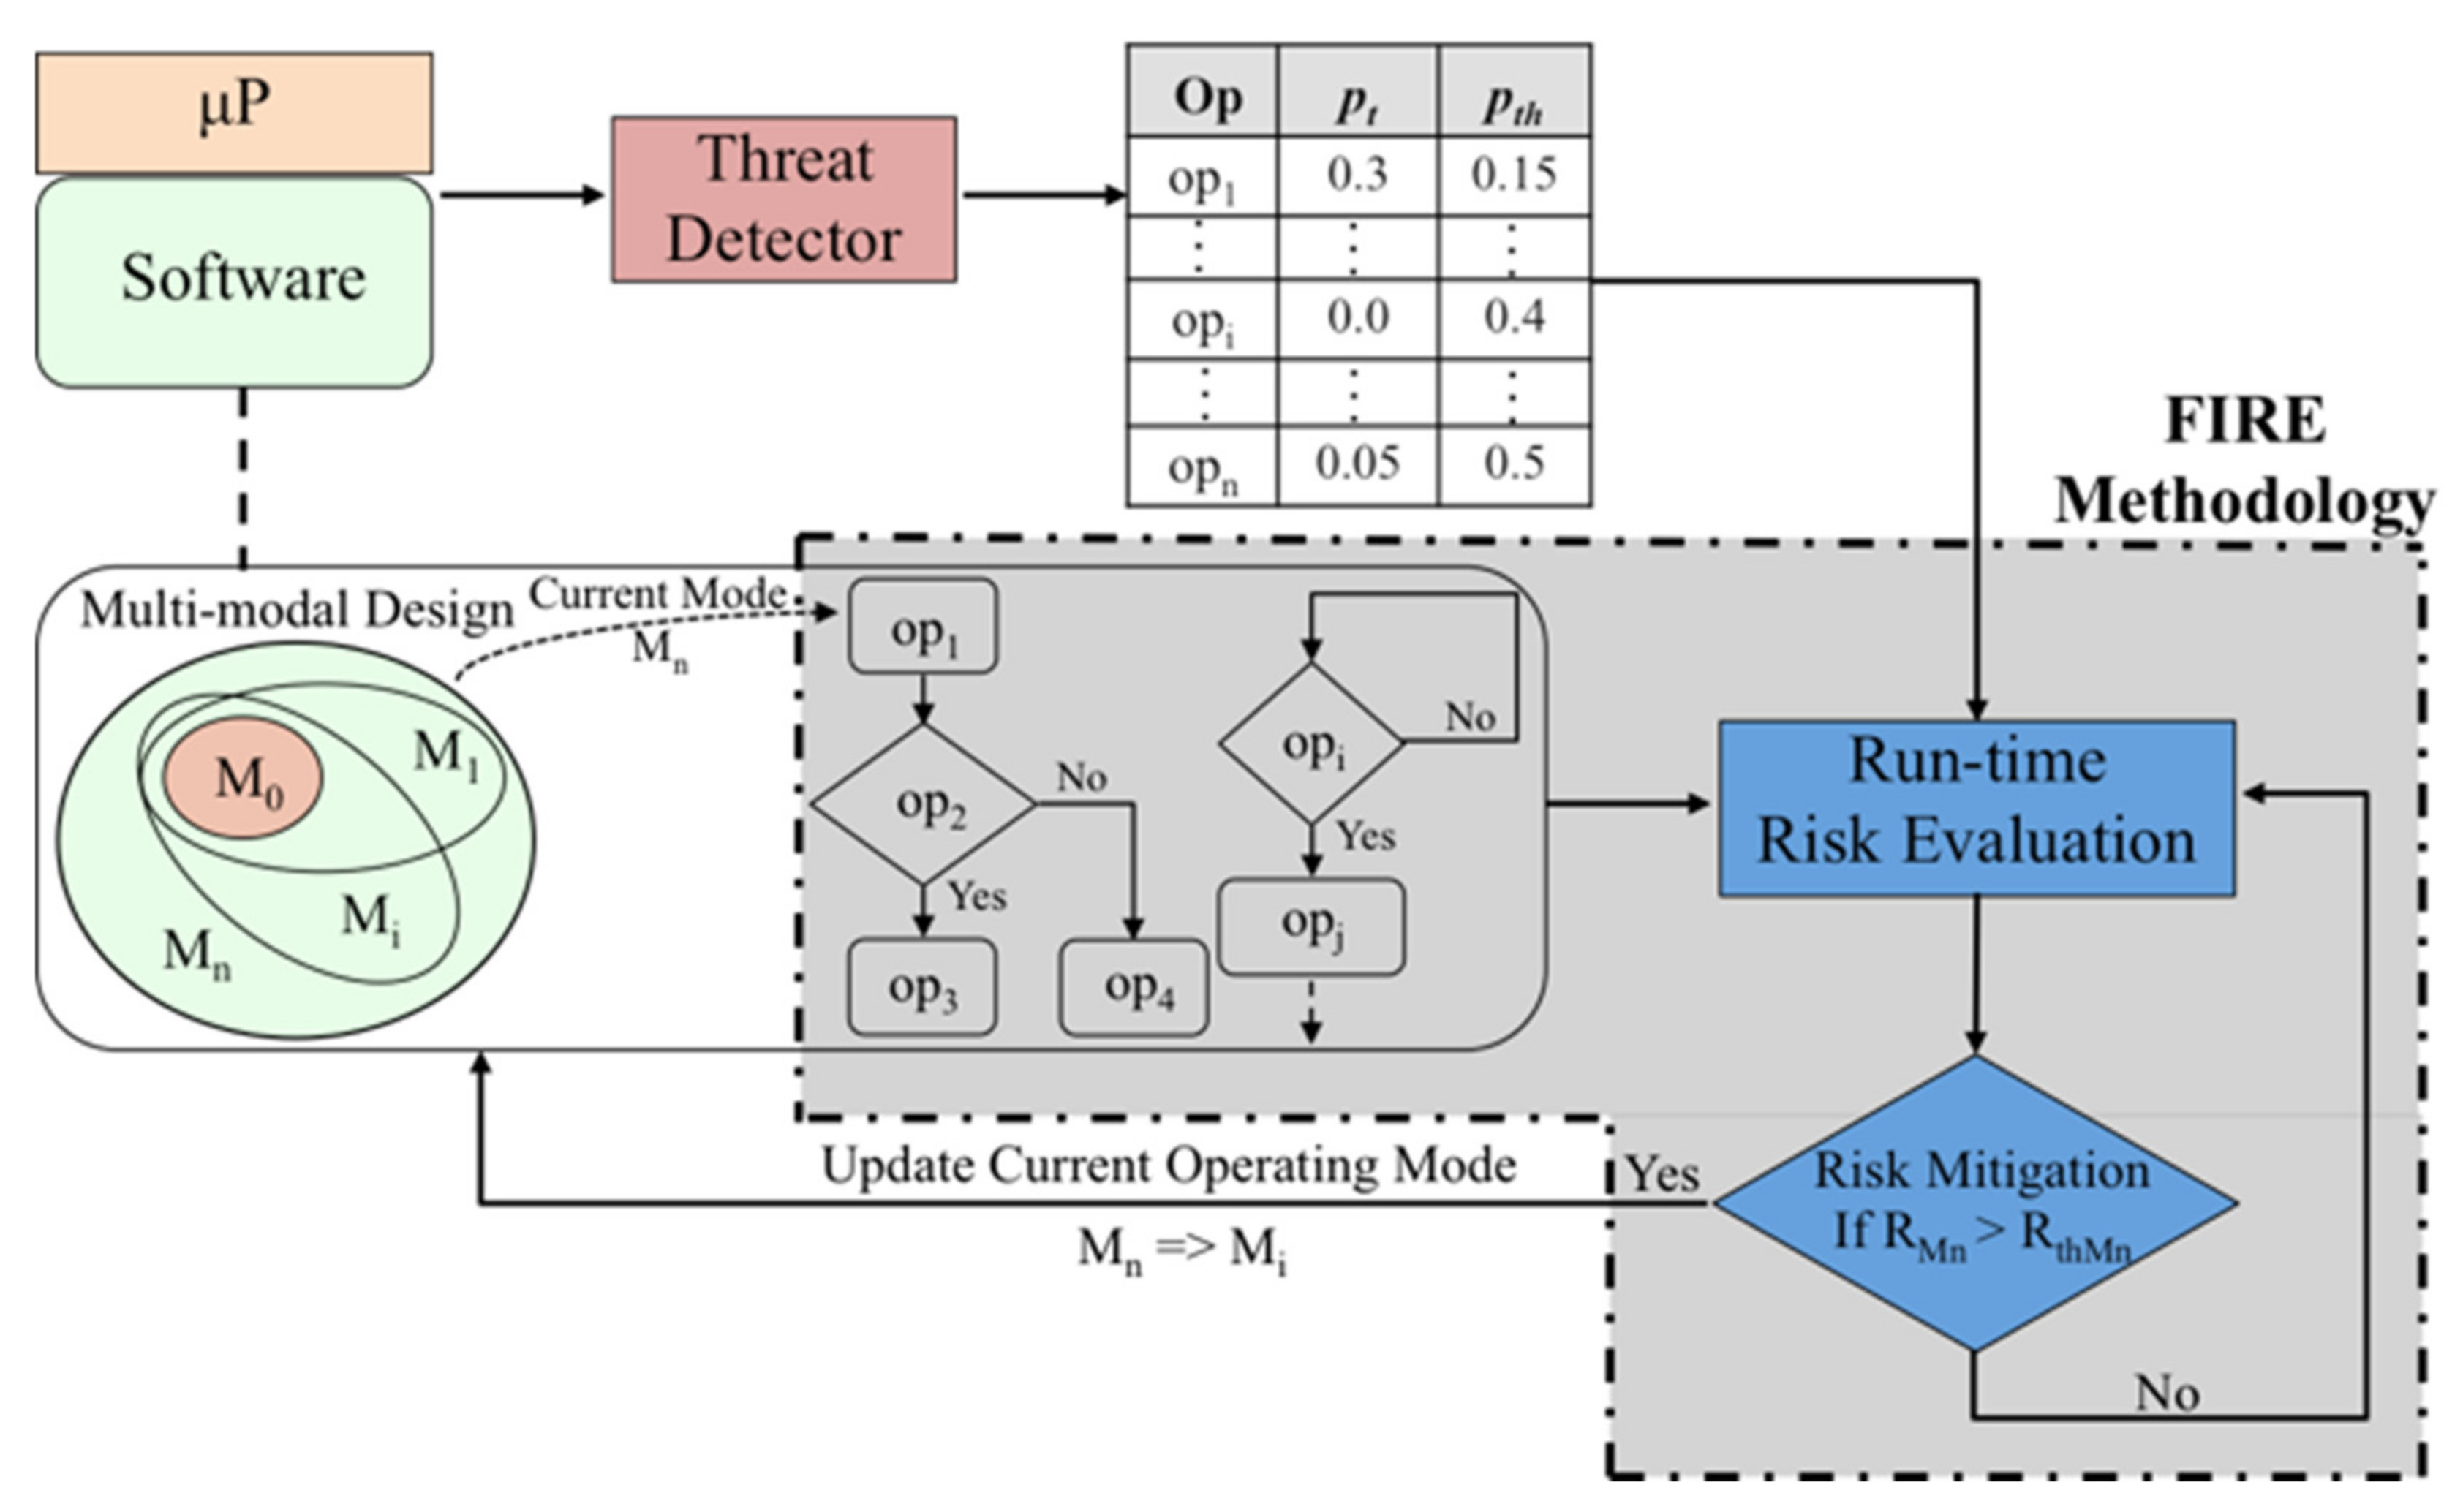
Figure 1. Life-critical embedded system overview: multimodal software design, threat detector f and estimator, and FIRE (runtime risk evaluation and mitigation).
Information 13 00487 g001
Figure 2. Overview of the CDF-based threat detector and estimator combined with the finely integrated risk evaluation methodology.
Information 13 00487 g002
Figure 4. Annotated example illustration of dynamic risk evaluation filter conditions.
Information 13 00487 g004
Figure 5. Experimental evaluation of dynamic risk evaluation filter condition thresholds: (a) per-operation-based (POT), (b) per-task-based (PTT), and (c) per-path-based (PPT) dynamic risk evaluation.
Information 13 00487 g005
Figure 6. High-level multimodal design of a smart connected insulin pump.
Information 13 00487 g006
Figure 7. Overview of the experimental setup to simulate FIRE.
Information 13 00487 g007
Figure 8. Illustration of the static risk evaluation for the insulin pump HCFR graph.
Information 13 00487 g008
Figure 9. Surface plots of the sensitivity analysis of number of operations vs. threat probability vs. mode risk. Mode 1, mode 2, and mode 3 of the smart connected insulin pump are illustrated. The heat map surface shows the security threat zone that requires risk mitigation by mode switching.
Information 13 00487 g009
Figure 10. Mode risk boundary lines of all insulin pump modes. Graph of number of operations vs. threat probability shows the threshold conditions.
Information 13 00487 g010
Figure 11. Normal execution sequence of the insulin pump operating in the highest mode, M8.
Information 13 00487 g011
Figure 13. Simulation results plotting the insulin pump dynamic risk vs. execution time for +/−5% error in estimated threat probabilities for: (a) normal execution and (b) compromised execution with real malware.
Information 13 00487 g013
Table 1. Health and data sensitivity impact scoring evaluation.
Security ValueDescriptionCIA Impact Score
None (N)Operation has no impact on health and sensitivity.0.0
Low (L)Impact of exploited operation on health and sensitivity is minimal.0.22
Medium (M)If compromised, operation can considerably impact health and sensitivity, but patient is not at risk.0.31
High (H)If compromised, operations may lead to life-threatening health consequences or the loss/invasion of critical sensitive data.0.56
Table 2. Dynamic risk evaluation execution rates under normal operation.
DRE ThresholdsDRE Execution Rate
POT20.80%
PTT38.92%
PPT5.85%
Table 3. Malware simulation.
MalwareImpacted TasksImplementation
Fuzz20, Fuzz100T6 = {P7, P8, P9, P10}, T7 = {P11}, T9 = {P13, P14}, T11 = {P16, P17}Randomizes operations and data in the tasks that perform blood glucose sensor processing, insulin amount calculation, physician configuration updates, and data transfer and display.
File ManipulationT6 = {P7, P8, P9, P10}, T9 = {P13, P14}, T11 = {P16, P17}Manipulates tasks that perform data transfer and display.
Information LeakageT2 = {P3}, T10 = {P15}Utilizes tasks at display alerts and warnings to covertly leak corresponding (private) data.
Synthetic Malware 1T6 = {P7, P8, P9, P10}, T11 = {P16, P17}Synthetic malware is infused in the critical task of insulin calculation.
Synthetic Malware 2T11 = {P16, P17}Synthetic malware is injected into the task that transfers data to an external device.
Synthetic Malware 3T7 = {P11}, T8 = {P12}Malware is injected into the tasks that change insulin pump settings based on manual inputs.
Synthetic Malware 4T9 = {P13, P14}Synthetic malware is injected into the task that transfers data to the insulin pump display.
Table 4. Execution times of compromised insulin pump tasks.
Malware-Impacted TasksExecution Time (ms)
T11 Fuzz 2028.69
T6 Fuzz 20448.32
T11 Fuzz 1001.8
T6 Fuzz 100447.43
T10 Info Leak279.23
T9 File Manipulation0.34
Table 5. False-positive mode rate for system execution with ±5% estimation error.
System ExecutionFP Mode Rate (%)
Estimated Threat Probabilities’ Deviation Percent0%−5%+5%
Normal000
File Manipulation000
Fuzz20000.26
Fuzz100037.70
Information Leakage000
Publisher’s Note: MDPI stays neutral with regard to jurisdictional claims in published maps and institutional affiliations.