Studying and Clustering Cities Based on Their Non-Emergency Service Requests
Abstract
:1. Introduction
2. Related Work
3. Data Description
4. Methodology for Clustering Cities
4.1. Feature Vectors
4.2. Clusters and Outliers in a Two-Dimensional Visualization of Cities
5. Results and Discussion
5.1. Changes in SR Types over the Years
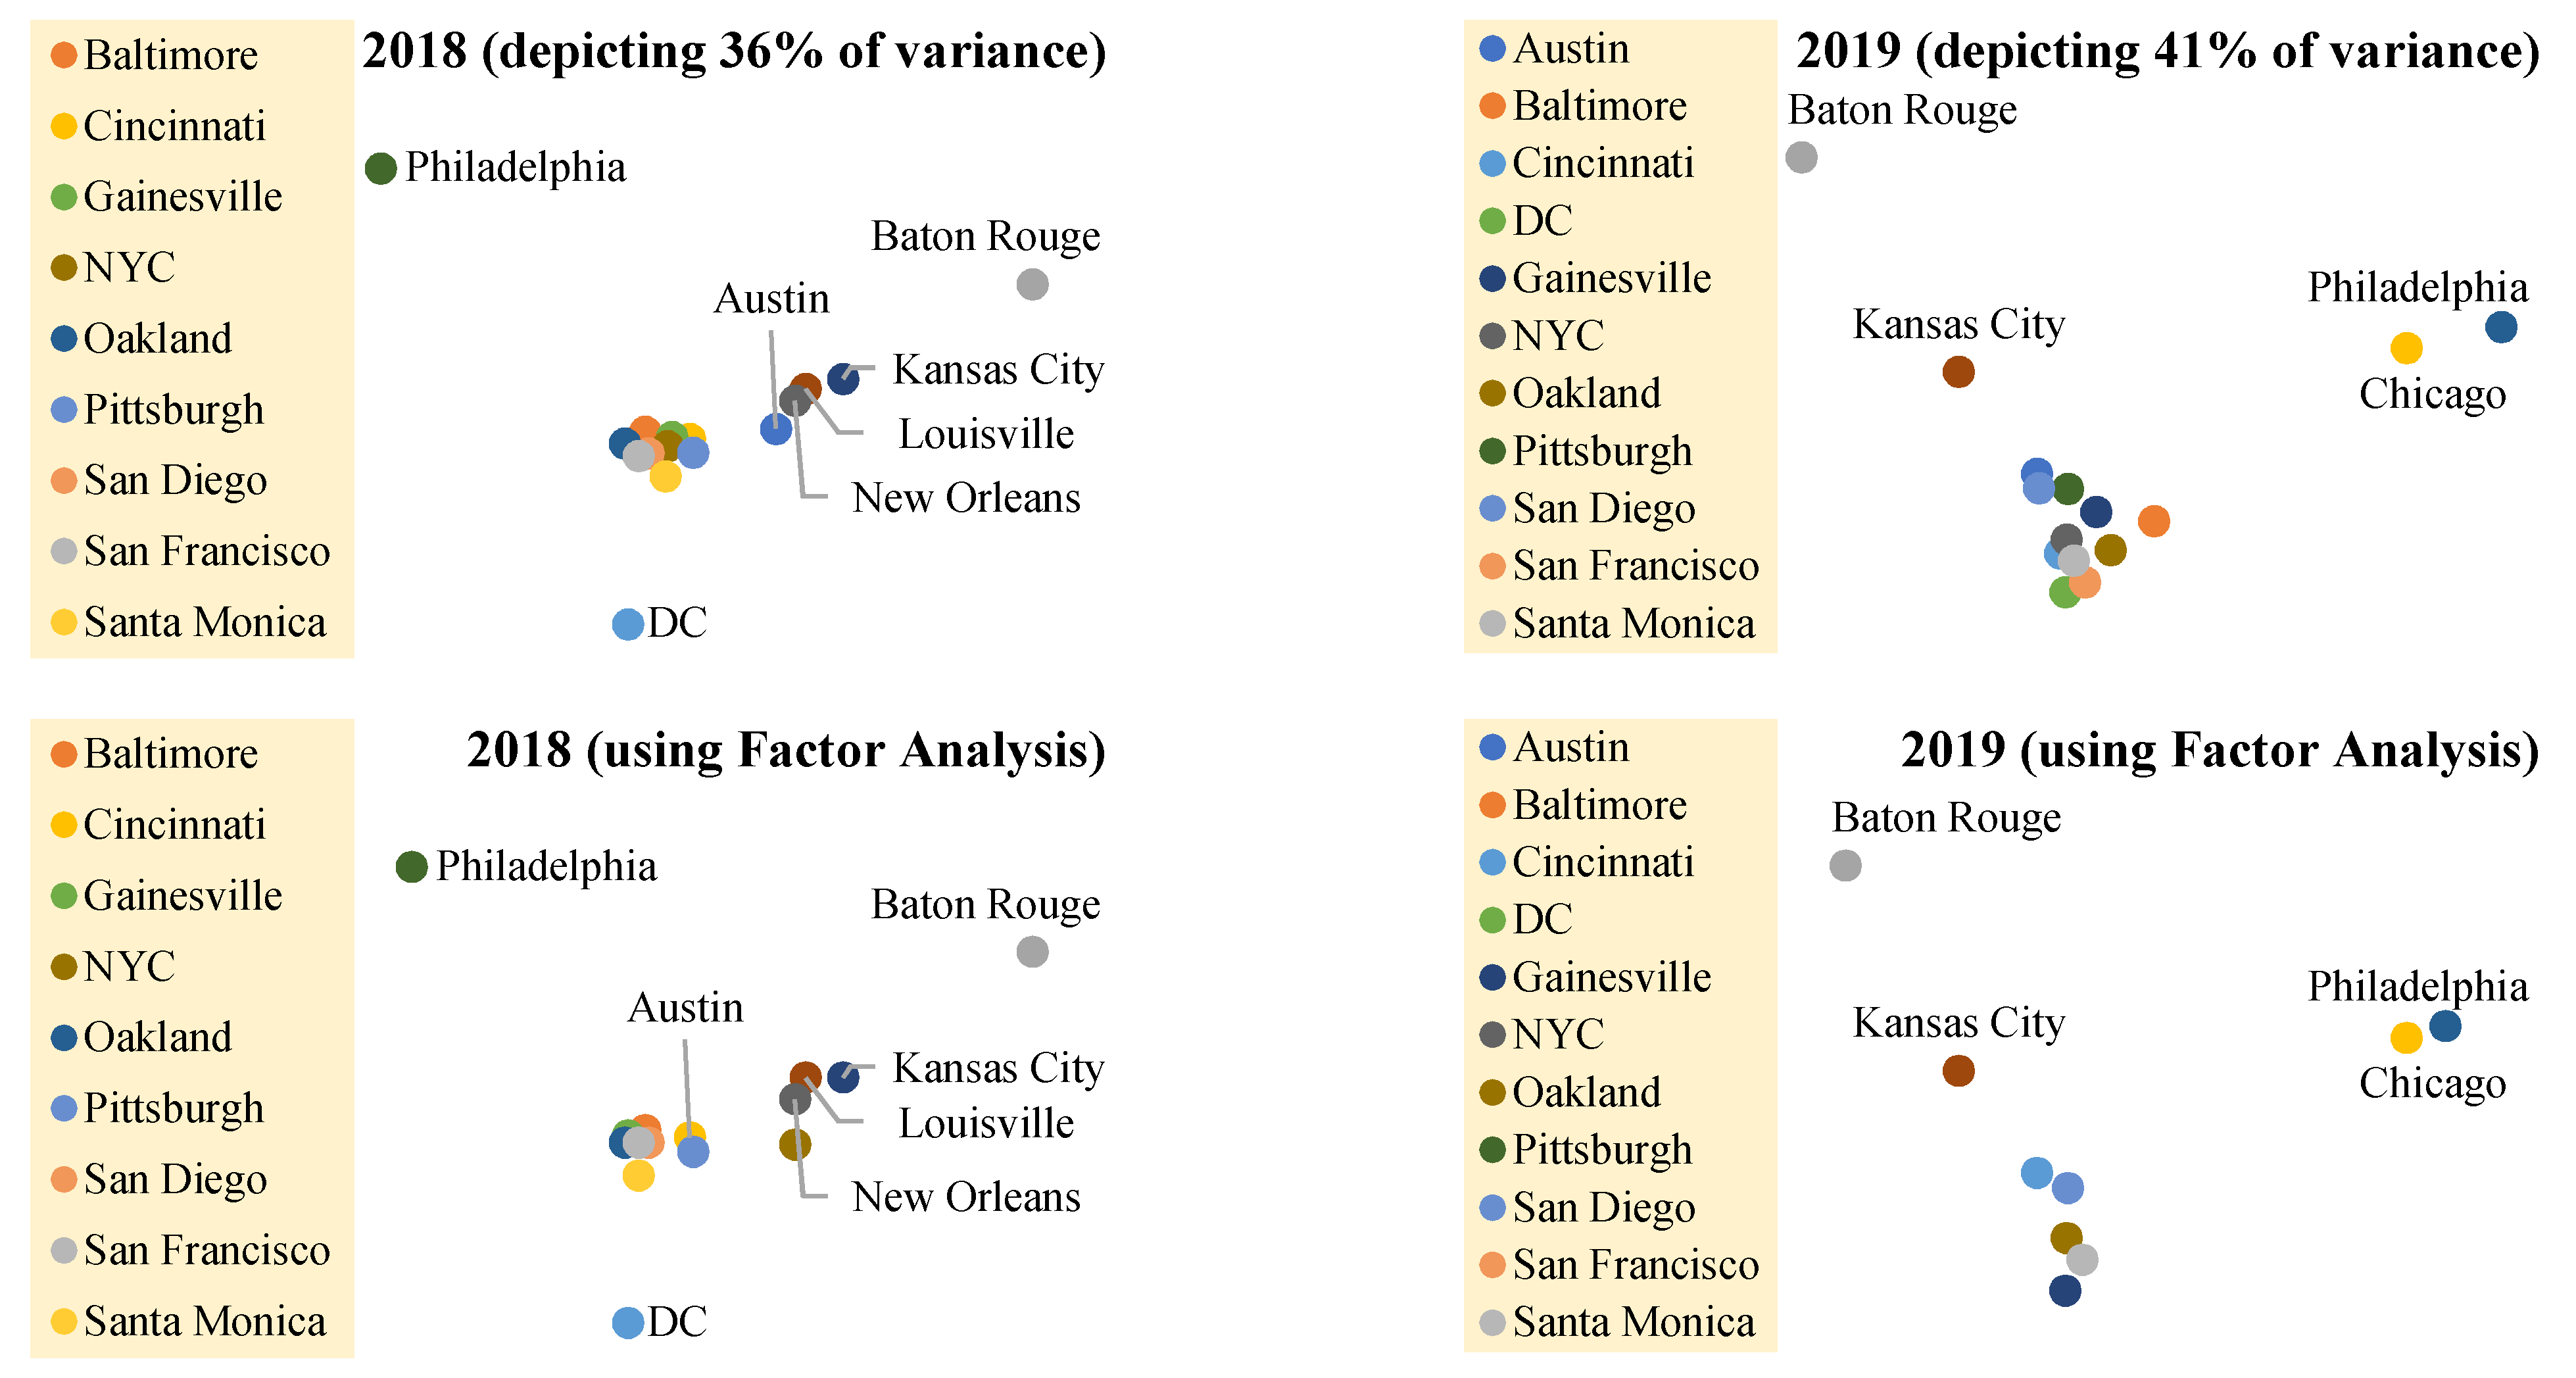
5.2. Visual Clustering of Cities Based on SR Type Rates
6. Conclusions and Future Directions
Funding
Data Availability Statement
Conflicts of Interest
References
- Federal Communications Commission. First Report and Order and Further Notice of Proposed Rulemaking; Federal Communications Commission: Washington, DC, USA, 1997. Available online: https://transition.fcc.gov/Bureaus/Common_Carrier/Orders/1997/fcc97051.pdf (accessed on 20 December 2020).
- Schwester, R.W.; Carrizales, T.; Holzer, M. An examination of the municipal 311 system. Int. J. Organ. Theory Behav. 2009, 12, 218–236. [Google Scholar] [CrossRef]
- Xu, L.; Kwan, M.-P.; McLafferty, S.; Wang, S. Predicting demand for 311 non-emergency municipal services: An adaptive space-time kernel approach. Appl. Geogr. 2017, 89, 133–141. [Google Scholar] [CrossRef]
- DeMeritt, M.; Writer, E. Simplifying citizen reporting. ArcUser Mag. ESRI Softw. User 2011, 14, 26–27. [Google Scholar]
- Chatfield, A.; Reddick, C.G. Customer agility and responsiveness through big data analytics for public value creation: A case study of Houston 311 on-demand services. Gov. Inf. Q. 2018, 35, 336–347. [Google Scholar] [CrossRef]
- Clark, B.Y.; Guzman, T.S. Does Technologically Enabled Citizen Participation Lead to Budget Adjustments? An Investigation of Boston, MA, and San Francisco, CA. Am. Rev. Public Adm. 2016, 47, 945–961. [Google Scholar] [CrossRef]
- Hartmann, S.; Mainka, A.; Stock, W.G. Citizen relationship management in local governments: The Potential of 311 for public service delivery. In Beyond Bureaucracy; Springer: Cham, Switzerland, 2017; pp. 337–353. [Google Scholar]
- Nam, T.; Pardo, T.A. The changing face of a city government: A case study of Philly311. Gov. Inf. Q. 2014, 31, S1–S9. [Google Scholar] [CrossRef]
- Brunsdon, C.; Corcoran, J.; Higgs, G. Visualising space and time in crime patterns: A comparison of methods. Comput. Environ. Urban Syst. 2007, 31, 52–75. [Google Scholar] [CrossRef]
- Wang, L.; Qian, C.; Kats, P.; Kontokosta, C.; Sobolevsky, S. Structure of 311 service requests as a signature of urban location. PLoS ONE 2017, 12, e0186314. [Google Scholar] [CrossRef] [PubMed] [Green Version]
- Minkoff, S.L. NYC 311: A tract-level analysis of citizen–government contacting in New York City. Urban Aff. Rev. 2016, 52, 211–246. [Google Scholar] [CrossRef]
- Clark, B.Y.; Brudney, J.; Jang, S.-G. Coproduction of Government Services and the New Information Technology: Investigating the Distributional Biases. Public Adm. Rev. 2013, 73, 687–701. [Google Scholar] [CrossRef]
- Kontokosta, C.; Hong, B.; Korsberg, K. Equity in 311 reporting: Understanding socio-spatial differentials in the propensity to complain. arXiv 2017, arXiv:1710.02452. [Google Scholar]
- O’Brien, D.T. 311 hotlines, territoriality, and the collaborative maintenance of the urban commons: Examining the intersection of a coproduction policy and evolved human behavior. Evol. Behav. Sci. 2016, 10, 123–141. [Google Scholar] [CrossRef]
- White, A.; Trump, K.-S. The Promises and Pitfalls of 311 Data. Urban Aff. Rev. 2018, 54, 794–823. [Google Scholar] [CrossRef]
- Wheeler, A.P. The Effect of 311 Calls for Service on Crime in D.C. at Microplaces. Crime Delinq. 2018, 64, 1882–1903. [Google Scholar] [CrossRef] [Green Version]
- Lu, Q.; Johnson, P. Characterizing New Channels of Communication: A Case Study of Municipal 311 Requests in Edmonton, Canada. Urban Plan. 2016, 1, 18–31. [Google Scholar] [CrossRef]
- Jolliffe, I.T. Principal Component Analysis; Springer: New York, NY, USA, 1986. [Google Scholar]
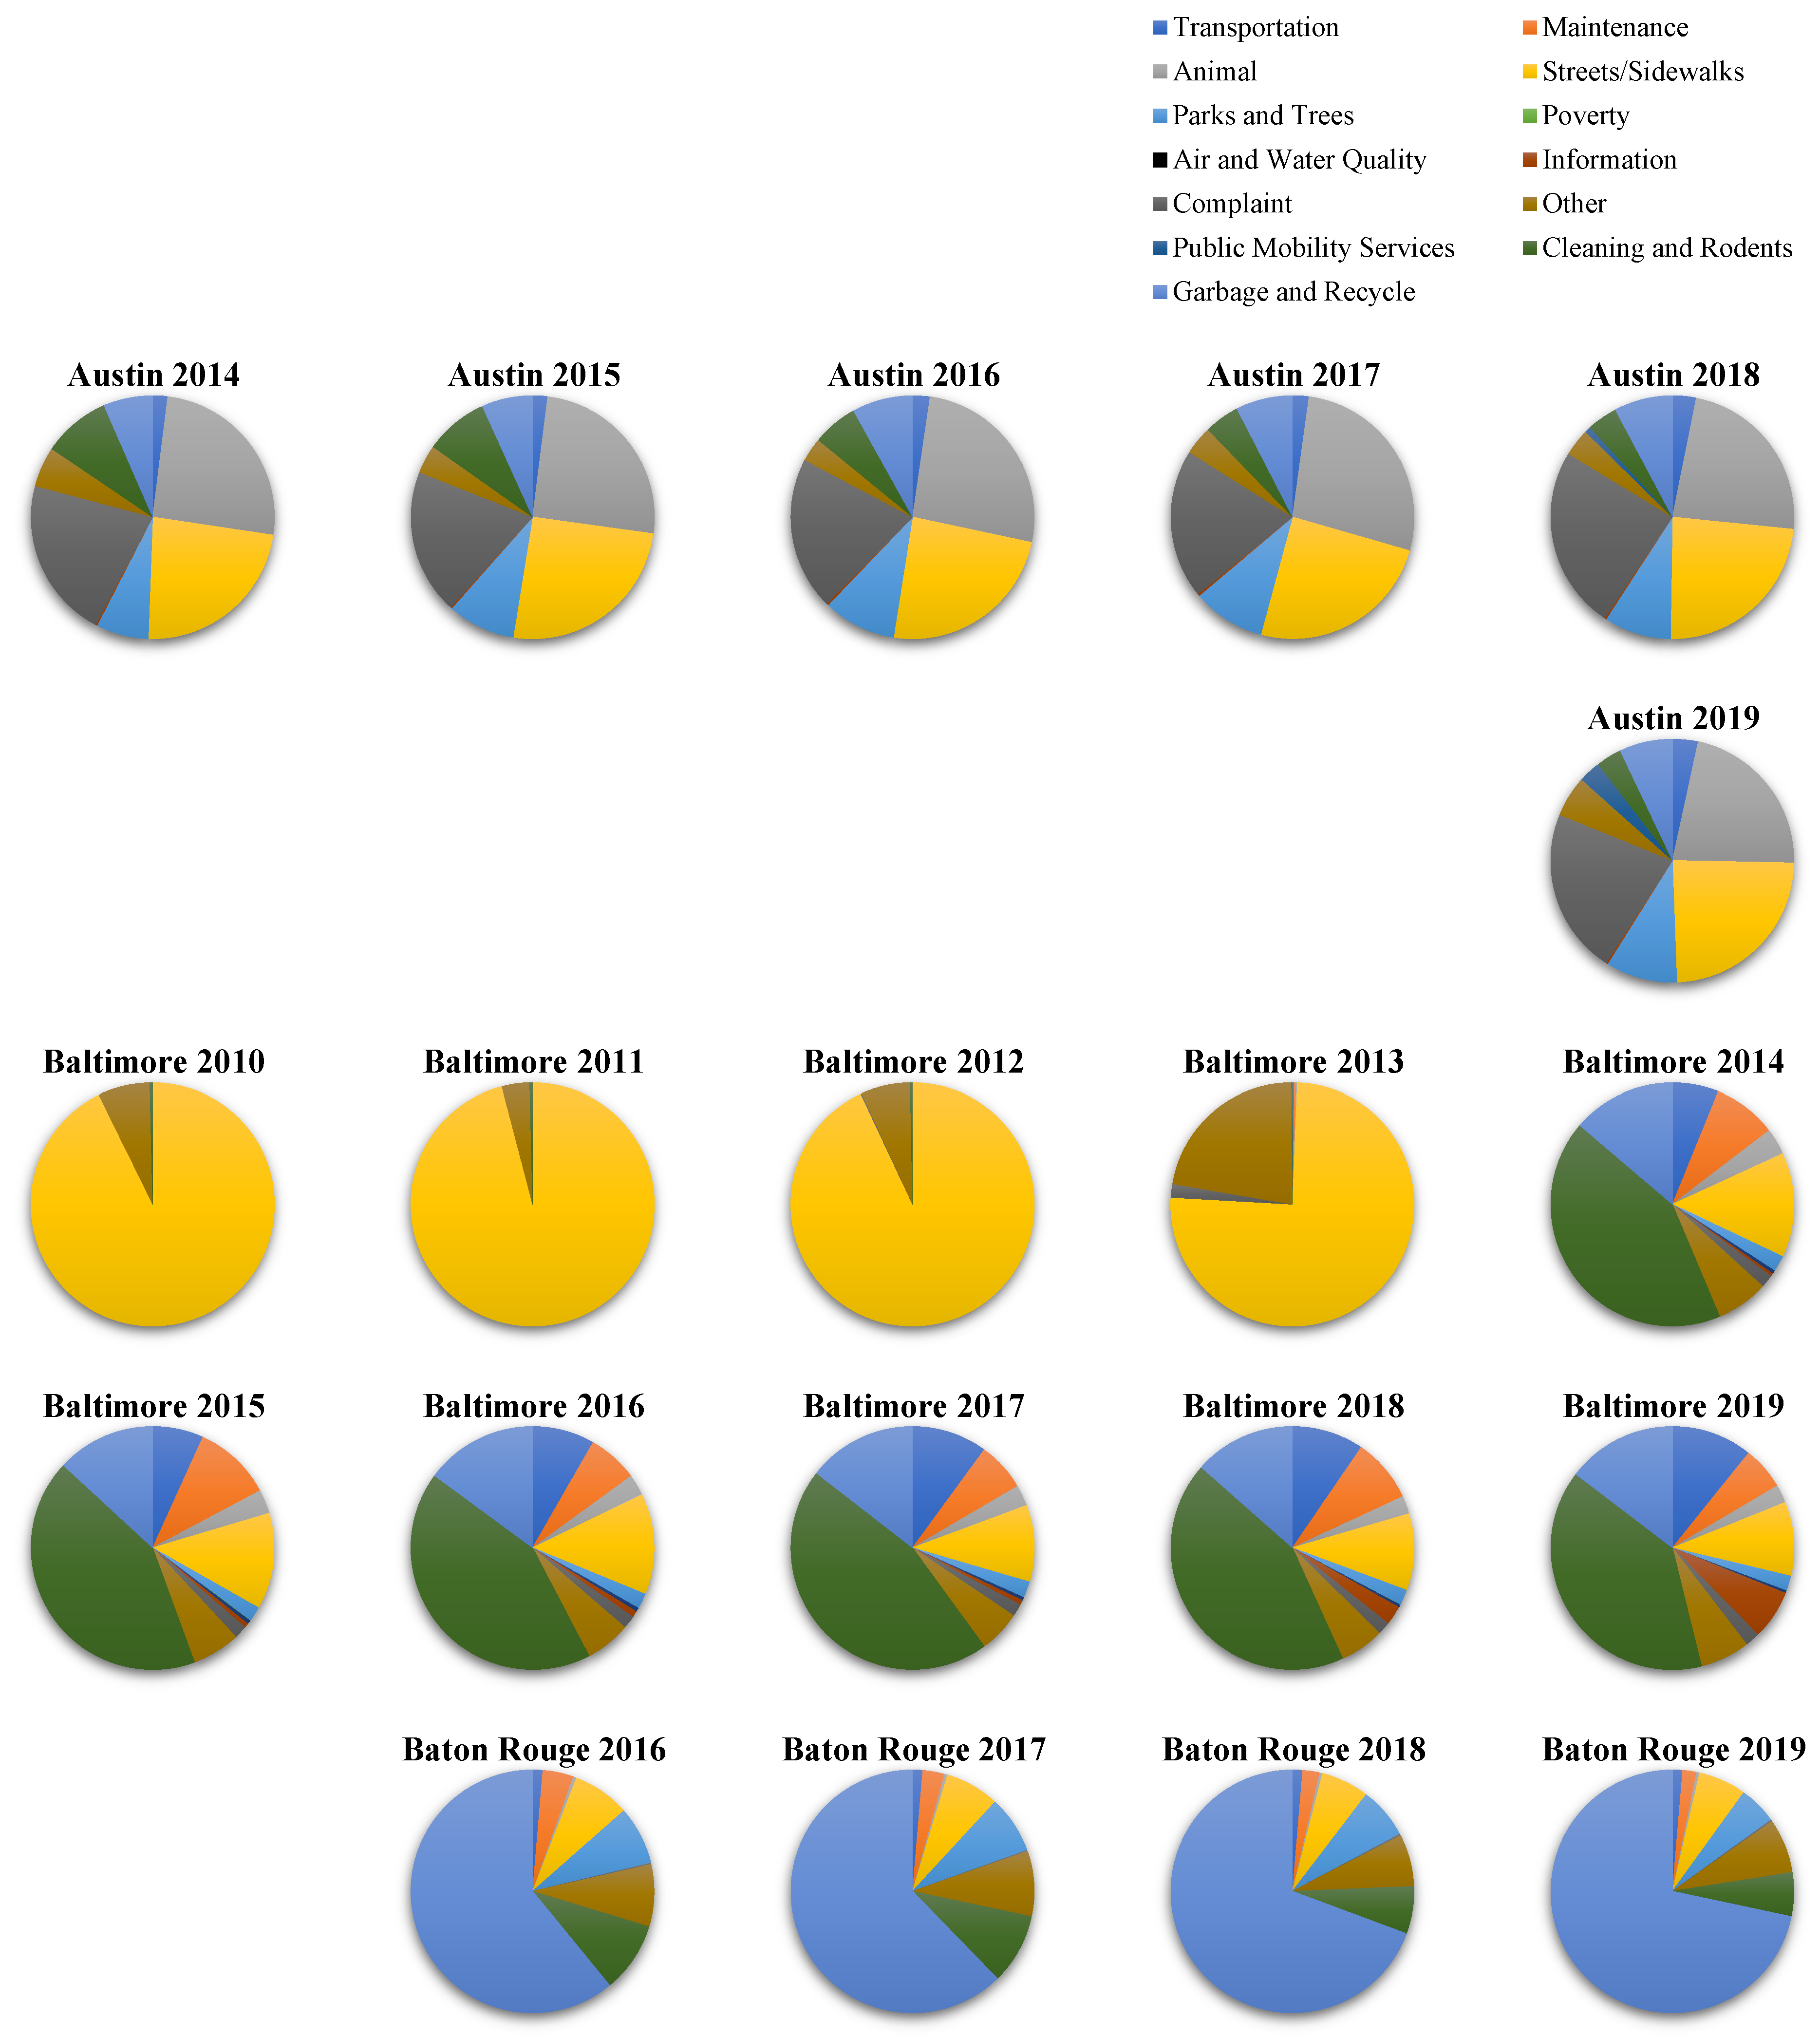


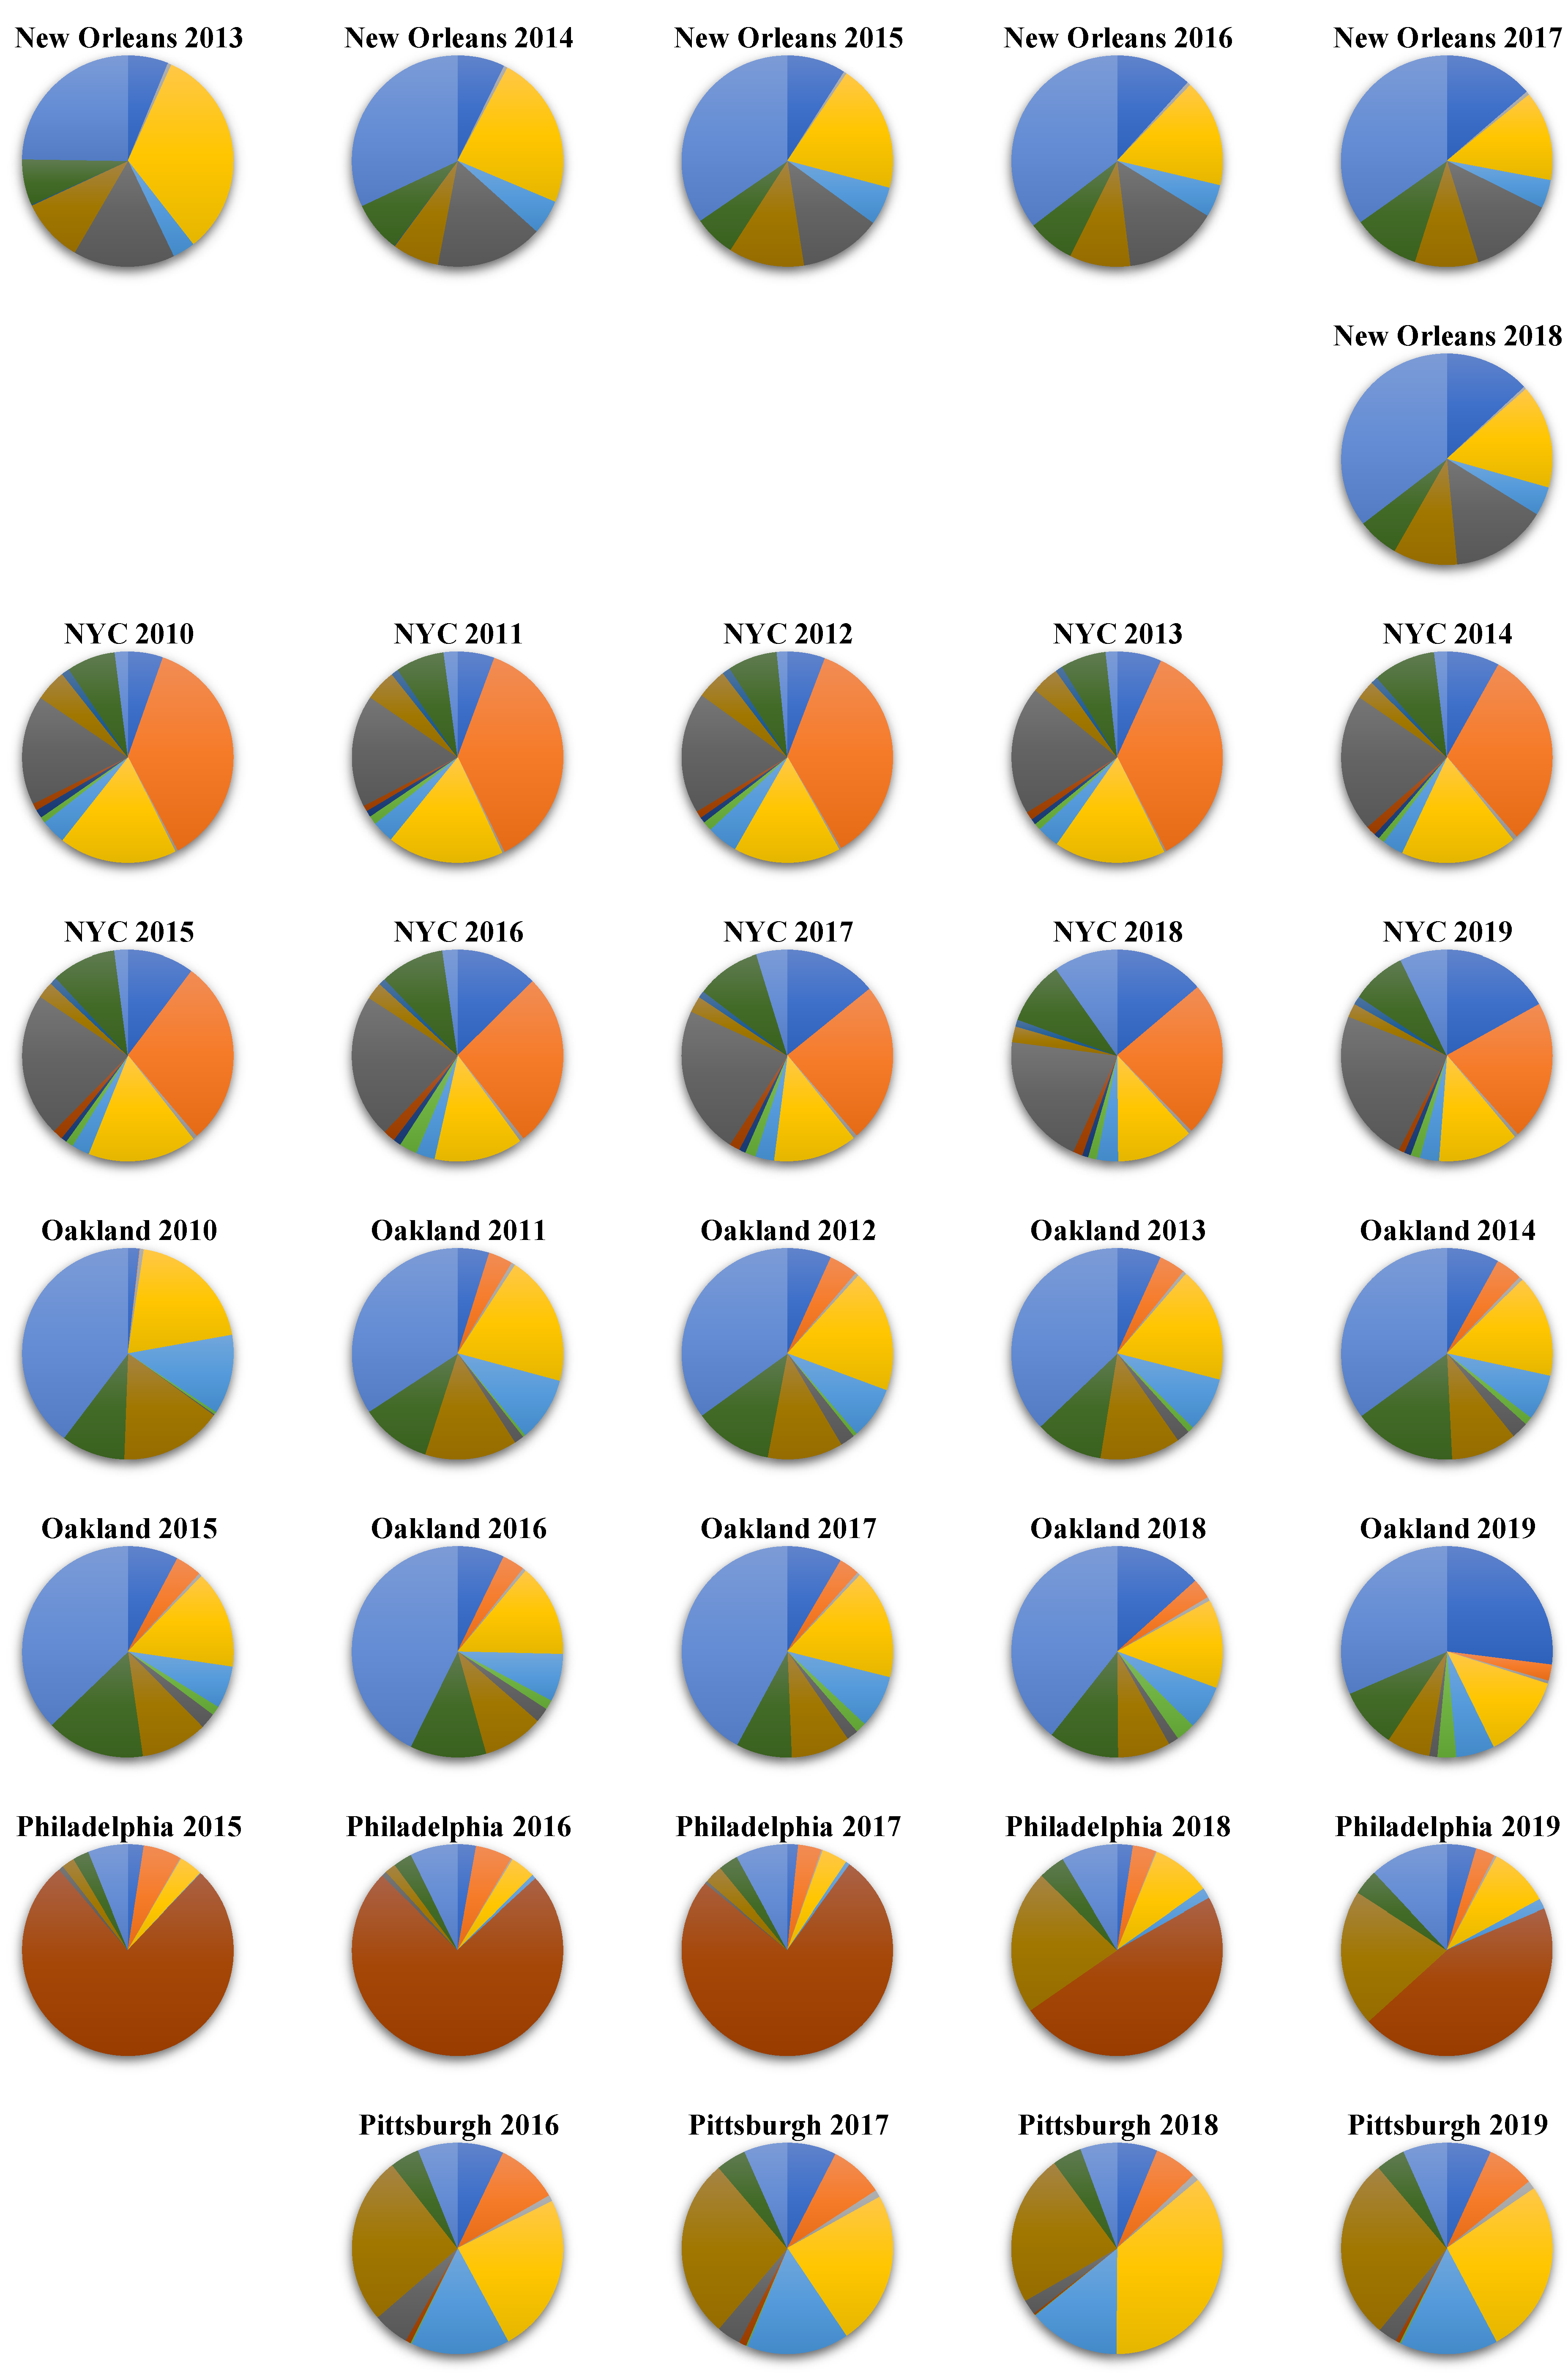
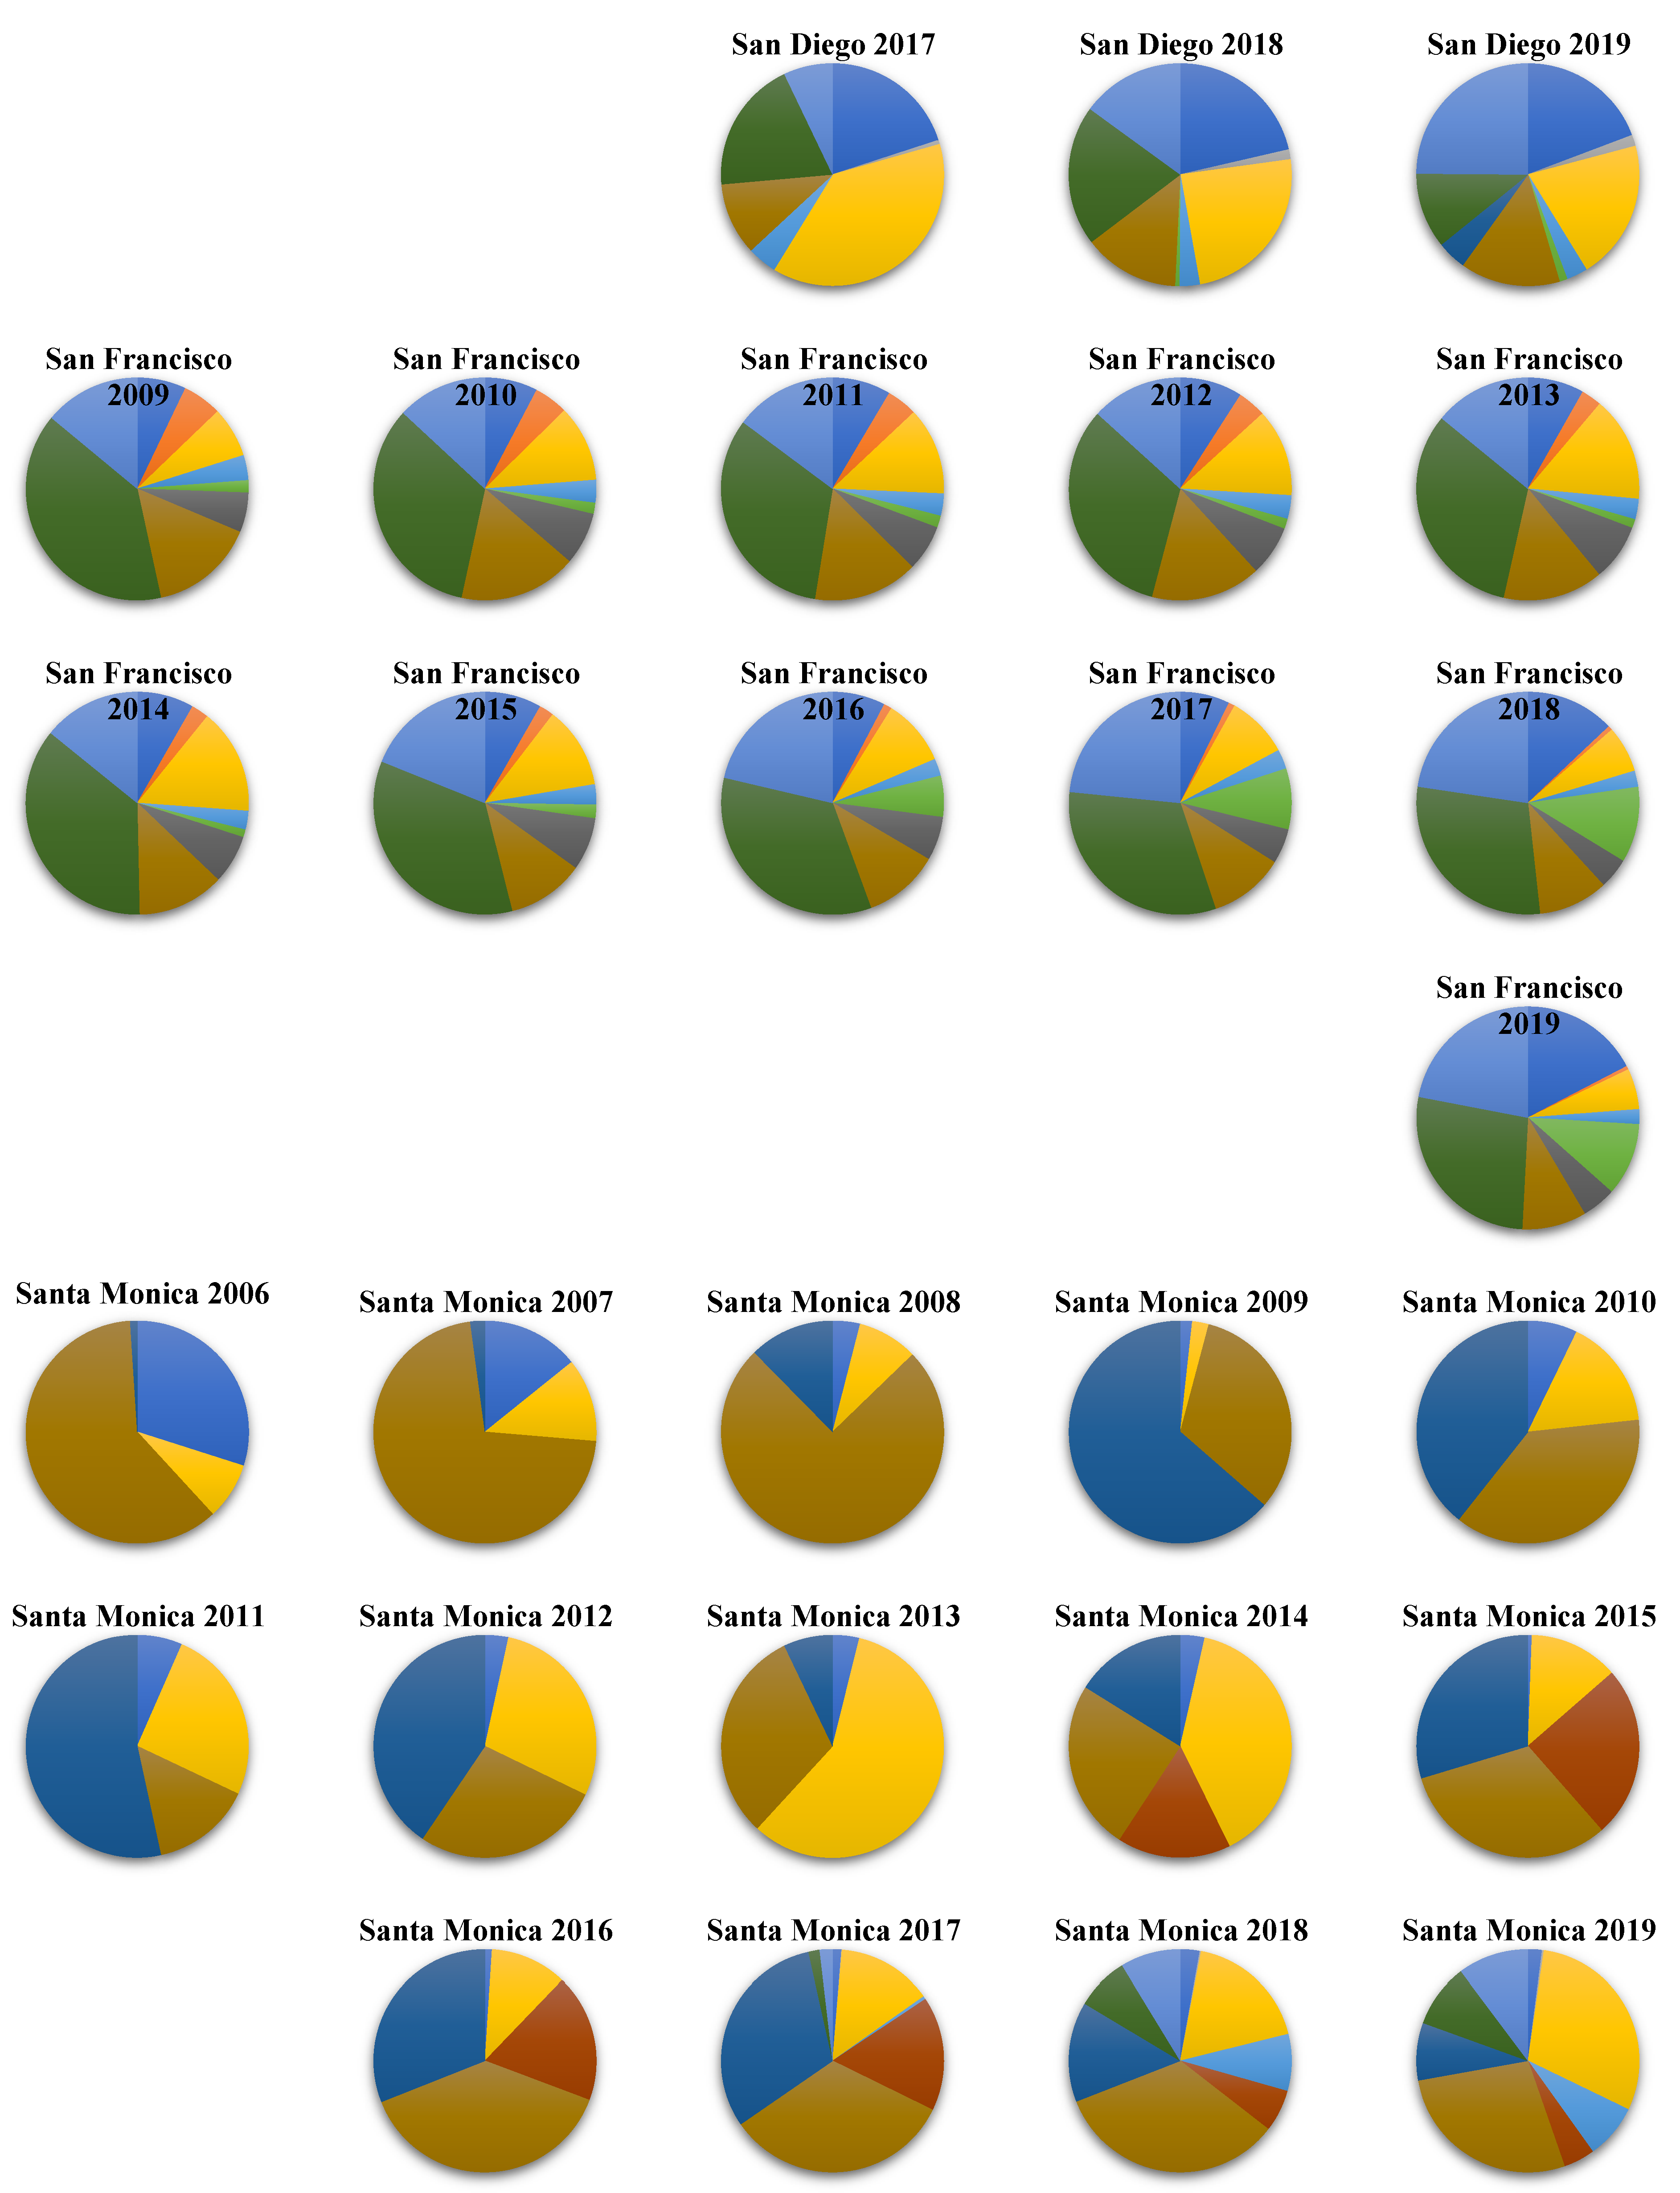
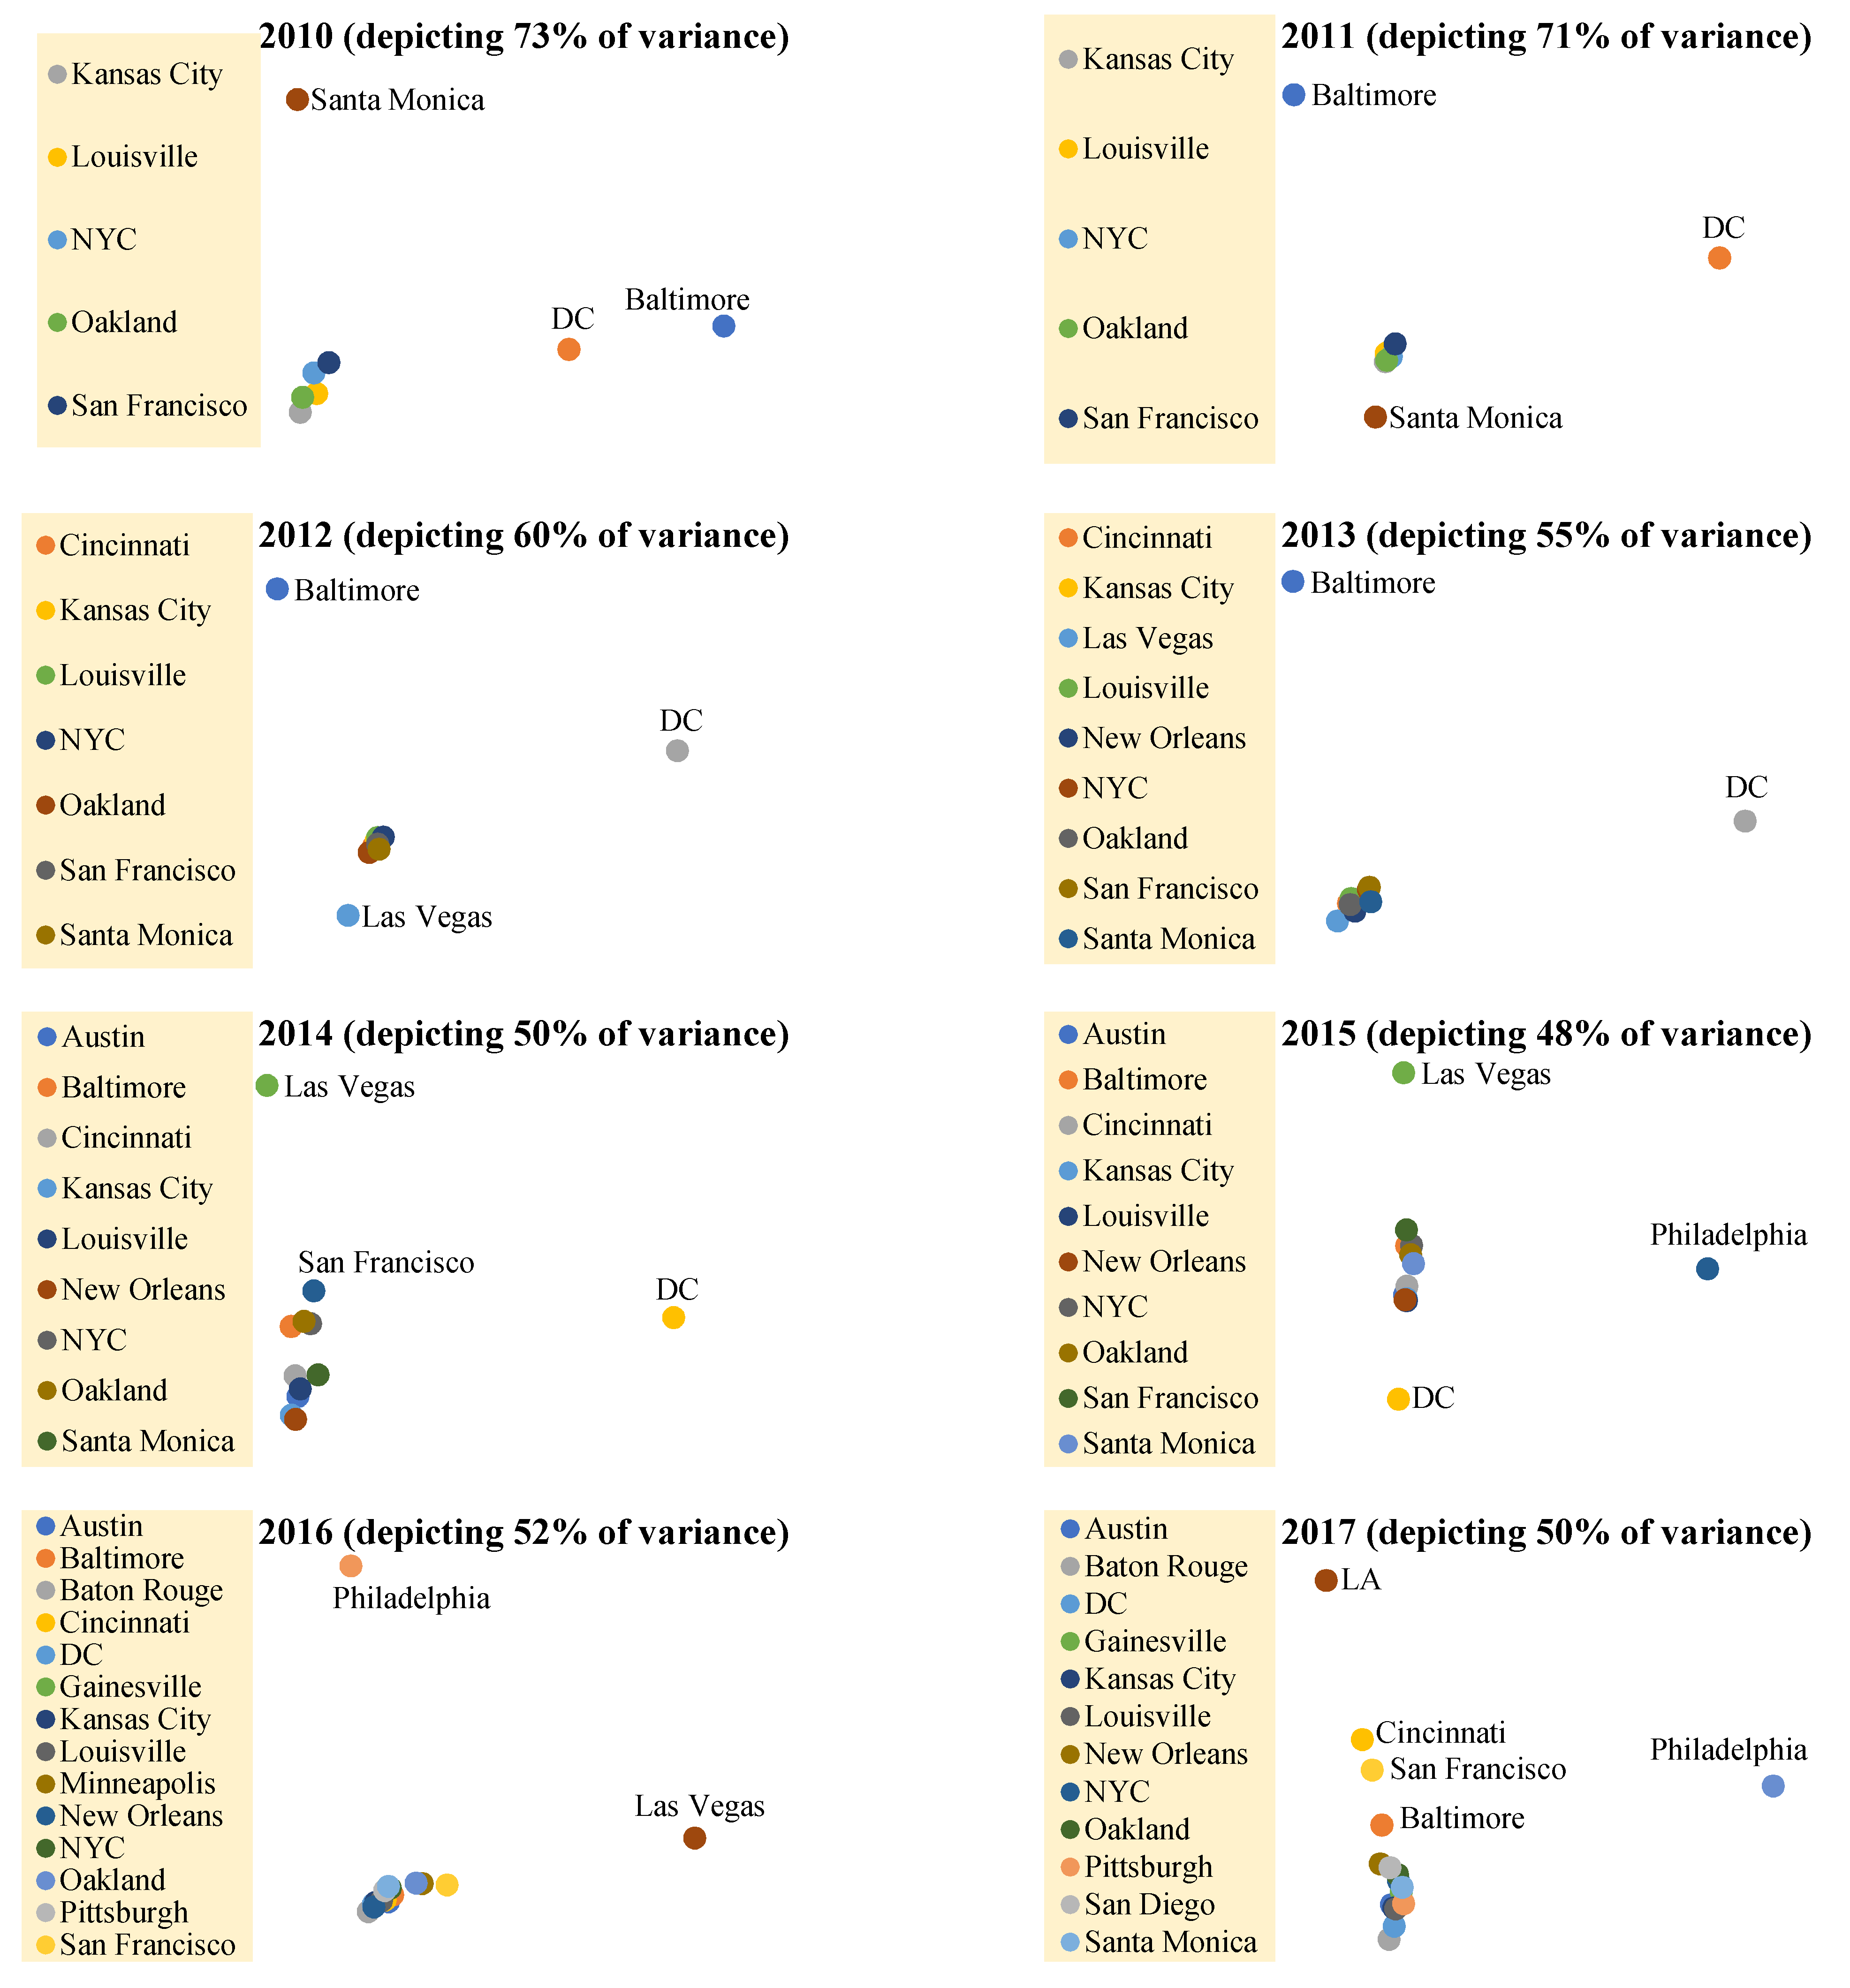
| 2006 | 2007 | 2008 | 2009 | 2010 | 2011 | 2012 | 2013 | 2014 | 2015 | 2016 | 2017 | 2018 | 2019 | |
|---|---|---|---|---|---|---|---|---|---|---|---|---|---|---|
| Santa Monica | 97 | 190 | 251 | 703 | 877 | 728 | 647 | 466 | 814 | 4162 | 4486 | 5641 | 14,681 | 19,830 |
| Kansas City | 83,075 | 137,894 | 119,269 | 110,276 | 96,113 | 90,199 | 90,462 | 89,329 | 96,941 | 103,955 | 109,811 | 124,280 | 166,018 | |
| San Francisco | 172,912 | 185,920 | 194,907 | 205,750 | 258,801 | 307,204 | 345,177 | 450,233 | 510,244 | 599,330 | 660,522 | |||
| NYC | 2,031,815 | 1,961,600 | 1,796,175 | 1,839,975 | 2,114,002 | 2,300,763 | 2,391,428 | 2,491,971 | 2,747,952 | 2,456,827 | ||||
| Baltimore | 772 | 1060 | 1363 | 2033 | 611,908 | 672,096 | 700,337 | 671,087 | 780,424 | 768,429 | ||||
| D.C. | 601 | 56,149 | 197,873 | 145,001 | 145,707 | 102,416 | 65,277 | 76,059 | 98,180 | 103,840 | ||||
| Oakland | 33,647 | 37,995 | 47,294 | 56,888 | 61,826 | 66,889 | 75,932 | 80,740 | 77,851 | 110,928 | ||||
| Louisville | 106,380 | 106,296 | 105,503 | 96,335 | 94,605 | 104,145 | 102,039 | 102,135 | 124,741 | |||||
| Cincinnati | 54,987 | 91,390 | 97,314 | 107,931 | 111,857 | 106,897 | 115,872 | 107,406 | ||||||
| Las Vegas | 18,818 | 3443 | 2281 | 2830 | 6449 | |||||||||
| New Orleans | 41,316 | 41,230 | 42,151 | 47,976 | 50,134 | 52,881 | ||||||||
| Austin | 127,761 | 136,875 | 129,874 | 132,409 | 151,025 | 178,172 | ||||||||
| Philadelphia | 406,650 | 453,055 | 154,402 | 9662 | 1471 | |||||||||
| Baton Rouge | 78,690 | 80,102 | 98,083 | 112,100 | ||||||||||
| Gainesville | 1396 | 2413 | 2288 | 2392 | ||||||||||
| Pittsburgh | 78,047 | 79,852 | 100,459 | 94,955 | ||||||||||
| Minneapolis | 51,764 | |||||||||||||
| San Diego | 144,404 | 182,781 | 309,202 | |||||||||||
| Los Angeles | 1,131,781 | |||||||||||||
| Chicago | 1,826,465 |
| Streets/Sidewalks | Transportation | Maintenance | Garbage and Recycling | Complaint | Information | Public Mobility Services | Parks and Trees | Cleaning and Rodents | Animal | Air and Water Quality | Poverty |
|---|---|---|---|---|---|---|---|---|---|---|---|
| Street/Road Repair | Parking Violation | Construction and Plumbing | Missed Garbage/Recycling Pick-up | Residential/Street Noise | Information Request | Bus Operator/Late/Safety Complaint | Tree Care/Removal/Debris and Tall Grass/Weed | Missing/Damaged Catch Basin/Manhole Cover | Animal Control/Care | Water Quality Complaint | Low-Income Senior Housing |
| Sidewalk/Curb Repair | Parking Permit | Electrical | Garbage/Recycling Collection | Aircraft/Helicopter Noise | Lost and Found | Taxi Complaint | New Tree Request | Cleaning and Sanitation | Dead Animal | Air Quality Complaint | Homeless Encampment |
| Street Light Repair/Add | Parking Ticket Contest | No Heat and Hot Water | Bulky Items | Nuisance Complaint | Online/Phone Payment Problem | Shared Mobility Device Complaint | Park Maintenance | Rat and Rodent | Animal Bite | Asbestos Complaint | Panhandling |
| Street/Road Sign Repair/Replacement/New | Abandoned Vehicle | No Water | Illegal Dumping | Illegal Posting/Signs | Billing Address/Name Incorrect | Park Lighting | Graffiti Removal | ||||
| Traffic/Pedestrian Signal Repair | Driving Violations | Vacant Property | Garbage/Recycling Cart Repair/Replacement/New Service | Property Violations | Benefit Card Replacement | Sewage/Storm Water | |||||
| Street/Sidewalk Sweeping | Street/Road/Sidewalk Obstruction | Water Turn Off Request | Remove Unwanted Garbage/Recycling Cart | Tenant and Landlord Dispute | Business License Application | Mold | |||||
| Snow Removal and Icy Condition | Bus Stop Request | Elevator | Hazardous Waste | Drug Activity | FCCS Refund Request | ||||||
| Parking Meter Repair/Request | Oversized Vehicle Complaint | Smoke Detector Repair/Installation | Abandoned Toters/Cans/Containers | Drinking | |||||||
| Bus Stop Shelter Repair | Derelict Bicycle | Boilers Inspection | Recycling Enforcement | Report Litterer | |||||||
| Speed Bump Request | Fire Hydrant Repair/Request | Smoking | |||||||||
| Vending Machine Repair | Consumer Complaint about a Purchase |
| Feature | Contribution | Feature | Contribution |
|---|---|---|---|
| Parking Meter Repair/Request | 9.88% | Street/Road Sign Repair/Replacement/New | 2.72% |
| Information Request | 9.36% | Tree Care/Removal/Debris and Tall Grass/Weed | 2.71% |
| Sidewalk/Curb Repair | 8.03% | Cleaning and Sanitation | 2.44% |
| Graffiti Removal | 7.48% | Animal Control/Care | 2.38% |
| Missed Garbage/Recycling Pick-up | 6.05% | Street/Road Repair | 2.38% |
| Bus Operator/Late/Safety Complaint | 5.58% | Nuisance Complaint | 2.00% |
| Bulky Items | 5.31% | Illegal Dumping | 1.95% |
| Street Light Repair/Add | 4.19% | Garbage/Recycling Collection | 1.75% |
| Garbage/Recycling Cart Repair/Replacement/New Service | 3.86% | Construction and Plumbing | 1.67% |
| Parking Violation | 3.68% | Sewage/Storm Water | 1.52% |
| Property Violations | 3.66% | Abandoned Vehicle | 1.40% |
Publisher’s Note: MDPI stays neutral with regard to jurisdictional claims in published maps and institutional affiliations. |
© 2021 by the author. Licensee MDPI, Basel, Switzerland. This article is an open access article distributed under the terms and conditions of the Creative Commons Attribution (CC BY) license (https://creativecommons.org/licenses/by/4.0/).
Share and Cite
Hashemi, M. Studying and Clustering Cities Based on Their Non-Emergency Service Requests. Information 2021, 12, 332. https://doi.org/10.3390/info12080332
Hashemi M. Studying and Clustering Cities Based on Their Non-Emergency Service Requests. Information. 2021; 12(8):332. https://doi.org/10.3390/info12080332
Chicago/Turabian StyleHashemi, Mahdi. 2021. "Studying and Clustering Cities Based on Their Non-Emergency Service Requests" Information 12, no. 8: 332. https://doi.org/10.3390/info12080332
APA StyleHashemi, M. (2021). Studying and Clustering Cities Based on Their Non-Emergency Service Requests. Information, 12(8), 332. https://doi.org/10.3390/info12080332


