1. Introduction
Livestock grazing is an activity of profound economic considerations for pastoral communities [
1] and an important ecosystem service provided by public lands [
2]. In addition, by virtue of its impact on individual plant growth, survival, and reproduction (and therefore on plant population dynamics and community succession [
3,
4]), grazing has also long been valued as an effective means of modifying habitats [
5]. By extension, grazing can influence the abundance, spatial ecology, and the behavior of wildlife [
6,
7,
8]. The impact of livestock grazing on natural ecosystems depends on the grazing regime. Light to moderate grazing can be beneficial for wild herbivores that predominate in early successional forest habitats, such as lagomorphs [
7] and geese [
6], but could have an adverse effect on woodland and riparian species by limiting—for instance—available understory vegetation needed by ground foraging birds [
9,
10]. Beyond mammals and birds, the effects of grazing, beneficial or not, have been documented for a broad taxonomic range of animals, including reptiles [
11,
12], amphibians [
13], and invertebrates [
14,
15].
Considering the potential ramifications of livestock grazing on natural ecosystems, a holistic approach to grazing management requires the estimation of several parameters such as the grazing intensity, stocking rates, grazing and carrying capacity, the grazing system, and others [
16,
17]. Under this requirement, the evaluation of the diel, seasonal periodicity frequency, the duration and timing of grazing, and the length of resting periods at a site are of prime importance in order to successfully integrate the provision of livestock forage with ecosystem sustainability and the provision of goods [
18,
19,
20].
Collecting such fine spatial and temporal resolution information on the grazing patterns of livestock—especially in remote areas and at a landscape level—can be labor intensive and logistically demanding, as it would require frequent field observations. Alternatives, such as recently developed livestock tracking technologies (e.g., GPS-enabled ear-tags), are still prohibitively expensive for small scale farmers. They are also less suitable for areas where multiple herds utilize the same rangeland, as all would need to be tagged to deduce the overall grazing activity. Questionnaire surveys or interviews of farmers are widely used to collect information on grazing patterns, however, there can be concerns regarding the reliability and accuracy of the data collected.
In recent years, the use of passive acoustic monitoring (PAM) methods, where unattended acoustic sensors (often also referred to as autonomous recording units-ARUs) are deployed to record the soundscape for extended periods of time, has gained global recognition as a reliable, low-cost, non-invasive tool for monitoring anthropogenic activities in natural landscapes [
21,
22]. A requirement for the use of PAM is that the activity of interest needs to produce a tell-tale detectable sound signal (e.g., a gunshot during hunting or a chainsaw engine revving during logging). Moreover, while manual browsing of the acoustic data for the detection of sounds is possible, even a moderate sized grid of a dozen acoustic sensors would generate over 100,000 h in a year, making this approach impractical [
21]. Therefore, if PAM is to be used at a landscape scale, it is imperative that detection algorithms are developed to scan the data for the putative sounds of interest. These algorithms are typically semi-automated. Putative events flagged by the algorithms are reviewed by a human user who separates true and false positive detections. Such algorithms have been developed to detect sounds emitted by wildlife species [
23,
24,
25] as well as by certain human activities, such as gunshots, vehicles, and chainsaws [
21,
26,
27].
To the best of our knowledge, up to now, no study has used PAM techniques for estimating livestock grazing activity. The aim of this paper is to present findings on this novel application of PAM for estimating diel and seasonal periodicity, and the duration of grazing by small ruminants (sheep/goats) and cattle, monitored for an entire summer grazing season at the remote natural meadows of the Rhodope Mountain Range, in northern Greece. In addition, we describe, evaluate, and make publicly available detection algorithms for the sounds of these livestock species (i.e., cow lowing/“mooing”, sheep/goat bleating, livestock bells). Finally, we identify priority areas for related future research and suggest additional uses of PAM by rangeland and protected area managers tasked with the design of management strategies for grazing.
2. Materials and Methods
The study was conducted within the Rhodope mountain range in northern Greece, one of the most biodiverse forest regions of the country, and a natural border with Bulgaria to the north. Designated as a national park in 2009 (1.731 km2), the region incorporates seven Natura 2000 network sites and Greece’s most productive timber forests. Historically, livestock grazing was extensive in the region, under a traditionally transhumant pastoralism practice that used the higher elevation meadows from May to October. However, grazing has decreased significantly over the last decades and the area has been largely depopulated. Monitoring of the remaining herds is challenging as they are in remote areas far from the headquarters of the Forest Service and the Protected Area Management Authority.
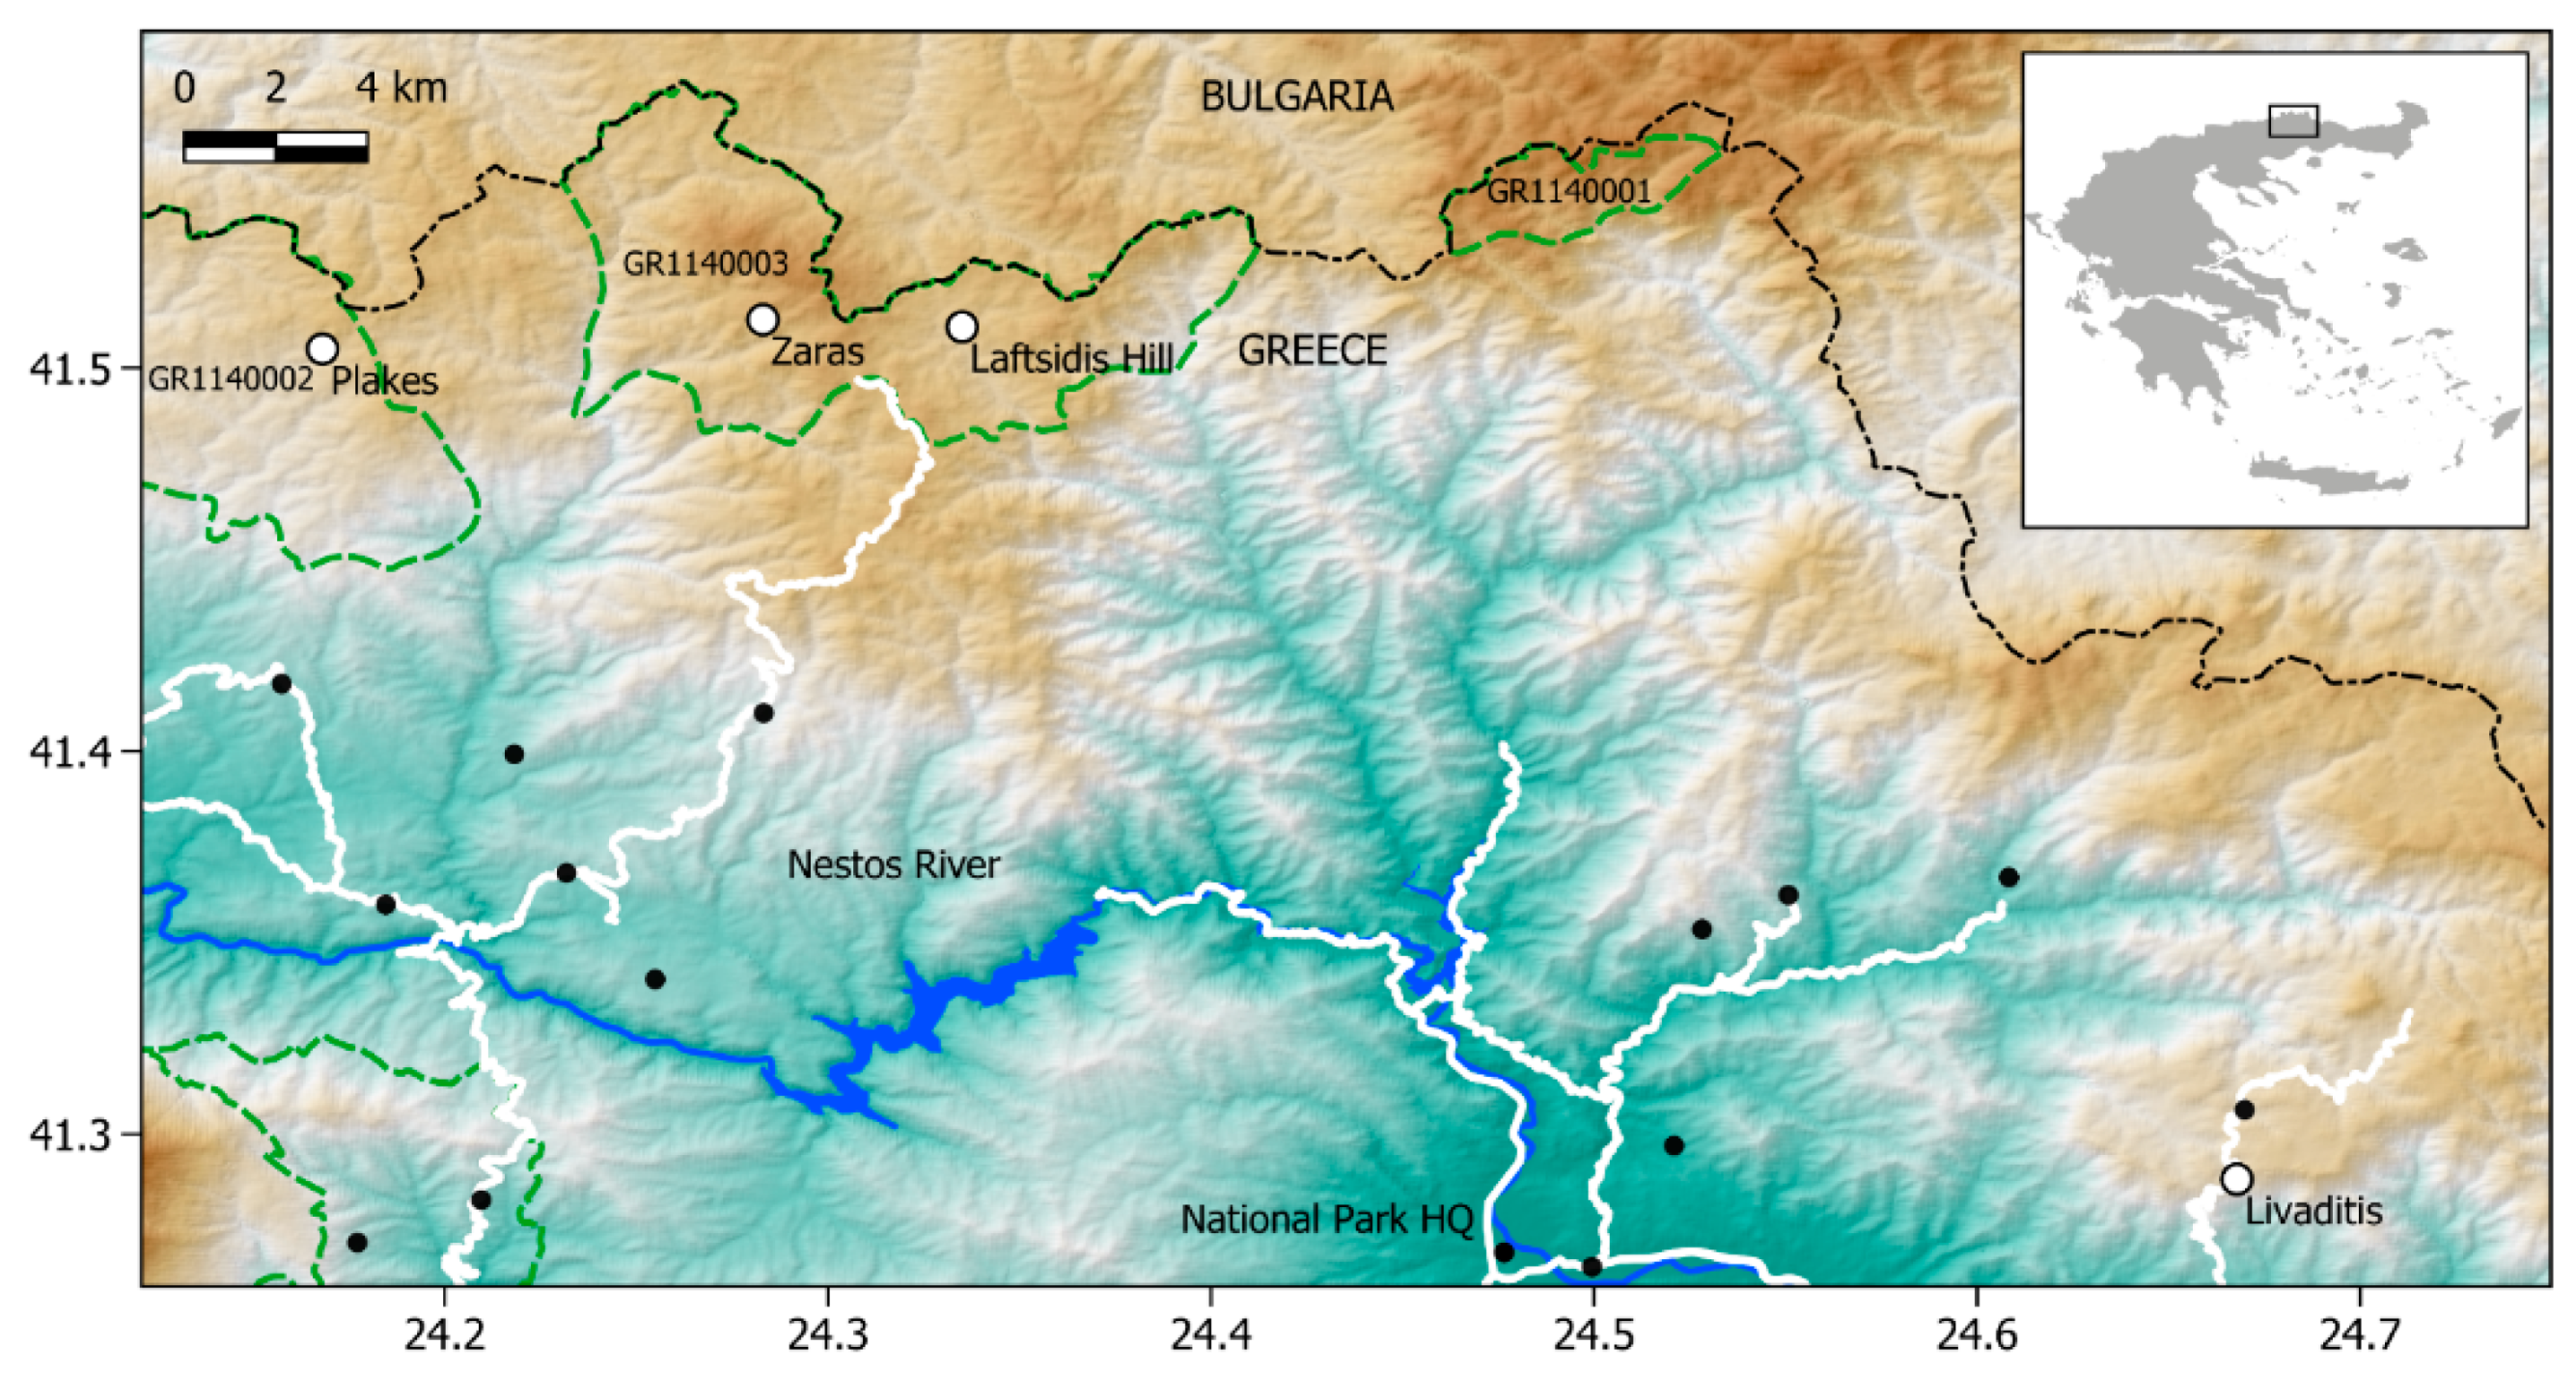
As part of a larger passive acoustic monitoring study within the Rhodope landscape, we placed a SWIFT (Cornell University) acoustic sensor at each of four sites selected to represent a range of grazing activities (
Figure 1). The sites were selected following field visits and discussions with locals. During the four-month study period (July–October 2019), we also conducted surveys for livestock grazing signs (e.g., tracks, dung) on three occasions (i.e., the sensors’ deployment, battery and card replacement, and removal).
The site “Livaditis” (elevation: 1.220 m; 24.67° E 41.29° N) is a natural meadow with sparse juniper (Juniperus Spp.) bushes. According to our information, two mixed herds of 200 sheep and goats in total and one herd of about 25 cattle use the meadow during the summer grazing season. A man-made, spring-fed watering point for livestock is located 200 m from the acoustic sensor. The sites “Zaras” (elevation: 1.570 m; 24.28° E 41.51° N) and “Laftsidis Hill” (elevation: 1.410 m; 24.34° E 41.51° N) are near small forest clearings (Abies Spp., Picea abies) within the Natura 2000 network site GR1140003 (Periochi Elatia, Pyramis Koutra). A cattle herd of about 100 animals grazes at “Zaras”, whereas it is unclear if a herd is still brought for part of the summer grazing period to “Laftsidis Hill”—an area historically used by cattle. The site “Plakes” (elevation: 1.340 m; 24.17° E 41.51° N) is near a similar forest clearing within the Natura 2000 network site GR1140002 (Rodopi-Simyda). A herd of about 30 cattle periodically graze the area.
The acoustic sensors were placed at chest height (~1.4 m) on the trunks or branches of trees, taking into account the surrounding vegetation and terrain so as to reduce background noise (e.g., from wind exposure or water flow at streams) and detection by humans. The SWIFT acoustic sensors were scheduled to record continuously (24 h/day) at a sampling rate of 8 KHz and gain of 33 dB. The microphone is omni-directional and has a signal to noise ratio of >58 dB (PUI Audio/Part Number: POW-1644L-B-LW100-R). Twelve alkaline batteries successfully powered the sensors for 91 days until the 128 Gb SD cards were full (1.32 GB .wav files generated per sensor/day), at which time the cards and batteries were replaced. The data used for this study were for the months of July to October 2019. As a tool for the automatic detection of putative audio events we used Kaleidoscope Pro v.5.1.9 software (Wildlife Acoustics). Kaleidoscope extracts features by transforming the acoustic signal in the time-frequency domain and then relies on a combination of the k-means algorithm with hidden Markov models (HMM) in order to group multiple similar audio events detected in a long audio recording into multiple clusters. The result of unsupervised clustering is then combined with manual verification in order to construct classifiers that may detect the specific acoustic patterns of interest. Following this typical procedure, we used Kaleidoscope by first feeding it with a subset of our audio data [
28], ensuring that all patterns of interest were present in them. The proportion of positive to negative samples in the training data set was 1:0.5 (n = 264) for livestock bells, 1:4 (n = 240) for sheep/goat bleats, and 1:4.2 (n = 264) for cow lowing. In a second step, the phrases detected and clustered by the software were manually reviewed by listening and by visually inspecting spectrograms. Among several clusters, there were clusters populated with sheep/goat bleating, cow lowing, and livestock bell events. Using the result of cluster analysis and the parameter settings of
Table 1, we developed three detection algorithms (advanced classifiers) for each pattern of interest: sheep/goat bleating; cow lowing; and livestock bells [
29].
Based on the preliminary analysis of a subset of data during the detection algorithms’ development stage, we opted for a moderately high threshold of 0.5 for all three algorithms (range: 0.0–2.0; maximum distance from cluster center for an event to be included in the output file of putative detections). While lower thresholds (i.e., <0.5) are more suitable for rare events, as they result in more true positive detections, they also generate significantly more false positive detections. This makes them impractical as a tool in “noisy” soundscapes, due to the additional time-commitment required for review by the human listener. Thus, the higher threshold used in this study offers a good balance between usefulness and practicality, since the duration of monitored activity (grazing) is long (i.e., a herd will stay minutes or hours in a field) and therefore many signals are generated over time and are consequently available for detection.
Once the algorithms were developed, we used them to scan all of our data. The putative events flagged by the algorithms were reviewed acoustically and visually (spectrogram) by a single human listener (IV) and either confirmed as true positives or rejected as false positives. As a final dataset, we had information on the site, date, time, and the type of each call.
We evaluated the three detection algorithms by calculating their recall rate (“sensitivity”), precision and F-Score (with β = 1) as per Knight et al. [
30]. To achieve this, we manually identified all true events (sheep/goats: 1.031; cows: 1.024; bells: 302) in 72 h (1 day from each of the three sensors, with the exception of the sheep/goats for which all 72 h were from one sensor—the only one where they were detected).
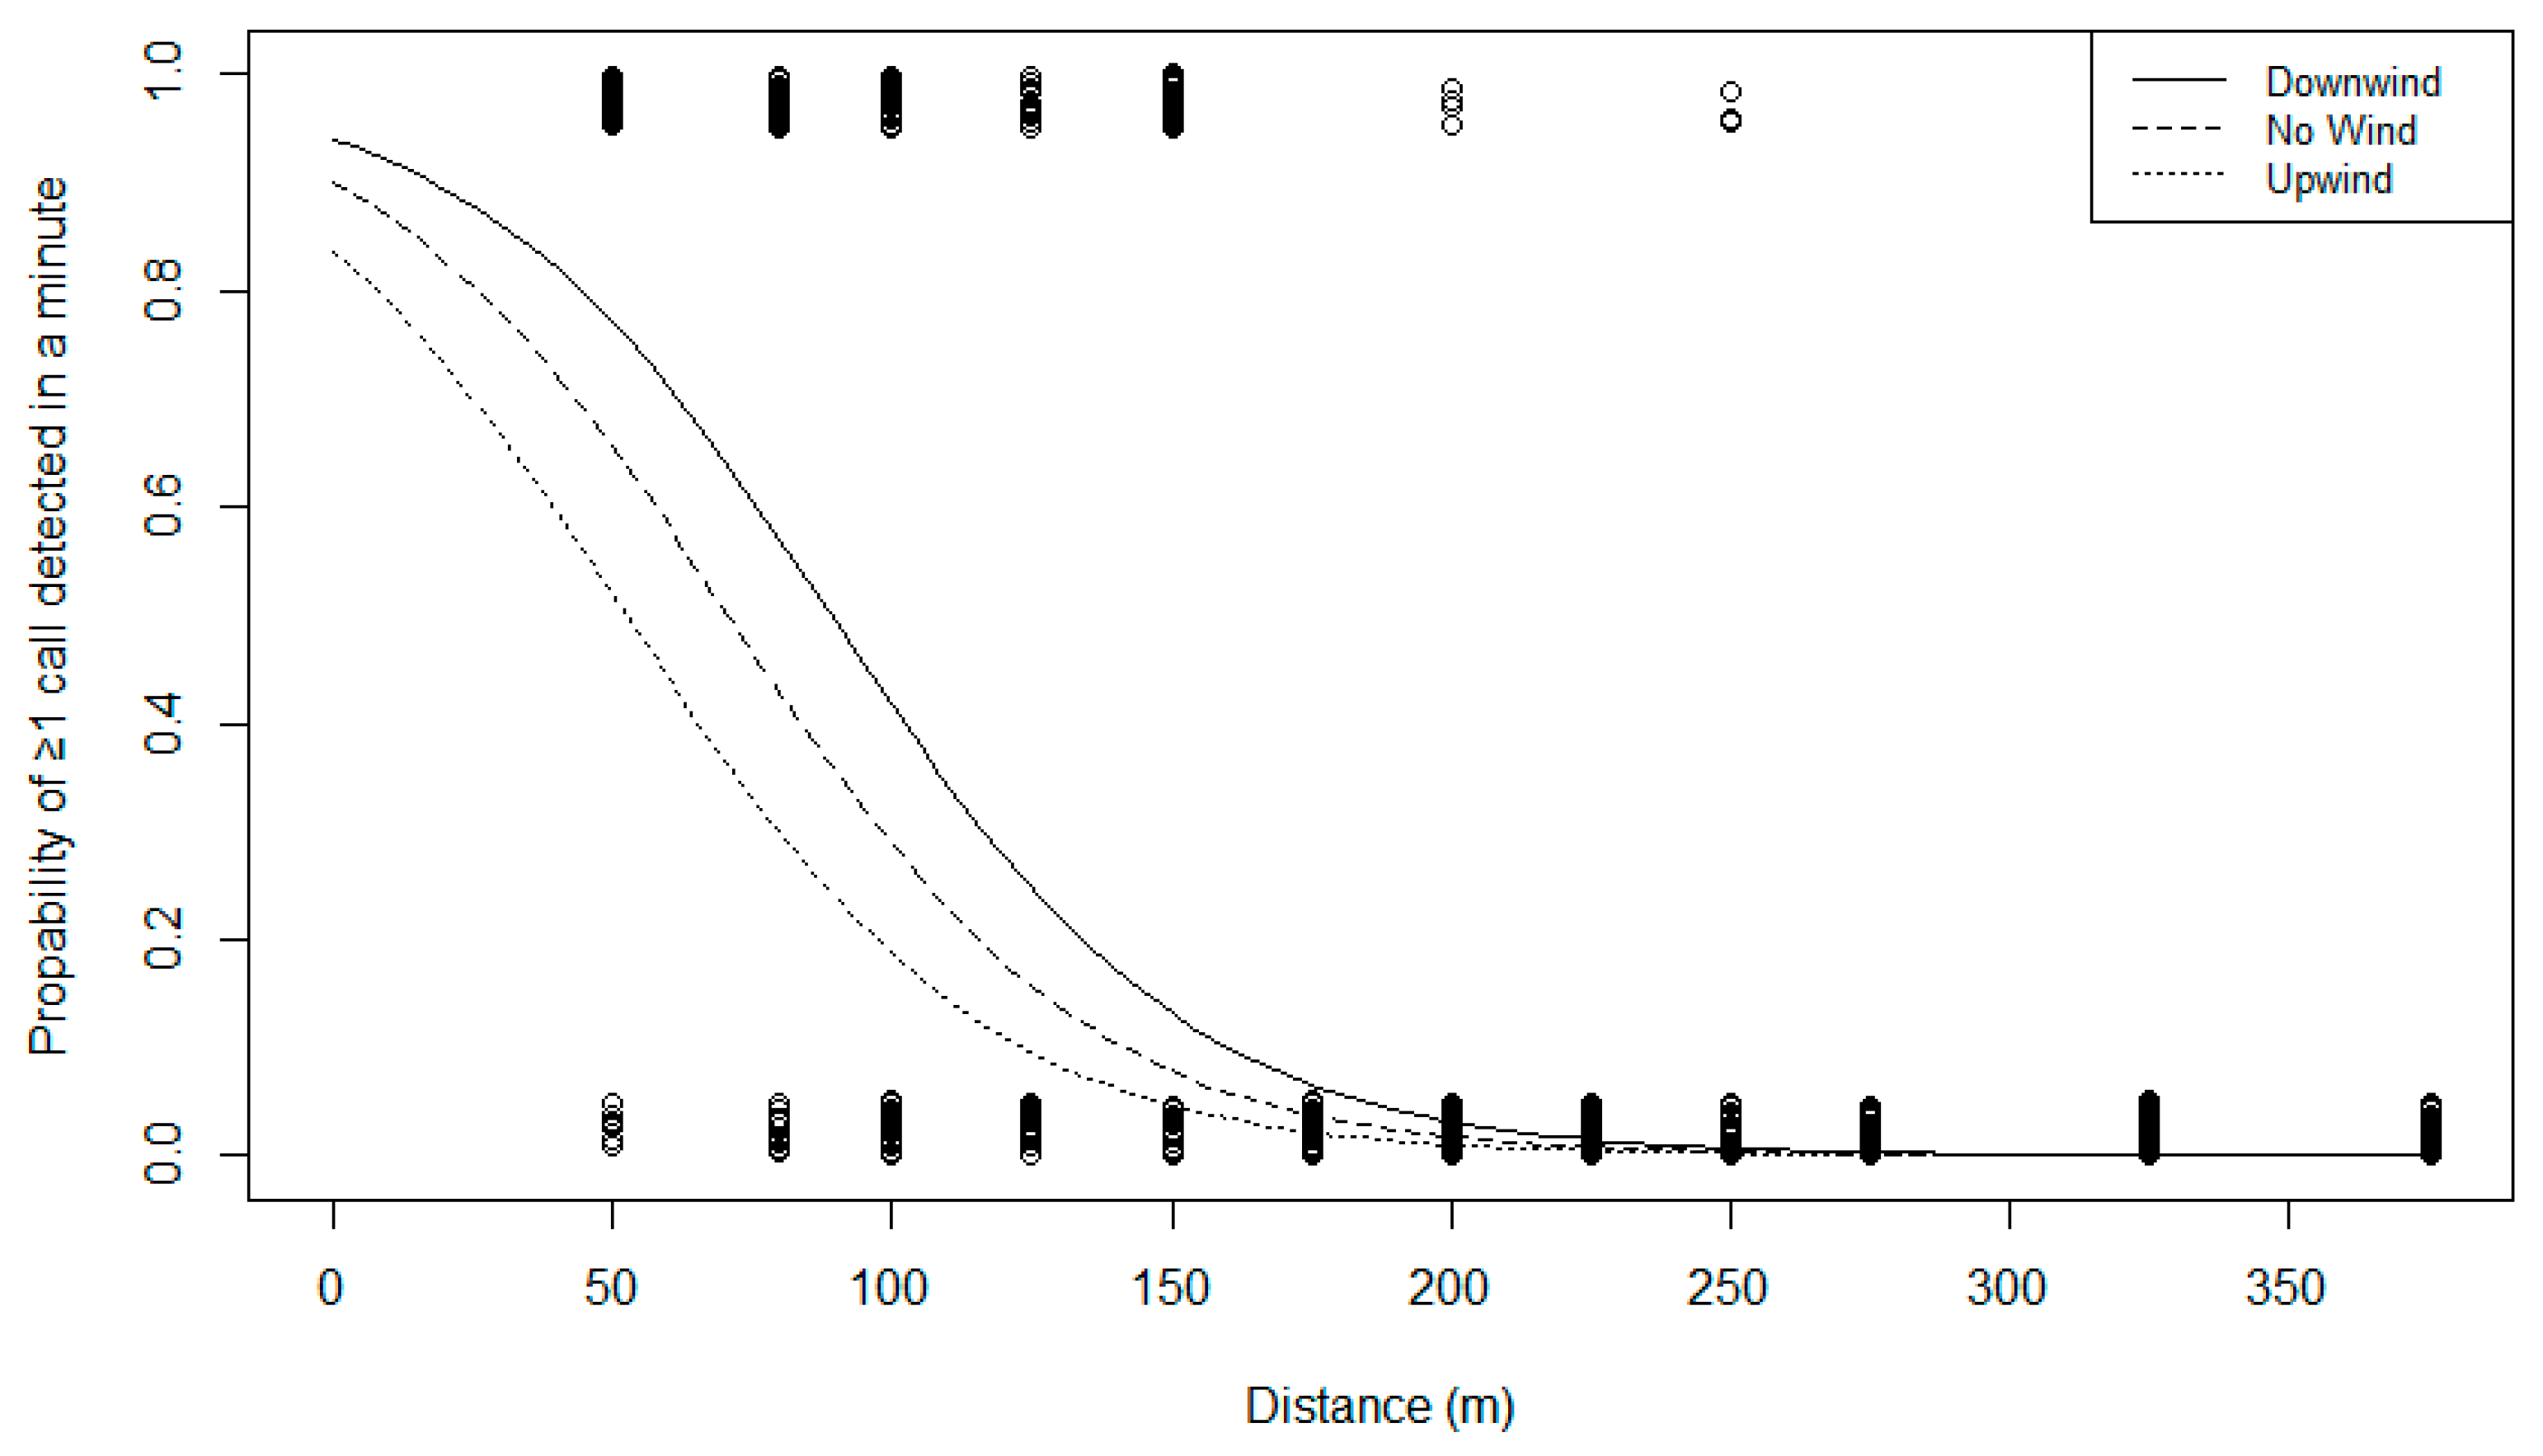
Finally, we estimated the effective detection range of the cow and sheep/goat calls using the detection algorithms by placing the same type of acoustic sensors (and with the same recording settings) at incremental distances from a cattle and a sheep livestock pen. At the sheep pen, we placed 13 acoustic sensors “upwind” and “downwind” at distances from 0 m to 375 m. The sensor at 0 m was located at the “downwind” side of the pen (20 × 20 m), as this is where the ~75 animal herd was positioned during the data collection—feeding at the troughs. As we could not identify the individual animals that vocalized, for the purposes of the analysis we treated all calls as originating at 0 m, even though some could be from animals as much as 10–15 m “upwind” from the 0 m sensor. The five “downwind” sensors were placed at 50 m intervals, starting at 50 m. The six “upwind” sensors were also placed at 50 m intervals, starting at 75 m for safety reasons related to the operation of the farm. We recorded ambient background noise using a decibel meter (PeakTech 8005) and wind speed using an anemometer (ClimeMet CM2030). Since the wind remained constant both in speed (2 m/s) and direction, we considered the wind as a binomial variable with 0 denoting a sensor being “downwind” (leeward from the calling sheep), and 1 “upwind” (windward). At the cattle pen, we placed five acoustic sensors from 0 m to 200 m, recording the background noise. Since there was no wind on the day, all sensors were placed along one line.
We analyzed the data using logistic regression models in R [
31], considering the distance to the call source (pen), wind (upwind/downwind), and background noise as predictors of the probability of detecting an individual call. In addition, we estimated the probability of detecting at least one call in a given minute with one or more calls, considering the same parameters (i.e., distance, wind, background noise) plus the number of calls in any given minute.
4. Discussion
Livestock grazing is an important ecosystem service provided by public lands to pastoral communities, and therefore it needs to be carefully managed in order to sustain it. Monitoring is key to all natural resource management strategies. Traditional grazing monitoring methods are labor intensive, and even more so in remote areas where logistical challenges are more pronounced. Our study demonstrates, for the first time, the potential of passive acoustic monitoring (PAM) as a tool for monitoring diel and seasonal periodicity and the duration of grazing in an area. However, for any tool to be adopted widely by front-line personnel, in addition to being useful, it needs to be affordable, reliable, and user friendly. Critically, it needs to be better than the alternatives at hand. We believe that PAM meets the above criteria.
In terms of cost, each sensor requires ~€8/month worth of batteries for 24 h recordings. The initial equipment acquisition cost in our case was ~€450/sensor (incl. import tax and 2 SD cards). Alternative sensors exist in the market (e.g., by Wildlife Acoustics, Frontiers Lab, AudioMoth), both more and less expensive, but as far as we know none can record continuously for 90 days. A long deployment capability is important, as it reduces the number of field trips needed to maintain an acoustic grid. With just five trips (or only three if recordings are limited to the daytime), one can collect year-round data. The cost of obtaining similar temporal resolution data with field visits even in easily accessible sites is orders of magnitude more expensive in personnel time and transportation. For remote sites, it is just not possible.
In terms of reliability, PAM offers low levels of data collection biases as it eliminates observer variation, observer fatigue, and temporal sampling—the latter by monitoring entire seasons. Analysis biases can be very low as well, especially if a single analyst reviews all algorithm outputs. Achieving similar levels of data replicability would require very well trained (and periodically re-trained) personnel if data were to be collected in-person. Even if detection algorithms are modified in the future (for instance, by improving their efficiency by reducing false positives and/or increasing their recall rate by reducing false negatives), comparability across sites can be ensured by reanalyzing legacy datasets with the new tools at hand—something that is rarely possible for data collected by field personnel.
In terms of user friendliness, training field personnel to operate, deploy and maintain most of the acoustic sensors available in the market is just a matter of a few hours. This is in contrast to the significant training required to use the passive infrared (PIR) triggered photographic sensors (camera traps) widely used for recording wildlife and human activities. Camera trap users must learn by trial and error how to balance the need for direct line of sight with the target’s anticipated line of movement, PIR sensitivity and wake-up time, and sensor concealment to reduce risk of vandalism or theft. Acoustic sensors are simply attached to a tree, with the users paying attention to minimize exposure to the wind or constant background noise (e.g., a nearby stream). As non-directional microphones are used and sounds are recorded through vegetation over distance, acoustic sensors can be easily hidden a few meters off trails, increasing their survivability. Setting the recording schedule of the sensors requires basic computer navigation skills for some sensors, while some can even be programmed via smartphone using Bluetooth or onboard menus. Data organization is not different than with camera traps, where data from the SD cards need to be backed up and catalogued by site.
Data analysis, on the other hand, does require some advanced computer skills, including learning how to use an acoustic data review program such as Raven Pro (Cornell University) or Kaleidoscope Pro (Wildlife Acoustics). The latter is required for using the algorithms of this study. From our experience, computer literate personnel with attention to detail can be trained in 1–2 days.
PAM is not without its limitations, however. As we have demonstrated with our study, the patterns of livestock presence in an area can be readily deduced with high spatiotemporal precision using PAM. However, a holistic approach to grazing management requires the estimation of other parameters, such as current stocking numbers, which cannot—at least currently—be obtained acoustically.
Moreover, efficient acoustic data analysis requires the use of detection algorithms. If such algorithms are not available for the livestock of interest, they will need to be developed. This is a process that requires advanced planning, possibly interdisciplinary collaborations with acoustic engineers, and human and financial resources that need to be anticipated and budgeted for. Even if algorithms are available, as for example the ones that we developed during this study, it is prudent that their performance at a new site be assessed prior to broader use.
We believe that future PAM-grazing projects should focus on developing detection algorithms for more livestock types (e.g., water buffalo, pigs, horses, camels), and on improving existing algorithms to increase the efficiency of analysis and the sensitivity of detection (e.g., locating fainter calls over a wider range). Having said that, the current, imperfect, recall rates of our algorithms are not a reliability concern for monitoring an activity like grazing, where hundreds of signals (calls, bells) are often produced per hour. Certainly, the detection probability is imperfect. It is possible that a herd without livestock bells may pass by a sensor without a single animal vocalization. However, that possibility decreases the longer the herd stays in the area (i.e., grazing rather than passing through) and the larger the herd is. So, while not perfect, PAM can reliably detect herds that graze in an area for a substantial amount of time (minutes to hours) whether or not the herd is fitted with livestock bells.
Finally, while we are currently unable to reliably estimate herd size acoustically, it is possible that the number of calls per hour is consistently correlated with the livestock present, across seasons. We suggest that future studies explore this relationship so that detected herds can at the very least be categorized in size clusters (e.g., small, medium, large) with some level of confidence. However, considering the large variation in the proportion of animals fitted with bells in our study area, which is indicative of the variation across Greece, we advise against using livestock bell rings as an indicator of herd size.
5. Conclusions
The estimation of the optimal solution for a problem (like the determination of grazing duration, timing, rest periods, etc.) among different and, in many cases, multi-parametric solutions is a task which can be difficult and complex. Nevertheless, such problems are common when there is a need for the application of forest policy. Thus, there is a constant need for modern innovative tools which can help policy makers in the decision-making process. We are confident that acoustic sensors can play that role, and that it will be quickly adopted widely as a tool for grazing surveys, following a broader recent trend to use PAM for anthropogenic activities in natural environments. Bundling acoustics with other monitoring technologies will further increase PAM’s versatility. For instance, the on-board acoustic signal detection of livestock could be used to wirelessly trigger a wide-angle camera to photograph a herd to estimate its size, or a water trough to be filled on an as needed-basis, reducing the waste of valuable natural and human resources.
Additionally, there is an ongoing need for data on grazing lands in order to establish and apply several European policies (Nitrates Directive, European Union climate policies, Common Agricultural Policy, Biodiversity Policies, and the Renewable Energy Directive). The data required include the area and yield of grazing lands, biodiversity value, area grazed, non-herbaceous grazing lands, livestock density, etc., that are linked to grazing duration, timing, and resting periods. PAM can help gather some of the aforementioned data or validate the impact of grazing on ecosystem components and services.
Furthermore, under the framework of the new European Union’s Common Agricultural Policy (CAP), which dictates that all member states must improve biodiversity protection and move towards a more efficient and sustainable usage of natural resources, PAM can help managing authorities combat illegal grazing. By helping identify hotspots of illegal grazing activity, PAM can assist managers in directing patrols to where they are likely to have more impact. This is especially needed in remote areas where random patrolling could be very inefficient. In the future, managers could use PAM to examine possible correlations among grazing and other anthropogenic activities in an area, such as poisoning incidents, poaching, and illegal logging—the latter two also detectable using acoustic grids. The PAM findings can also be used to assess the reliability of farmer interview/questionnaire responses regarding the timing and duration of the grazing season, for instance, or whether a certain area is grazed or not. This is especially important at the landscape level, where ground truthing could be a very onerous task.
Regardless, we do not advocate a fully automated sensor-based grazing monitoring strategy. Boots on the ground are needed, particularly for maintaining communication with farmers. PAM has the capacity to serve as a force multiplier, freeing personnel from routine monitoring tasks, so as to focus on community-interaction activities or to enforce grazing regulations.
Author Contributions
Conceptualization, I.K. and C.A.; Data curation, I.V., A.G. and T.K.; Formal analysis, C.A., K.I., I.V. and A.D.C.; Funding acquisition, C.A., A.G. and T.K.; Investigation, I.K., C.A., K.I., N.S., and D.Y.; Methodology, I.K., C.A., I.V., N.S., A.D.C., A.G. and T.K.; Project administration, I.K., C.A., A.G. and T.K.; Resources, C.A., A.G., T.K. and D.Y.; Software, C.A., K.I., I.V. and N.S.; Supervision, I.K. and C.A.; Validation, I.K., C.A. and N.S.; Visualization, I.K. and C.A.; Writing—original draft, I.K., C.A., and K.I.; Writing—review and editing, I.K., C.A., K.I., I.V., N.S., A.D.C., A.G., T.K. and D.Y. All authors have read and agreed to the published version of the manuscript.
Funding
This research was conducted within the framework of the Single RTDI State Aid Action “Research—Create—Innovate” (grant T1EΔK-04488) and was co-funded by the European Union’s European Regional Development Fund (ERDF) and national funds of the Hellenic Republic (Greece) via the Operational Programme Competitiveness, Entrepreneurship and Innovation 2014–2020 (EPAnEK).
Institutional Review Board Statement
Not applicable.
Informed Consent Statement
Not applicable.
Data Availability Statement
The acoustic data used to develop the three detection algorithms presented and assessed in this study are openly available in FigShare at doi:10.6084/m9.figshare.14905539.v1. The livestock detection algorithms (.kcs files compatible with Wildlife Acoustics Kaleidoscope Pro software) are openly available in FigShare at doi:10.6084/m9.figshare.14662284.v1.
Conflicts of Interest
The authors declare no conflict of interest. The funders had no role in the design of the study; in the collection, analyses, or interpretation of data; in the writing of the manuscript, or in the decision to publish the results.
References
- Kariuki, R.W.; Western, D.; Willcock, S.; Marchant, R. Assessing Interactions between Agriculture, Livestock Grazing and Wildlife Conservation Land Uses: A Historical Example from East Africa. Land 2021, 10, 46. [Google Scholar] [CrossRef]
- Balzan, M.V.; Sadula, R.; Scalvenzi, L. Assessing Ecosystem Services Supplied by Agroecosystems in Mediterranean Europe: A Literature Review. Land 2020, 9, 245. [Google Scholar] [CrossRef]
- van der Meijden, E.; Wijn, M.; Verkaar, H.J. Defence and Regrowth, Alternative Plant Strategies in the Struggle against Herbivores. Oikos 1988, 51, 355–363. [Google Scholar] [CrossRef]
- Davidson, D.W. The Effects of Herbivory and Granivory on Terrestrial Plant Succession. Oikos 1993, 68, 23–35. [Google Scholar] [CrossRef]
- Vickery, J.; Gill, J. Managing grassland for wild geese in Britain: A review. Biol. Conserv. 1999, 89, 93–106. [Google Scholar] [CrossRef]
- Bos, D.; Loonen, M.J.J.E.; Stock, M.; Hofeditz, F.; van der Graaf, A.J.; Bakker, J.P. Utilisation of Wadden Sea salt marshes by geese in relation to livestock grazing. J. Nat. Conserv. 2005, 13, 1–15. [Google Scholar] [CrossRef] [Green Version]
- Karmiris, I.E.; Nastis, A.S. Intensity of livestock grazing in relation to habitat use by brown hares (Lepus europaeus). J. Zool. 2007, 271, 193–197. [Google Scholar] [CrossRef]
- Bylo, L.N.; Koper, N.; Molloy, K.A. Grazing Intensity Influences Ground Squirrel and American Badger Habitat Use in Mixed-Grass Prairies. Rangel. Ecol. Manag. 2014, 67, 247–254. [Google Scholar] [CrossRef]
- Popotnik, G.J.; Giuliano, W.M. Response of Birds to Grazing of Riparian Zones. J. Wildl. Manag. 2000, 64, 976–982. [Google Scholar] [CrossRef]
- Martin, T.; Possingham, H.P. Predicting the impact of livestock grazing on birds using foraging height data. J. Appl. Ecol. 2005, 42, 400–408. [Google Scholar] [CrossRef]
- Dorrough, J.; McIntyre, S.; Brown, G.; Stol, J.; Barrett, G.; Brown, A. Differential responses of plants, reptiles and birds to grazing management, fertilizer and tree clearing. Austral. Ecol. 2012, 37, 569–582. [Google Scholar] [CrossRef]
- Kay, G.M.; Mortelliti, A.; Tulloch, A.; Barton, P.; Florance, D.; Cunningham, S.A.; Lindenmayer, D.B. Effects of past and present livestock grazing on herpetofauna in a landscape-scale experiment. Conserv. Biol. 2017, 31, 446–458. [Google Scholar] [CrossRef]
- Larson, D.M. Grassland Fire and Cattle Grazing Regulate Reptile and Amphibian Assembly among Patches. Environ. Manag. 2014, 54, 1434–1444. [Google Scholar] [CrossRef] [PubMed]
- Fleischner, T.L. Ecological Costs of Livestock Grazing in Western North America. Conserv. Biol. 1994, 8, 629–644. [Google Scholar] [CrossRef] [Green Version]
- Barton, P.S.; Sato, C.F.; Kay, G.M.; Florance, D.; Lindenmayer, D.B. Effects of environmental variation and livestock grazing on ant community structure in temperate eucalypt woodlands. Insect Conserv. Divers. 2016, 9, 124–134. [Google Scholar] [CrossRef]
- Cook, C.W.; Stubbendieck, J. Range Research: Basic Problems and Techniques; Society for Range Management: Fort Collins, CO, USA, 1986. [Google Scholar]
- Holechek, J.L.; Pieper, R.D.; Herbel, C.H. Range Management: Principles and Practices; Prentice Hall Publishing: Hoboken, NJ, USA, 2011. [Google Scholar]
- Kerns, B.K.; Buonopane, M.; Thies, W.G.; Niwa, C. Reintroducing fire into a ponderosa pine forest with and without cattle grazing: Understory vegetation response. Ecosphere 2011, 2, 1–23. [Google Scholar] [CrossRef]
- Reisner, M.D.; Grace, J.B.; Pyke, D.A.; Doescher, P.S. Conditions favouring Bromus tectorum dominance of endangered sagebrush steppe ecosystems. J. Appl. Ecol. 2013, 50, 1039–1049. [Google Scholar] [CrossRef] [Green Version]
- Bates, J.D.; Davies, K.W. Cattle Grazing and Vegetation Succession on Burned Sagebrush Steppe. Rangel. Ecol. Manag. 2014, 67, 412–422. [Google Scholar] [CrossRef]
- Astaras, C.; Linder, J.M.; Wrege, P.; Orume, R.D.; Macdonald, D.W. Passive acoustic monitoring as a law enforcement tool for Afrotropical rainforests. Front. Ecol. Environ. 2017, 15, 233–234. [Google Scholar] [CrossRef]
- Sugai, L.S.M.; Silva, T.S.F.; Ribeiro, J.W., Jr.; Llusia, D. Terrestrial Passive Acoustic Monitoring: Review and Perspectives. Bioscience 2019, 69, 15–25. [Google Scholar] [CrossRef]
- Figueira, L.; Tella, J.L.; Camargo, U.M.; Ferraz, G. Autonomous sound monitoring shows higher use of Amazon old growth than secondary forest by parrots. Biol. Conserv. 2015, 184, 27–35. [Google Scholar] [CrossRef] [Green Version]
- Comazzi, C.; Mattiello, S.; Friard, O.; Filacorda, S.; Gamba, M. Acoustic monitoring of golden jackals in Europe: Setting the frame for future analyses. Bioacoustics 2016, 25, 267–278. [Google Scholar] [CrossRef] [Green Version]
- Enari, H.; Enari, H.S.; Okuda, K.; Maruyama, T.; Okuda, K.N. An evaluation of the efficiency of passive acoustic monitoring in detecting deer and primates in comparison with camera traps. Ecol. Indic. 2019, 98, 753–762. [Google Scholar] [CrossRef]
- Brown, C.L.; Reed, S.E.; Dietz, M.S.; Fristrup, K.M. Detection and Classification of Motor Vehicle Noise in a Forested Landscape. Environ. Manag. 2013, 52, 1262–1270. [Google Scholar] [CrossRef] [PubMed]
- Pirotta, E.; Merchant, N.D.; Thompson, P.M.; Barton, T.R.; Lusseau, D. Quantifying the effect of boat disturbance on bottlenose dolphin foraging activity. Biol. Conserv. 2015, 181, 82–89. [Google Scholar] [CrossRef]
- Astaras, C.; Karmiris, I.; Stefanakis, N.; Vasiliadis, I. Acoustic files used as training data for the development of livestock grazing detection algorithms (sheep/goat, cow, bells). Figshare 2021. [Google Scholar] [CrossRef]
- Astaras, C.; Vasiliadis, I.; Stefanakis, N.; Karmiris, I. Livestock grazing detection algorithms. Figshare 2021. [Google Scholar] [CrossRef]
- Knight, E.C.; Hannah, K.C.; Foley, G.J.; Scott, C.D.; Brigham, R.M.; Bayne, E. Recommendations for acoustic recognizer performance assessment with application to five common automated signal recognition programs TT. Avian Conserv. Ecol. 2017, 12, 14–42. [Google Scholar] [CrossRef] [Green Version]
- R Core Team. A Language and Environment for Statistical Computing; R Foundation for Statistical Computing: Vienna, Austria, 2019. [Google Scholar]
Figure 1.
Location of the acoustic sensors (white points) within the Rhodope Mountain landscape [Black points mark main settlements, white lines the tar road network, and dashed green lines the Natura 2000 area boundaries].
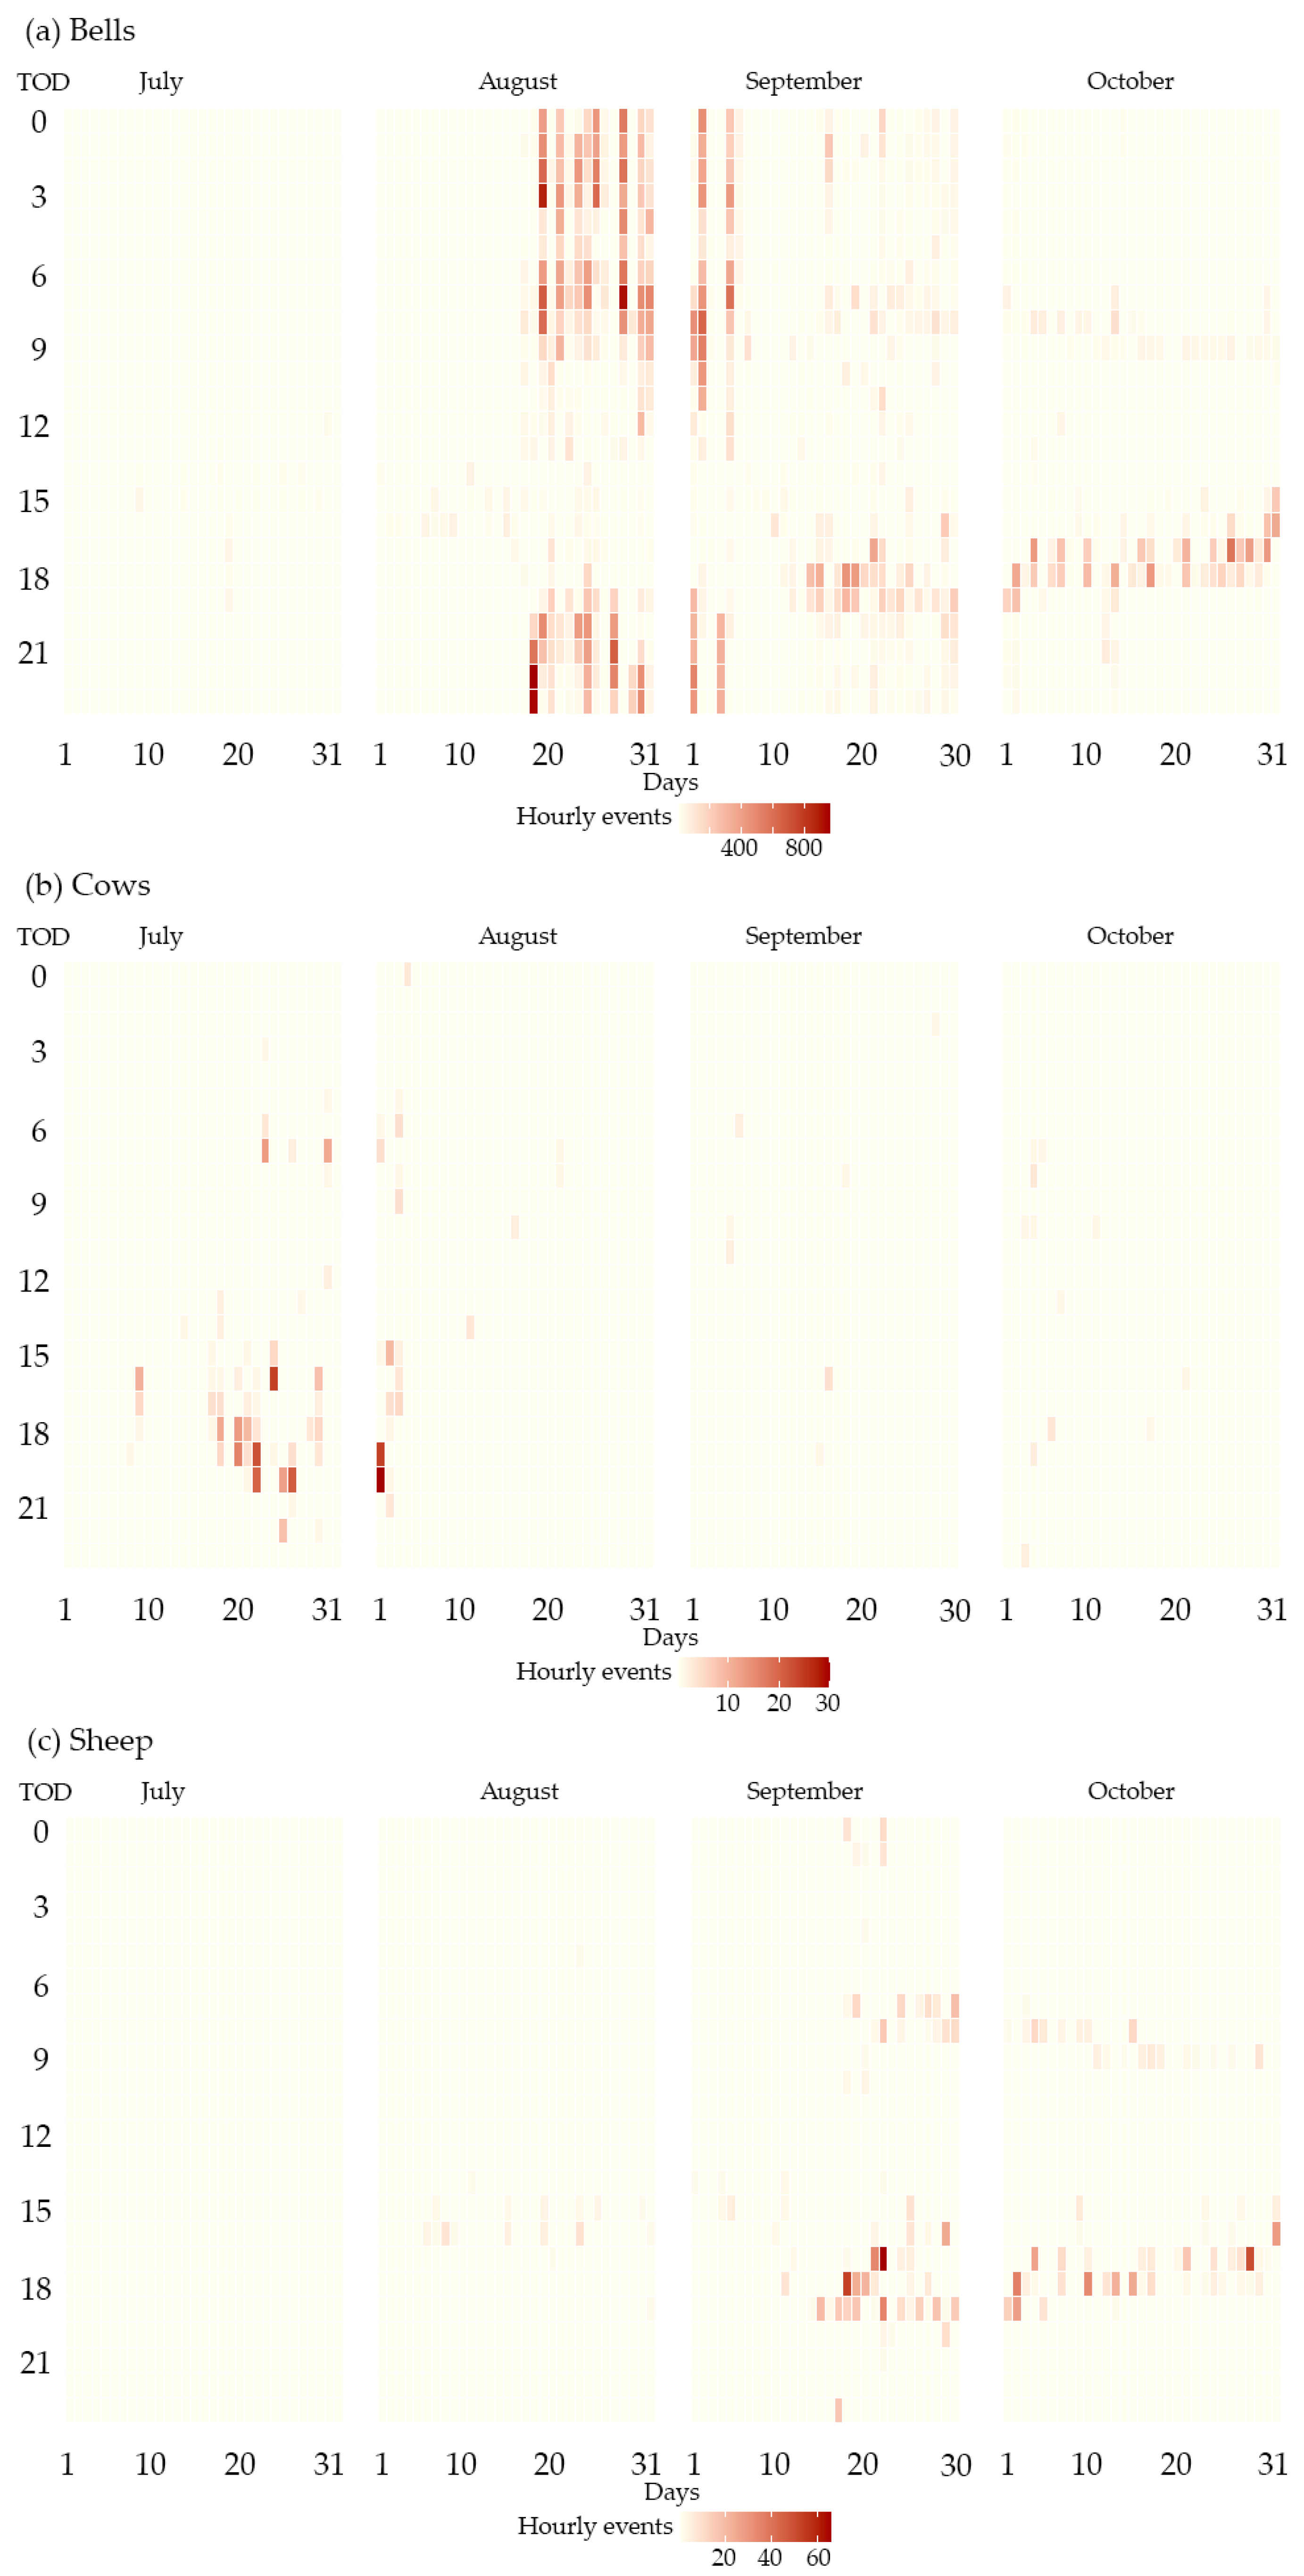
Figure 2.
Diel and seasonal distribution of livestock bells (a), cow lowing (b), and sheep/goat bleats (c) at Livaditis site. Y-axis rows represent time of the day (TOD; 0 am to 23 pm). X-axis columns represent days of the study period (1 July to 31 October).
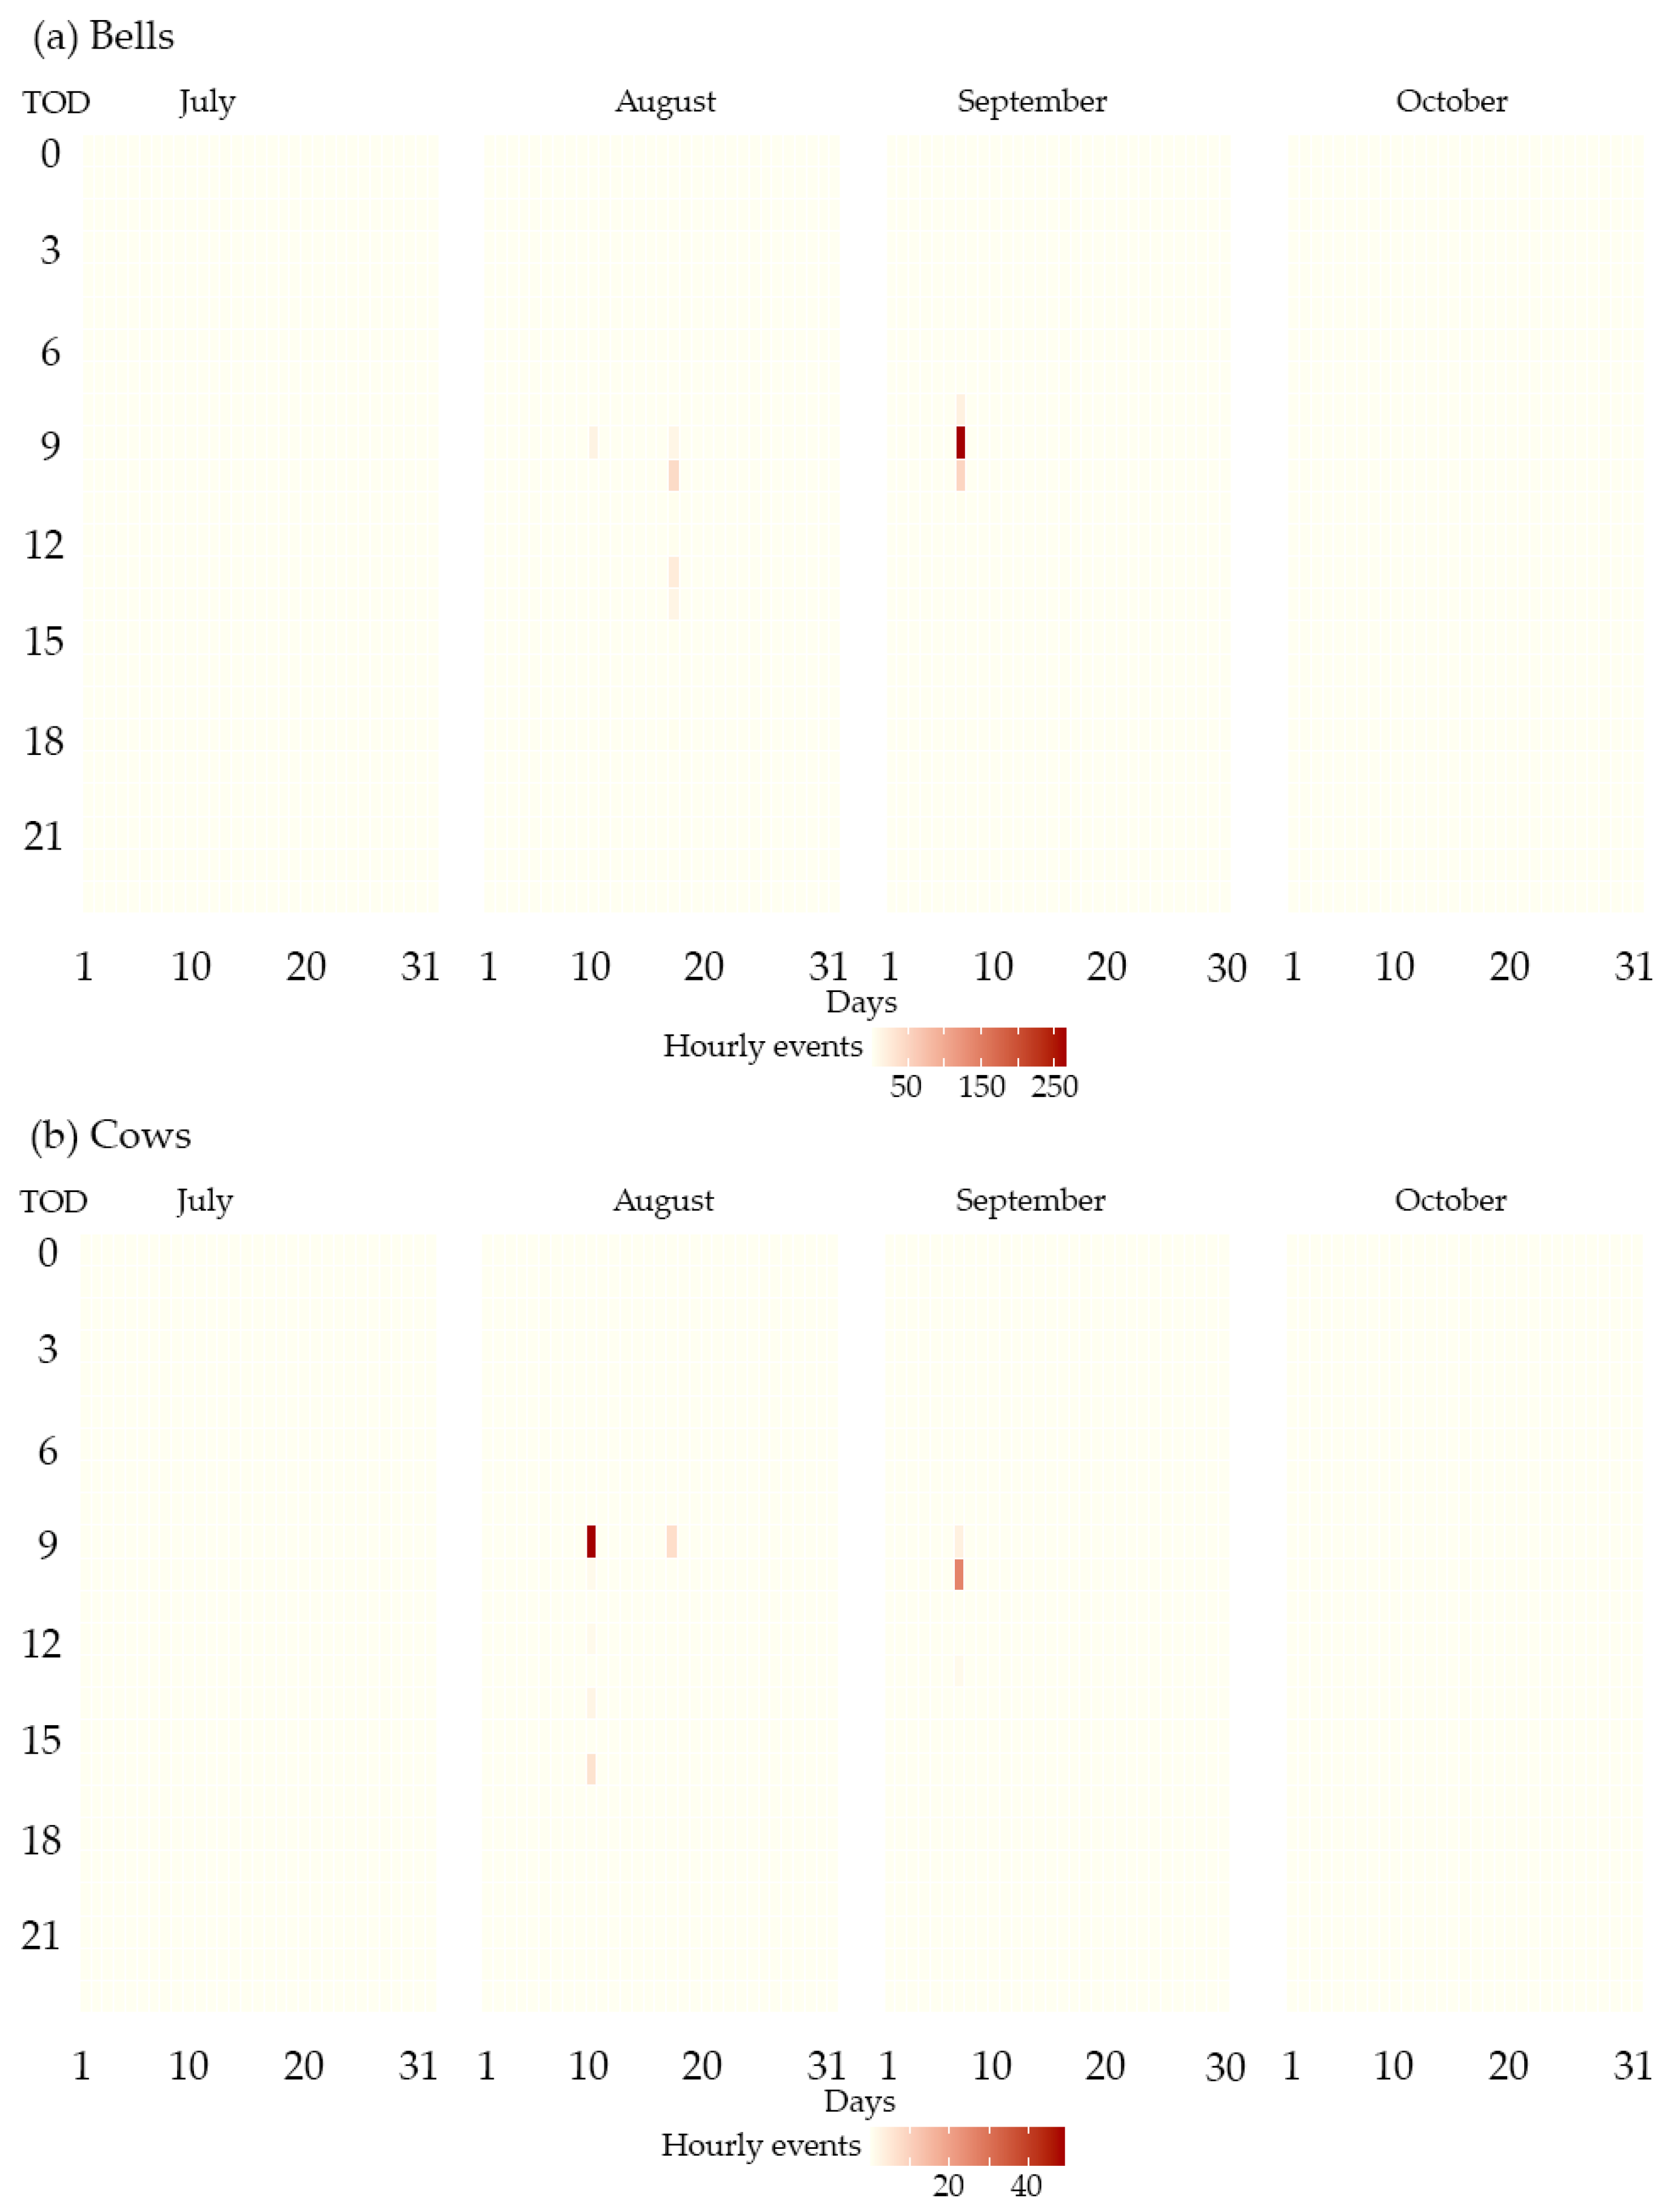
Figure 3.
Diel and seasonal distribution of livestock bells (a) and cow lowing (b) at Zaras site. Y-axis rows represent time of the day (TOD; 0 am to 23 pm). X-axis columns represent days of the study period (1 July to 31 October).
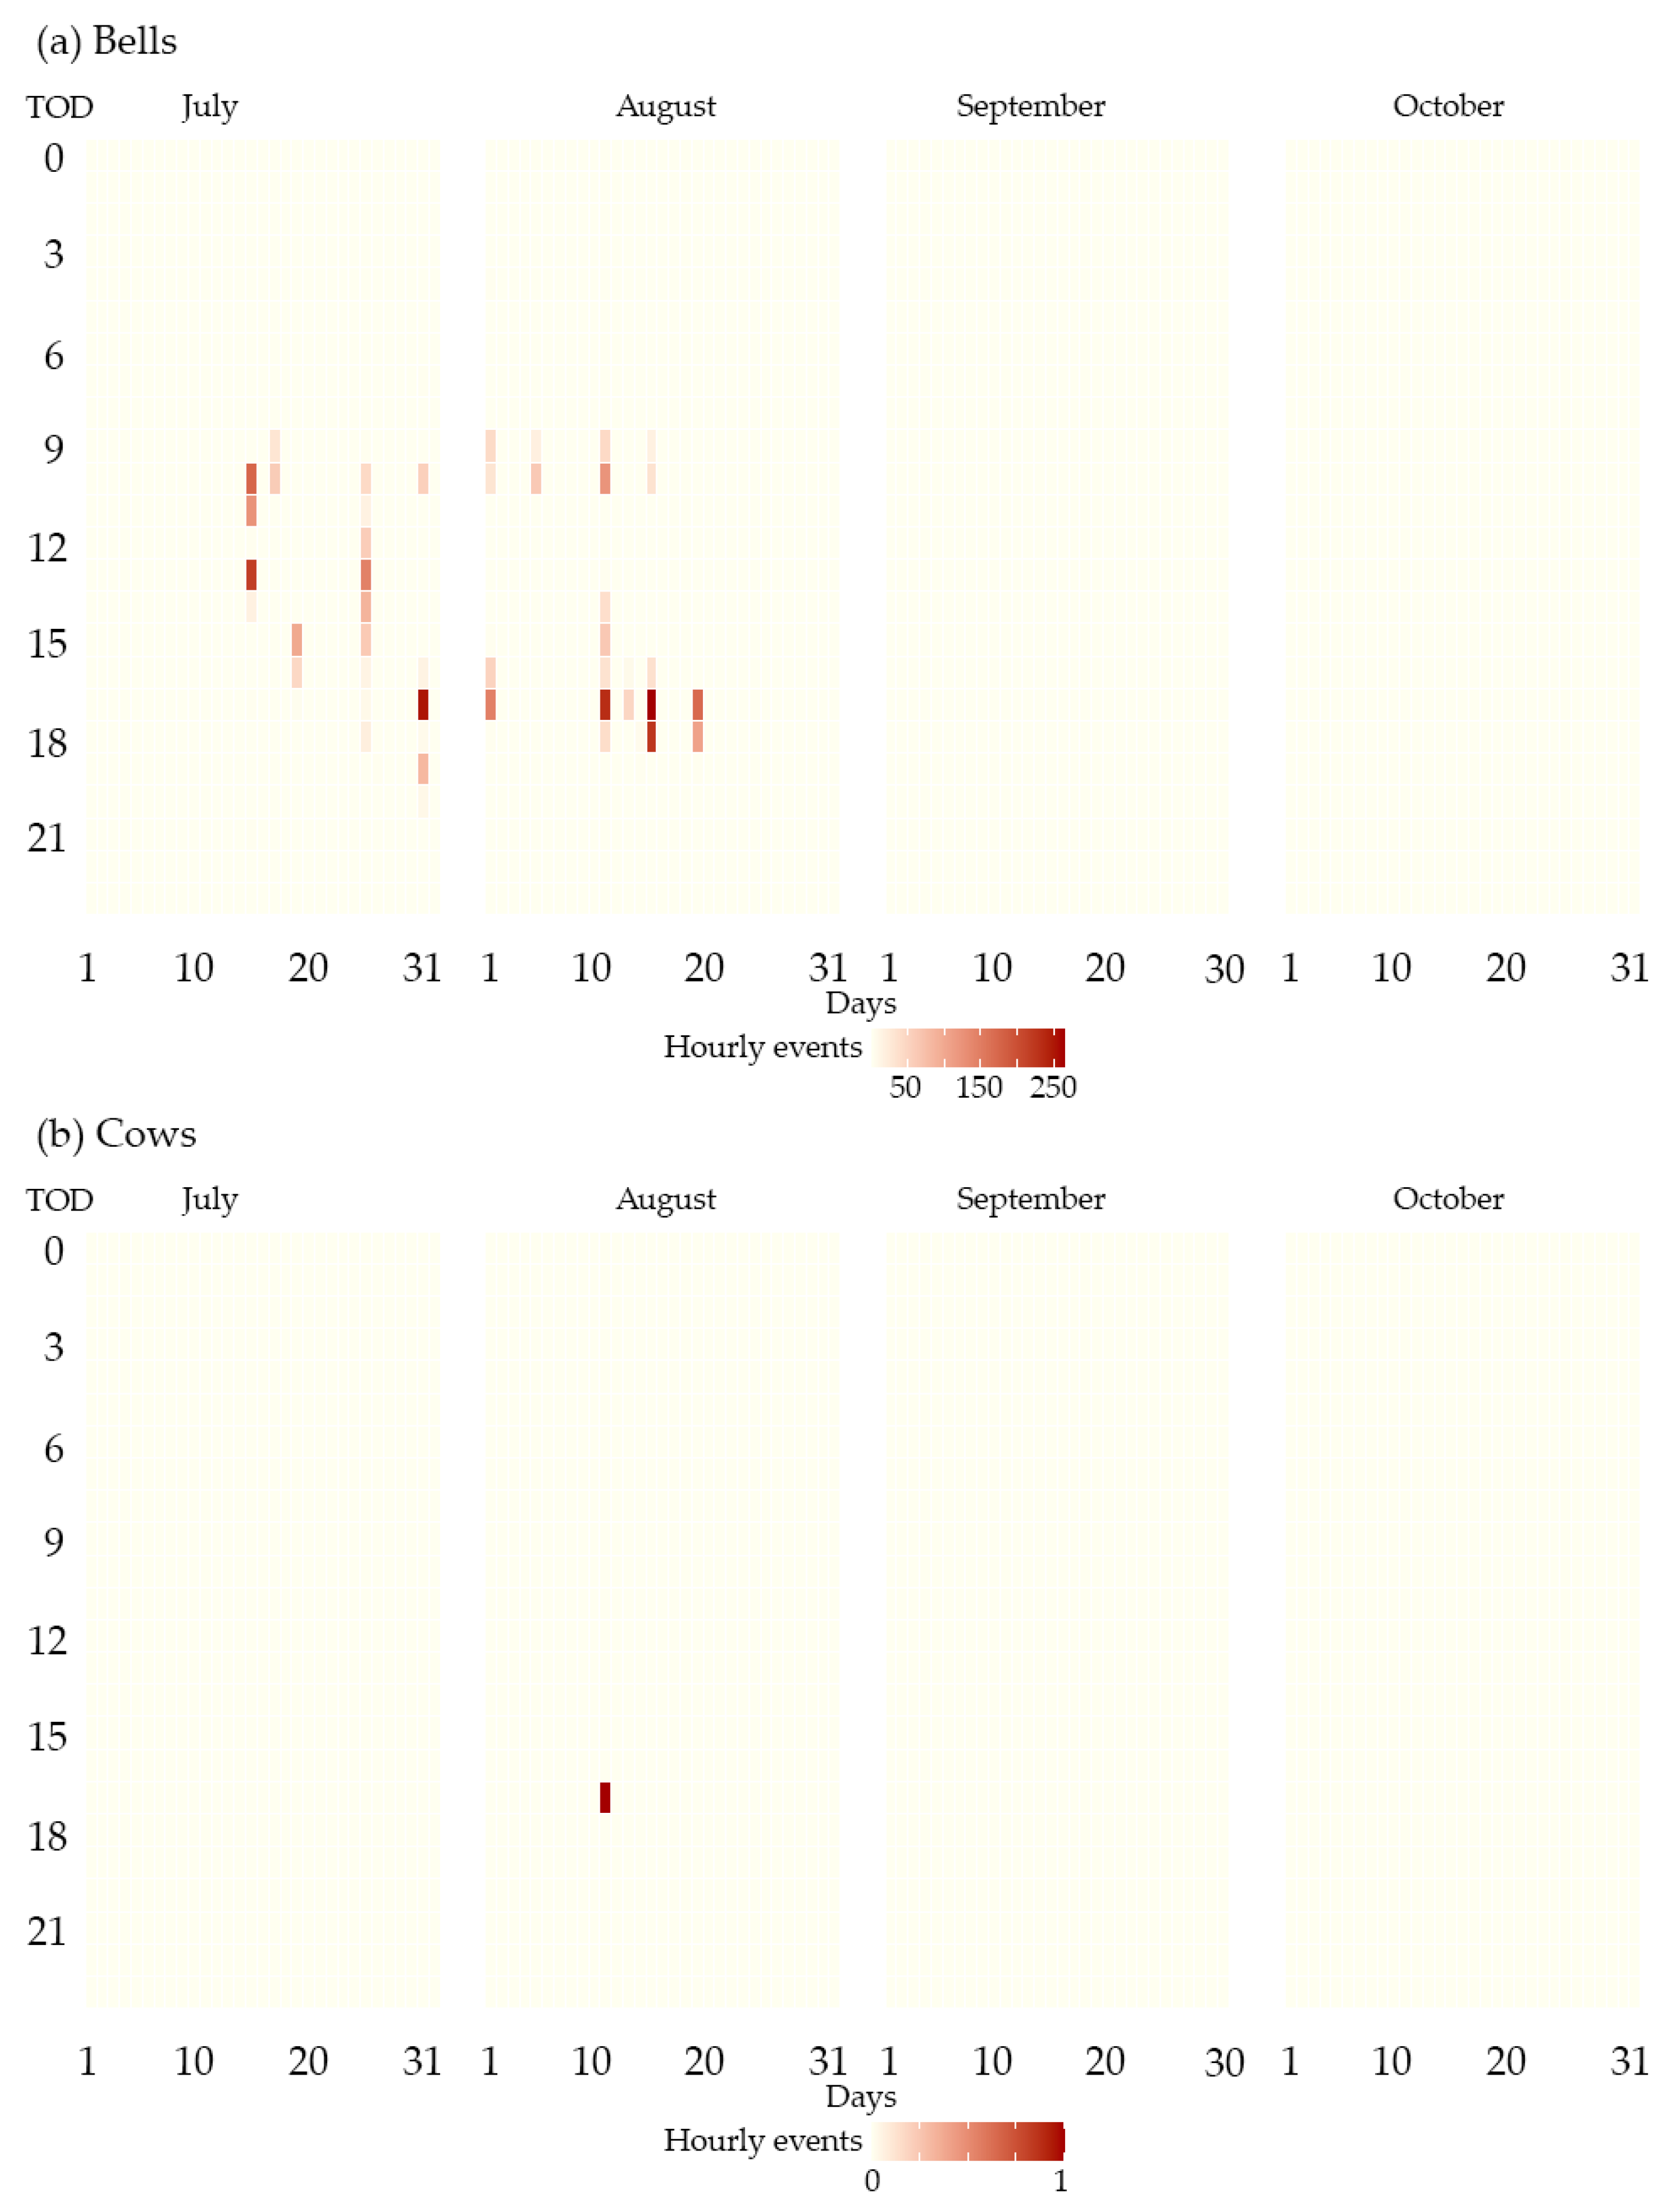
Figure 4.
Diel and seasonal distribution of livestock bells (a) and cow lowing (b) at Plakes site. Y-axis rows represent time of the day (TOD; 0 am to 23 pm). X-axis columns represent days of the study period (1 July to 31 October).
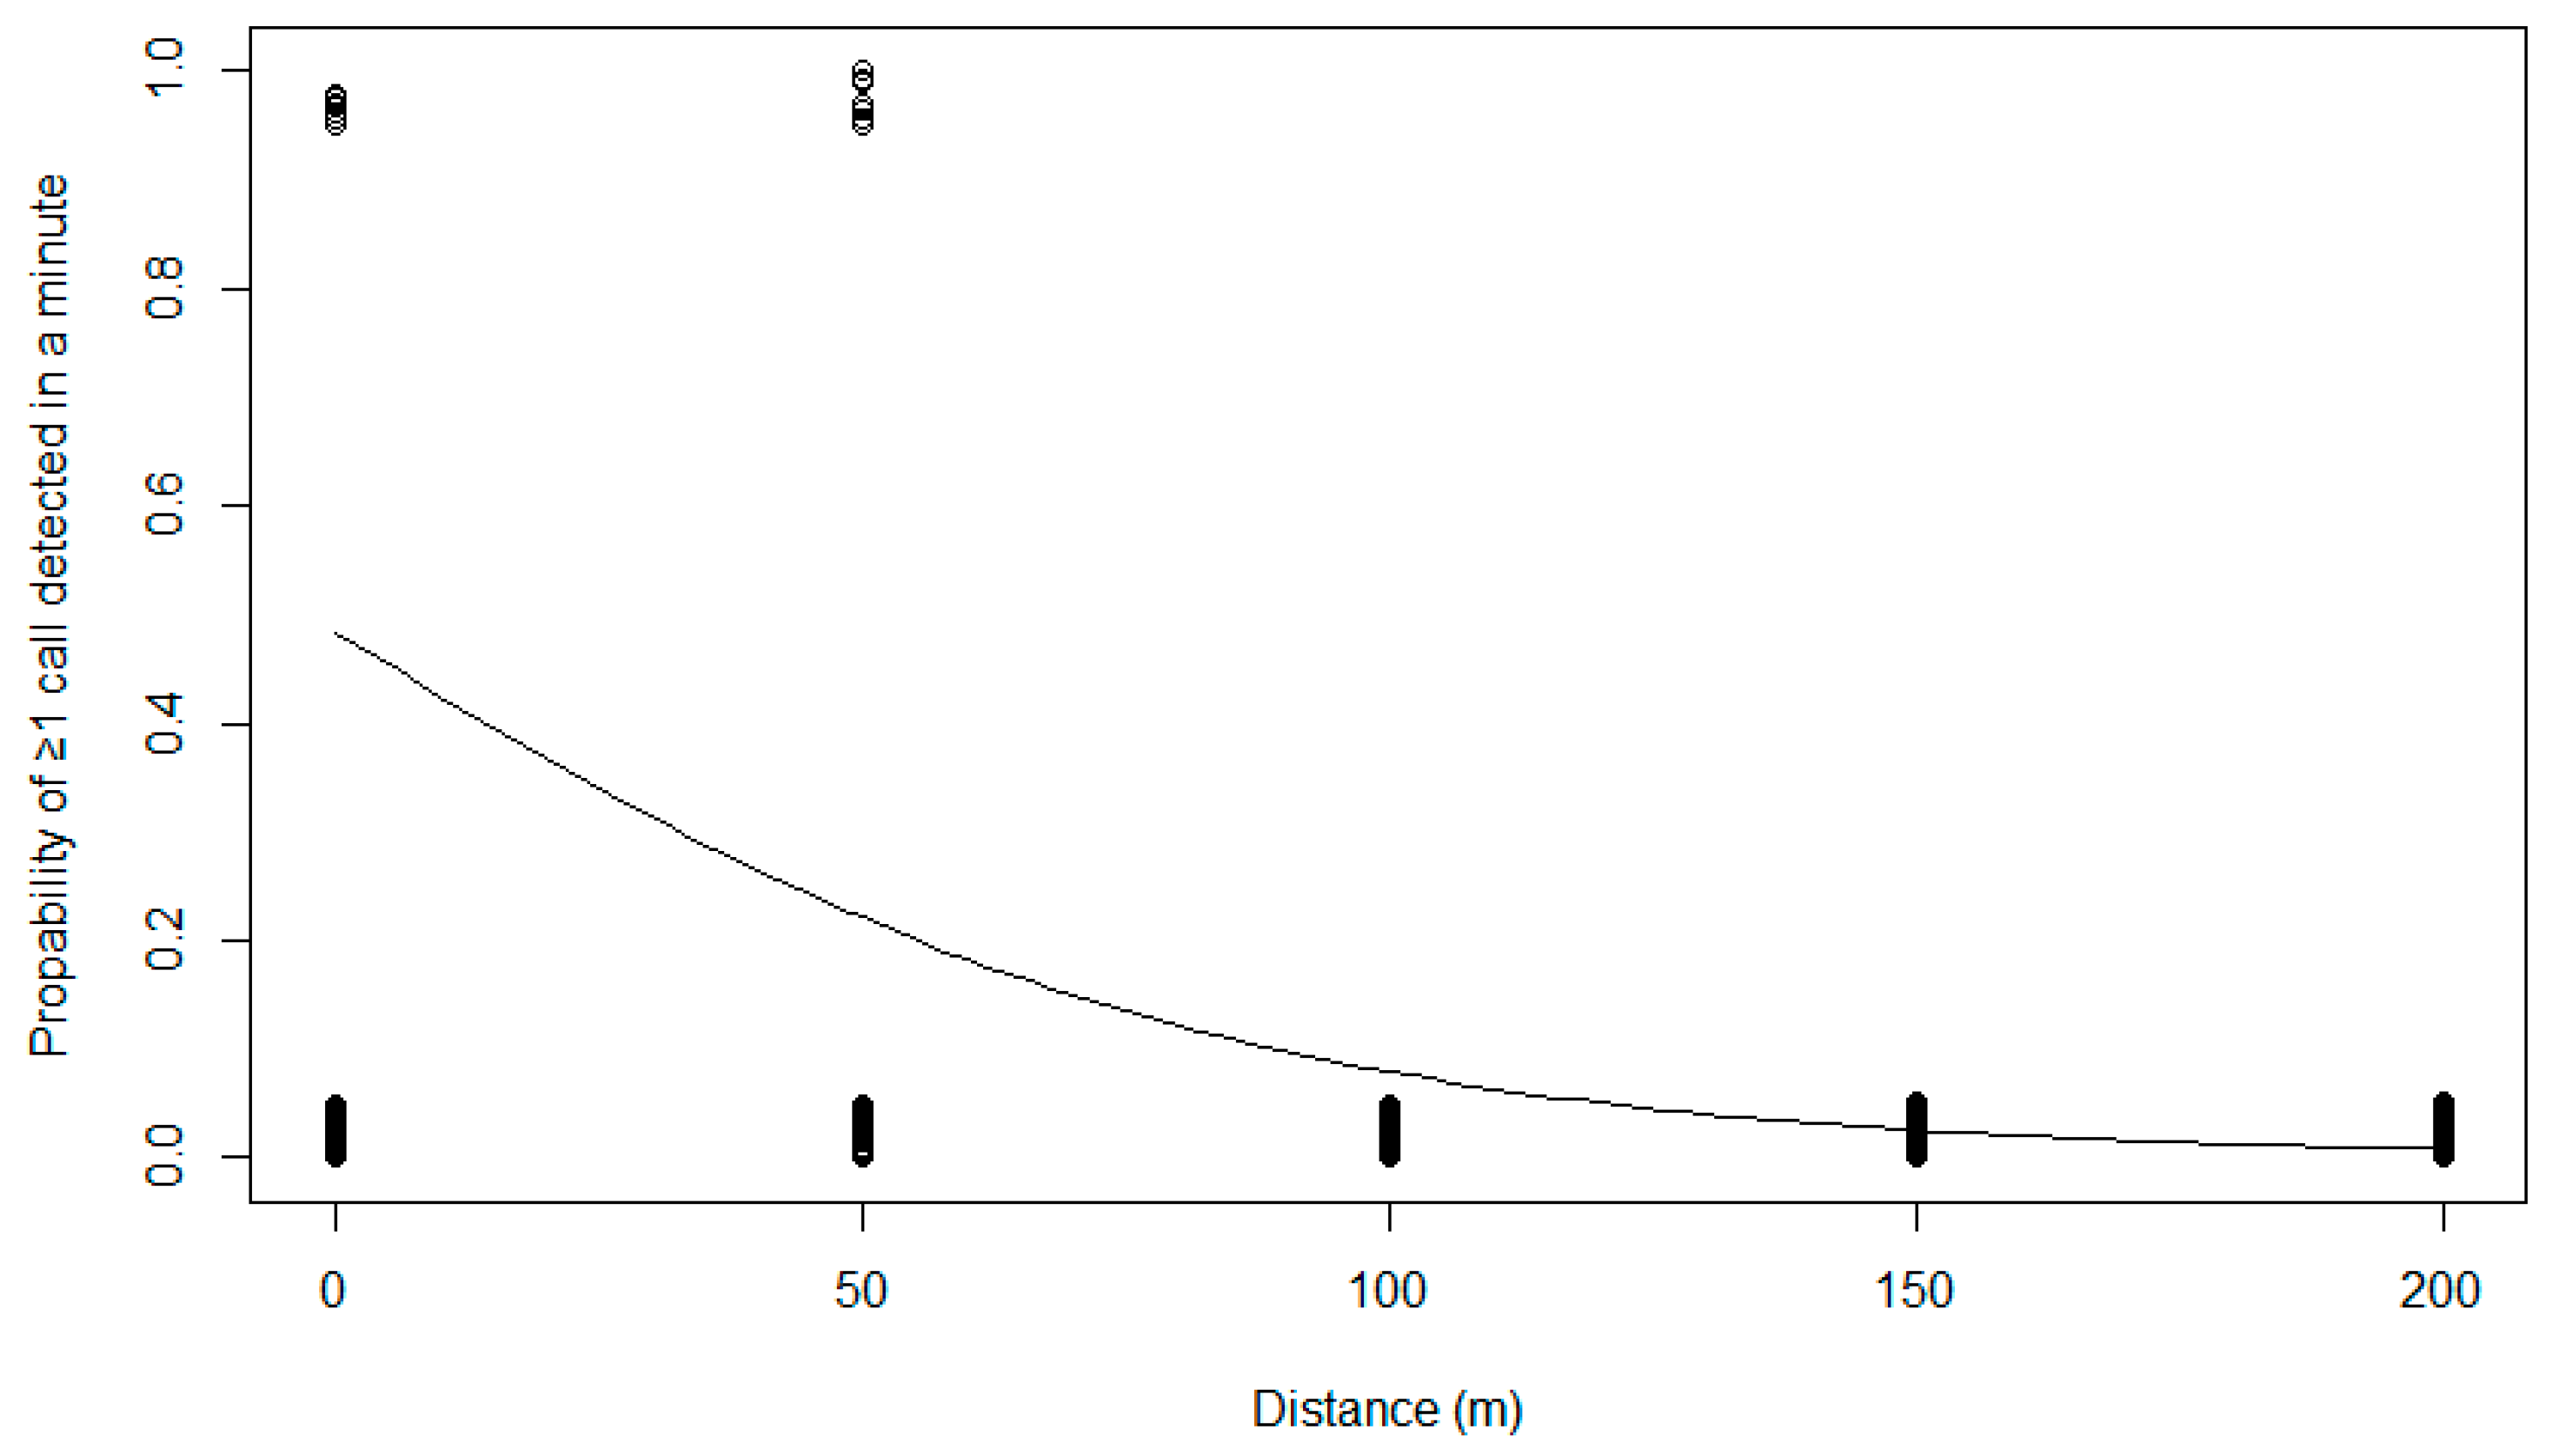
Figure 5.
Fitted logistic regression of the probability of at least one of ten sheep calls in a minute of acoustic data being detected using the sheep/goat detection algorithm, plotted as a function of the acoustic sensor’s distance to the calling animals. The regression is plotted for wind values of 0 (downwind), 0.5 (no wind), and 1 (upwind).
Figure 6.
Fitted logistic regression of probability of at least one of ten cow (lowing) calls in a minute of acoustic data being detected using the cow detection algorithm, plotted as a function of the acoustic sensor’s distance to the calling animals.
Table 1.
Parameter settings used for cow lowing, sheep/goat bleats and livestock bell rings acoustic detection algorithms built in Kaleidoscope software.
| Parameter | Sheep/Goat | Cow | Bells |
|---|
| FFT size | 128 | 128 | 128 |
| Max states | 9 | 9 | 9 |
| Max distance to cluster center | 0.5 | 0.5 | 0.5 |
| Max clusters | 500 | 500 | 500 |
| Frequency minimum (Hz) | 400 | 500 | 500 |
| Frequency maximum (Hz) | 4000 | 4000 | 4000 |
| Min length of detection (s) | 0.3 | 0.5 | 0.5 |
| Max length of detection (s) | 2.5 | 2.5 | 2.5 |
| Max inter-syllable gap | 0.35 | 0.35 | 0.35 |
Table 2.
Diel calling activity of livestock across all sites and for the duration of the survey period as deduced by the ratio of livestock calls to bell rings.
| Time | Bells | Livestock Calls | Calls/Bells Ratio |
|---|
| 1:00 | 3655 | 11 | 0.30% |
| 2:00 | 3929 | 1 | 0.03% |
| 3:00 | 4174 | 1 | 0.02% |
| 4:00 | 2057 | 1 | 0.05% |
| 5:00 | 1275 | 3 | 0.24% |
| 6:00 | 3481 | 15 | 0.43% |
| 7:00 | 5900 | 100 | 1.69% |
| 8:00 | 5042 | 95 | 1.88% |
| 9:00 | 3514 | 104 | 2.96% |
| 10:00 | 2029 | 41 | 2.02% |
| 11:00 | 1136 | 8 | 0.70% |
| 12:00 | 920 | 3 | 0.33% |
| 13:00 | 946 | 5 | 0.53% |
| 14:00 | 519 | 14 | 2.70% |
| 15:00 | 1371 | 65 | 4.74% |
| 16:00 | 2992 | 163 | 5.45% |
| 17:00 | 6814 | 286 | 4.20% |
| 18:00 | 6272 | 381 | 6.07% |
| 19:00 | 4084 | 294 | 7.20% |
| 20:00 | 3554 | 100 | 2.81% |
| 21:00 | 3583 | 7 | 0.20% |
| 22:00 | 3932 | 9 | 0.23% |
| 23:00 | 3325 | 18 | 0.54% |
| 0:00 | 3226 | 21 | 0.65% |
Table 3.
Number of identified putative livestock calls/bells flagged by the detection algorithms for each site, true positive events among them, % precision as confirmed by the human listener, and % of total acoustic dataset that had to be reviewed manually. Bold rows denote total count or mean % per call type.
| | Putative | True Positive | Precision | % Data Reviewed |
|---|
| Sheep/Goats (Livaditis) | 45,224 | 1141 | 2.5% | 0.5% |
| Cows (Total) | 37,166 | 513 | 1.4% | 0.1% |
| Livaditis | 33,271 | 416 | 1.3% | 0.4% |
| Zaras | 2498 | 96 | 3.8% | <0.1% |
| Plakes | 1397 | 1 | 0.1% | <0.1% |
| Bells (Total) | 93,044 | 74,708 | 80.3% | 0.4% |
| Livaditis | 86,266 | 70,847 | 82.1% | 1.1% |
| Zaras | 2182 | 437 | 20.0% | <0.1% |
| Plakes | 4596 | 3424 | 74.5% | 0.1% |
Table 4.
Evaluation metrics of the sheep bleat, cow lowing, and livestock bell detection algorithms against events located manually (“truth” dataset) in data from multiple days and sensors (TP = true positive detections; FN = false negative detections; FP = false positive detections).
| | Events 1 | TP | FN | FP | Precision | F-Score | Recall Rate | Recall Rate 3 |
|---|
| (β = 1) 2 | (Call) | (Hours >1 Event) |
|---|
| Sheep/Goat | 1031 | 219 | 812 | 1221 | 15.2% | 17.7% | 21.2% | 78.6% (n = 14) |
| Cow | 1024 | 196 | 828 | 146 | 57.3% | 28.7% | 19.1% | 82.4% (n = 17) |
| Bell | 302 | 275 | 27 | 68 | 80.2% | 85.3% | 91.1% | 100% (n = 31) |
Table 5.
Coefficients and standard errors of logistic regression models for detecting or not detecting sheep and cow calls at the individual call level and at minute level—i.e., detecting at least one call in minutes with one or more calls. All coefficients are significant (p < 0.001).
| Model | Intercept | Distance (m) | Wind 1 | Calls/Min |
|---|
| Sheep—Individual call | 0.572 ± 0.081 | −0.023 ± 0.001 | −0.843 ± 0.084 | - |
| Sheep—Minute | 1.99 ± 0.401 | −0.031 ± 0.003 | −1.134 ± 0.285 | 0.077 ± 0.01 |
| Cow—Individual call | −2.444 ± 0.244 | −0.025 ± 0.006 | - | - |
| Cow—Minute | −2.747 ± 0.527 | −0.024 ± 0.007 | - | 0.268 ± 0.127 |
| Publisher’s Note: MDPI stays neutral with regard to jurisdictional claims in published maps and institutional affiliations. |
© 2021 by the authors. Licensee MDPI, Basel, Switzerland. This article is an open access article distributed under the terms and conditions of the Creative Commons Attribution (CC BY) license (https://creativecommons.org/licenses/by/4.0/).


 ,
, 


