Article

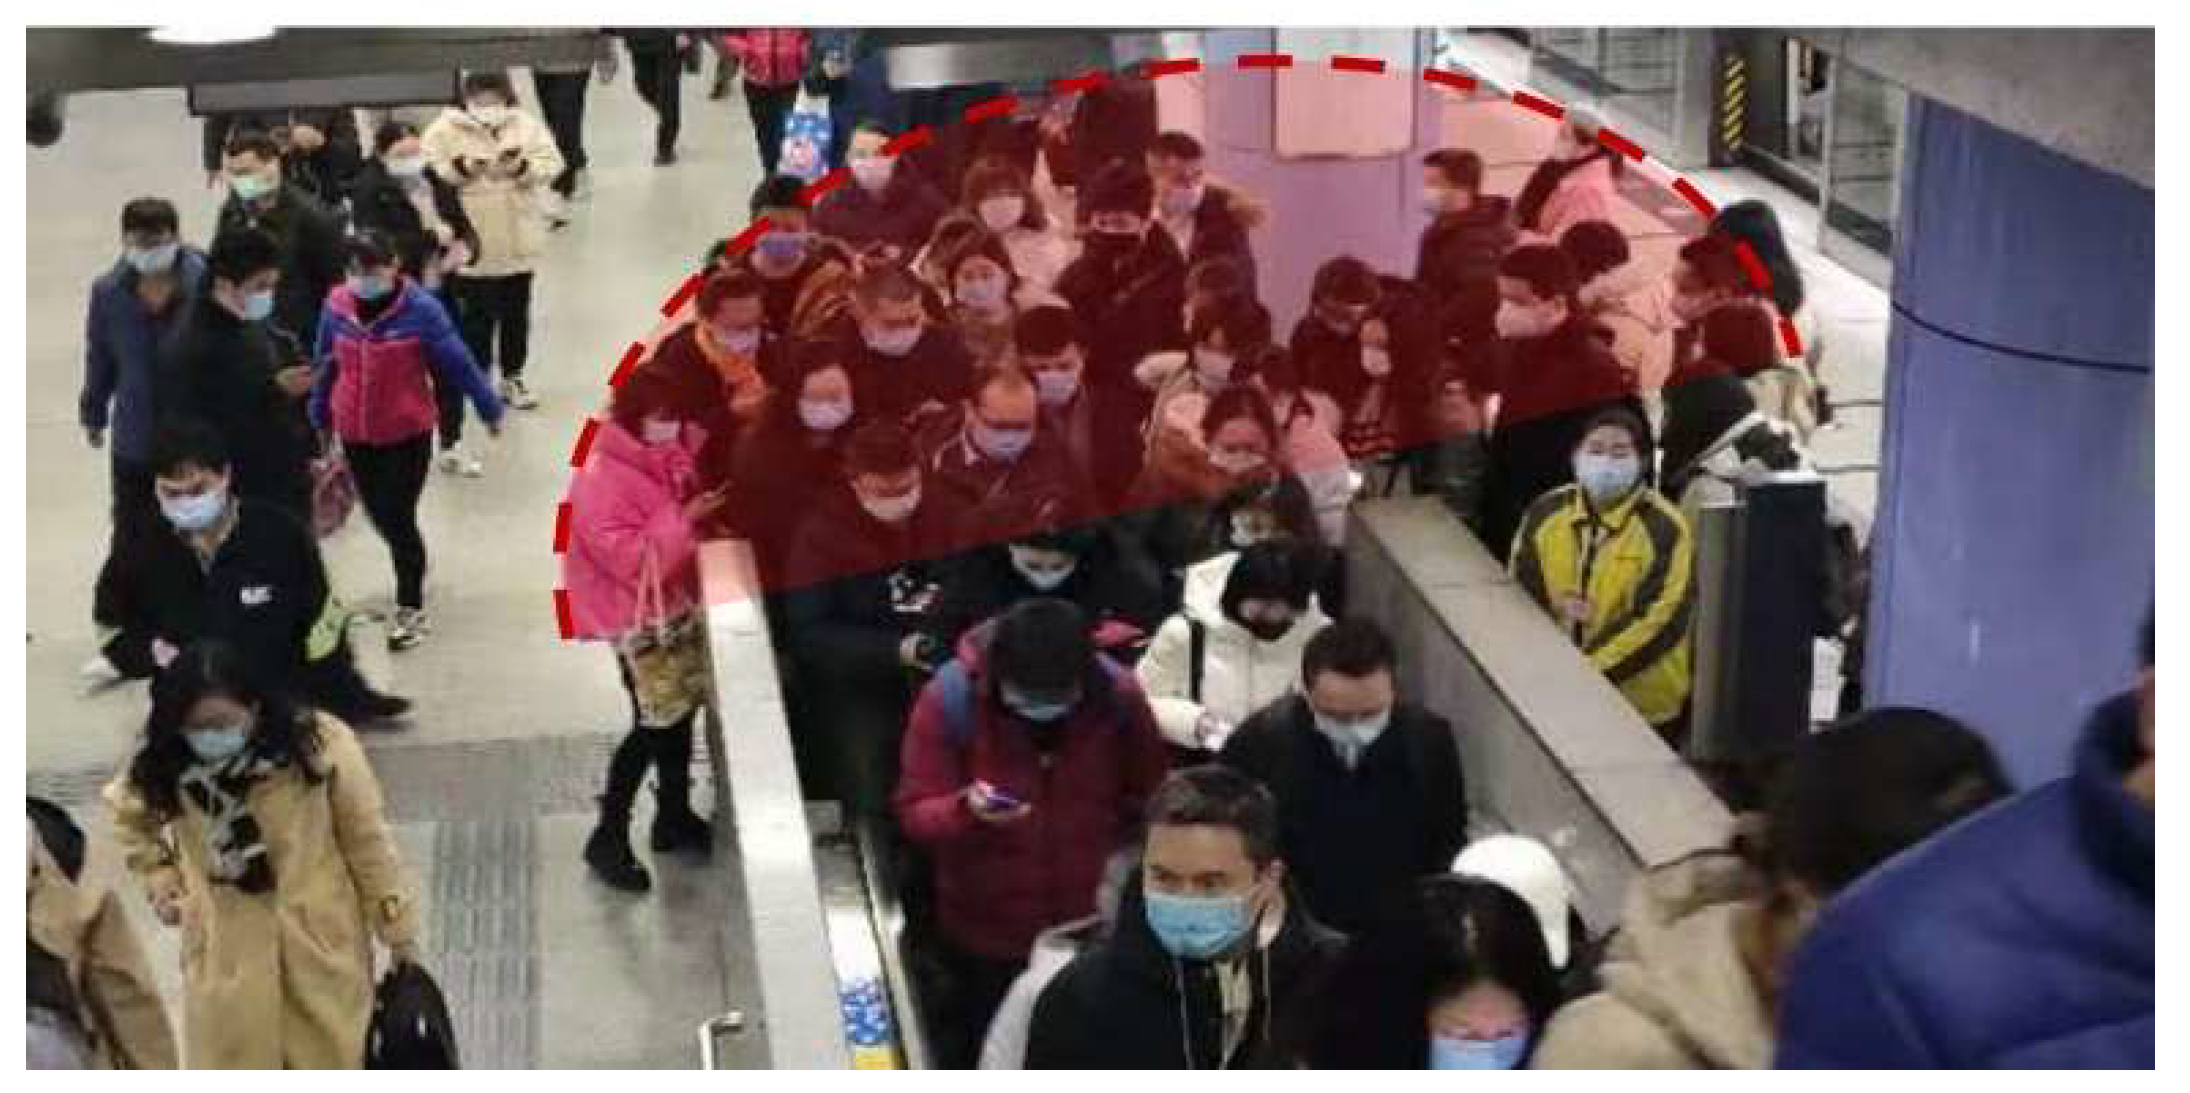
Pedestrian Arching Mechanism at Bottleneck in Subway Transit Hub

1
Beijing Advanced Innovation Center for Future Urban Design, Beijing University of Civil Engineering and Architecture, Beijing 100081, China
2
Department of Civil Engineering, Tsinghua University, Beijing 100084, China
*
Author to whom correspondence should be addressed.
Information 2021, 12(4), 164; https://doi.org/10.3390/info12040164
Submission received: 25 February 2021 / Revised: 8 April 2021 / Accepted: 8 April 2021 / Published: 11 April 2021
(This article belongs to the Section Information Theory and Methodology)

Abstract

:
Under the massive pedestrian flow, pedestrians arching phenomenon forms easily at bottleneck in subway hubs, which might stampede and crush. To explore pedestrian arching mechanism at bottleneck in subway transit hub, this paper conducts a series of simulation experiment. Firstly, movement preference characteristic in subway transit hubs was introduced into the social force model which considers multiple force. Then, after setting basic experiment scenario, unidirectional flow at different bottlenecks were simulated. Finally, the mechanism of pedestrian arching phenomenon at bottleneck was quantitative analyzed with the help of experimental data. Some main conclusions are summarized. Pedestrian arching phenomenon could be divided into four stages: Free, arching formation, arching stabilization and arching dissipation. In addition, the relationship between bottleneck scenario and passing time could be built to a function model. With the different of bottleneck width ratio, passing time presents positive correlation. The research results could give some helps for understanding the dynamic evolution process of unidirectional flow at bottleneck, improving the pedestrian efficiency at bottleneck and optimizing pedestrian facilities in subway transit hub.

1. Introduction

With the rapid development of urban public transport, due to the advantages of large capacity, convenience and efficiency, and green environmental protection, subway undertakes the most public transportation pedestrian flow [1]. The highest average daily pedestrian volume has been more than 13 million in Beijing subway in 2019, meaning the “massive pedestrian flow” has become the “new normalcy” in Beijing subway. Under the “massive pedestrian flow”, pedestrians keep gathering at the bottleneck in the transit hub. When the pedestrian flow far exceeds the capacity of the bottleneck, pedestrian arching will occur at the bottleneck [2], as shown in Figure 1. At this time, the force between pedestrians in the arch is transmitted to each other, and the huge pressure is concentrated at the bottleneck entrance, which is not conducive to the passage of pedestrians. The safety hazard exists, and a stampede accident may occur in serious cases. Therefore, it is necessary to study the inherent law of pedestrian arching. Accurately grasp pedestrian behavior characteristic of arching and study the evolution of the pedestrian arching, is a pressing issue to pedestrian management and subway facility design.
In recent years, pedestrian behavior has been a research focus [3,4]. Aiming at the reduction of pedestrian efficiency and safety caused by bottleneck, scholars began to study the pedestrian behavior characteristics at bottleneck. Through image processing technology, Daamen and Hoogendoorn [5] extracted and analyzed the pedestrian motion characteristics at narrow bottleneck in the evacuation, such as free speed, density and walking direction. Hoogendoorn and Daamen [6] studied the oscillating effect, stratification effect and zipper effect by extracting the pedestrian trajectories at bottleneck in the pedestrian experiment. Moreover, Liu et al. [7], Seyfried et al. [8,9], Tian et al. [10] all carried out pedestrian experiments, and extracted pedestrian trajectories to analyze pedestrian motion characteristics, such as density, basic diagram of speed, sway frequency and sway amplitude. Through field experiments, Sun et al. [11] and Luo et al. [12] studied the influence of bottleneck on pedestrian movement in subway stations, and proved some optimization measures such as funnel shape, column obstacle.
With the development of computer technology and simulation model, scholars began to study pedestrians at the bottleneck based on simulation. Guo [13] proposed a revised social force model to simulate the pedestrian counter flow through a bottleneck. Based on the extended cellular automata, Li and Han [14] proposed a pedestrian evacuation simulation model to study pedestrian’s behavioral effect at bottleneck. Tang et al. [15] built a bypassing behavior model to analyze pedestrian arching at the bottleneck in the emergent evacuation situation. Li and Guo [16] simulated bi-directional pedestrian flow through a bottleneck by an extended cell transmission model with regular hexagonal cell representation. Through designing a safety evacuation model for pedestrians within limited spaces, Li and Xu [17] analyzed bottleneck area density, evacuation efficiency and similar factors.
The social force model proposed by Helbing and Molnar [18] has been extensively applied to the simulation of pedestrian. Xu and Duh [19] simulated the bonding effects inside pedestrian crowds by social force model and found delays in walking and the overtaking phenomenon. Base on social force model, Yuen and Lee [20] proposed an overtaking force, which can reflect overtaking behavior. Wang et al. [21] proposed a composite social force model with a multi-exit utility function. Kolivand et al. [22] proposed a model that improves the social force model by introducing four new characteristics, which are gender, walking speed, intention outlook and grouping, to make simulations more realistic. Yang et al. [23] adopted the social force model as a fundamental driven equation of passengers’ movements, then studied the effect of passenger attribute namely the homogeneity and heterogeneity in passengers on the alighting and boarding efficiency in the subway stations. Ru et al. [24] divided a crowd into three categories that have different kinds of movement based on different force models. Simulation results indicated that luggage-laden pedestrians bring great difficulty to evacuation.
To sum up, the scholars have done a large amount of in-depth researches on the pedestrian behavior at bottleneck, which obtained some significant findings. Some recognized that pedestrian arching is related to pedestrian safety [2,15]; however, pedestrian arching mechanism at bottleneck in subway transit hub need be studied deeply. Besides, social force model is one of the most widely used pedestrian simulation models. Thus, through the establishment of simulation model based on social force and consideration of movement preference characteristic in subway transit hub, this paper quantitative analyze pedestrian arching mechanism in scenario of subway transit hub. The results are helpful to understand the dynamic evolution process of one-way pedestrian flow, reveal the basic law of pedestrian movement, improve the pedestrian efficiency at bottleneck and optimize pedestrian facilities in subway transit hub.
This paper is organized as follows: Section 1 introduces background. Section 2 describes the building of simulation model. Section 3 designs pedestrian experiment. Section 4 presents the analysis of pedestrian arching mechanism. Finally, Section 5 concludes this study and suggests future research recommendations.

2. Building of Simulation Model

2.1. Comparison of Basic Model

More than 30 pedestrian simulation models have been applied around the world. According to the degree of pedestrian detail description, simulation model can be divided into macroscopic model, medium model and microscopic model. Due to pedestrian behavioral modeling at bottleneck belongs to micro-level, microscopic model is compared in this paper, including cellular automata model, benefit cost cellular model, magnetic model and social force model. Comparison and analysis of 9 aspects of microscopic simulation model are summarized, as shown in Table 1, including principle of walking, driving force, and so on.
The above microscopic simulation models all can effectively describe the basic pedestrian characteristics during moving. However, there are large differences in basic principles. By contrast, social force model has four advantage for this study. (1) pedestrian behavior is generated under the influence of three elements, that are environment, psychology and behavior, which is consistent with the building principle of social force model. Thus, social force model can simulate pedestrian behavior more realistically. (2) in the subway transit hub, pedestrian usually has interaction behaviors with surrounding individuals, such as avoidance, waiting and competition. The social force model is based on complex mechanical model, which can simulate these pedestrians’ interactions more reasonable. (3) pedestrian is constantly affected by the surrounding people and environment, so direction of motion and speed may be adjusted at any time. In social force model, the coordinates of pedestrian and time is continuous. Thus, social force model can simulate the elements of time and space more properly. (4) under the massive pedestrian flow, spatial compression and break step caused by crowded pedestrians will occur in the subway transit hub. Because the grid model is limited by the width of the spatial grid, the grid will be scattered and deformed in the simulation process, which will affect the simulation results. The meshless model with no spatial constraints could avoid these situations and improve the accuracy of numerical simulation. In conclusion, social force model is chosen to analyze pedestrian arching mechanism in subway transit hub.

2.2. Principle of Social Force Model

Helbing and Molnar [18] firstly constructed the basic social force model of pedestrian movement under the normal state. The core idea of social force model is that the pedestrians’ movement is influenced by purpose, interaction between pedestrians and influence from surrounding obstacles, as shown in Figure 2. Moreover, these influences are expressed by equation, which is similar to mechanics. Pedestrian movement process can be described by the following partial differential equation.
f i ( t ) = m i d v i ( t ) d t = m i a i ( t ) = f i 0 ( t ) + j ( i ) f i j ( t ) + w f i w ( t ) + a f i a ( t ) + g f i g ( t ) + ξ i ( t )
where f i ( t ) is the resultant force of pedestrian i under all force at time t; a i ( t ) is acceleration of pedestrian i at time t; f i 0 ( t ) is the personal desire force, which is pointing to pedestrian’s next objective; j ( i ) f i j ( t ) is the interaction force of pedestrian i from pedestrian j at time t; w f i w ( t ) is the interaction force of pedestrian i from obstacle w at time t; a f i a ( t ) is the attraction force of pedestrian i from surrounding at time t; g f i g ( t ) is the attraction force of pedestrian i from surrounding pedestrians at time t and ξ i ( t ) is a random variable.
However, pedestrians have strong travel purpose in subway transit hub, which is less attracted by surrounding pedestrians and things. Thus, in this paper, the social force model can be simplified to three force, including personal desire force, interaction force between pedestrians, interaction force between pedestrian and obstacle, as follows.
f i ( t ) = f i 0 ( t ) + j ( i ) f i j ( t ) + w f i w ( t ) + ξ i ( t )

2.2.1. The Personal Desire Force

The personal desire force is the most striking force in model, which determine the pedestrian walk toward to the destination with desired speed. If a pedestrian walks without any disturbances, he will walk toward to desired direction e a ( t ) with speed v a . The Equation of personal desire force is given below.
f i 0 ( t ) = m i v i 0 e i ( t ) - v i ( t ) τ i
where m i is mass of pedestrian i; v i 0 is desired speed of pedestrian i and e i ( t ) is unit vector of pedestrian i from the current position to the next target position r i j at time t.
e i ( t ) = r i k r i ( t ) r i k r i ( t )
where v i ( t ) is the current speed of pedestrian i at time t and τ i is relaxation time, meaning the time of pedestrian i from current speed v i ( t ) to desired speed v i 0 .

2.2.2. The Interaction Force

In the process of movement, pedestrian will initiatively keep a certain distance with others. The closer a pedestrian is to strangers, the more uncomfortable he feels, which lead to repulsive force. This repulsion force is exponential function relation with distance between pedestrians. The Equation is expressed as follow.
f i j ( t ) = m i A i B i exp ( r i j ( t ) B i ) r i j ( t ) r i j ( t )
where r i j ( t ) is position vector difference between pedestrian i and j at time t, r i j ( t ) = r i ( t ) r j ( t ) ; A i is strength of pedestrian interaction force and B i is distance of pedestrian interaction force.

2.2.3. The Obstacles Forces

In the process of movement, pedestrians will keep a certain distance to the boundary of obstacles, walls, buildings, and so on. The influence of boundary and obstacles to pedestrians is similar to the interaction between the pedestrian. Pedestrian will initiatively avoid obstacles to prevent injuries. The Equation of obstacles forces is expressed as follow.
f i w ( t ) = m i A w B w exp ( r i w ( t ) B w ) r i w ( t ) r i w ( t )
where r i w ( t ) is position vector difference between position r i ( t ) of pedestrian i and position r w i ( t ) of obstacle w, r i w ( t ) = r i ( t ) r w i ( t ) ; A w is interaction strength of obstacle force and B w is interaction distance of obstacle force.

2.3. Movement Preference Characteristic in Subway Transit Hub

The pedestrian speed and occupancy space in subway transit hub is different from other environments. Movement preference characteristic in subway transit hub need to be analyzed. The characterization parameters of speed and occupancy space in social force model are revised, including desired speed, initial speed and pedestrian diameter. Furthermore, A i and B i in Equations (5) and (6) are constant. Drawing on the results of previous subway pedestrian studies [25], A i and B i are discretized, where the discrete values are set respectively:
A i   =   { 0.3 ,   0.6 ,   0.9 ,   1.2 ,   1.5 ,   1.8 ,   2.1 }
B i   =   { 0.18 ,   0.20 ,   0.22 ,   0.24 ,   0.26 ,   0.28 ,   0.30 }

2.3.1. Desired Speed

Desired speed refers to the speed that pedestrian expects to achieve without any, interferences of other pedestrians and obstacles, which is according to the travel purposes, physical conditions, pedestrian facilities and so on. Desired speed is approximately to the free flow speed, which is the equilibrium value between the largest comfort and the least energy expenditure. Henderson and Lyons’ research findings of pedestrian are approved [26]: Under normal conditions, the pedestrian desired speed distribution is in concordance with the Guass distribution, averaged 1.34 m/s, standard deviation 0.26 m/s.
Due to pedestrians have specific walking purpose in subway transit hub, and pedestrians have the psychological tendency to walk out of the crowded space under the narrow and long corridor, pedestrian behavior is different in other environments. To determine the desired speed, pedestrian motion parameters in corridor in Beijing subway transit hub was captured in this study. The average of the free flow speed is 1.61 m/s, and the standard deviation is 0.27. Compared with the Henderson’s results, the average of desired speed in corridor in Beijing subway transit hub is higher, and the standard deviation is approximate.

2.3.2. Initial Speed

Initial speed refers to the initial speed in simulation experiment, which can be walking speed in corridor in subway transit hub. Through summarizing previous studies, it found that the pedestrian speed in corridor in Beijing subway transit hub studied by different scholars is different. In order to ensure the accuracy of the initial speed, through collecting the field video and video in transportation operations coordination center (TOCC), speed distribution in corridor in Beijing subway transit hub was obtained. The statistics show that speed distribution follows Poisson distribution, N (1.57, 0.32).

2.3.3. Pedestrian Diameter

Pedestrian diameter refers to the diameter of pedestrian space, namely, the diameter of the static space. Static space refers to the body space under stationary state. According to pedestrian static space demand and constraints on pedestrians in different static space, static space can be divided into four grades, contact areas, none contact areas, personal comfort zones and actionable areas, as shown in Table 2 [27]. Considering pedestrian density is high and pedestrian is close to pedestrian, combining spacing survey of the bottleneck in reality, the pedestrian diameter is set to random distribution of between 0.35~0.45.
To sum up, desired speed is obeyed to normal distribution, N (1.61, 0.27), initial speed is obeyed to normal distribution, N (1.57, 0.32) and pedestrian diameter is obeyed to uniform distribution, U (0.35, 0.45).

3. Design of Pedestrian Experiment

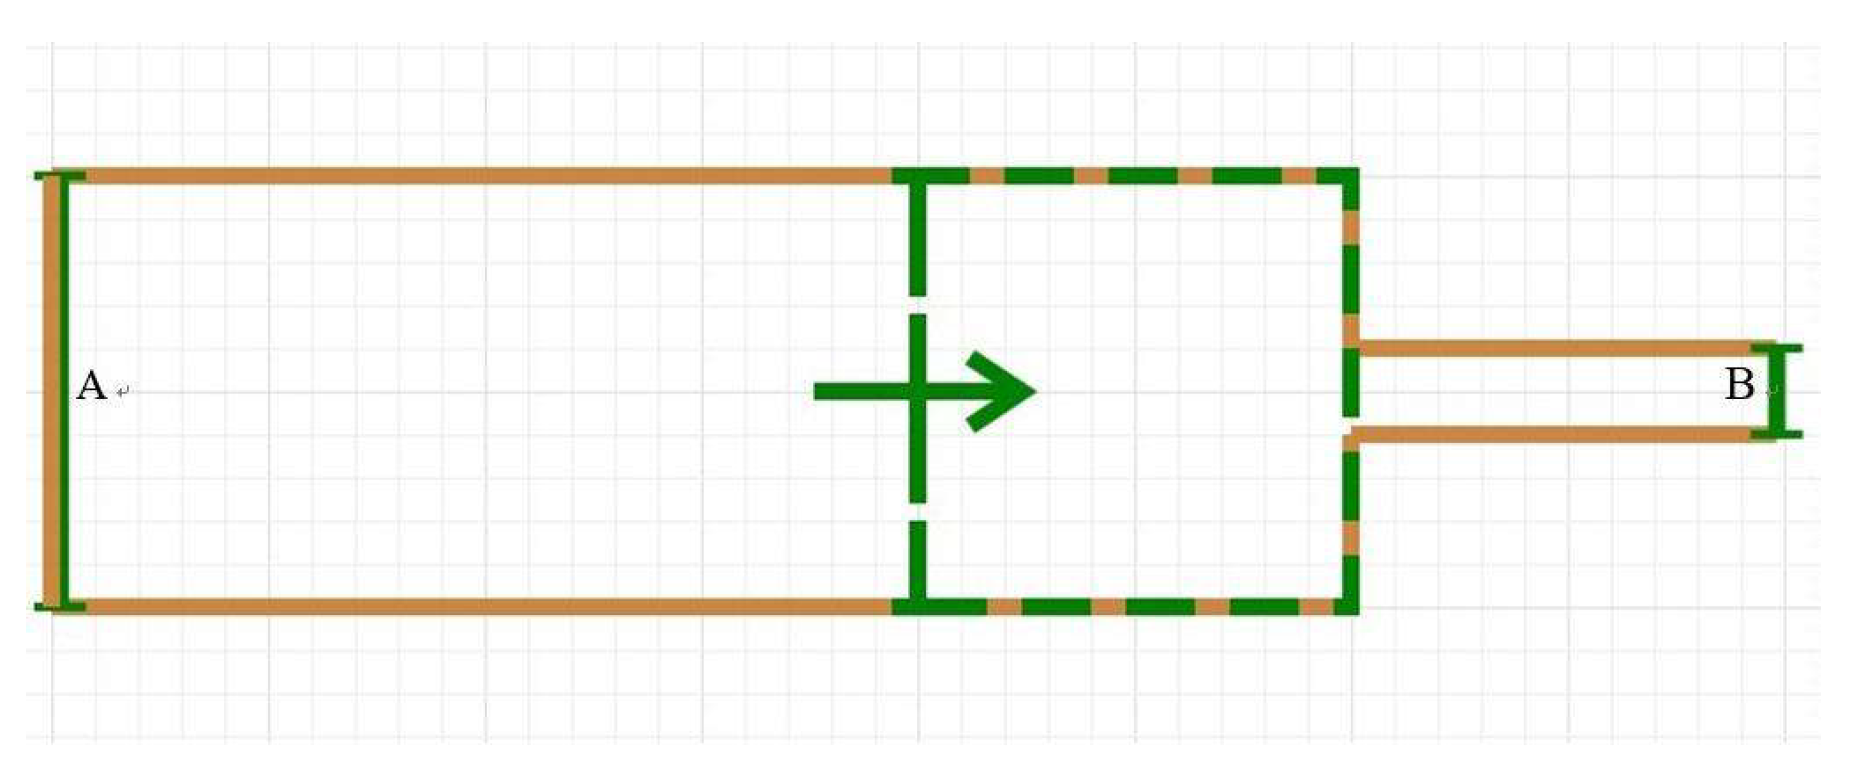
3.1. Experiment Scenario

Refer to typical transit hub bottleneck (changes in width), experiment scenario was set, as shown in Figure 3. The corridor length is 10 m, which is fixed. Besides, the corridor width is 5 m, 4 m and 3 m, which is variable. The bottleneck corridor length is 10 m, 5 m and 1 m, which is variable. Moreover, the bottleneck corridor width is 2 m, 1.5 m and 1 m, which is variable too. In total, 27 scenarios are set up for analysis. Pedestrian enters in experiment scenario at the entrance A, and leave at the exit B. The walking direction is indicated by the green arrow.

3.2. Pedestrian Volume

According to the Transit Capacity and Quality of Service Manual [28], the level of service of public transport corridor was divided into six level. Considering service level mostly is D in Beijing subway transit hub corridor in rush hour, 60 p/m/min is choosing as simulation flow, which is under level D. In addition, considering intermittent arrived and admit degree of experimental basic scene, the number of pedestrians in simulation experiment is set to 200.

4. Analysis of Pedestrian Arching Mechanism

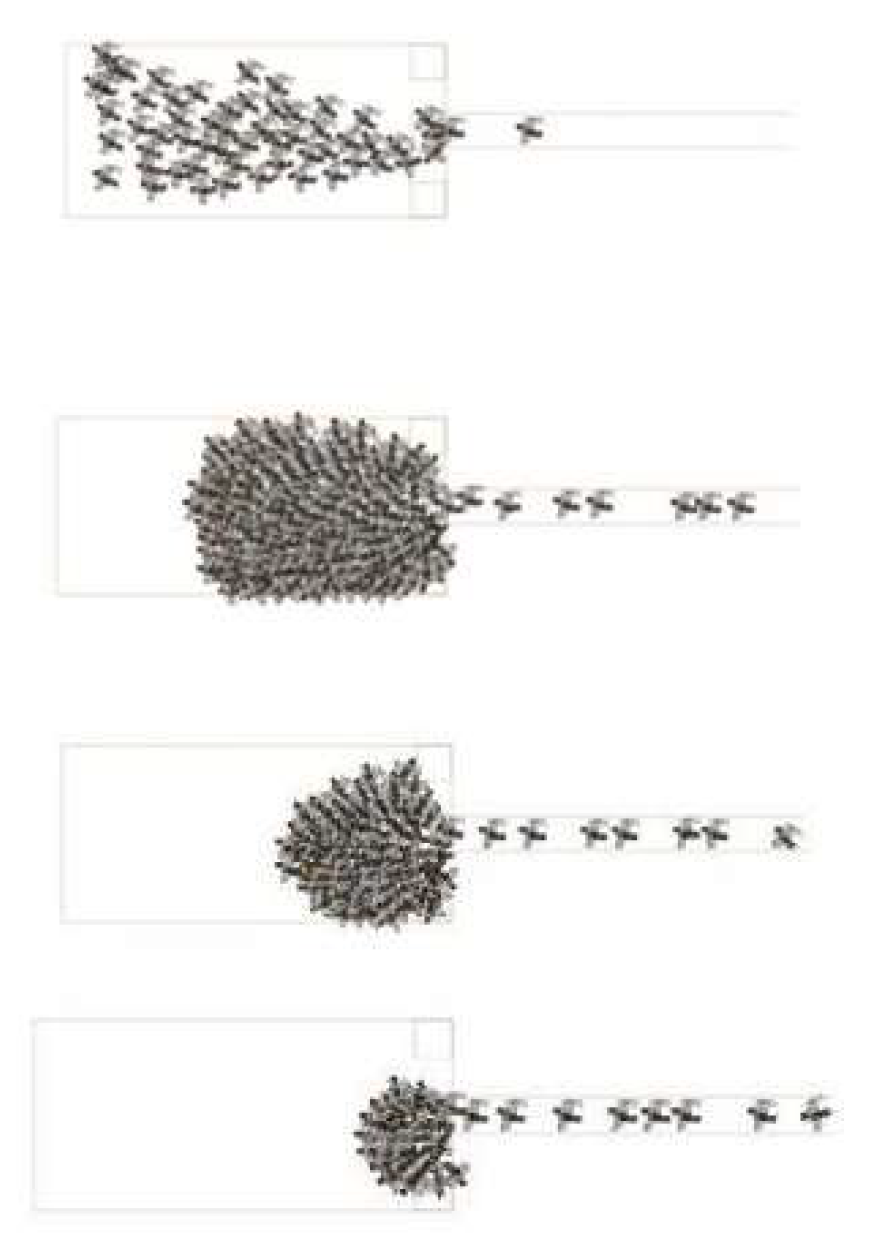
4.1. Description of Arching Phenomenon

According to the simulation results, pedestrian arching presents a common regularity, as shown in Figure 4. When pedestrian density is low, pedestrians walk straight to the bottleneck entrance. As the number of pedestrians gradually increased, the density of the pedestrian increased too. Then pedestrians start queuing in line, appearing an arching phenomenon at the bottleneck entrance. Due to the periodicity of the pedestrian flow in subway transit hub, when pedestrian arching reaches a certain length, the dissipation is beginning.

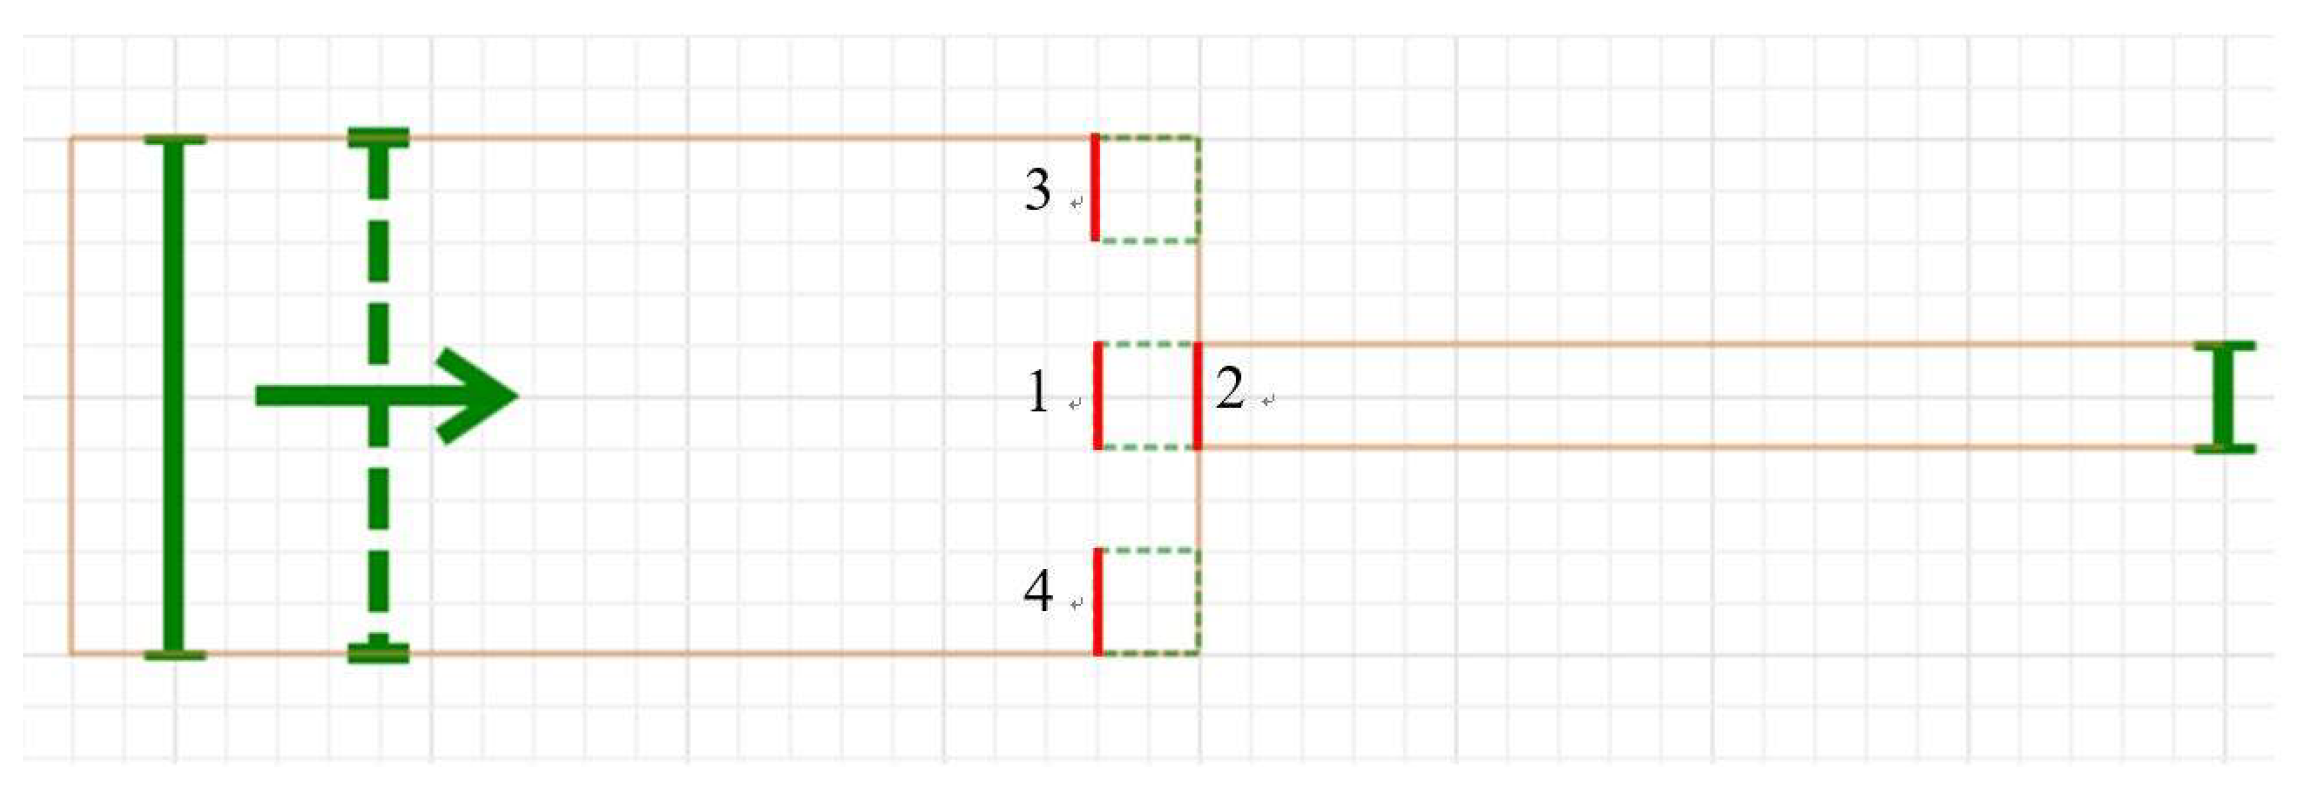
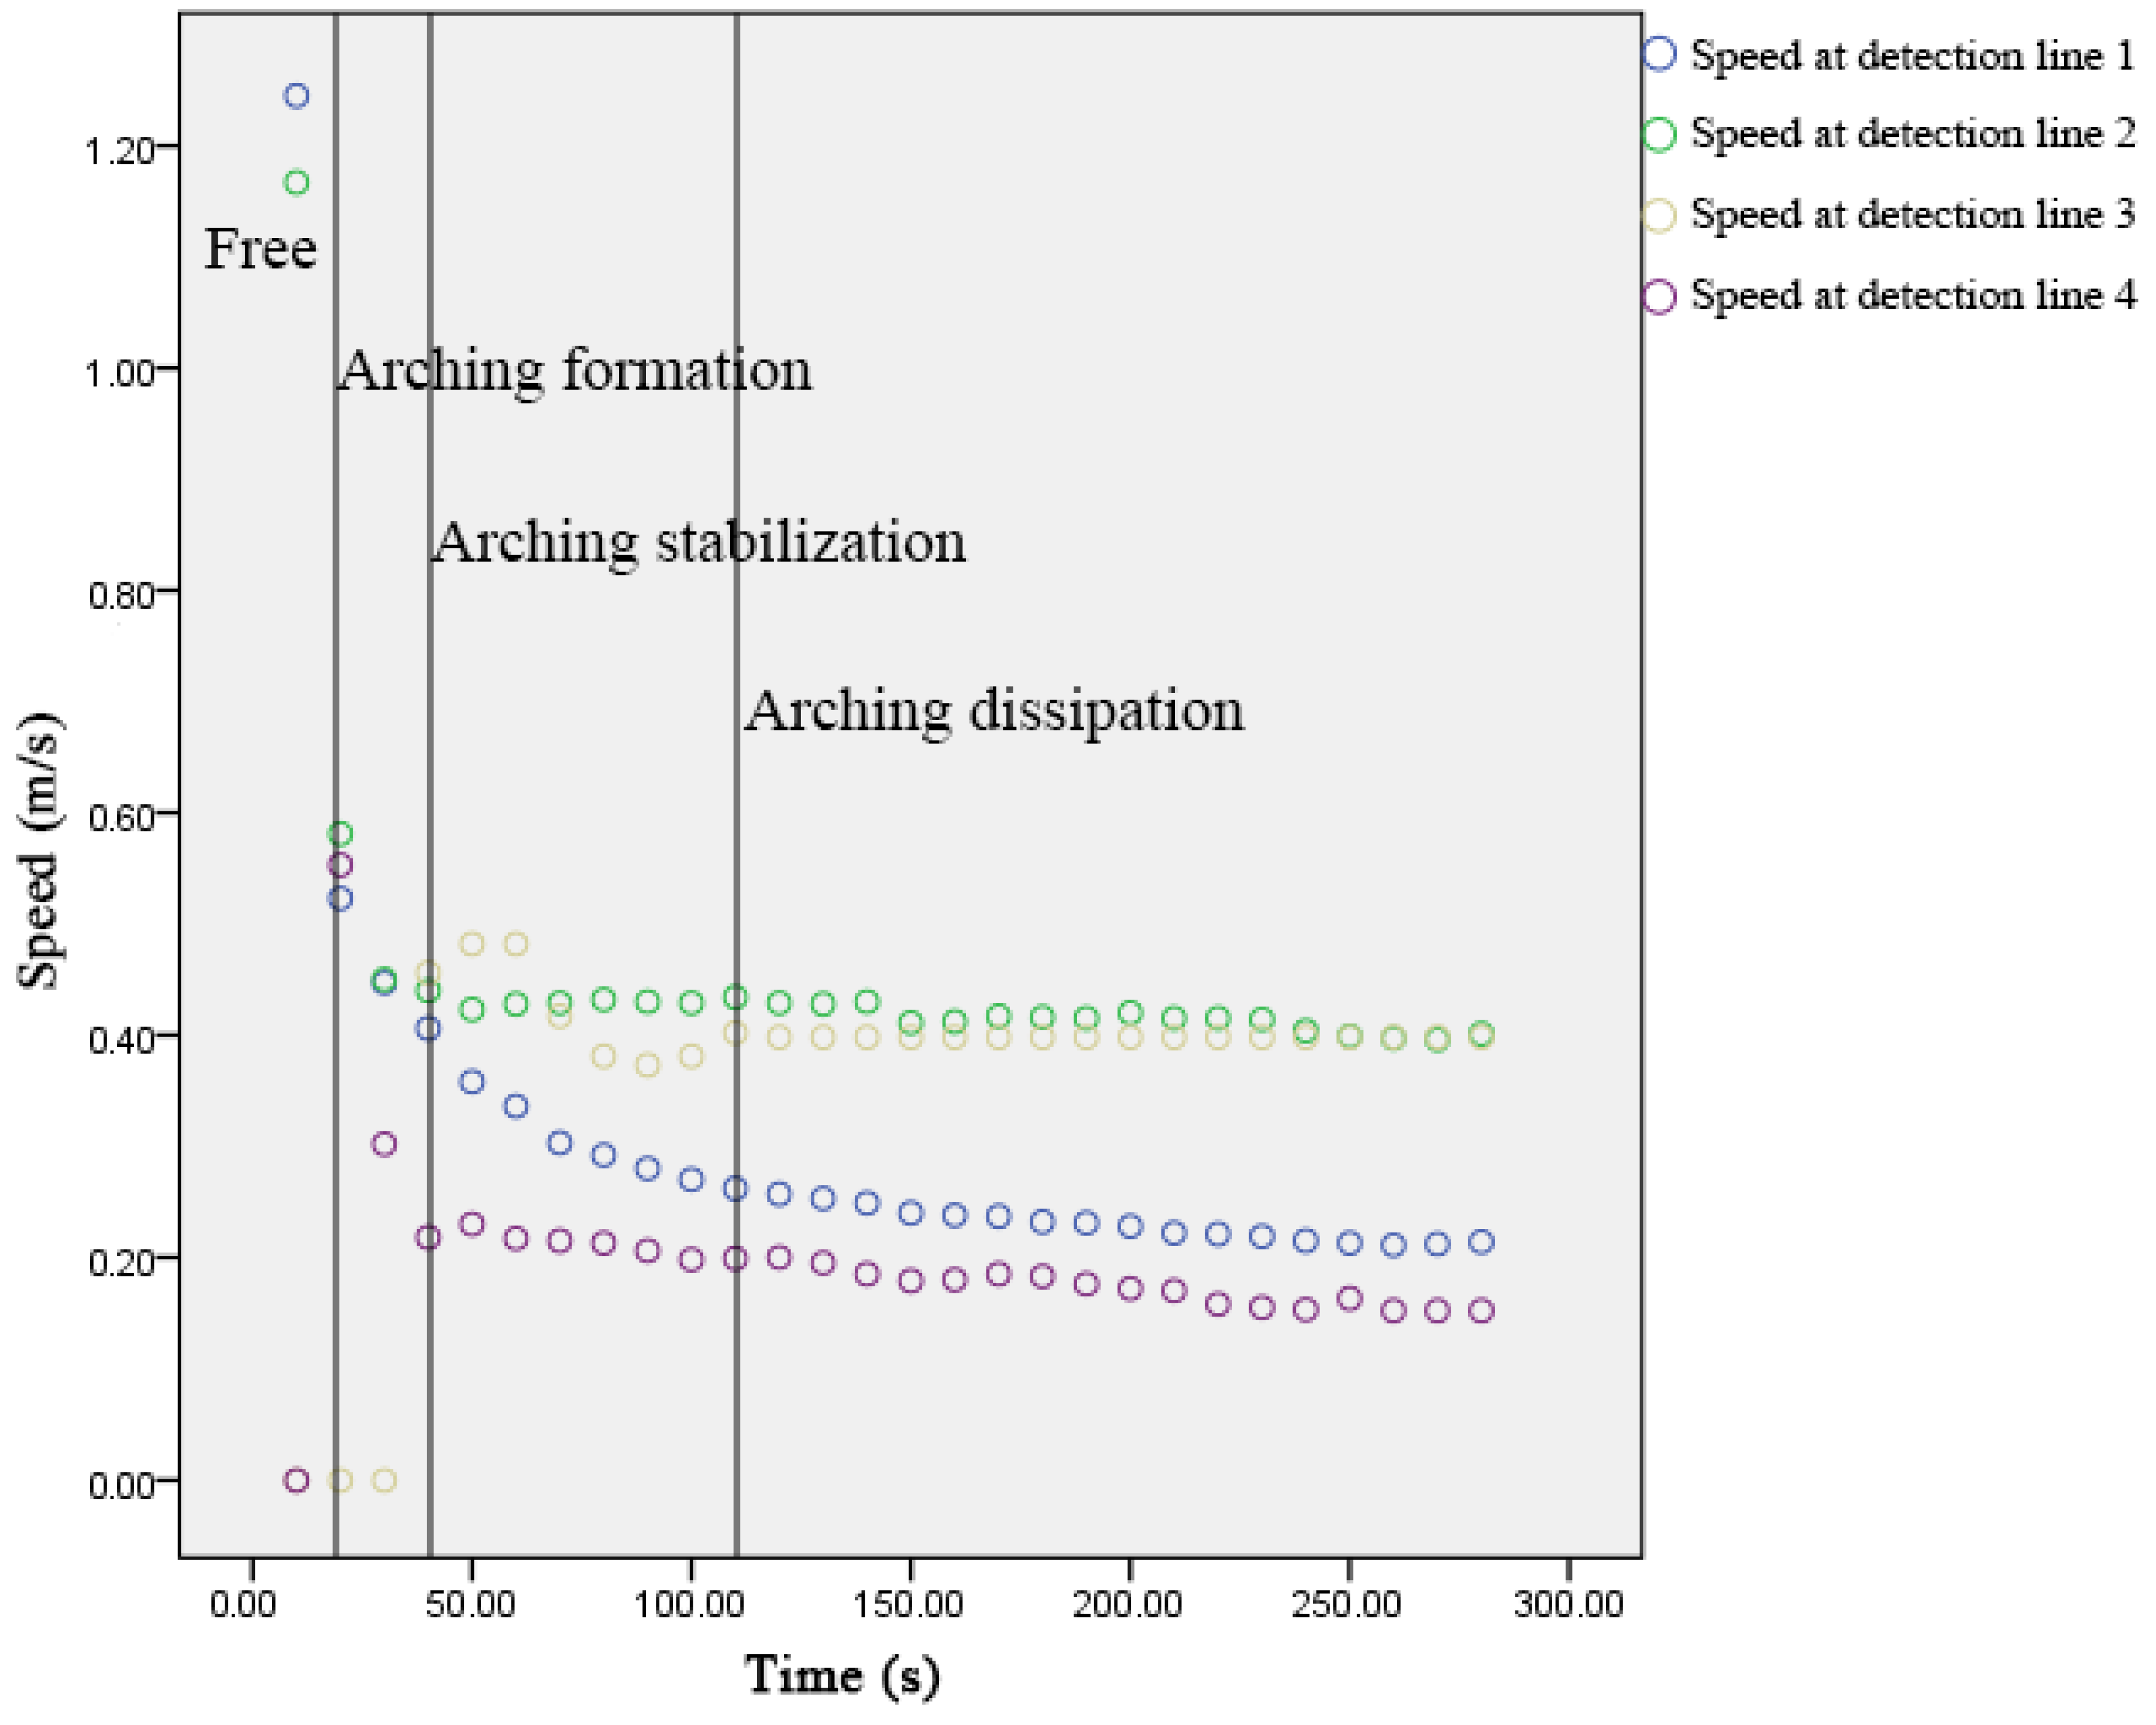
4.2. Stage Division of the Arching Evolutionary

In order to analyze the evolution of the pedestrian arching further, speed detection lines were set at the position of 1, 2, 3 and 4 in the simulation scenario, as shown in Figure 5. Each detection line is 1 m wide.
According to the simulation results, some interesting facts are summarized.
(1)
When the arching phenomenon is not occurred yet, pedestrian speed is higher at detection line 1 and 2. However, as the arching phenomenon occurred, pedestrian speed is decreased significantly at detection line 1 and 2. Then, speed is beginning to flatten.
(2)
At first, there are no pedestrians pass through detection line 3 and 4. Thus, pedestrian speed is 0 at detection line 3 and 4. With the emergence of the arching, a higher pedestrian speed occurred at detection line 3 and 4. As the arching stabilizes, pedestrian speed starts to stabilize at detection line 3 and 4.
(3)
The pedestrian speed at detection line 1 is slightly lower than pedestrian speed at detection line 2, indicating that the speed of the pedestrian crossing the bottleneck is higher than the speed at the entrance of the bottleneck.
(4)
The pedestrian speed at detection line 3 is higher than pedestrian speed at detection line 4, which is related to keep to the right in china traffic. This leads to pedestrian congestion at detection line 3 is more serious than at detection line 4.
According to the change of speed, pedestrian arching phenomenon can be divided into four stages: Free, arching formation, arching stabilization, and arching dissipation, as shown in Figure 6. the phases of the process can be characterized as follow:
Free: { V 1 1 V 2 1 V 3 = 0 V 4 = 0
Arching formation: { Δ V 1 < 0 Δ V 2 < 0 Δ V 3 > 0 Δ V 4 > 0
Arching stabilization: { Δ V 1 < 0 Δ V 2 0 Δ V 3 0 Δ V 4 < 0
Arching dissipation: { Δ V 1 0 Δ V 2 0 Δ V 3 0 Δ V 4 0
where V 1 and Δ V 1 represents pedestrian speed and acceleration at detection line 1, V 2 and Δ V 2 represents pedestrian speed and acceleration at detection line 2, V 3 and Δ V 3 represents pedestrian speed and acceleration at detection line 3 and V 4 and Δ V 4 represents pedestrian speed and acceleration at detection line 4.

4.3. Passing Time

The passing time, an overall indicator of pedestrian traffic, is defined as the total time starting from the first pedestrian entering the entrance A to the departure of the last pedestrian from exit B. The total passing time T was calculated according to Equation (7).
T = t B n t A 1
where t A 1 represents the time when the first pedestrian entered the entrance A and t B n represents the time when the last pedestrian n departed from the exit B.
The passing time is an important parameter to describe the level of service and efficiency in subway transit hub. Thus, passing time is analyzed under different bottleneck scenarios. The simulation results show that with increase of width ratio, passage time presents a certain degree of increased trend. Moreover, with increase of length ratio, passage time has no significant change, as shown in Figure 7. Pearson’s correlation is used in analyzing the relation of passing time, width ratio, length ratio, as shown in Table 3. A good relationship between passing time and width ratio is seen (Pearson’s r correlation coefficient is less than 0.05). There is no correlation between the passing time and length ratio (Pearson’s r correlation coefficient is more than 0.05). The correlation results show that as the width ratio is different, the passing time would show the correlation change.
To clear the specific relevance of width ratio and passing time, function fitting is conducted to observe the trend. Function model is as following.
T = 48.081 w + 64.322 = 48.081 w 1 w 2 + 64.322
R 2 =   0 . 7223
where T is total passing time, s; w is width ratio of corridor and corridor bottleneck; w 1 is corridor width, m and w 2 is corridor bottleneck width, m.

5. Conclusions

This paper focuses on pedestrians arching phenomenon at bottleneck in subway transit hub. After discussing the characteristics and advantages of the current mainstream pedestrian simulation models, social force model is choosing to construct the bottleneck scenario. Moreover, movement preference characteristic in subway transit hub is considered to model. Then, simulations and experimental studies is carried out, which is used to conduct the quantitative analysis of pedestrians arching mechanism at bottleneck in subway transit hub. The results show that according to the change of speed, pedestrian arching phenomenon can be divided into four stages: Free, arching formation, arching stabilization and arching dissipation, which is a new insight. With the different of bottleneck width ratio, passing time presents positive correlation, which is rarely focused on in previous studies. Research results could provide theoretic support and practical reference to improve the pedestrian efficiency at bottleneck, and optimize pedestrian facilities in subway transit hub. However, this study has the limitation that more factors affecting the pedestrian behavior should be taken into building simulation model, such as gender and age. In future studies, different bottleneck scenario and different pedestrian volumes will also be considered. Besides, further mechanisms of pedestrian’s behavior can be introduced to the model, like following behavior, polite behavior and group behavior. Moreover, pedestrian behavior in some special situations can also be studied, like epidemic situation.

Author Contributions

Conceptualization, W.L.; methodology, W.L.; software, W.L.; validation, W.L., Y.W. and P.J.; formal analysis, W.L. and Y.W.; investigation, W.L.; resources, W.L.; data curation, W.L. and Y.W.; writing—original draft preparation, W.L.; writing—review and editing, W.L., Y.W. and P.J.; visualization, Y.W.; supervision, W.L.; funding acquisition, W.L. and P.J. All authors have read and agreed to the published version of the manuscript.

Funding

This research was funded by the Beijing Postdoctoral Research Foundation (No. 2020-zz-089), National Natural Science Foundation of China (No. 51578040), Importation and Development of High-Caliber Talents Project of Beijing Municipal Institutions (No. CIT&TCD20180324), which collectively funded this project.

Data Availability Statement

The data presented in this study are available on request from the corresponding author.

Conflicts of Interest

The authors declare no conflict of interest.

References

  1. Shi, Z.; Zhang, N.; Zhu, L. Understanding the Propagation and Control Strategies of Congestion in Urban Rail Transit Based on Epidemiological Dynamics Model. Information 2019, 10, 258. [Google Scholar] [CrossRef] [Green Version]
  2. Helbing, D.; Farkas, I.; Vicsek, T. Simulating dynamical features of escape panic. Nature 2000, 407, 487–490. [Google Scholar] [CrossRef] [Green Version]
  3. Li, C.; Chi, G.; Jackson, R. Neighbourhood built environment and walking behaviours: Evidence from the rural American South. Indoor Built Environ. 2018, 27, 938–952. [Google Scholar] [CrossRef] [PubMed]
  4. Lei, W.; Tai, C.; Rong, C.; Qi, X.; Zhang, L.; Cong, J. Environmental parameters and analysis of crowd flow in an academic building of a university. Indoor Built Environ. 2021, 30, 39–55. [Google Scholar] [CrossRef]
  5. Daamen, W.; Hoogendoorn, S.P. Experimental Research of Pedestrian Walking Behavior. Transp. Res. Rec. J. Transp. Res. Board 2003, 1828, 20–30. [Google Scholar] [CrossRef] [Green Version]
  6. Hoogendoorn, S.P.; Daamen, W. Pedestrian Behavior at Bottlenecks. Transp. Sci. 2005, 39, 147–159. [Google Scholar] [CrossRef]
  7. Liu, X.; Song, W.; Zhang, J. Extraction and quantitative analysis of microscopic evacuation characteristics based on digital image processing. Phys. A Stat. Mech. Its Appl. 2009, 388, 2717–2726. [Google Scholar] [CrossRef]
  8. Seyfried, A.; Steffen, B.; Klingsch, W.; Lippert, T.; Boltes, M. The Fundamental Diagram of Pedestrian Movement Revisited—Empirical Results and Modelling. In Traffic and Granular Flow’05; Springer: Berlin/Heidelberg, Germany, 2007; pp. 305–314. [Google Scholar]
  9. Seyfried, A.; Passon, O.; Steffen, B.; Boltes, M.; Rupprecht, T.; Klingsch, W. New Insights into Pedestrian Flow Through Bottlenecks. Transp. Sci. 2009, 43, 395–406. [Google Scholar] [CrossRef]
  10. Tian, W.; Song, W.; Lu, W.; Fang, Z. Experiment and analysis on microscopic characteristics of pedestrian movement in building bottleneck. Sci. China Ser. E Technol. Sci. 2011, 54, 1730–1736. [Google Scholar] [CrossRef]
  11. Sun, L.; Luo, W.; Yao, L.; Qiu, S.; Rong, J. A comparative study of funnel shape bottlenecks in subway stations. Transp. Res. Part A: Policy Pr. 2017, 98, 14–27. [Google Scholar] [CrossRef]
  12. Luo, W.; Sun, L.S.; Yao, L.Y.; Gong, Q.; Rong, J. Experimental study for optimizing pedestrian flows at bottlenecks of subway stations. Promet Traffic Transp. 2018, 30, 525–538. [Google Scholar] [CrossRef]
  13. Guo, R.Y. Simulation of spatial and temporal separation of pedestrian counter flow through a bottleneck. Phys. A Stat. Mech. Appl. 2014, 415, 428–439. [Google Scholar] [CrossRef]
  14. Li, D.; Han, B. Behavioral effect on pedestrian evacuation simulation using cellular automata. Saf. Sci. 2015, 80, 41–55. [Google Scholar] [CrossRef]
  15. Tang, M.; Jia, H.; Ran, B.; Li, J. Analysis of the pedestrian arching at bottleneck based on a bypassing behavior model. Phys. A Stat. Mech. Its Appl. 2016, 453, 242–258. [Google Scholar] [CrossRef]
  16. Li, N.; Guo, R.Y. Simulation of bi-directional pedestrian flow through a bottleneck: Cell transmission model. Phys. A Stat. Mech. Appl. 2020, 555, 124542. [Google Scholar] [CrossRef]
  17. Li, Z.H.; Xu, W.T. Pedestrian evacuation within limited-space buildings based on different exit design schemes. Saf. Sci. 2020, 124, 104575. [Google Scholar] [CrossRef]
  18. Helbing, D.; Molnár, P. Social force model for pedestrian dynamics. Phys. Rev. E 1995, 51, 4282–4286. [Google Scholar] [CrossRef] [Green Version]
  19. Xu, S.; Duh, H.B.-L. A Simulation of Bonding Effects and Their Impacts on Pedestrian Dynamics. IEEE Trans. Intell. Transp. Syst. 2009, 11, 153–161. [Google Scholar]
  20. Yuen, J.; Lee, E. The effect of overtaking behavior on unidirectional pedestrian flow. Saf. Sci. 2012, 50, 1704–1714. [Google Scholar] [CrossRef]
  21. Wang, L.; Zheng, J.-H.; Zhang, X.-S.; Zhang, J.-L.; Wang, Q.-Z.; Zhang, Q. Pedestrians’ behavior in emergency evacuation: Modeling and simulation. Chin. Phys. B 2016, 25, 118901. [Google Scholar] [CrossRef]
  22. Kolivand, H.; Rahim, M.S.; Sunar, M.S.; Fata, A.Z.A.; Wren, C. An integration of enhanced social force and crowd control models for high-density crowd simulation. Neural Comput. Appl. 2020, 2020, 1–23. [Google Scholar] [CrossRef]
  23. Yang, X.; Yang, X.; Pan, F.; Kang, Y.; Zhang, J. The effect of passenger attributes on alighting and boarding efficiency based on social force model. Phys. A Stat. Mech. Appl. 2021, 565, 125566. [Google Scholar] [CrossRef]
  24. Zhou, R.; Cui, Y.; Wang, Y.; Jiang, J. A modified social force model with different categories of pedestrians for subway station evacuation. Tunn. Undergr. Space Technol. 2021, 110, 103837. [Google Scholar] [CrossRef]
  25. Yang, Z.F. Study on Characteristic of High Density Pedestrian Conflict Behavior in Subway Transit Hub; Beijing University of Technology: Beijing, China, 2014. [Google Scholar]
  26. Henderson, L.F.; Lyons, D.J. Sexual differences in human crowds motion. Nature 1972, 240, 353–355. [Google Scholar] [CrossRef] [PubMed]
  27. Li, D.; Han, B. Pedestrian Traffic; China Communication Press: Beijing, China, 2011. [Google Scholar]
  28. Transit Cooperative Research Program (TCRP). Transit Capacity and Quality of Service Manual; Transportation Research Board: Washington, DC, USA, 2003; Volume 7, pp. 23–67. [Google Scholar]
Figure 1. Pedestrian arching at bottleneck in subway transit hub.
Information 12 00164 g001
Figure 2. Schematic diagram of social force model.
Information 12 00164 g002
Figure 3. Basic scene in simulation experiment.
Information 12 00164 g003
Figure 4. Process of pedestrians into arch and dissipation.
Information 12 00164 g004
Figure 5. Setting of speed detection lines.
Information 12 00164 g005
Figure 6. Speed scatterplot for different detection position.
Information 12 00164 g006
Figure 7. Relations between bottleneck scenario and passing time. (a) scatter diagram of width ratio and passing time and (b) scatter diagram of length ratio and passing time.
Information 12 00164 g007
Table 1. Comparison of microscopic simulation model.
Cellular Automata ModelBenefit Cost Cellular ModelMagnetic ModelSocial Force Model
Principle of walkingGridGridCoordinate systemCoordinate system
Driving forceDefine directionBenefit value of mobileAnode and cathode magnetic forceExpected speed
Influence forceUpdate ruleCost value of mobileAnode and cathode magnetic forceInteraction force
Walking spaceDiscreetDiscreetContinuousContinuous
Describe the phenomenonQueuing, self-organizationQueuingRouting searchSelf-organization and evacuation
Principia mathematicaRule basedOptimization objective basedOptimization objective basedVariance based
Calibration of model parametersAnalysis of basic dataObservationObservationObservation
Calibration of model variables0 or 1Any assignmentPhysical significancePhysical significance
ProgrammabilityEasyEasyOrdinaryDifficulty
Table 2. Classification of pedestrian static space.
GradesContact AreasNone Contact AreasPersonal Comfort ZonesActionable Areas
Equivalent diameter (m)0.2350.4570.5330.609
Table 3. Pearson’s correlation analysis
Passing TimeWidth RatioLength Ratio
Pearson’s CorrelationPassing Time1.0000.8560.022
Width Ratio0.8561.0000.000
Length Ratio0.0220.0001.000
Sig. (one-tailed)Passing Time 0.0000.457
Width Ratio0.000 0.500
Length Ratio0.4570.500
NPassing Time272727
Width Ratio272727
Length Ratio272727
Publisher’s Note: MDPI stays neutral with regard to jurisdictional claims in published maps and institutional affiliations.

