Article

Tracking Light Aircraft with Smartphones at Low Altitudes

1
Department of Computing and Informatics, Faculty of Science and Technology, Bournemouth University, Poole BH12 5BB, UK
2
Institute of Flight Systems, German Aerospace Center (DLR), 38108 Braunschweig, Germany
*
Author to whom correspondence should be addressed.
Information 2021, 12(3), 105; https://doi.org/10.3390/info12030105
Submission received: 27 January 2021 / Revised: 23 February 2021 / Accepted: 26 February 2021 / Published: 2 March 2021

Abstract

:
Most aircraft in the world are tracked by various surveillance radar systems. Currently there is no legal requirement for light aircraft to be fitted with a transponder; however, this does not mean light aircraft should not be tracked. By adding a cheap, live tracking solution for light aircraft, the safety of low-flying aircraft pilots can be greatly increased. The radio operators who coordinate the aircraft can have an improved understanding of the air traffic and in the event of an emergency, the position of the aircraft can be relayed to emergency services. This paper proposes an approach to use a smartphone as an aircraft transponder to improve the radar tracking capabilities of low-flying aircraft. This study presents a practical and effective approach as well as a prototype implementation. The study includes the development of the three main components: (1) A mobile application that transforms a smartphone into an aircraft transponder; exploiting the GPS functionalities, (2) a desktop application that visualizes the aircraft data in real time on a map, and (3) a backend that bridges the mobile and the desktop application. To evaluate the study, flight tests were performed in a real aircraft over the Isle of Wight in the UK.

1. Introduction

Most aircraft in the world are tracked by various Secondary Surveillance Radar (SSR) technologies, the most common being Automatic Dependent System-Broadcast (ADS-B) and Mode-S. SSR refers to the system which tracks aircraft via communication from the aircraft, meaning the tracking process is entirely reliant on the aircraft to provide their location, altitude, and more [1,2]. Primary Surveillance Radar (PSR) does not require the aircraft to provide aircraft information; instead, it derives its own information by transmitting radio waves and a timed response is made when the radio wave hits an aircraft [3]. SSRs can be at different sizes with different features and cost. For example, a MSSR M10SR atop a tower SSR [4] is larger than a Kinetic SBS-3 with a 1090 MHz antenna [5], they are both SSRs but with different abilities.
This research focuses on tracking low-flying light aircraft. It is known that the terrain greatly affects the SSR’s operations [6]. This is because the SSR works by receiving periodical ADS-B and Mode-S transmissions and at lower altitudes, the aircraft will frequently lose line of sight due to buildings, trees, and hills resulting in loss of tracking. This was reflected in the SSR as aircraft fitted with transponders would only be tracked when they were near the antenna. Our exploratory flight tests over the Isle of Wight in the UK disclosed the same issue in the antenna’s ability to receive transmissions from low-flying light aircraft. The position of the antenna leads to signals being blocked by obstacles, due to a lack of line of sight for low-altitude aircraft (see Figure 1). This may also cause major issue in terms of safety. As the untracked aircraft in an unknown position can interrupt another aircraft’s flight path or potentially result in a mid-air collision. Furthermore, in case of such an accident, it would also become more difficult for emergency services to locate their position.
A remedy to this issue is to increase the height of the antenna, to increase the line of sight; however, this may not be feasible due to cost or restrictions. Another solution is to place more antennas, this would cover the blind spots, although the issue with this is a computer and antenna would need to be placed on a lot of different areas of land, which could be costly, and receiving permission from the landowners to setup a station on their land may prove to be difficult. The application would also require additional application logic to combine data from all stations. If cities have larger SSR infrastructure, most likely due to major airports, then the coverage of the radars at different altitudes gets better so cities have good low-altitude tracking in that case [7]. However, most light aircraft, such as microlights, ultralights, and gyrocopters are not fitted with a transponder. This is likely due to cost as they range from £1500 for a basic unit, going up to £6800 for an advanced unit [8]. Furthermore, it is currently not a legal requirement for microlight aircraft to be fitted with a transponder, so many do not have one fitted [9,10].
It is important to provide some form of tracking to the radio operators, flight instructors, and the pilots. As an alternative to relying on ADS-B/Mode-S communication with small 1090 MHz antenna the cellular masts could be used to transmit data. Although it should be noted that cellular masts have limited altitude range, they do provide good coverage for low-altitude flight which is commonly performed with light aircraft. Thus, tracking can be achieved using a mobile device such as a smartphone. The mobile device is expected to have a stable connectivity at low altitudes with the cellular network. The GPS of the smartphone can then be used for localization, to acquire geographical position of the aircraft [11]. From the position alone, additional data such as ground speed can be calculated by time-stamping each message showing how far the aircraft has moved over time. The bearing of the aircraft can also be worked out in a similar way.
The current 4G GSM infrastructure fails to provide required quality of services for real-time communication. It is important to ensure the transmission packet size is small, otherwise transmissions may be dropped more frequently. However, the advances in 5G GSM can potentially bring better performance and reliability. Using the smartphone as a transponder for tracking purposes can provide a low-cost and efficient solution.
Although ADS-B has been proven to be effective in aviation surveillance and transponders/receivers are available for light aircraft, aviation surveillance and tracking light aircraft at low altitudes are still challenging and there is room for improvement [12,13,14,15]. Objective of this paper is to propose a practical and effective approach to use a smartphone as an aircraft transponder to improve the radar tracking capabilities of low-flying aircraft. This study presents a prototype implementation and simulation study as well as flight tests with crewed light aircraft.
This study proposes a three-component system architecture: (1) a mobile application that transforms a smartphone into an aircraft transponder; exploiting the GPS functionalities, (2) a desktop application that visualizes the aircraft data in real time on a map, and (3) a backend that bridges the mobile and the desktop application.
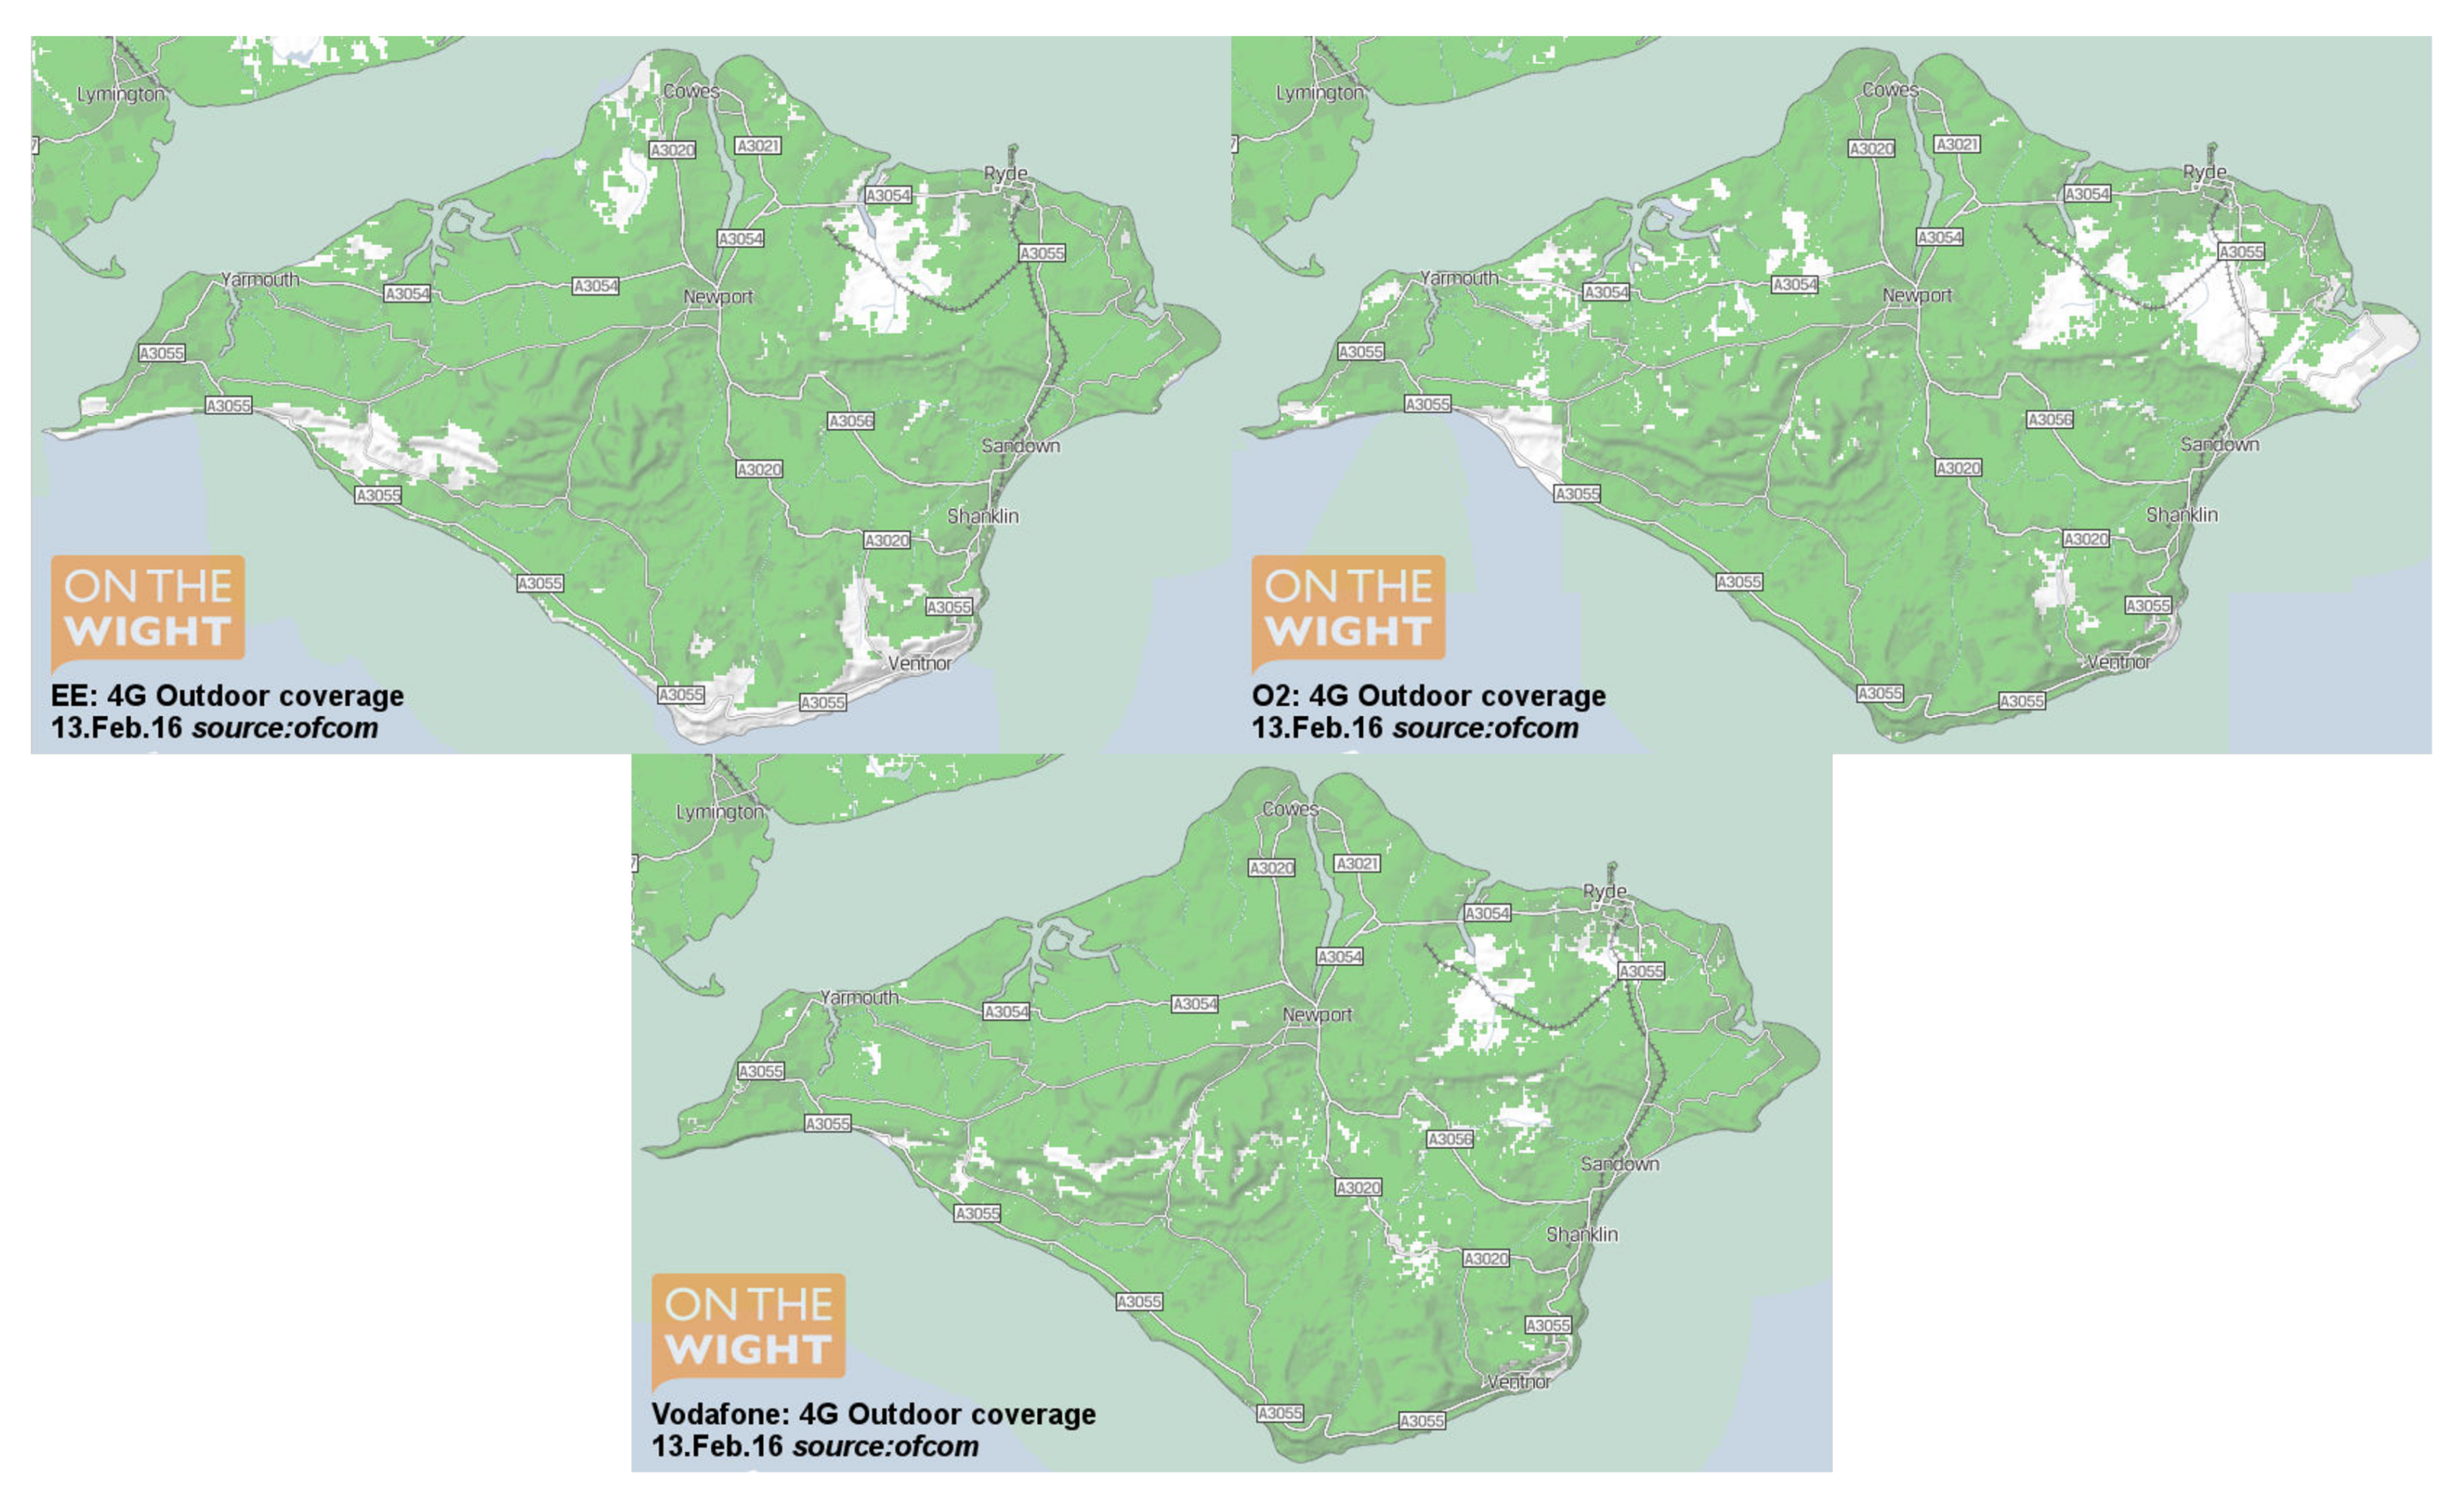
The flight testing across the diverse terrain of the Isle of Wight demonstrated conclusive evidence that the proof-of-concept implementation meets the requirements. Observing cellular coverage is important when analyzing the recorded data. Figure 2 illustrates 4G coverage of the Isle of Wight. It is observable that the Isle of Wight is very well covered according to EE, O2 and Vodafone’s coverage map in 2016 [16].
The proposed solution excels when performing at low-altitude flying, especially over hills and forests, without investing in a relatively expensive transponder. It is also important to look at the additional safety benefits. Due to the surrounding terrain, the Isle of Wight airport’s current ADS-B receiver has limited effectiveness, with aircraft frequently losing tracking as they move away from the airfield. With a cellular network in place, this tracking can be more reliably maintained to provide accurate air traffic control.
The remaining of the paper is structured as follows: Next section provides background information and related work to track aircraft as well as discusses the shortcomings such as the high costs of an aircraft transponder and the line of sight issues. Section 3 and Section 4 present the requirements analysis and system design of the proposed approach, respectively. Section 5 explains the proof-of-concept development details and relevant technologies. Section 6 presents the test results and outcome of the evaluation. Finally, last section concludes the paper and discusses the future work.

2. Background

The core principles of SSRs use surveillance techniques that rely on aircraft broadcasting their identity, position, and other aircraft information [17]. SSR receive transmissions from aircraft, as it is reliant on the aircraft to provide data, meaning no other artefacts will be falsely tracked by the radar. Most basic SSR will only listen for transmissions, whereas advanced SSR can perform ‘interrogations’ of aircraft to acquire additional information, this is done via a 1030 MHz instead of the standard 1090 MHz used in replies from an aircraft transponder. An SSR can interrogate an aircraft on the 1030 MHz frequency, differing from the aircraft transmission on 1090 MHz. This can be done once the radar knows the 24-bit Mode-S address of the aircraft, this is a unique address which an aircraft is assigned once fitted with a transponder.
These transmissions used in interrogations have a fixed size, e.g. Comm-B is considered a 112-bit reply containing the 56-bit message field [18]. An interrogatable aircraft allows the ability to perform enhanced surveillance which can provide different information based on the Binary Data Store (BDS) which the radar requests. The three most important BDS are shown in Table 1 [19].
The ability for an aircraft to be interrogated provides extra, previously unknown information; however, the reason the aircraft is capable of performing this is due to the abilities of the computers and transponder on the aircraft. Usually, interrogations cannot be performed on light aircraft as the transponder is not capable of handling Mode-S messages. Interrogation has the benefit of sending selected data only when it is required, significantly reducing the number of transmissions that are made. Parameters such as ground speed do not necessarily need to be sent as frequently as position or altitude of the aircraft; meaning interrogation could be used.
Passive Secondary Surveillance Radar is a variation of regular SSR technology which combats the line-of-sight issues that a receiver may have by having additional passive antennas located around a region [20]. These can help increase the coverage of a particular station, as the additional antennas would communicate back to the main SSR. The additional antennas could also be set up to allow the radar system to perform interrogations of aircraft. With passive SSR a fluctuation in accuracy along the path can occur. From the radio operator’s point of view, the accuracy limitations would be acceptable if data is refined [20].
Improving air traffic surveillance has been a challenging problem for years [1]. There have been many research studies to provide and analyze air traffic data to enhance the surveillance capabilities [2,21,22]. Specifically, to track light aircraft, technical solutions with on board devices or units have been proposed in the literature [23]. However, these approaches are limited while communicating with other interfaces and devices.
Satellite tracking of aircraft is also used to track aircraft travelling across areas which have no SSRs in range [24,25]. This system has been extensively used in oceanic regions. The success of satellite tracking for aircraft in remote locations directly relates to this research due to either using satellites or triangulation with cellular towers as a method of obtaining positional data. The difference is mainly because of the method to transmit the data as the current satellite tracking used by aircraft relies on the communications satellite system to transmit data back to air traffic controllers.
The line of sight of SSR depend on the elevation angle and height of the aircraft in relation to the antenna of the SSR, which is an important factor in determining the effectiveness of the radar. This research is likely to behave similarly as passive SSR but the methods vary. Using a smartphone GPS could potentially lead to some large deviations; however, with some error-correction processing done on the receiver, this could eliminate most inaccuracies.

3. Requirements Elicitation

To capture user requirements, we used focus group and interview techniques. A focus group of light aircraft pilots, flight instructors and radio operators helped to understand the problem better and gather the requirements. Qualitative interviews throughout the development were performed as well. Once a working prototype was developed, flight tests were done, and expert opinions were analyzed in an after-action interview.
The initial interviews are done with two pilots to derive the requirements for the mobile application. Interview questions are listed in Table 2. Both pilots were interested in using a smartphone as a flight tracker but expressed their concerns about accuracy of the application. An interesting concern from the first pilot was regarding interference from the mobile phone with the radio. To address this concern, techniques for cancelling interference from a mobile device can be achieved with discontinuous transmission [26].
A further interview was conducted with a flight instructor. Their responses would be important during requirements gathering, as they will have needs for both the mobile application and the desktop application. The questions were adapted slightly from Table 2 to make the interview more applicable to the needs of the flight instructor. The questions are listed in Table 3.
The results of the interview with the flight instructor supported the results with the pilots. The exception being no map or GPS functionality in the mobile application itself and only for the desktop application which they will see. This is because students will not be allowed to rely on a GPS to help with navigation, as the license requires students to practice their ability to navigate using an aviation chart. The use of a map in the mobile application should not be considered to be a core requirement and could instead be an additional option if the pilot is not a student.
Additionally, two radio operators are interviewed to discover the features required for the desktop application. Some requirements for the application have been obtained from the flight instructor; however, additional features may be discovered. The interview questions with the radio operators can be found in Table 4.
The radio operator’s feedback from the interview suggests creating an intuitive and familiar interface, such as previously used systems to improve the usability of the system. An important feature was the ability to see additional information about an aircraft if it has been selected, including a photograph of the aircraft, as this would help the radio operators quickly identify an aircraft when the pilot requests parking and refueling information.
With the information gained through the literature survey and responses from the interviewees several requirements have been derived. Major requirements include the ones that are listed below:
  • R1. Acquire positional data (latitude, longitude, altitude) from the smartphone GPS
  • R2. Send live data from the smartphone to a server using the cellular network
  • R3. View aircraft data visually
  • R4. View aircraft information (type, photograph)
  • R5. View pilot information (name, photograph)
  • R6. Estimate ground speed of an aircraft
  • R7. Estimate vertical rate of an aircraft
  • R8. Identify the aircraft (callsign)
  • R9. Track multiple aircraft simultaneously
  • R10. Log past flights’ data
  • R11. Perform data sanitization, validation and encryption
  • R12. Have easy-to-use and user-friendly interface

4. System Design

4.1. Feature Models

4.1.1. Mobile Application

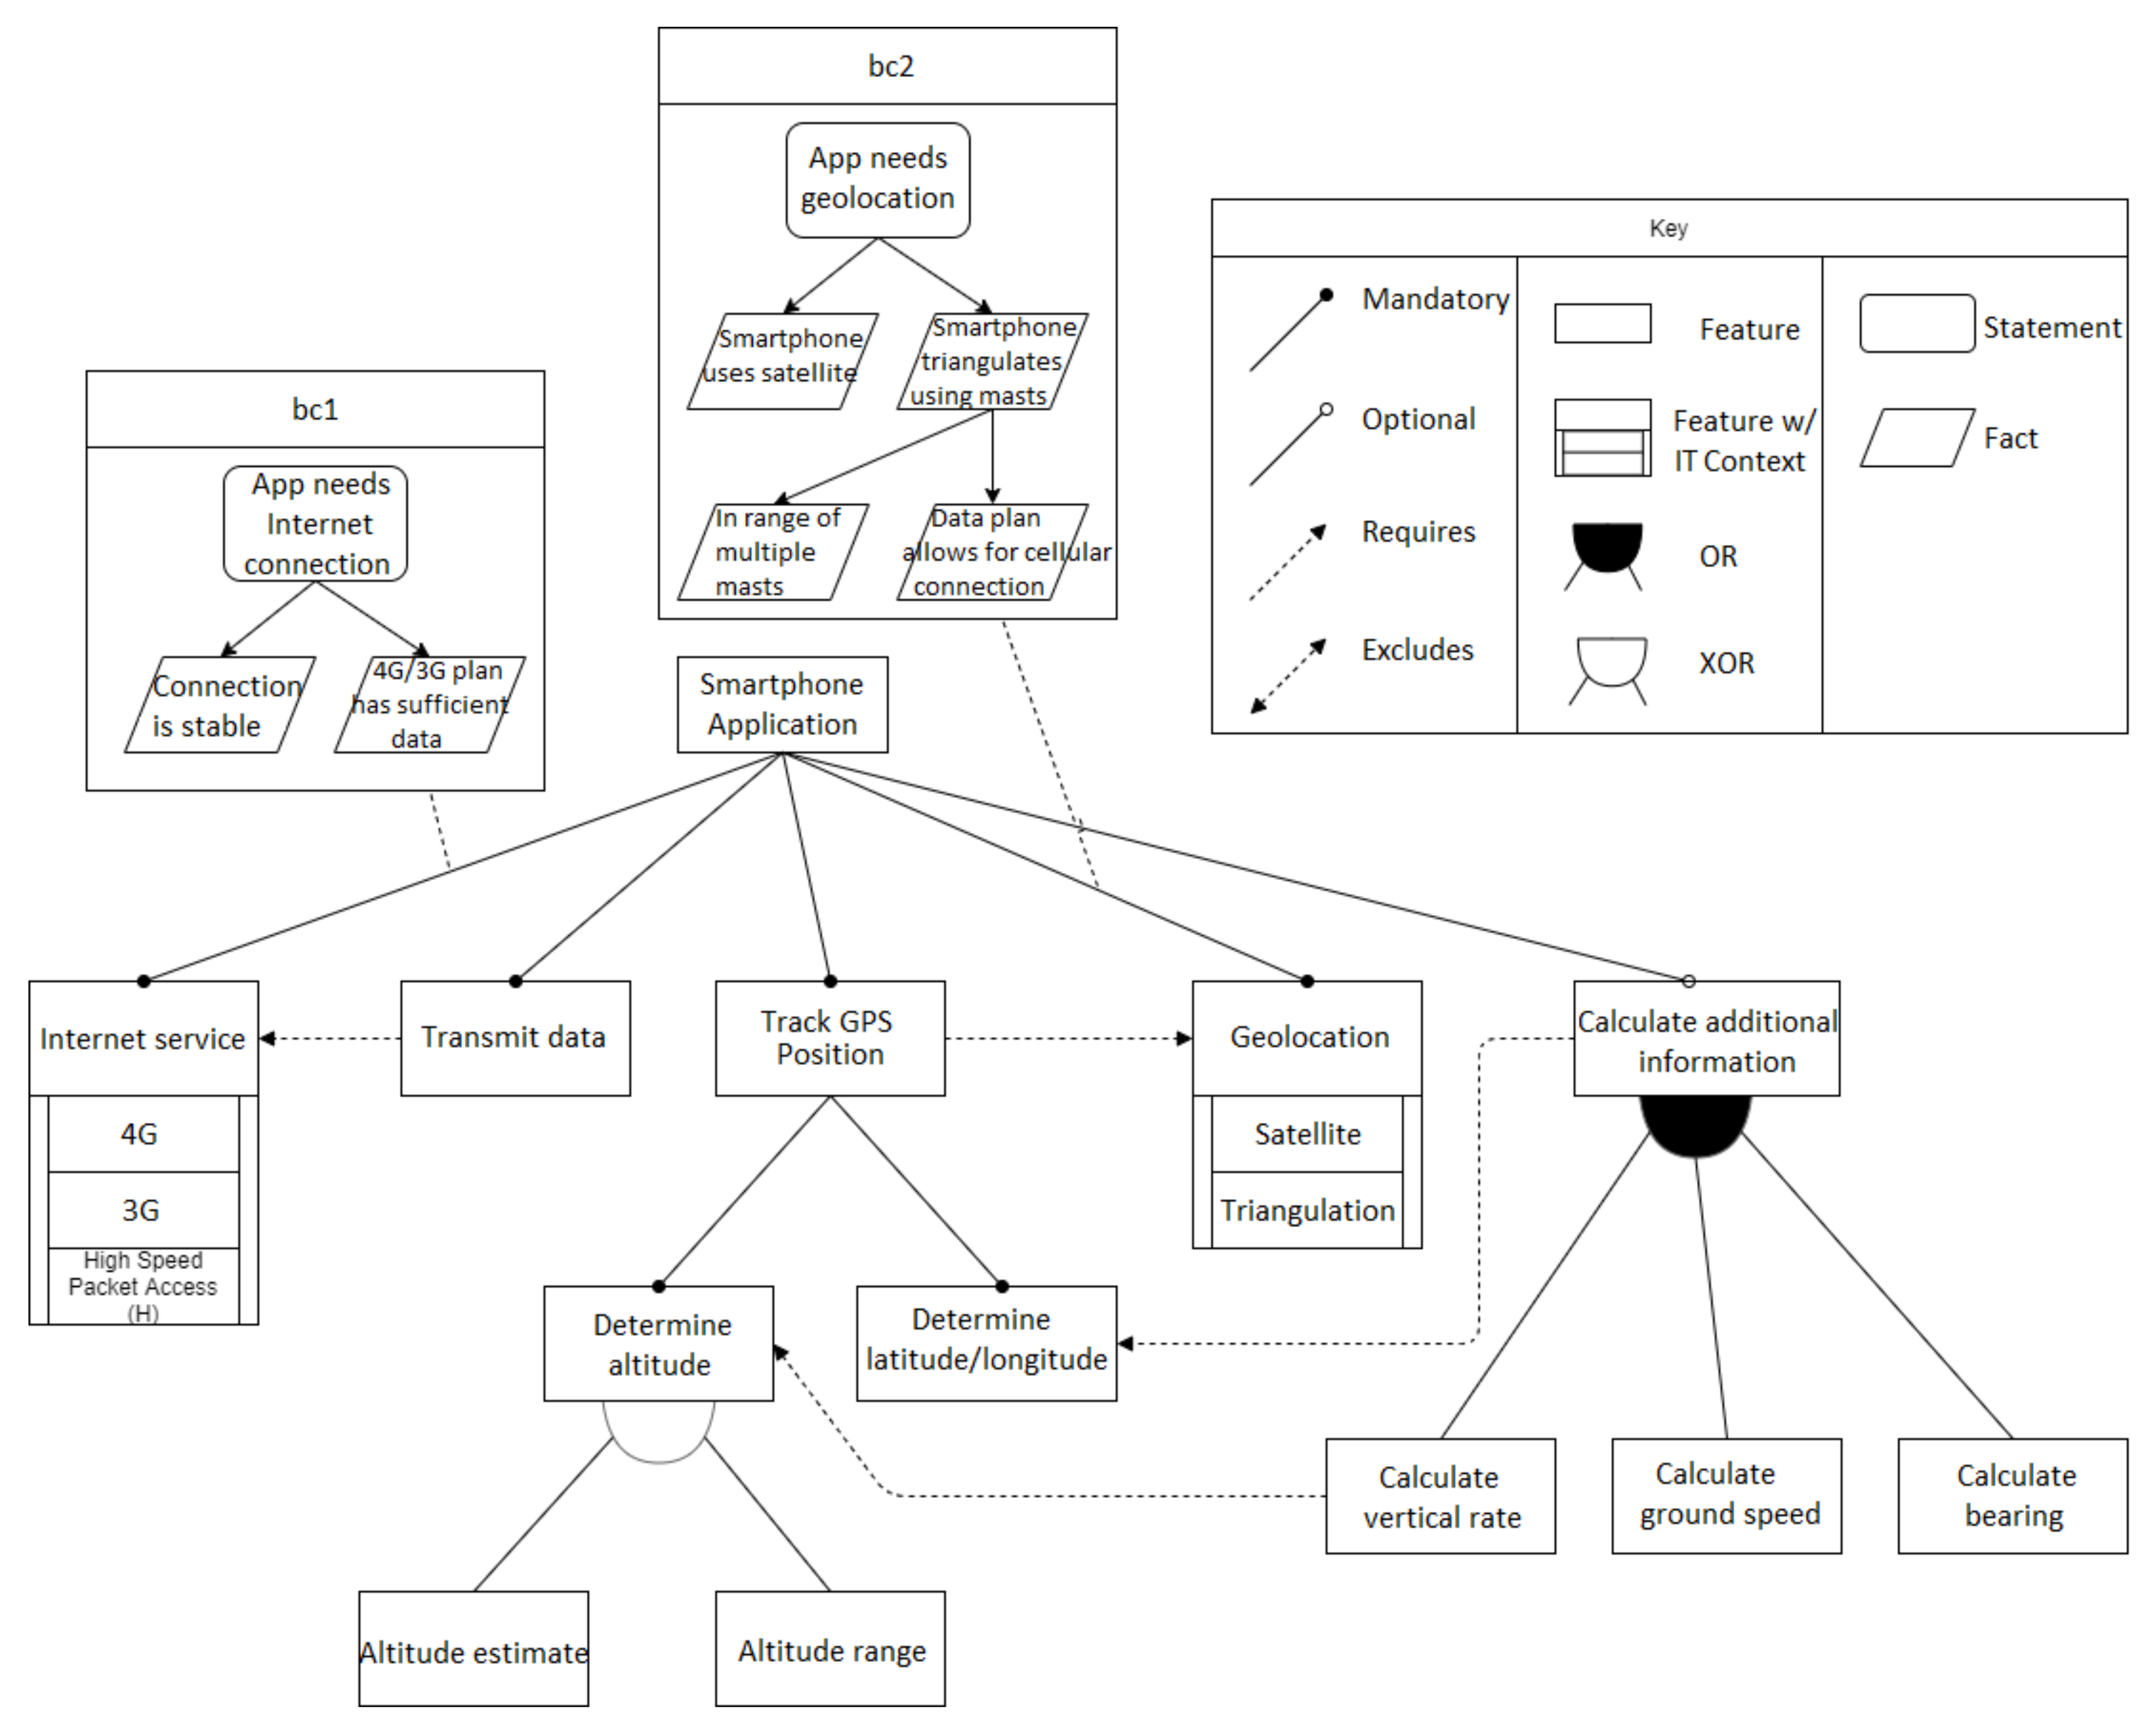
To understand the functional requirements for the smartphone application and the relationships between each feature, a feature model has been created shown in Figure 3 [27,28]. The key features are branched off from ‘smartphone application’ to show the high-level features, which are linked by either a mandatory or optional line. The features can be broken down into sub-features or even provide a choice to accomplish the task, as seen on ‘Determine altitude’ XOR is used to show the system can either choose ‘Altitude estimate’ or ‘Altitude range’ but not both.
To provide additional context, Figure 3 includes IT context, as seen on ‘Internet service’ and ‘Geolocation’, as these are potential methods to achieve the specified feature. More context is considered to be ‘bc1’ and ‘bc2’ show the necessary background required to achieve the features, which are outside of direct control, but still provide necessary considerations when designing the system. Class diagrams are developed with their relationships to further determine the structure of the mobile application.

4.1.2. Desktop Application

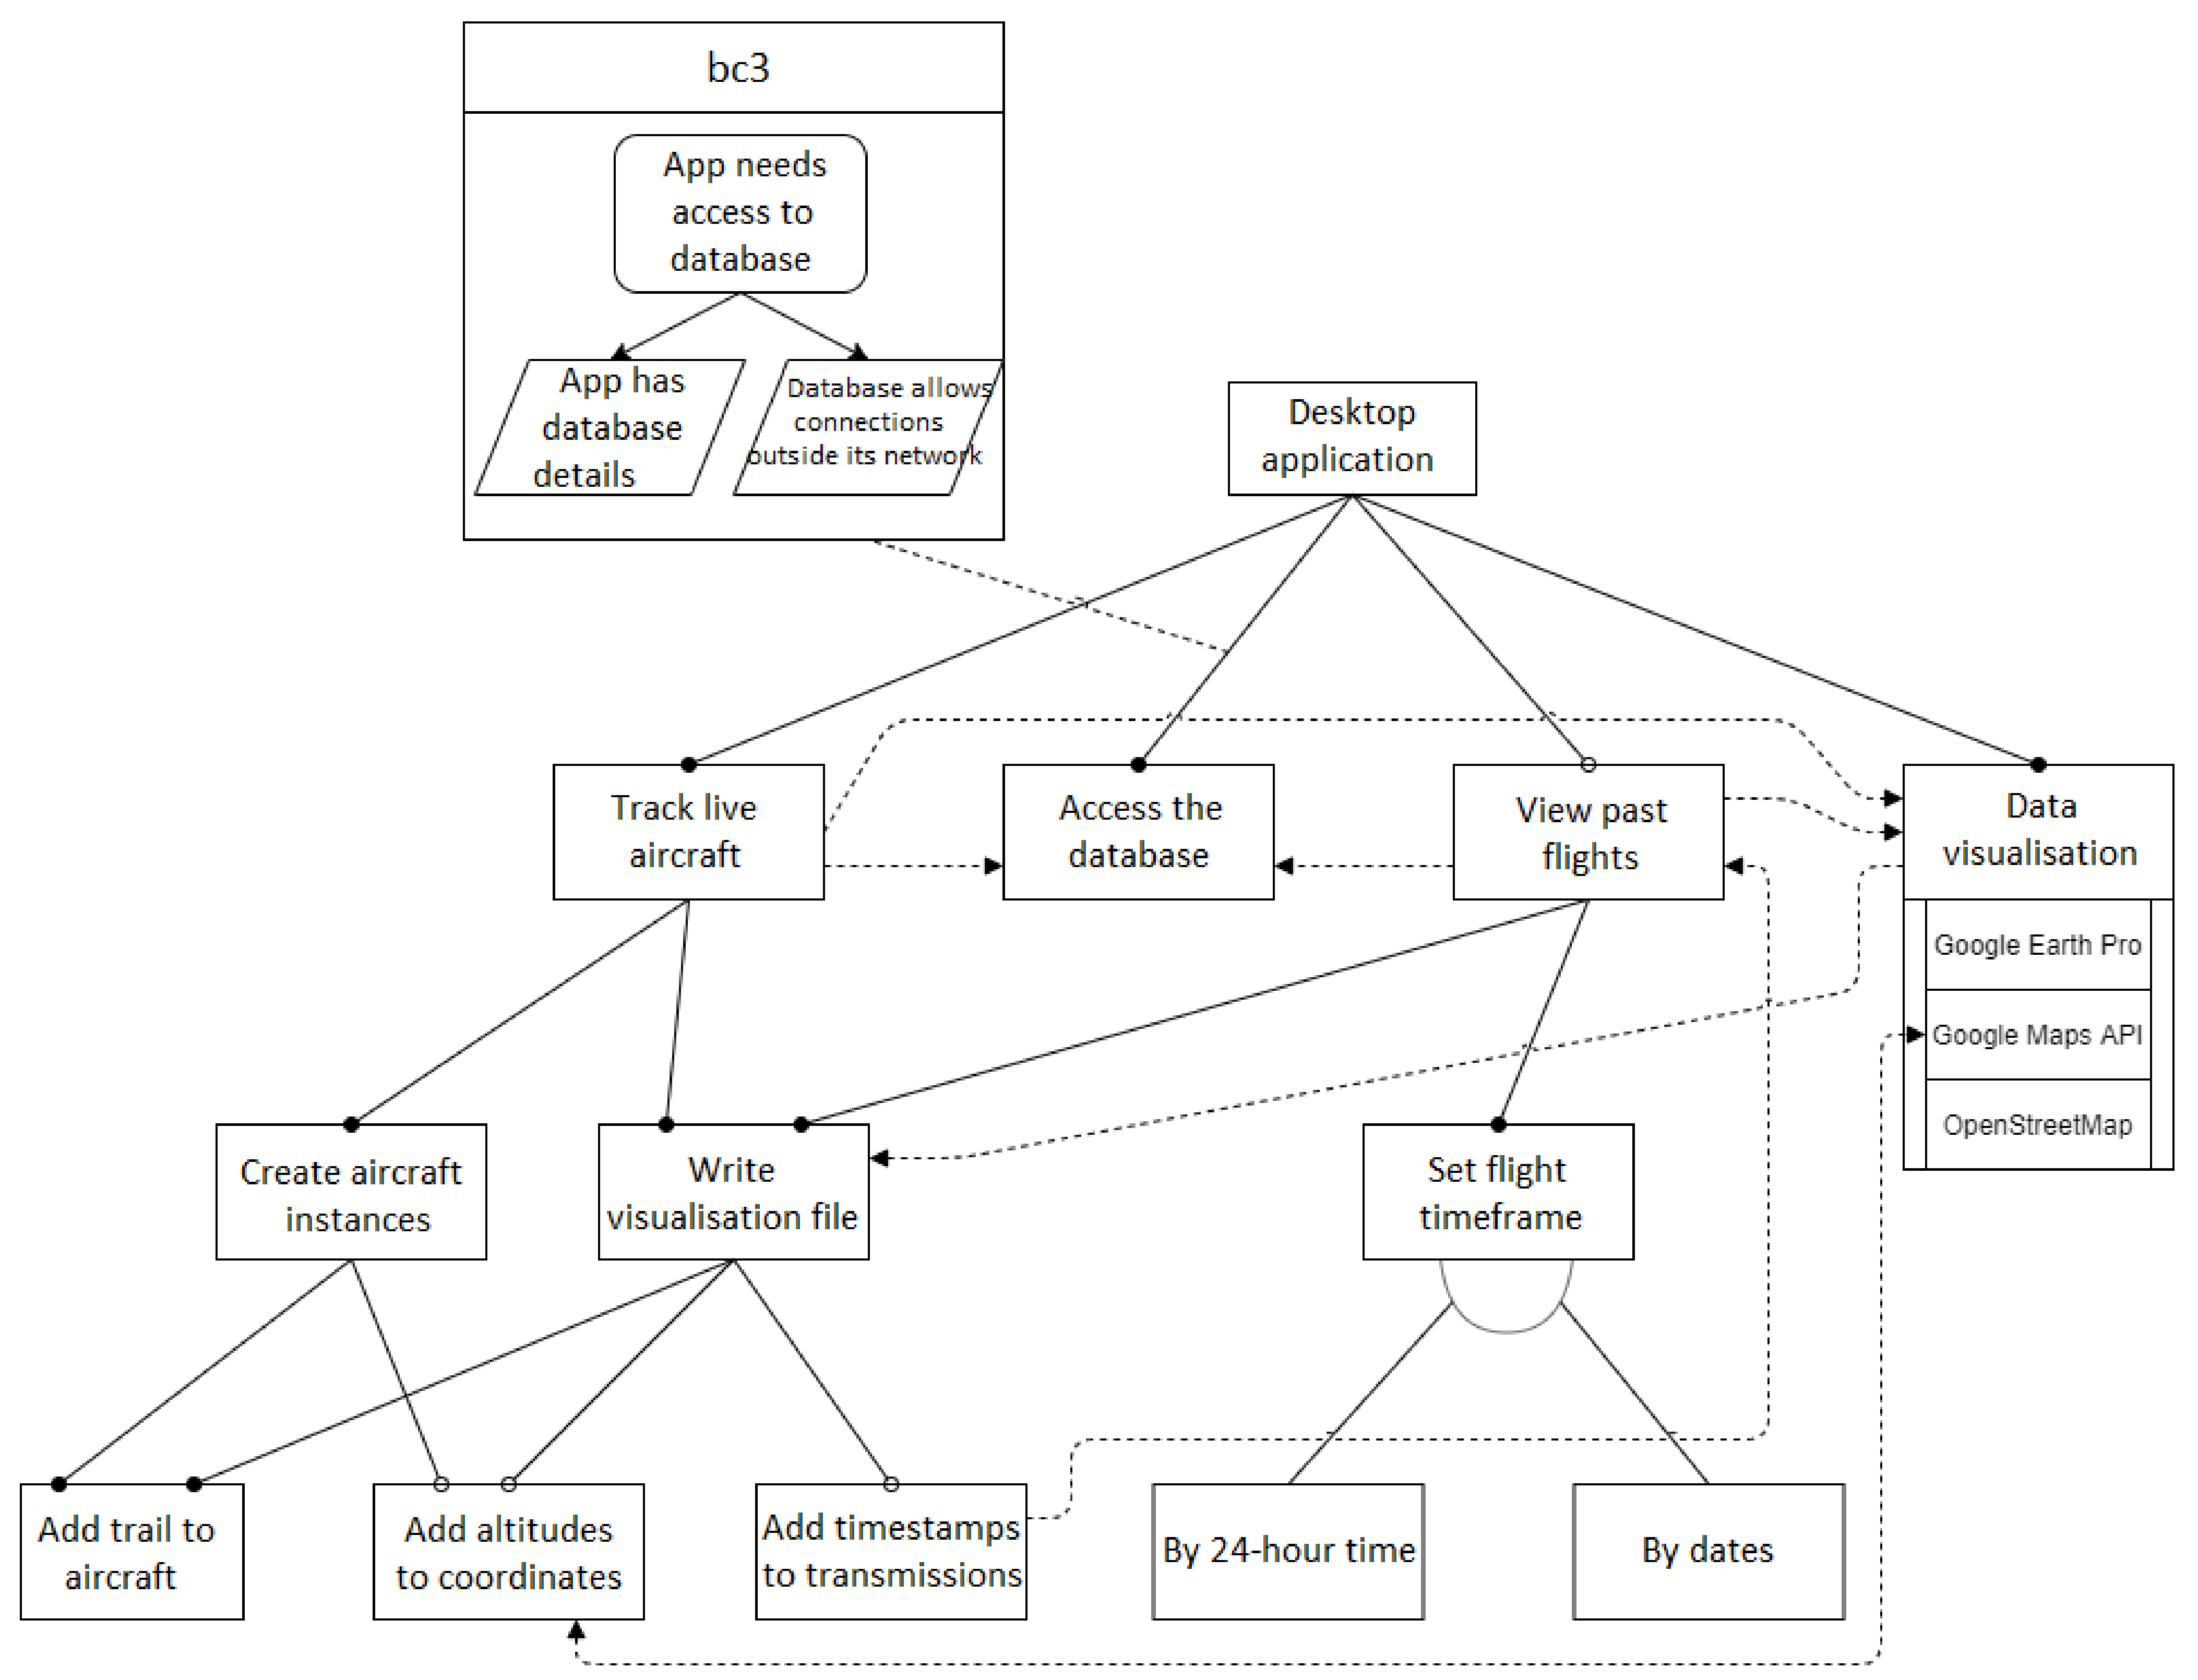
Similar to the analysis of the mobile application, the desktop application requirements can be greater understood through modeling the proposed system as a feature model as shown in Figure 4.
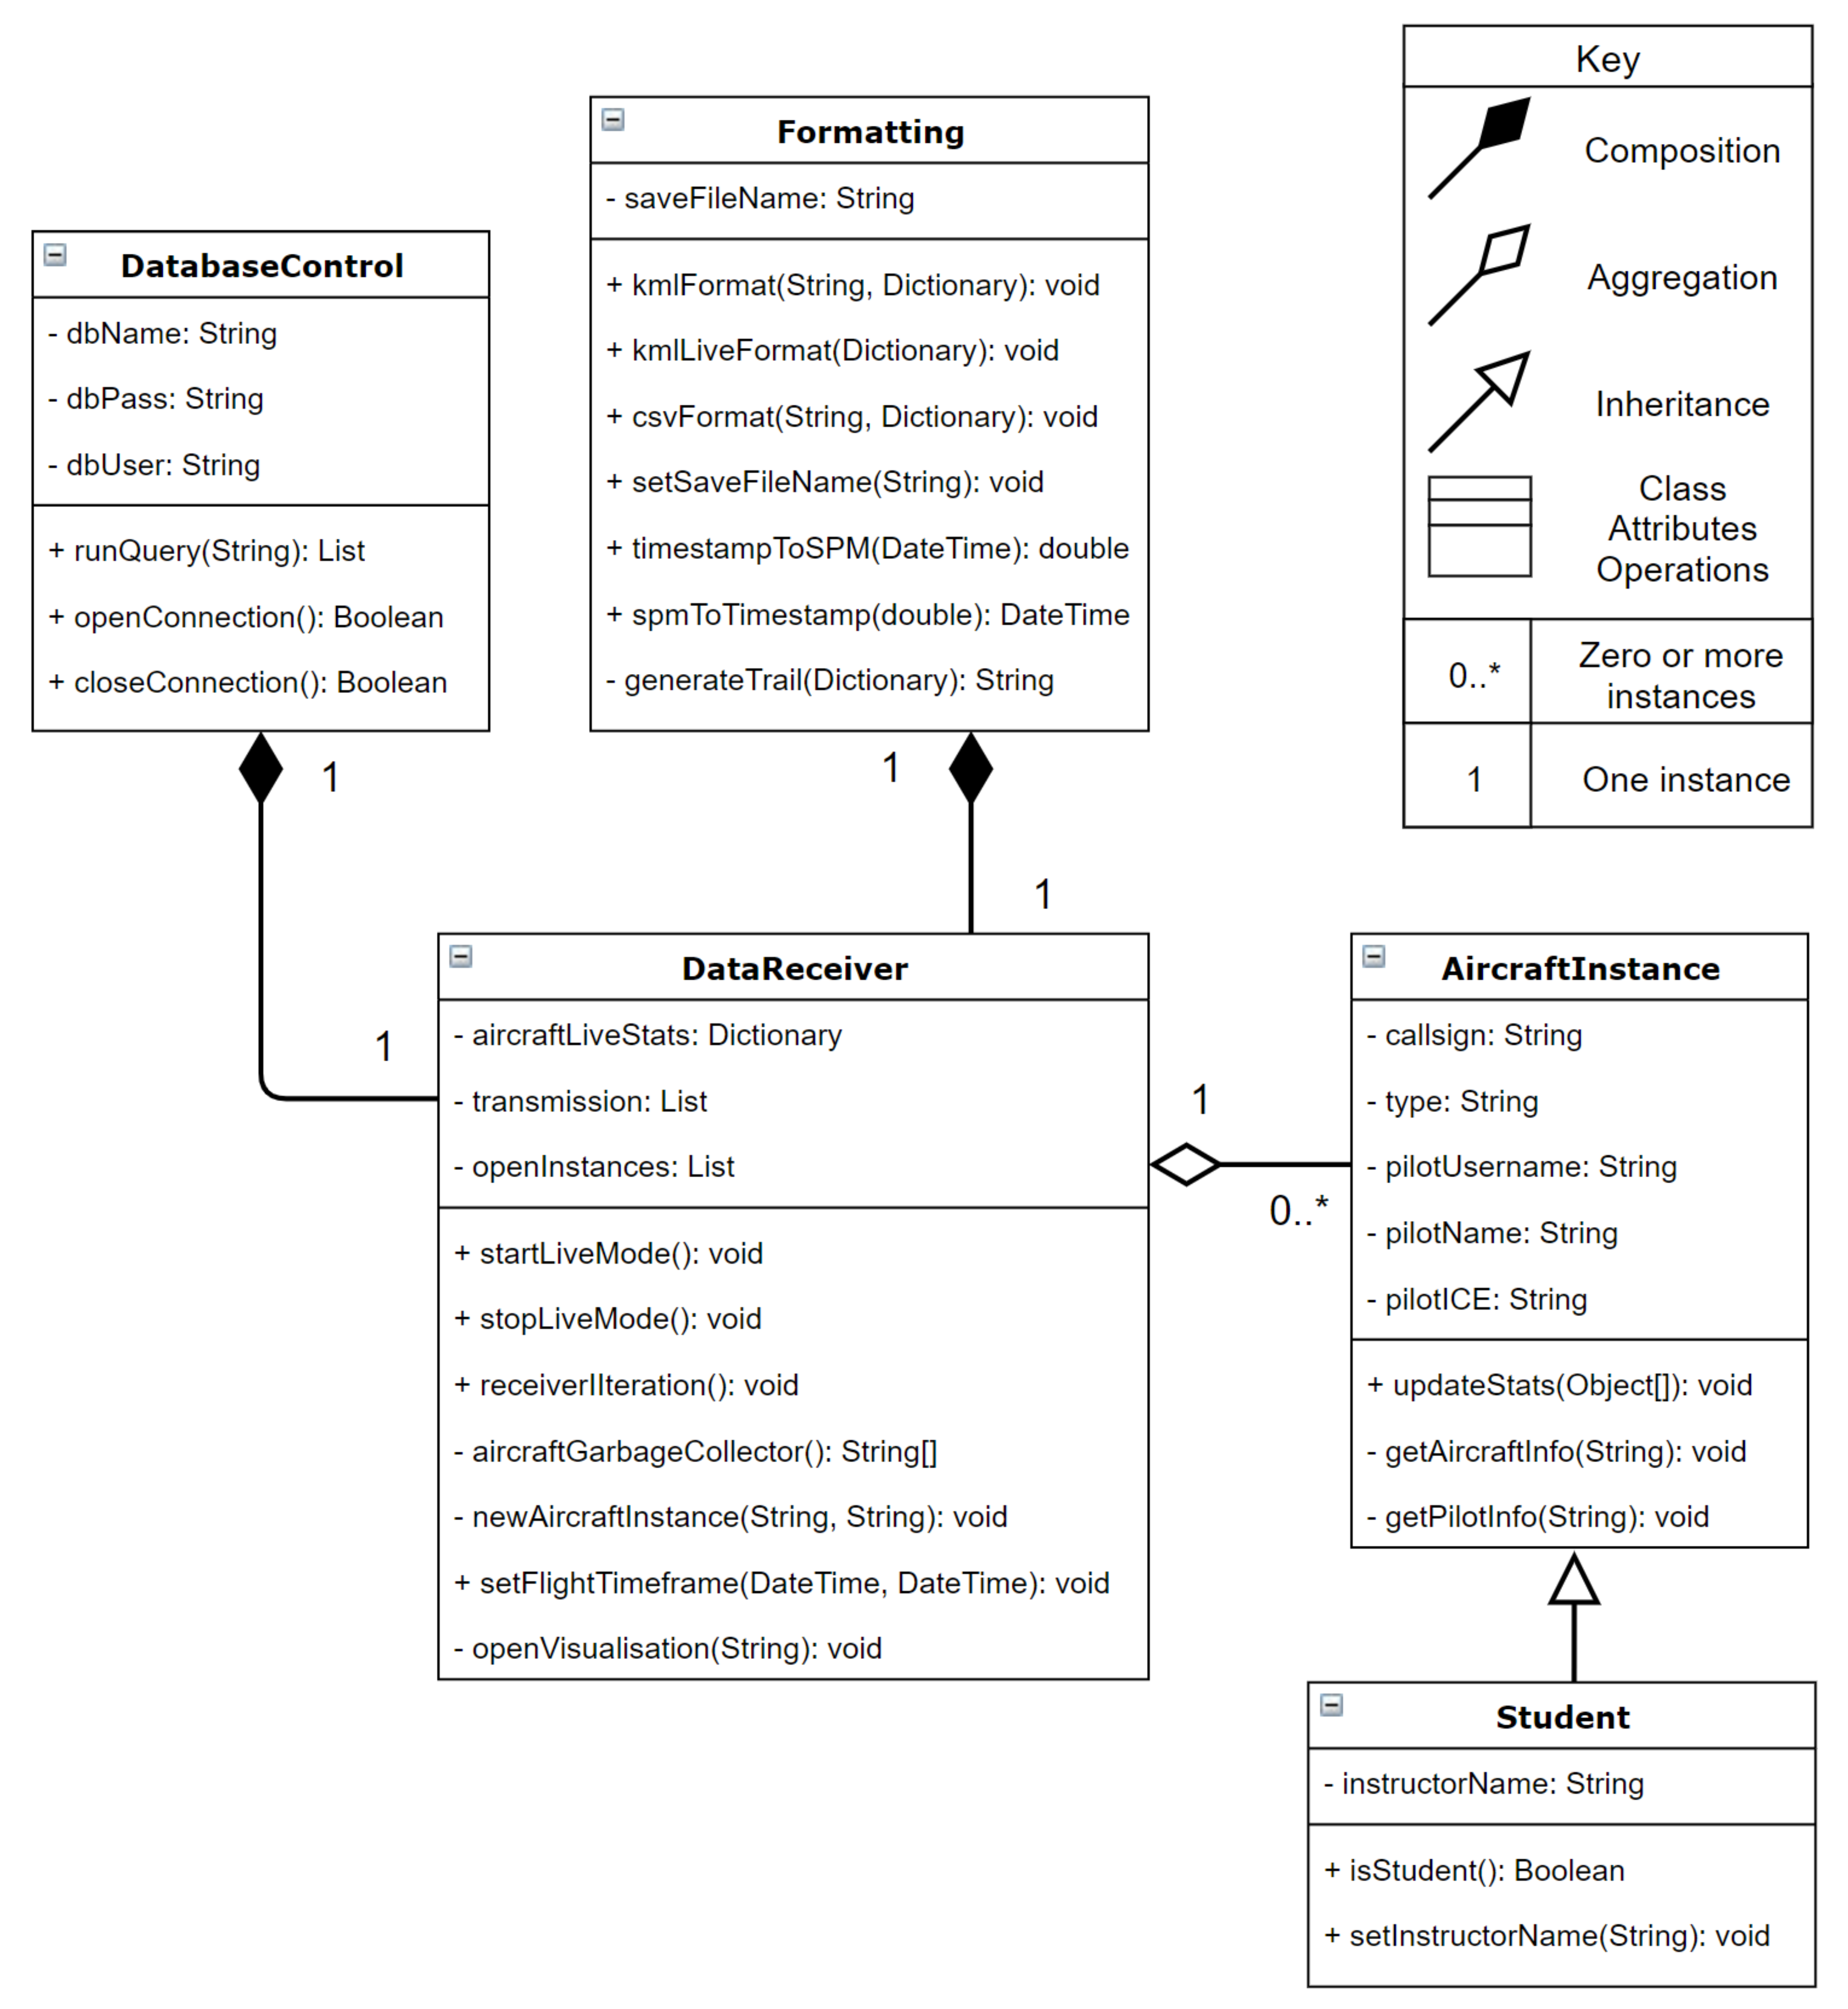
Once the features of the desktop application had been determined and considered, modeling the desktop application as a class diagram would allow for further specification of the system structure. The benefit is the consideration of the relationships between classes and the possible attributes and operations each class will perform.
Creating the class diagram given in Figure 5 has expanded the system requirements by highlighting key functionality which would not have been considered by the focus group. For example, ‘aircraftGarbageCollector()’ in class ‘DataReceiver’ was not considered previously. If the application is running for an entire day, it would become necessary to remove aircraft which have not sent any transmissions after a while. If this were not performed, memory would be unnecessarily used, slowing down the application, as well as causing the virtual map to become cluttered with old aircraft trails. This proposed method will look at each aircraft’s last timestamp and if it is more than 5 min old, then the aircraft would be removed. Another feature should be a student aircraft instance, where everything is inherited from the regular aircraft instance, but includes some additional instructor information and an operation to check if a particular instance is a student pilot, which could be used as a filter in the application.

4.1.3. Backend Web Server and Database

Backend web server handles incoming transmissions from the mobile device. The web server will then perform safety checks such as sanitization and validation on the transmissions before storing them into the database.

4.2. User Interfaces

From the requirements elicited, it is crucial for the user interface to be simple and easy-to-use. As the Agile methodology is employed, it is necessary to create prototype interfaces for potential users to test. Before a working prototype is created, a low-fidelity illustration of the interface can be used to gather feedback before constructing a high-fidelity prototype. Designing a good User Interface (UI) means the user must have a positive User Experience (UX). To achieve this, the design must be intuitive as well as properly displayed [29].

4.2.1. Mobile Application

When designing a UI for a smartphone, the following aspects are important to consider. Smartphones typically have small screens, when in comparison to a desktop computer or a tablet. Smartphones do not have the same processing power as a desktop computer, this is due to less powerful processors and lower clock speeds. Small text will be difficult to read, this is due to the small screen and the consideration which is a pilot will not be holding the device while they are flying, so the eye-to-screen distance is greater. Small buttons will be hard to press, because the screen is smaller, so all buttons should be larger. Smartphones are not a universal size, as there is not one size smartphone, the design should allow for some scalability. Hence, it would be sensible to create a user interface with minimal text and if text is used, it should be easily readable. Interactable buttons should be large and few, while relying on diagrams to represent the displayed information. Furthermore, a ‘natural’ design for the interface makes the product intuitive to use, this means UI interaction should do what the user expects. For example, clicking the start button should start a process and give appropriate feedback so that the user understands the application is functioning. An aesthetically pleasing UI should also be adopted [30].
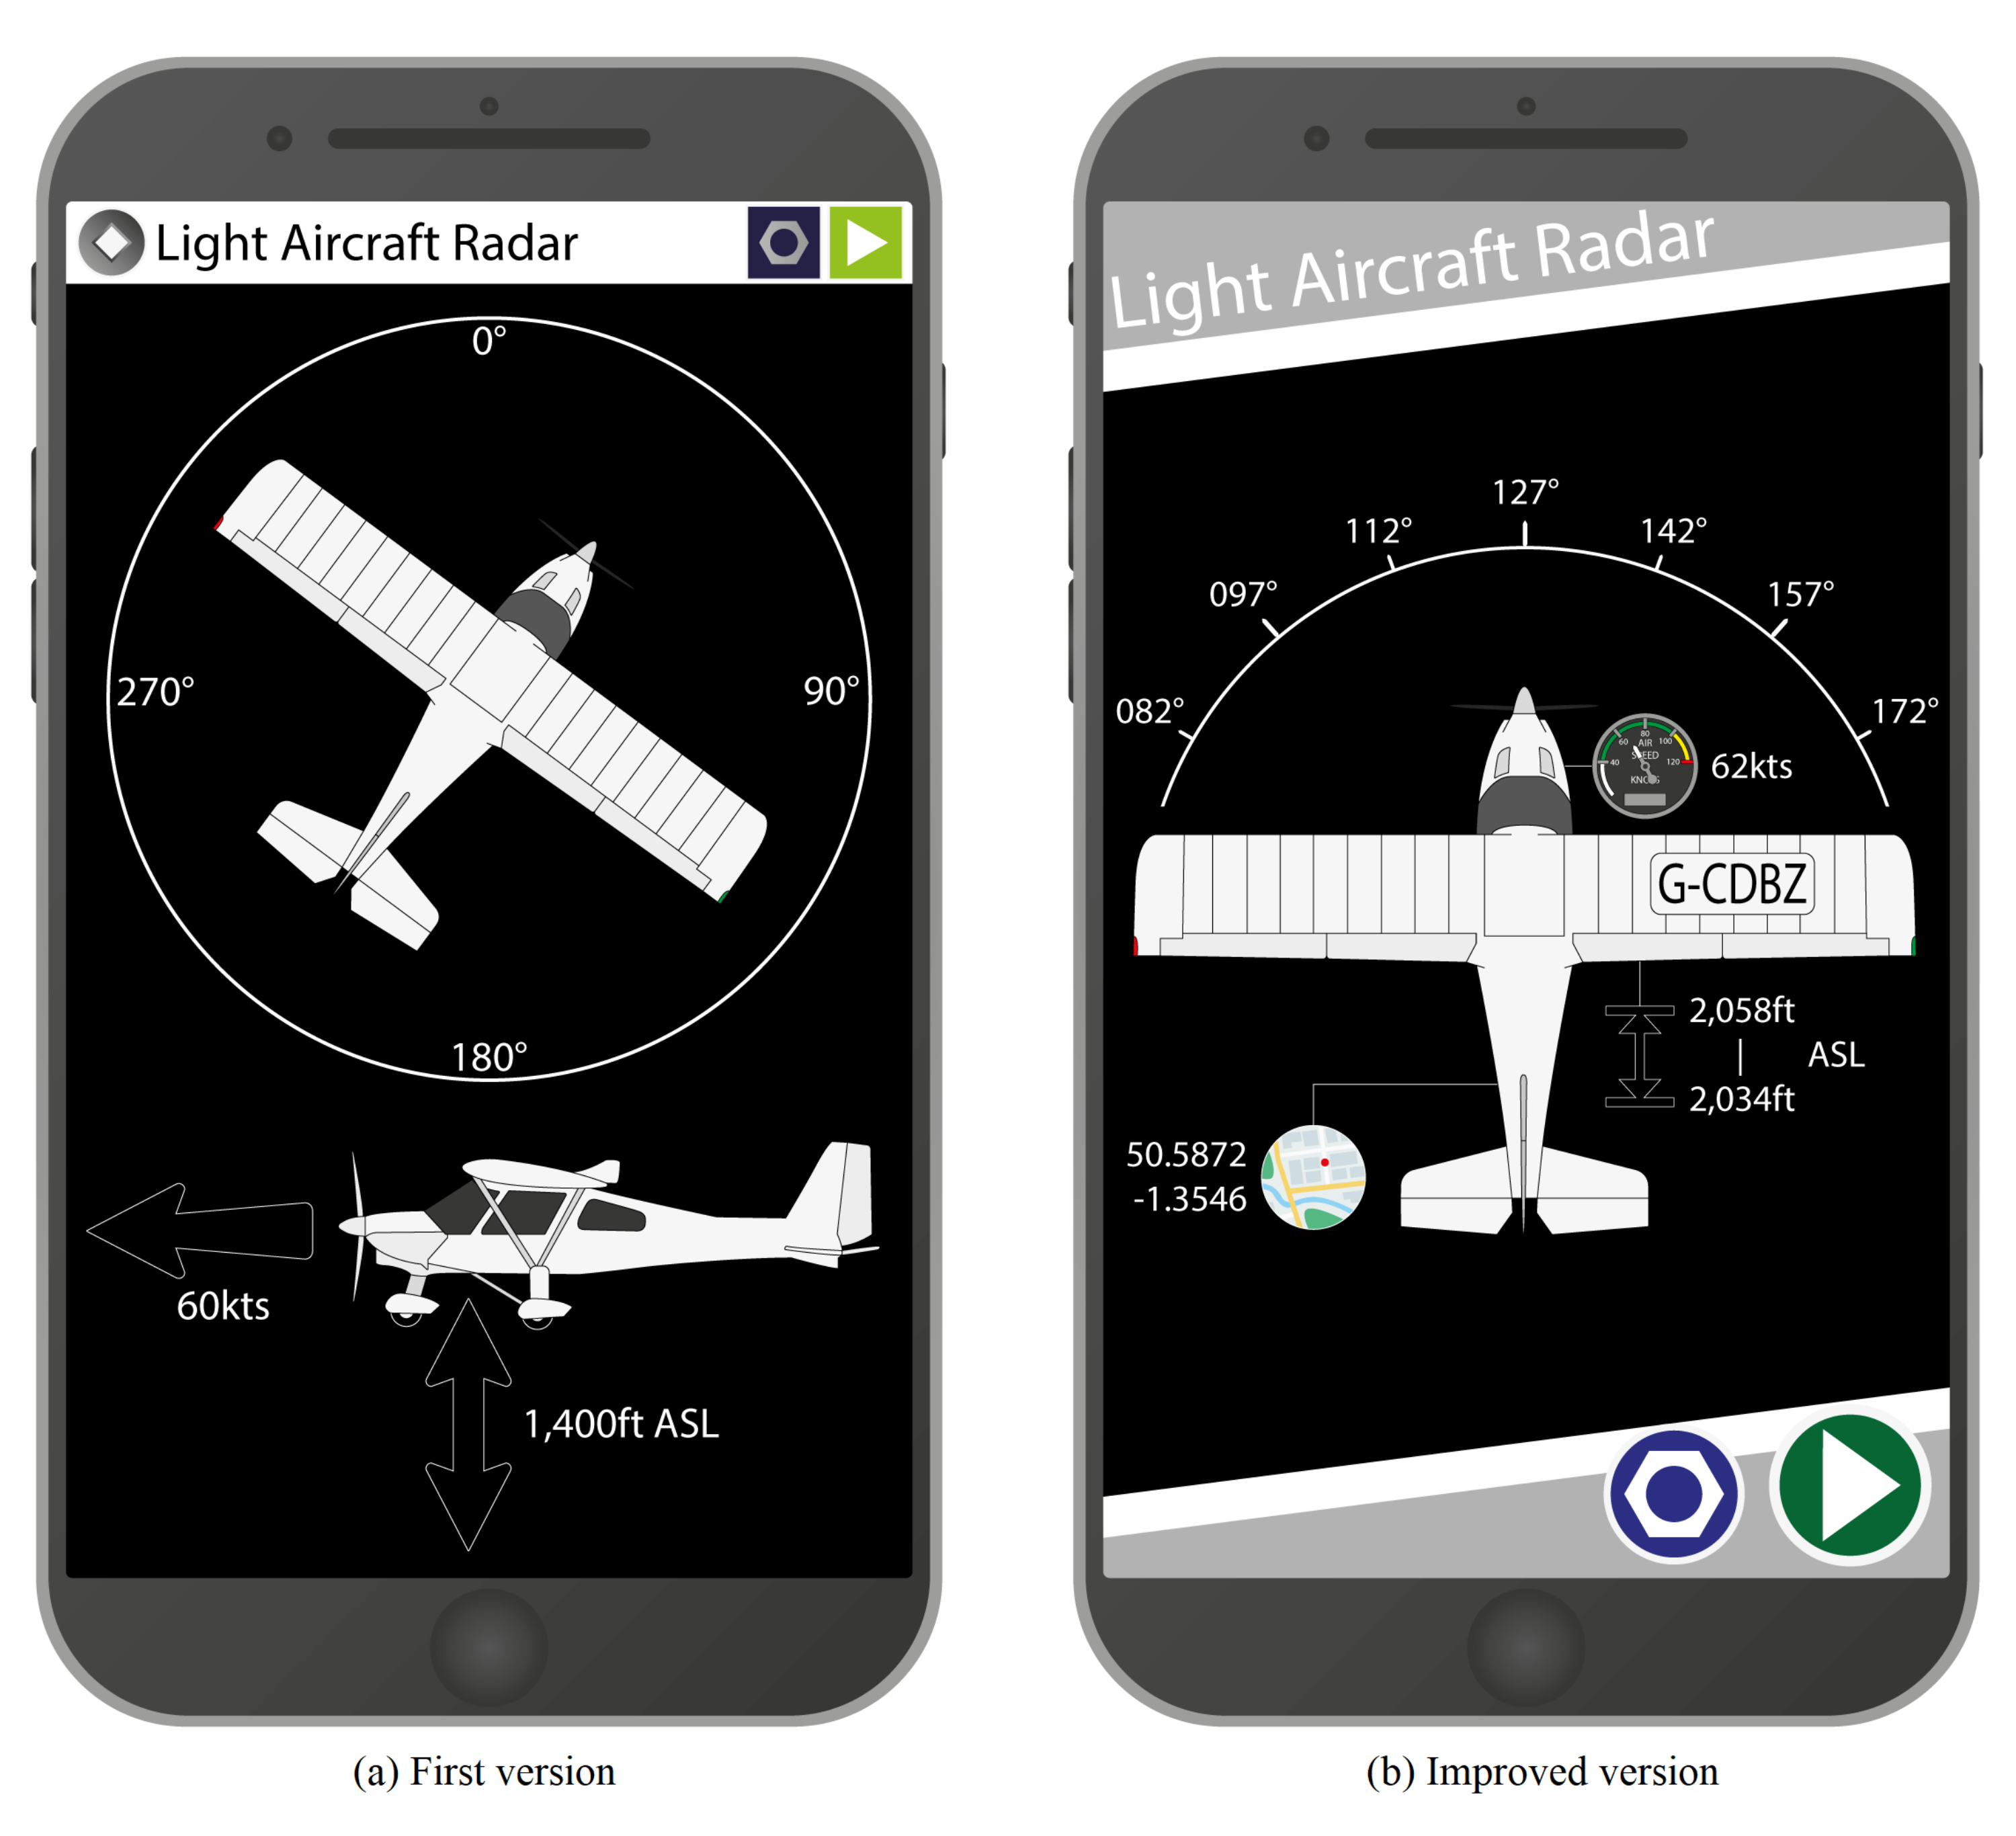
Once the first iteration of requirements gathering had been completed, a low-fidelity prototype was created to acquire feedback on parts of the design which were liked and others which were disliked. Figure 6a shows the first version of the low-fidelity prototypes. The low-fidelity prototype was shown to three professional designers from different fields for their feedback. They specialize in fields which relate to UI design and their roles are game texture designer, 3D modeler and website graphics designer. Based on their comments, changes were made to reposition the graphics, avoid using arrows, and create icons for the other data items. A new graphical interface was conceived taking the feedback into consideration, shown in Figure 6b.
The new prototype was better received by the professional designers, with the only major criticism being the size used for the degrees, a universal recommendation was to either leave gaps between some of the direction points, or to decrease the font size for some of the numbers. Another addition was the aircraft callsign on the wing, so that the user does not need to go into settings to make sure that they are set to the correct aircraft, as some pilots will own multiple aircraft.

4.2.2. Desktop Application

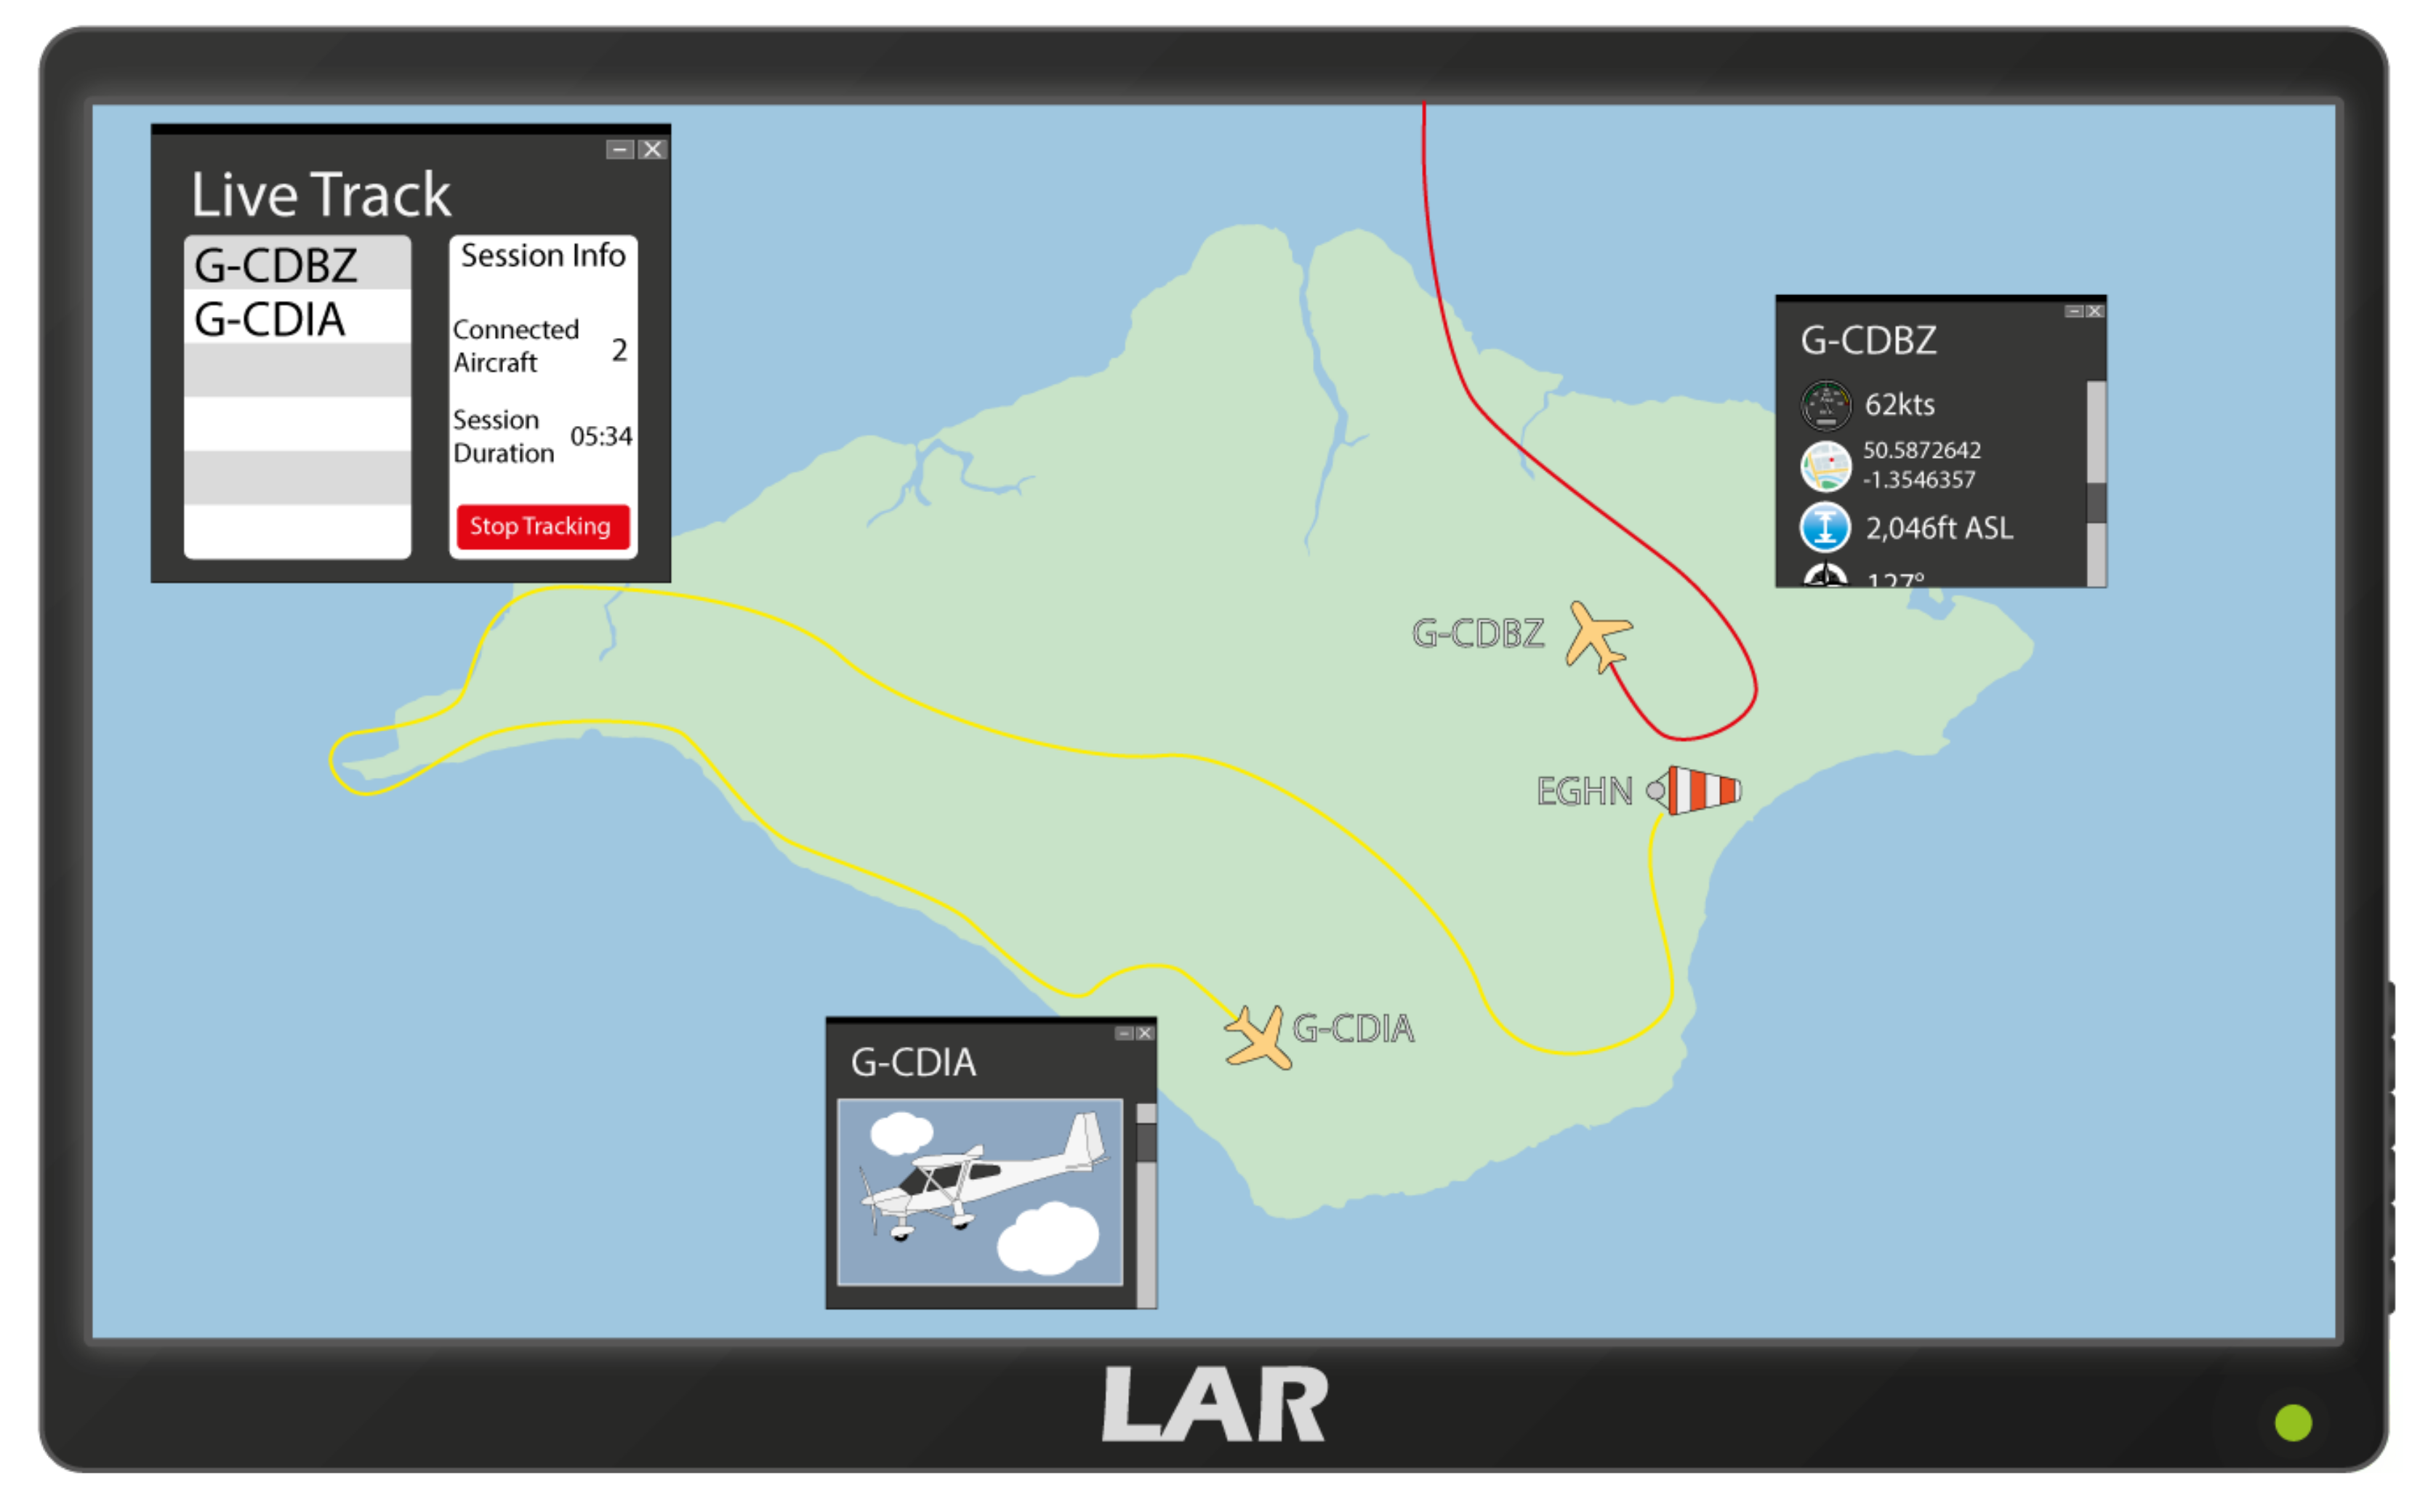
The aircraft data needed to be visualized on a virtual map, updated in real time, to give the user a conventional radar-style interface with “balloons” containing information about the aircraft. A low-fidelity prototype has been shown in Figure 7. The visual design of the application was influenced by the feedback received for the mobile application, as a consistent design across all applications would look more professional and improve UX due to familiarity.
The prototype in Figure 7 was shown to two radio operators to obtain feedback about aspects of the design which were desired. When designing the historic flight view, the implementation would be performed similarly to the live flight view, except the application would need to load old data and the formatting of the visualization file would be structured differently to accommodate the changes.

4.3. System Interactions

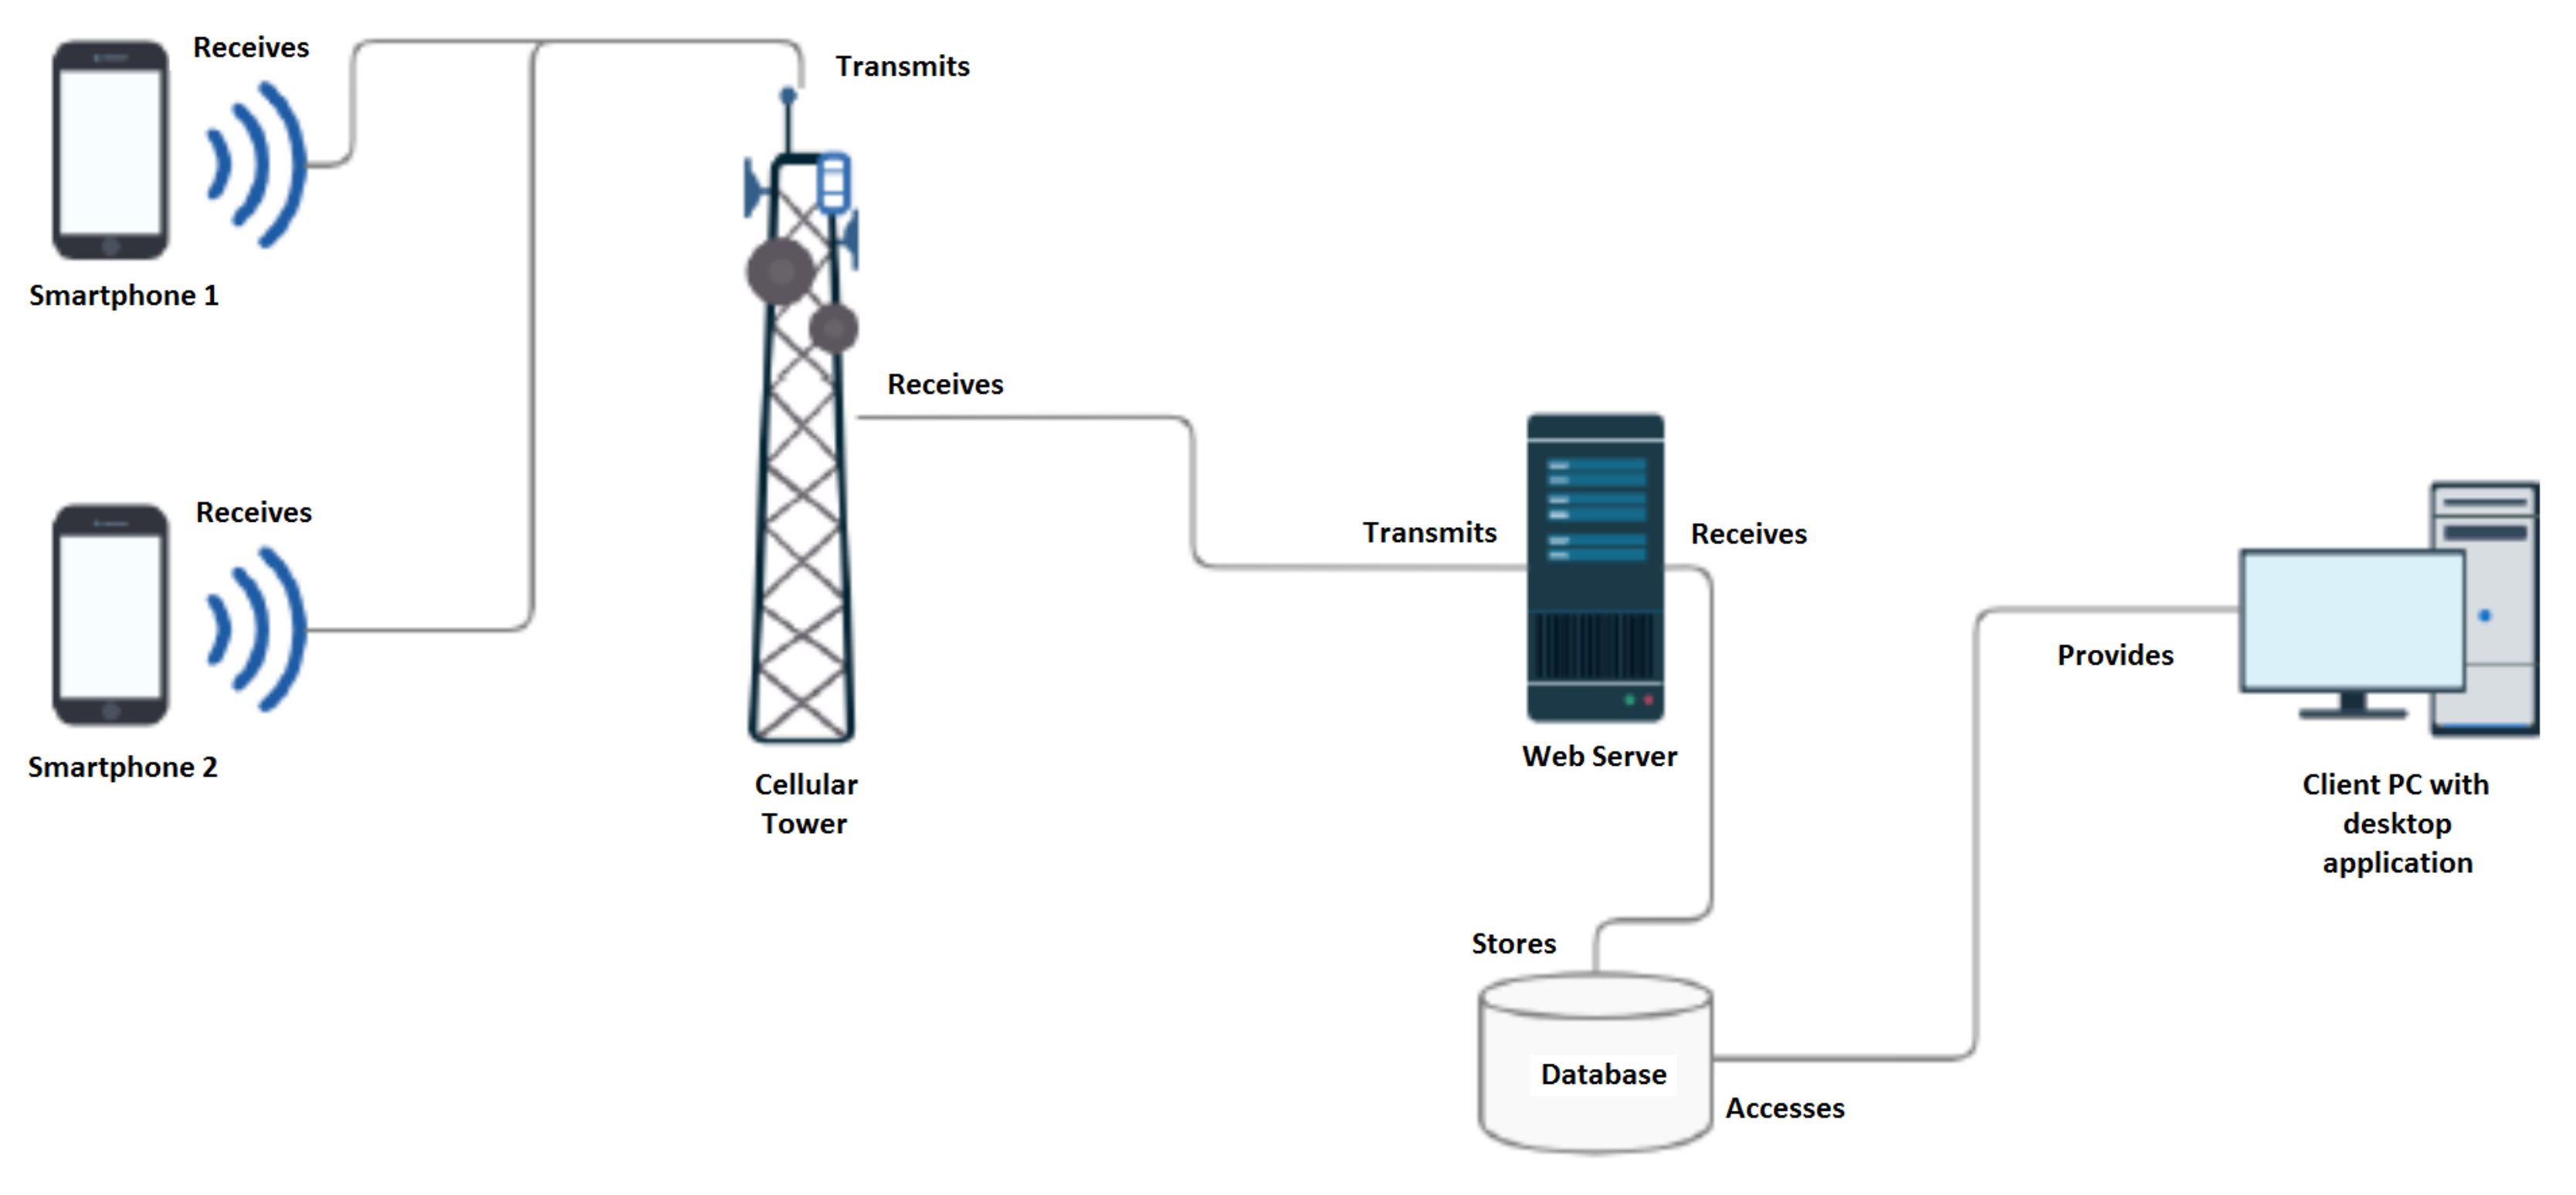
To understand the interactions between the physical devices which will work with the mobile application software and the desktop application software, a system interaction diagram is illustrated in Figure 8.
The diagram demonstrates the relationship between the components. The smartphone, which would be in an aircraft communicates using the cellular network to transmit flight data. The cellular tower can then transfer the data to the web server, which can then store the transmission in the web server’s database. This database will continue to store information regardless of the desktop application, as the two are separate components. For the desktop application to view live tracks, the desktop application must connect to the database and request new transmissions. Because the database is always accepting new transmissions, the desktop application can be opened to obtain old flight data, which has been recorded.

5. Proof-of-Concept Implementation

The proof-of-concept implementation consists of a mobile smartphone application, a desktop application, and a web server cooperating to create the full light aircraft radar system. Mobile and desktop applications are explained separately in the following sub-sections while the web server is explained in relevant parts.

5.1. Mobile Application

The mobile application development was broken into various phases, due to the Agile methodologies applied, which improved unit testing capabilities and acceptance testing. An Android application is developed with Java to derive the aircraft information.

5.1.1. Location Acquisition

To implement the positional tracking functionality, Fused Location Provider Client, a Google API, was imported and chosen for ease-of-use, the ability to use high-accuracy positions, and low-battery usage [31]. As this API can acquire different information based upon the current version of the OS, it is important to highlight this in the application and to provide support for older versions and newer versions; as this increases the compatibility of the application with legacy devices. The application checks the build version code is ‘O’ or greater, this is because vertical accuracy is not available to versions older than ‘O’. If vertical accuracy is obtained, the device can give a range for the aircraft’s altitude, an example would be ‘2051–2084 ft’, whereas older versions can only give an estimate up to 68% accuracy, an example would be ‘2064 ft’. To access a smartphone’s position, permission must be granted for access to fine location and background location.

5.1.2. Creating the UI

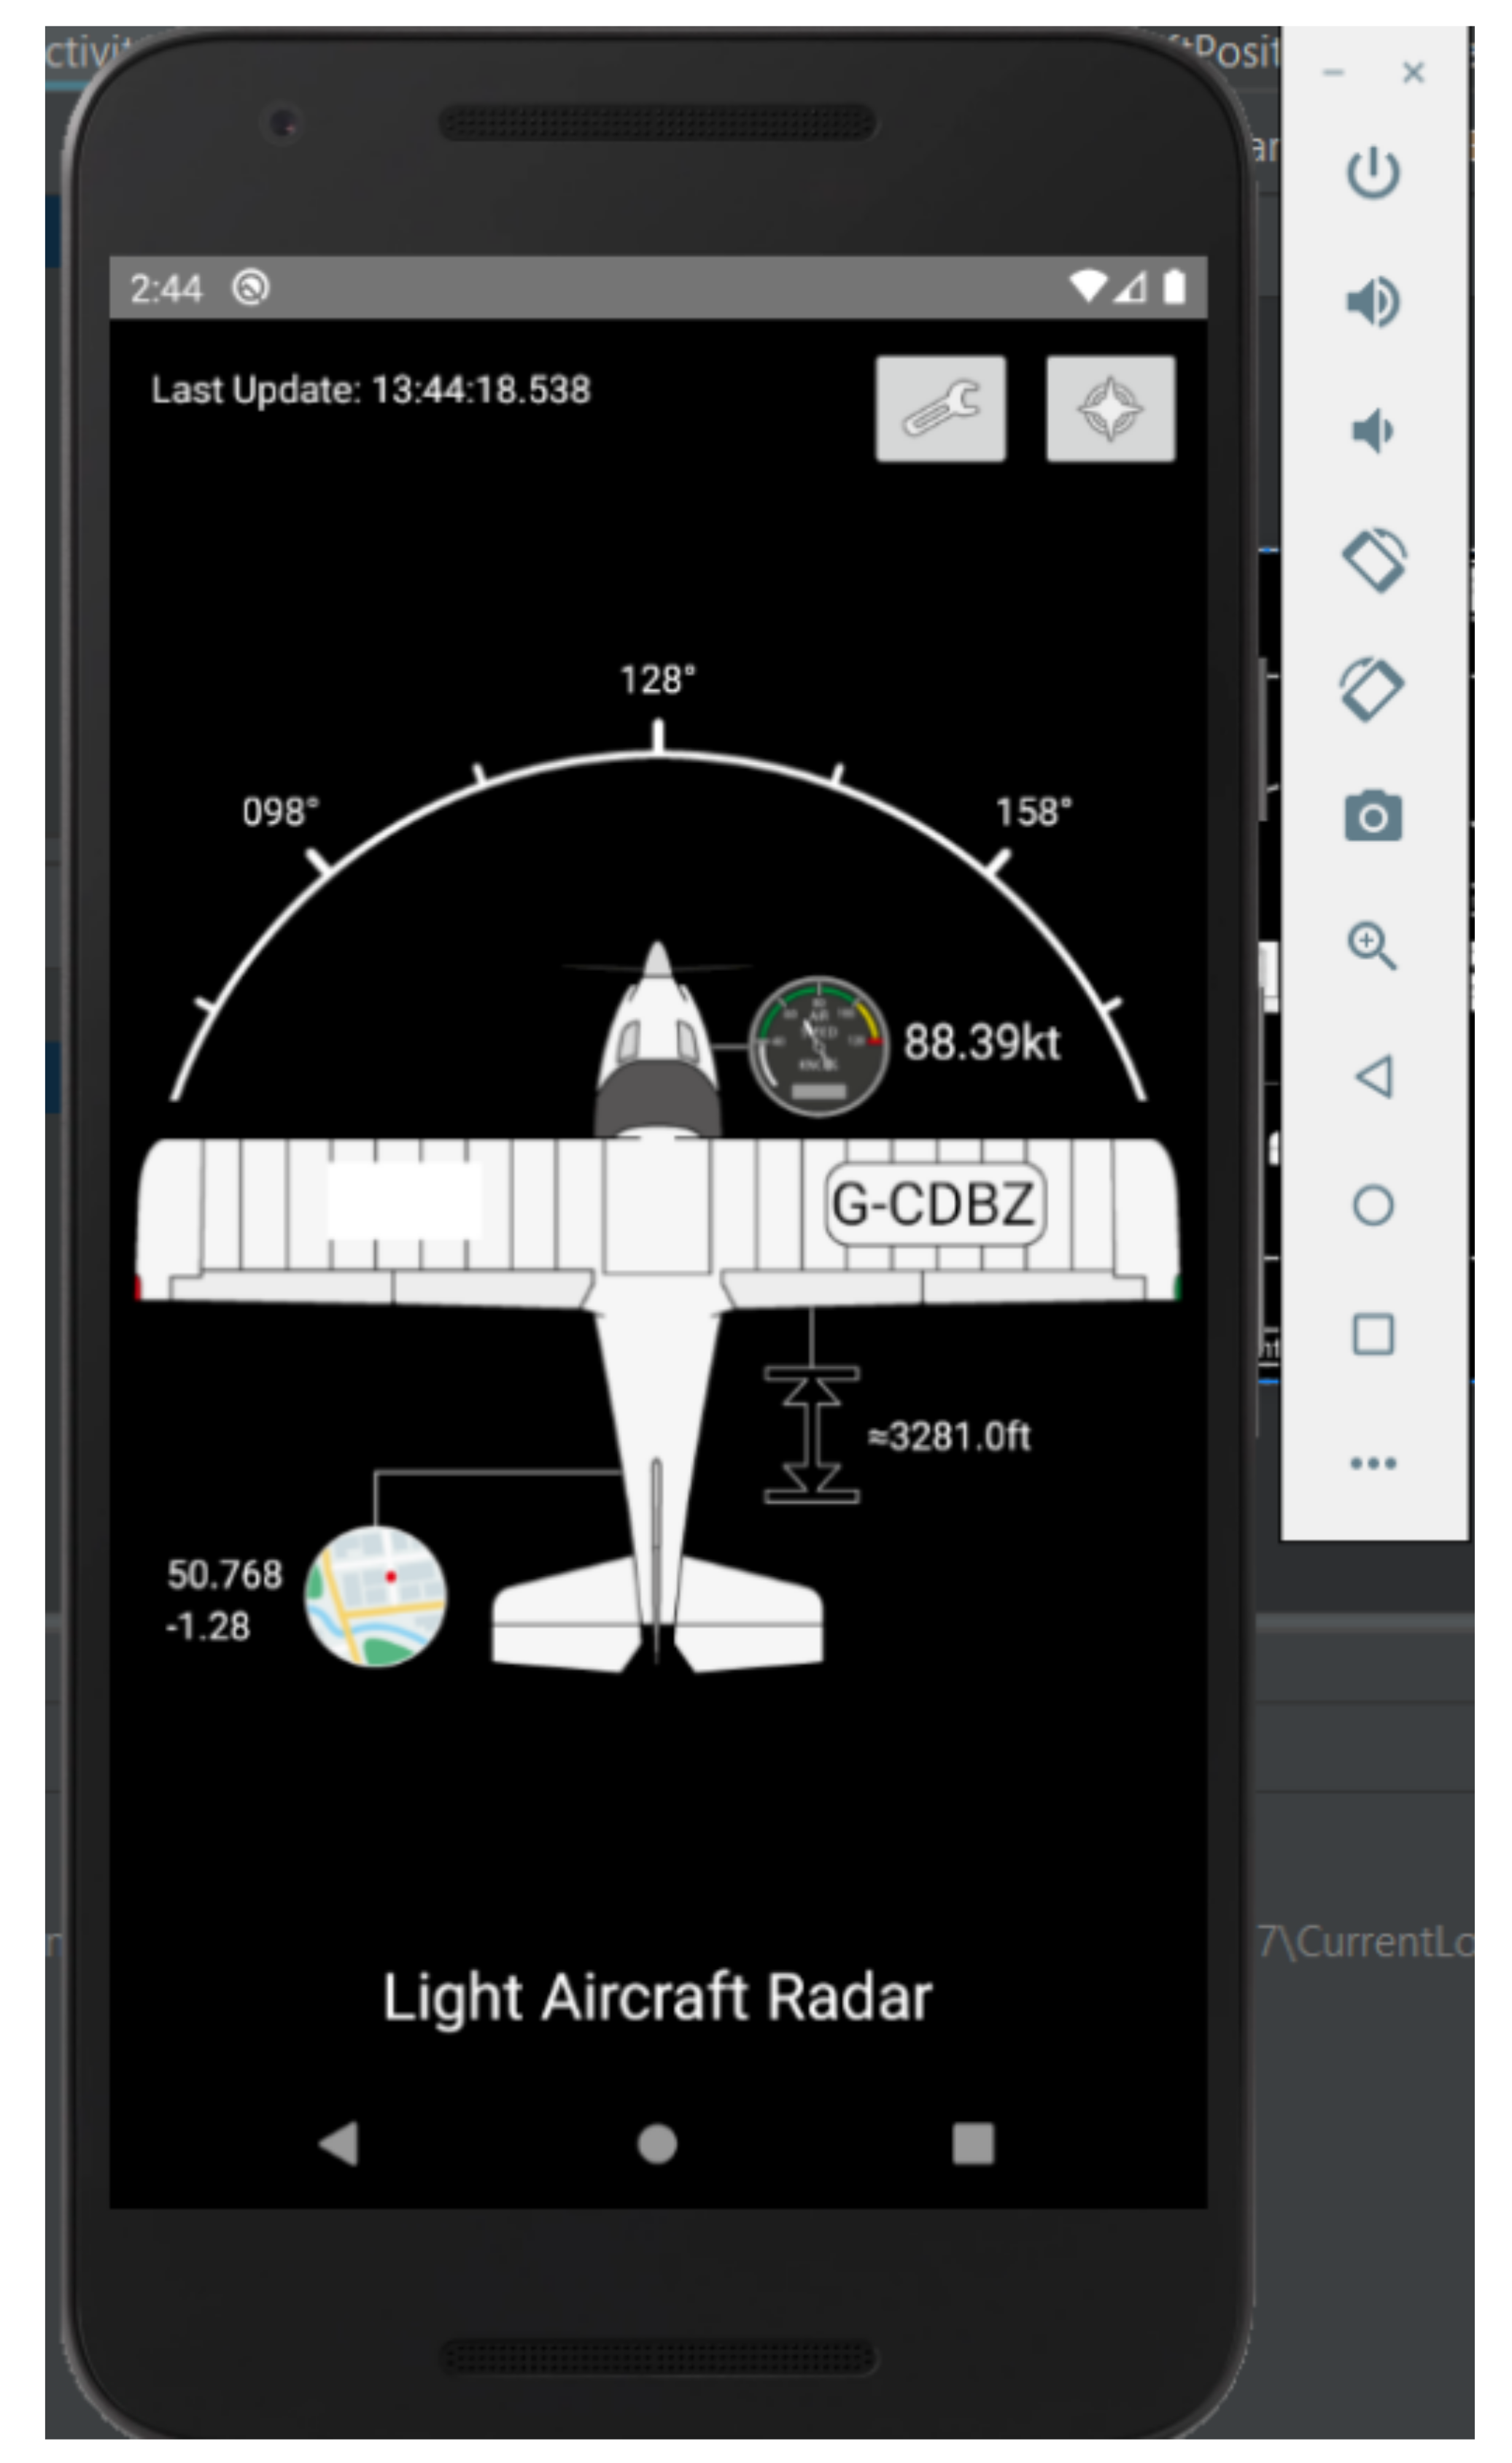
Once location data was obtained and output to the console, a UI was implemented. The UI was created by writing an XML file, which could be edited using Android Studio’s UI designer. The layout was designed to be scalable due to design attributes applied to the elements of the display. Figure 9 shows the UI on emulator. This has the advantage of allowing the application to be used on a wide range of devices; however, it should be noted that not all screen sizes would be supported. A particularly small screen will not work, because too many elements would be on the screen. A solution would to be to create multiple views for the same application, which vary based upon a device category; however, this was outside the context as an assumption was made that a modern smartphone would be used.
To avoid an entirely text-based UI, Adobe Illustrator 2017 was used to create some simple vector graphics to make the UI simpler to understand and avoid the need to create many language variants, as symbols could be understood universally. The latitude and longitude on the UI are only allowed to be 3 decimal places at maximum, which avoids displaying a long number; however, the application will actually store a 7-decimal-place latitude and longitude, which is sent to the web server for ground tracking. Another important feature to note is the timestamp in the top left corner is in UTC, which differs from the smartphone time, which is in GMT, this is because aircraft operate using UTC.

5.1.3. Processing the Location Data

By itself, the location data could not provide speed and direction to an acceptable accuracy, so part of the development was to calculate these two parameters using mathematical formula. The accuracy of the latitude and longitude meant that using the ‘Great Circle Distance’ formula [32], could be used to obtain the ground speed and bearing of the aircraft. This formula takes into consideration the distance between two points following the curvature of Earth. The formula works with meters per second, so the application converts the result to knots, as following standard aircraft units of measurements. To acquire an accurate bearing, the difference between an old position and a new position is stored and the formula is applied.
Additional data items have the potential to be acquired on the mobile application, such as vertical rate (the rate at which an aircraft climbs/descends); however, this was scrapped during implementation of the mobile application as a crucial aspect is to keep processing to a minimum. This was to avoid creating delays due to extensive processing and minimize package sizes sent to the web server to reduce battery consumption. Instead, this was chosen to be calculated once the data reaches the desktop application.

5.1.4. Sending Data to the Backend

For the backend bridge application, web services are used. A PHP application is served over an Apache web server which would act as the receiver for transmissions from a device. The mobile application sends data via HTTP POST to the PHP application, which will perform data sanitization and validation to ensure that only legitimate data is sent to the server, such as ensuring that the latitude and longitude are decimal numbers instead of a string. Sanitization is performed to prevent security threats such as SQL injections.

5.2. Flight Simulator Based Testing

In addition to flight tests, a flight simulator was built into the mobile application to use time efficiently during testing. The simulator loads a predefined path for the aircraft to follow and behaves in the same way as a real aircraft. This is because the simulated flight path overrides the GPS of the smartphone and replaces the data with the flight simulated values, meaning no changes had to be made to the regular system to accommodate the flight simulator.
The flight simulator is run on a separate thread from the rest of the application, meaning no performance issues will affect the main functionality, making the flight simulator an excellent substitute in the event a flight is not possible.

5.3. Web Server and SQL Database

The web server has a PHP application which interfaces with a MySQL database. The web server is the bridge between the smartphones running the mobile application and the desktop application, visualizing the data. An SQL database is used to hold incoming transmission data and to obtain requested data from the desktop application. The database has a table called ‘Transmissions’ which has fields to hold each transmission, with a primary key assigned to each record. Although the PHP receiver does validation on the incoming data, the database also enforces attributes on fields.
The SQL database is regulated by a PHP script which checks at midnight UTC for transmissions older than a week and removes them. Figure 10 presents a partial view of the ‘Transmissions’ table in the database, there are two aircraft transmitting simultaneously, demonstrating the multi-aircraft support of the application.

5.4. Desktop Application

The desktop application is implemented in C#. Application development was broken into various phases which are explained in the following sections.

5.4.1. Creating the UI

The application needed an intuitive and simple UI, as most of the clients are elderly and many of them would not consider themselves adept with technology. Therefore, when designing the UI, a key challenge was to design an easy-to-use UI, while hiding the complexity of the application from the user. The Visual Studio ‘WinForms’ designer is used which enabled rapid development of an interface in a reasonable period of time. Figure 11 shows part of the UI in the desktop application.

5.4.2. Acquiring Live Data

By pulling data from the SQL database, the desktop application can take information it requires by executing a query. The application will take transmissions which are less than four seconds old, this is to take into consideration delays between transmissions, which are sent at three second intervals.
A StringBuilder class is used to create the query instead of concatenating a String. This is because a String is immutable which means it is unchangeable, so each time a String must be updated the entire String must be rewritten instead of appending the new data onto the end, which is why a StringBuilder is used, as it is mutable. The reason this is important is because using a StringBuilder is faster in terms of operations cost than a String and for a live application which must update within seconds, every operation must be considered carefully to avoid excessive delay.
A consideration taken for the live data acquisition was the use of multithreading the application. This would have the benefit of allowing a whole thread to operate independently of the data pulling section and use another thread to perform processing on the acquired data. This would be synchronized using a Queue, where the live data thread can ‘Enqueue’ new transmissions incoming and the processing thread can ‘Dequeue’ these transmissions and process them, which would allow the system to continue operating in the event of a backlog of transmissions. The reason this was not implemented was due to the lack of necessity, because transmission backlogs only tend to occur when a few hundred transmissions are being received within a second, as previous experiences demonstrated this was not necessary, so this was out of the scope. However, the project could be rapidly updated to accommodate this change due to the modular nature of the code. On the other hand, multithreading is used in this application between the UI and the processing layers to prevent freezing whenever a heavy operation is taking place.
To provide a user-friendly visual representation of the data, features provided by Google Earth Pro are used, a tool which is free to download and use. Google Earth provides an easy-to-use interface on Earth, with satellite images of the surface to give a real view to users.
The application can process the transmission data to acquire more information than the smartphone has acquired. An example of this would be the vertical rate, which the application can calculate based on past transmissions.

5.4.3. Extracting Historical Data

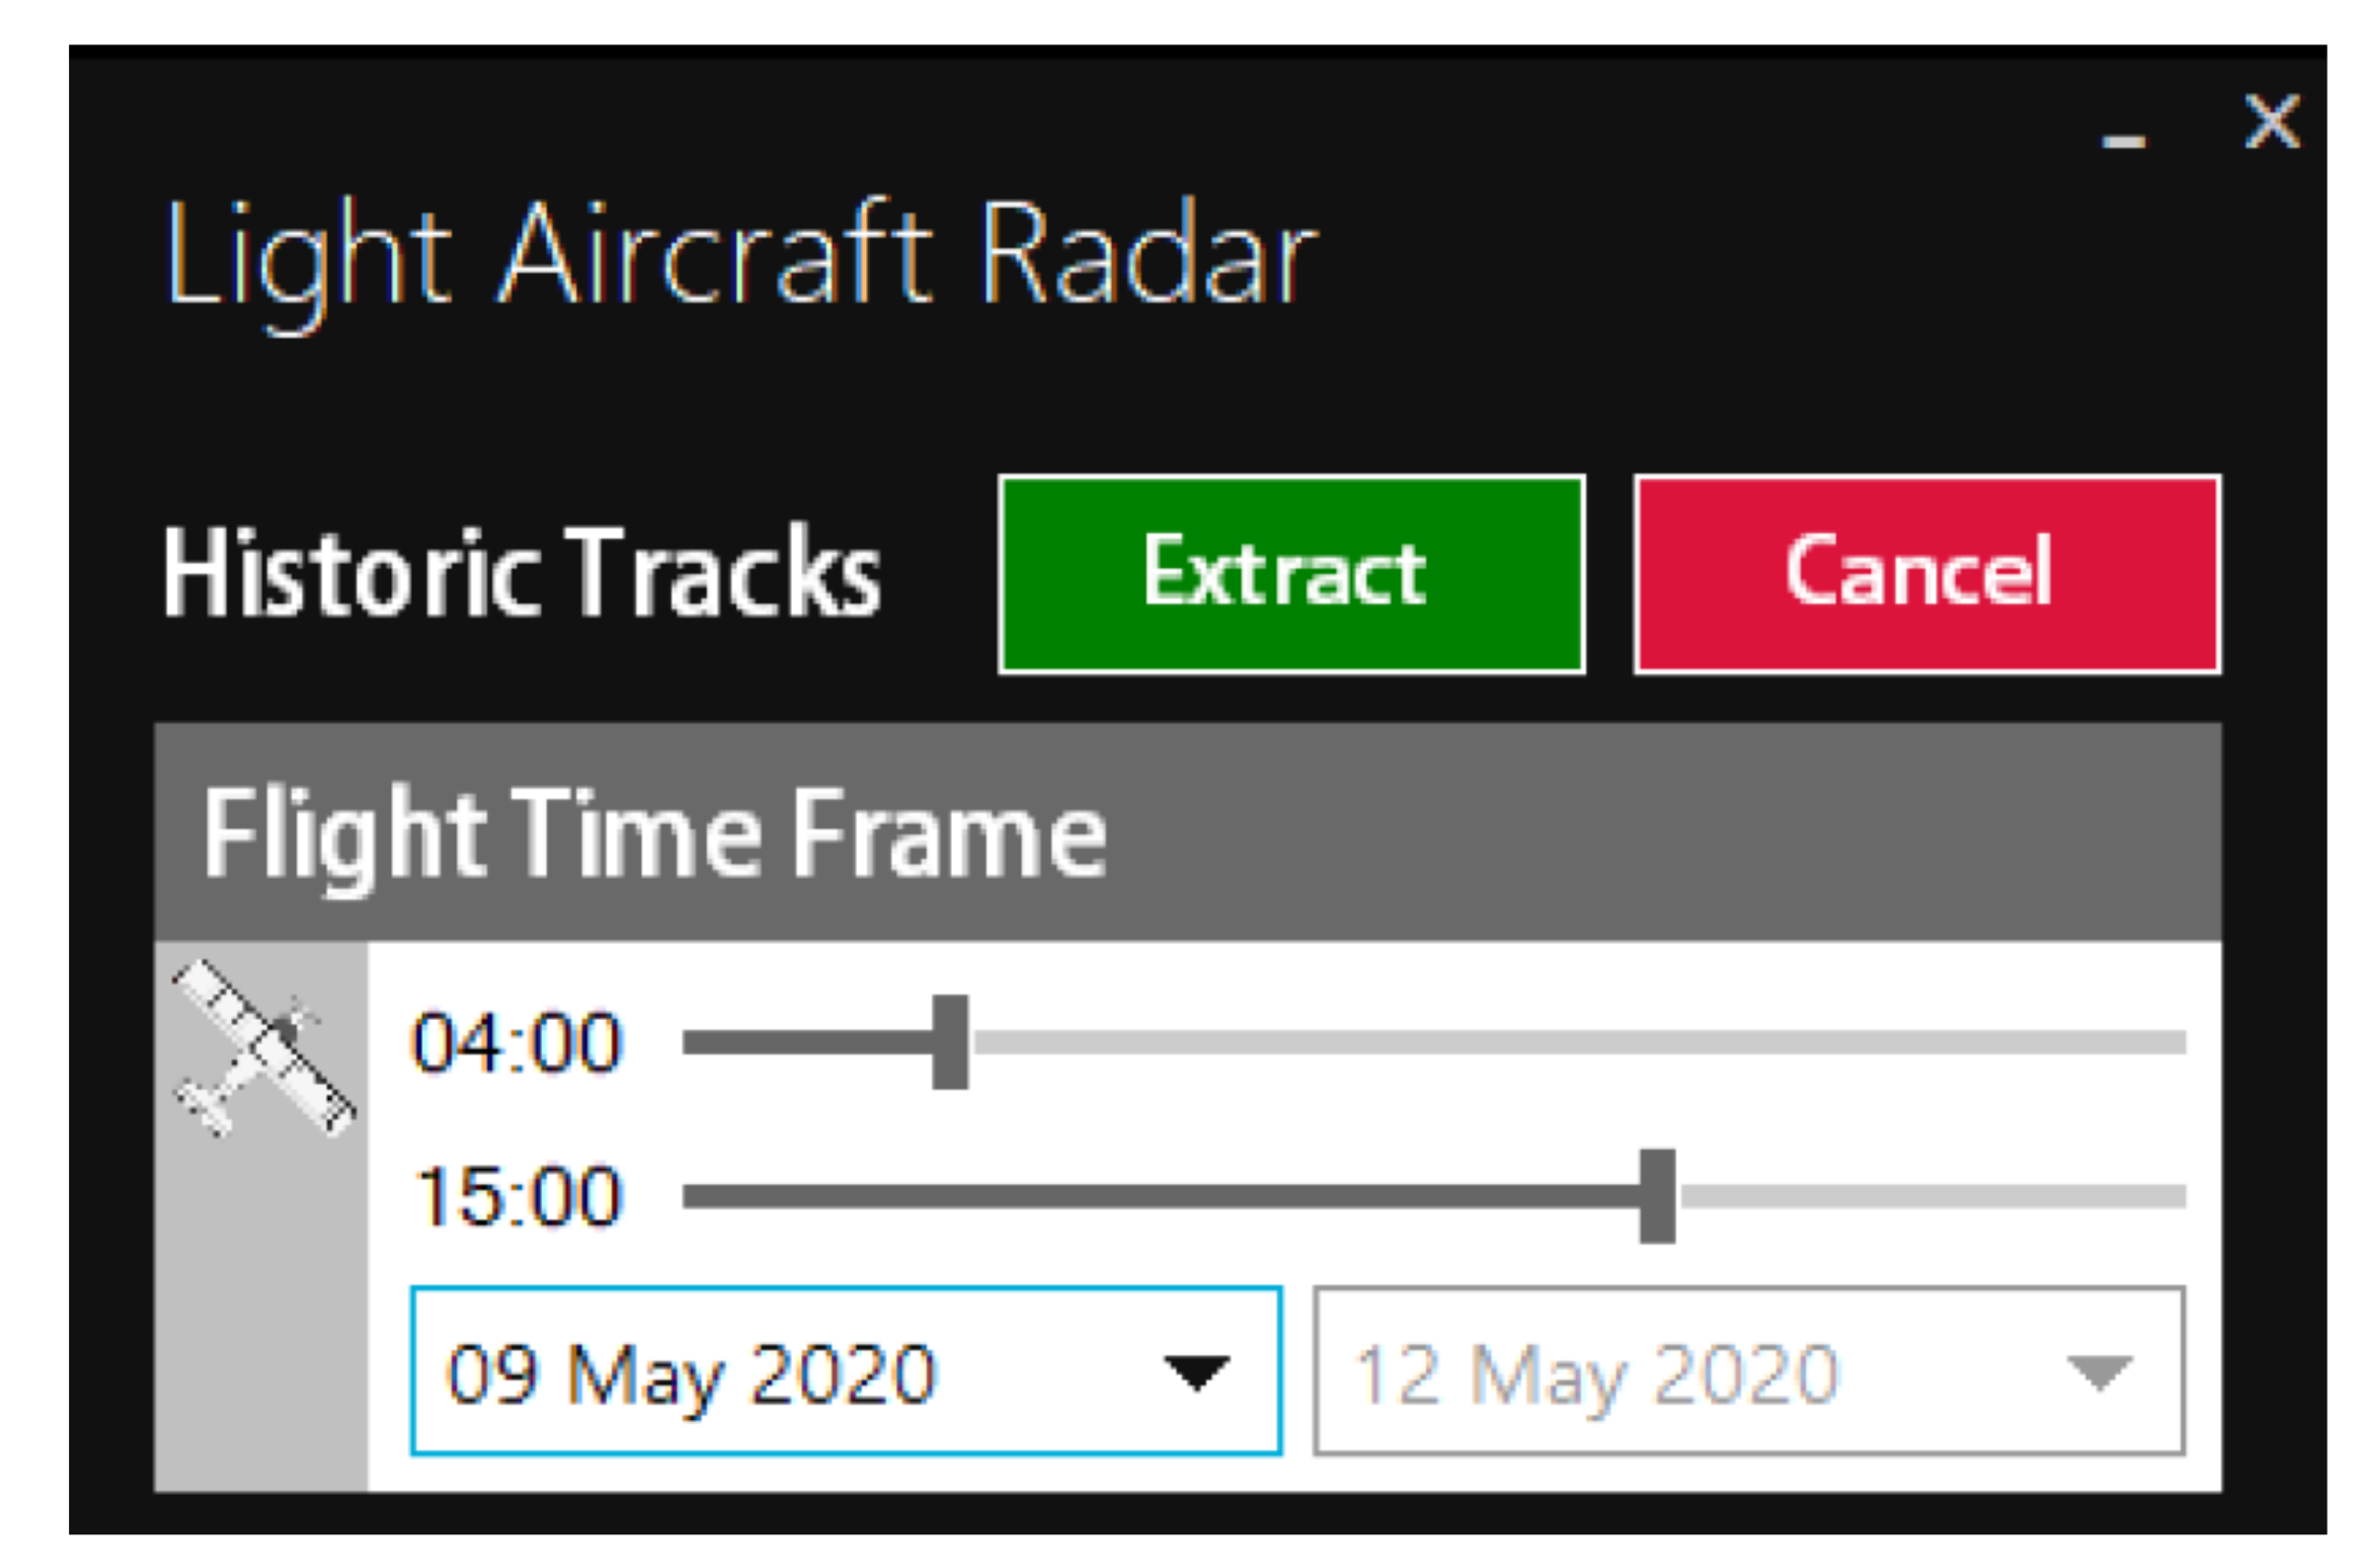
Past flights, up to a week old, can be extracted using the desktop application by navigating to the ‘Historic’ section of the application, where the user can select the time range of their flight, the days which the flight occurred on, and the aircraft they want recorded; left blank if users would like to see all aircraft. Figure 12 demonstrates the emphasis for the simplicity of the design, focusing on minimal user input. Once the user clicks ‘Extract’, a prompt will show for saving the file to their location, naming the file, and ask for a list of aircraft to filter.
The UI is designed to restrict the user to choices that are valid. For example, a flight cannot begin at 15:00 and end at 13:00 or begin on 9th May and finish on 7th May, therefore the sliders shown in the figure will not allow the user to move the slider to an invalid time or date configuration.
The desktop application can use Google Earth to view old flight data, in the form of an exported KML (Keyhole Markup Language) file, which contains timestamped data. This allows for a timeline to be added, meaning a playback of the flightpath can be seen. The usage of Dictionaries is beneficial when referencing by aircraft callsign as the Dictionary key.
A screenshot of the historical data view showing in the top left the timeline view of the aircraft flight path is demonstrated in Figure 13. It is possible to run this through as an animation so that the user can see the aircraft moving along the path.

5.4.4. Visual Representation

To view the aircraft in real time with a visual interface Google Earth Pro is used with a live link KML file and another file with different format to accommodate the changes. The variations are the lack of a timeline bar, because the aircraft are viewed at their live position, it does not make sense to allow a user to cycle backwards in time when there is the past flight viewer specifically for that purpose.
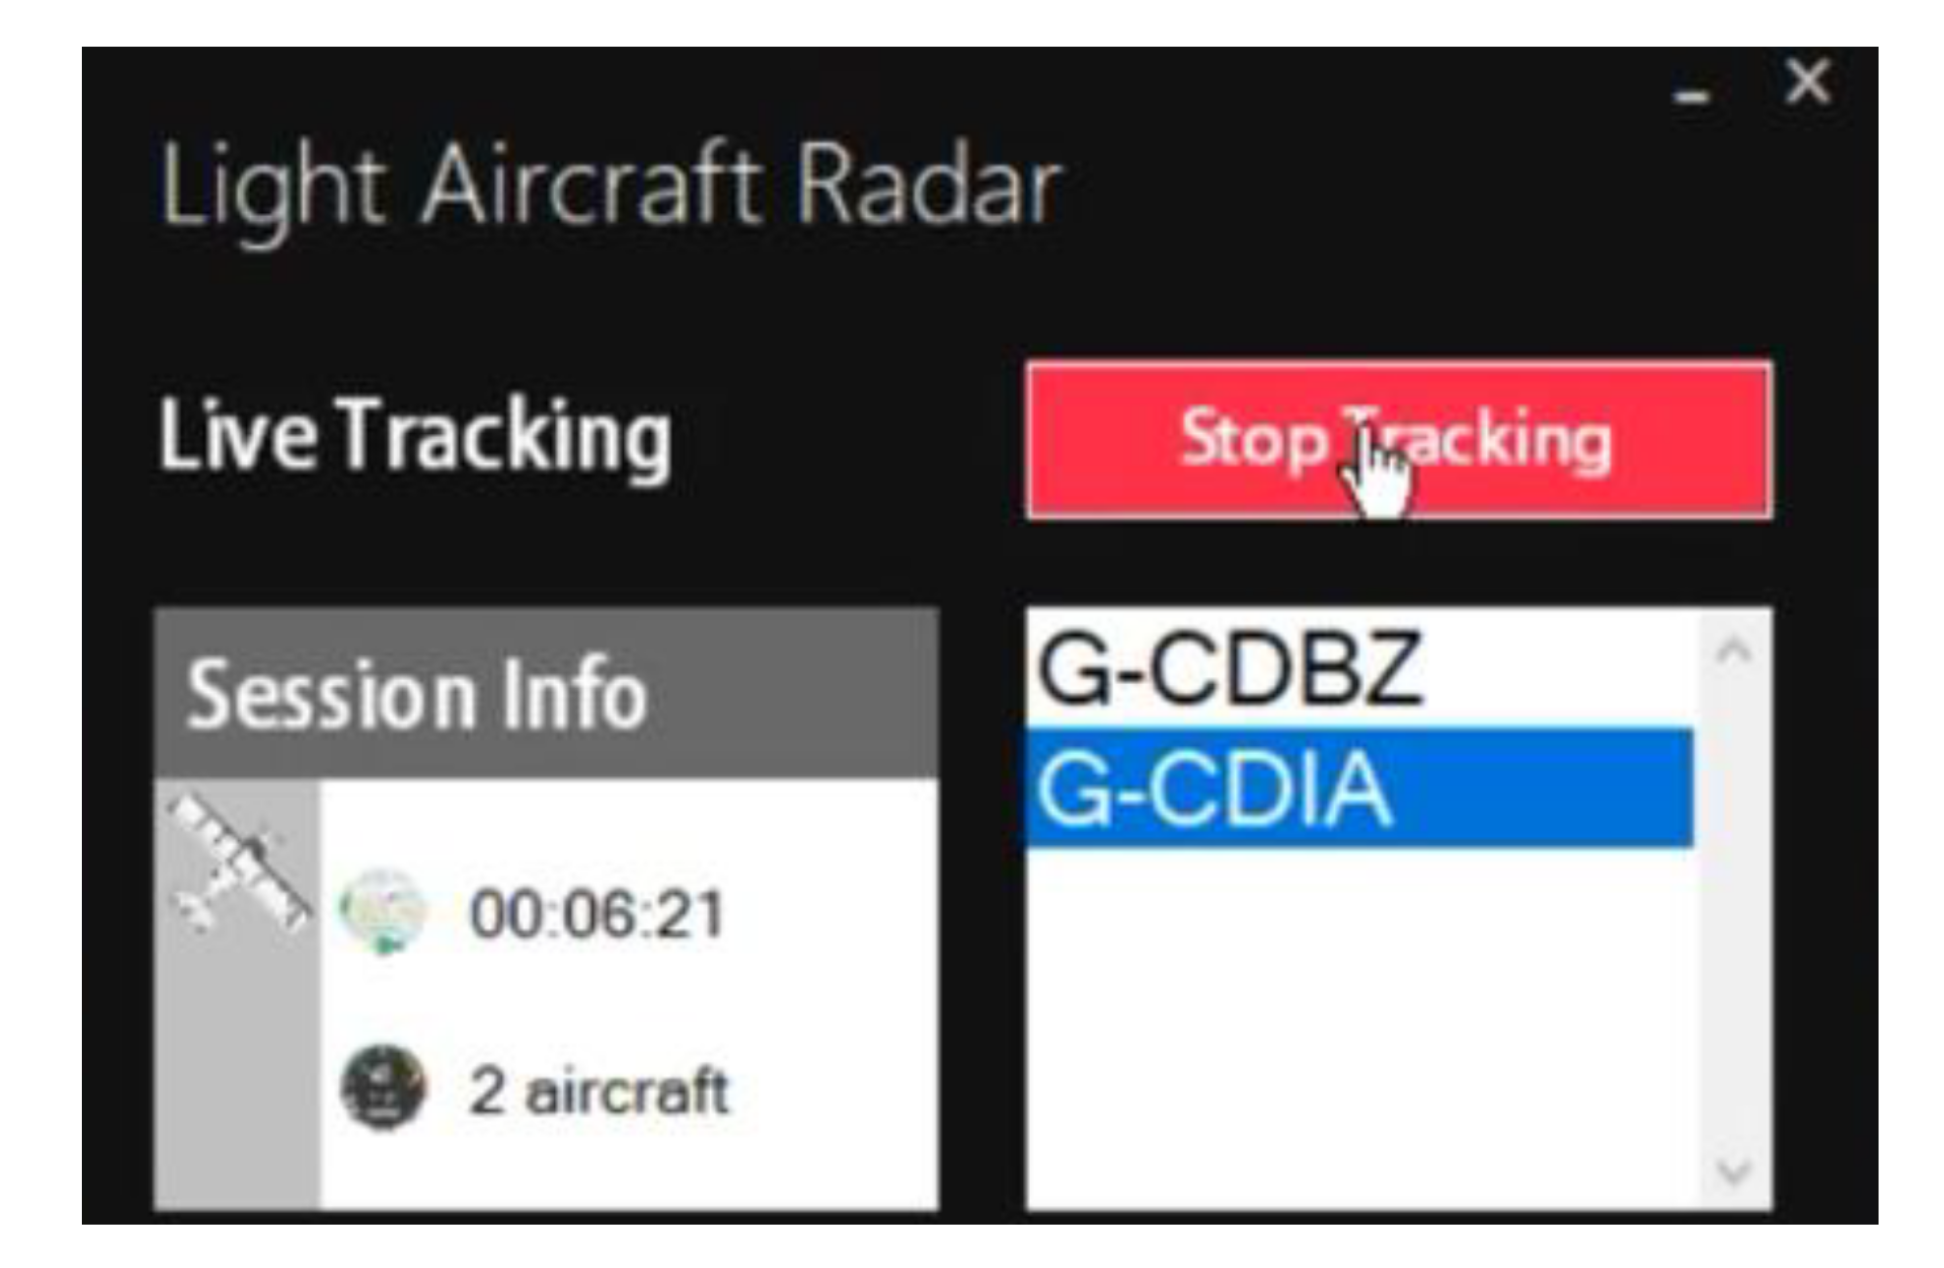
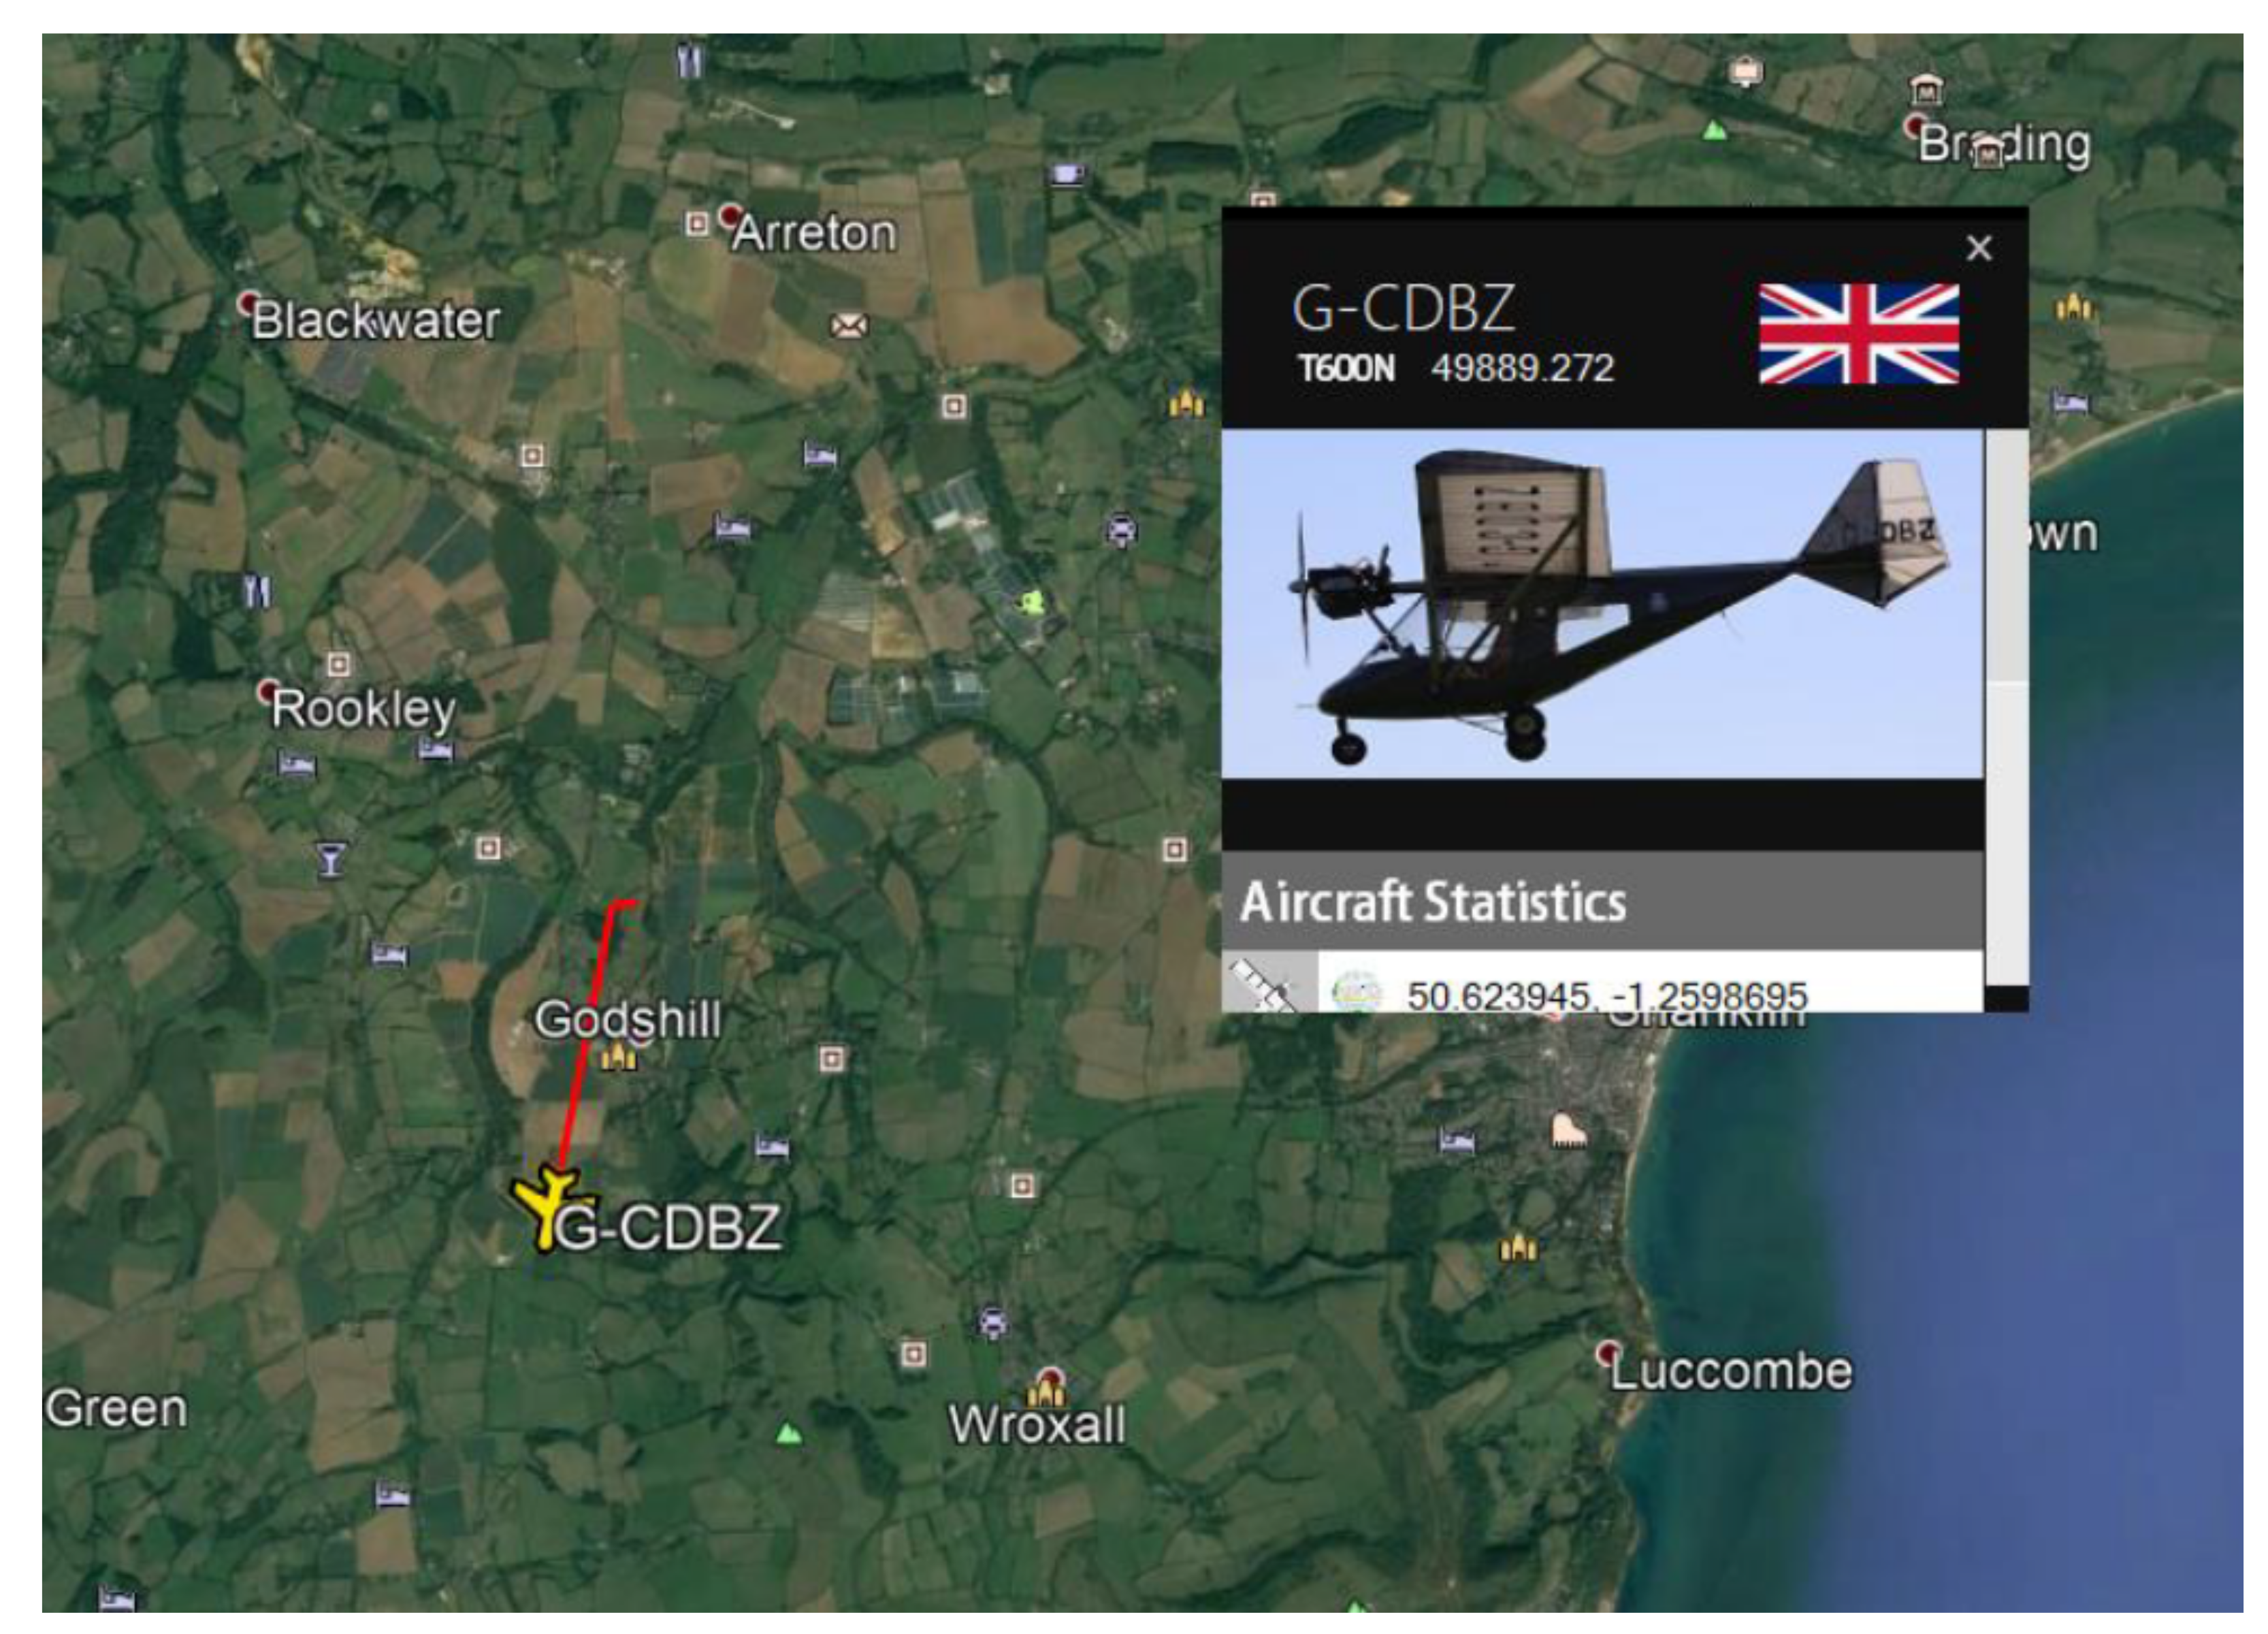
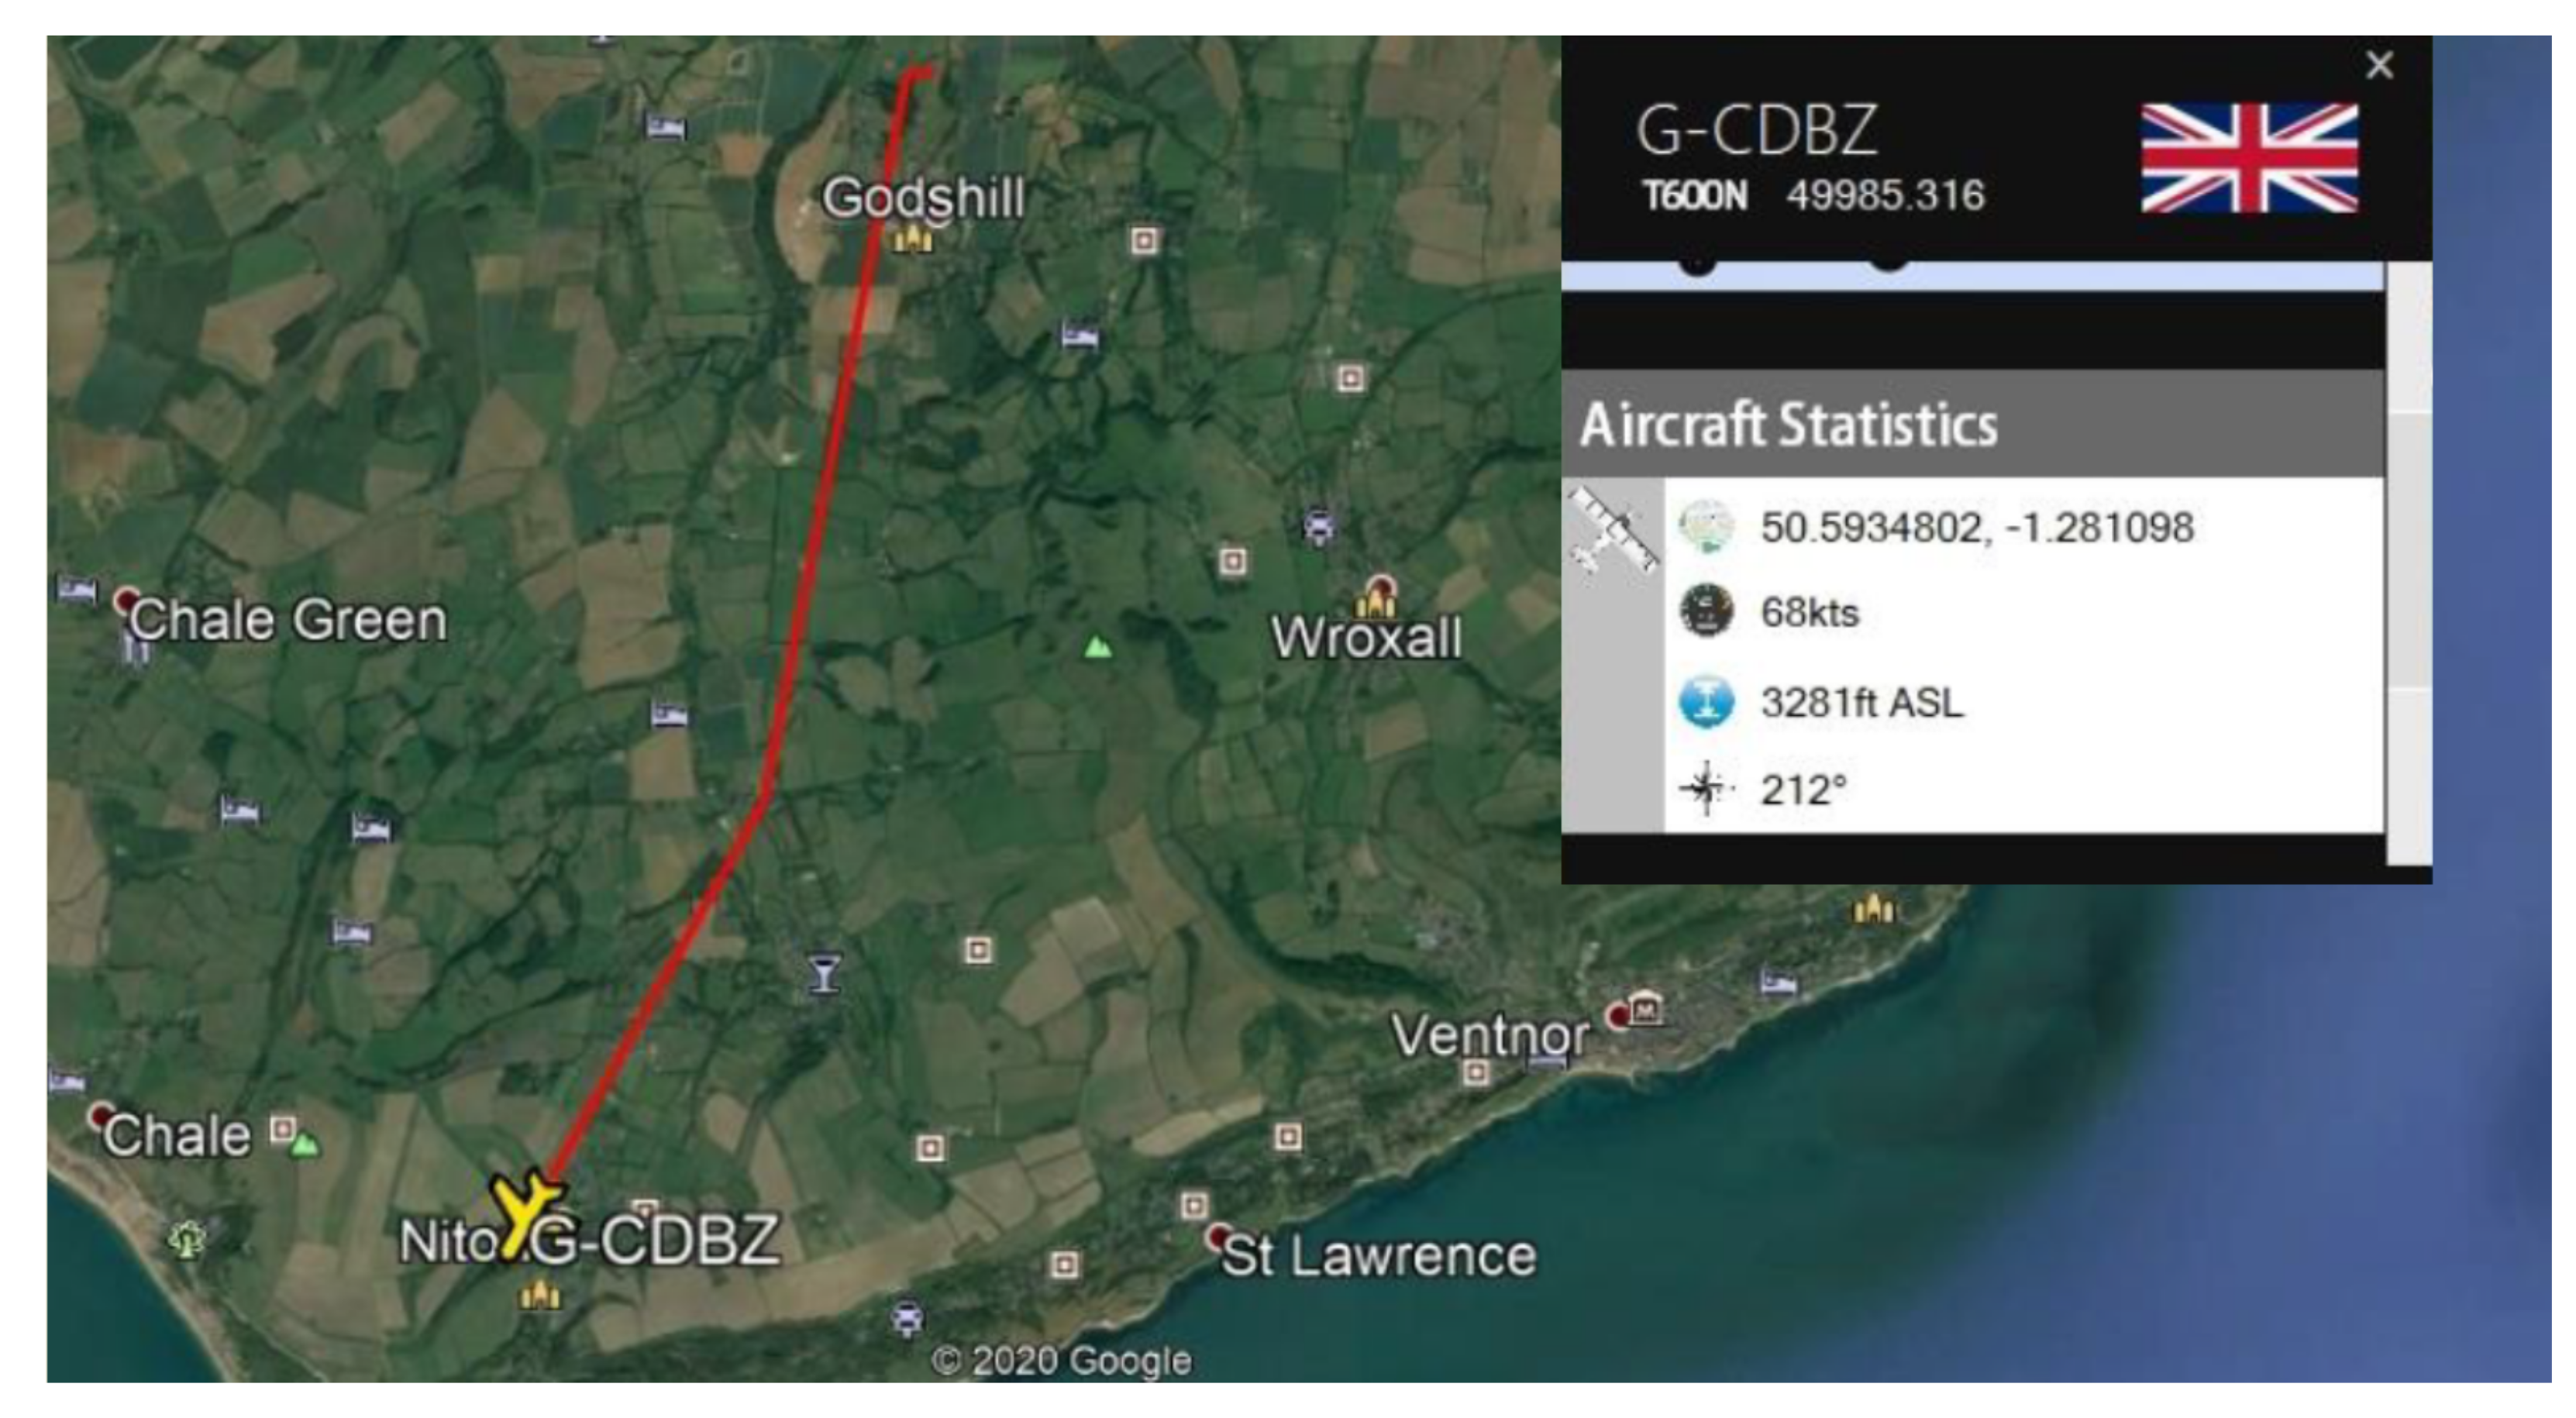
Another variation is the desktop application gives the user the option to open small windows that will remain on top of Google Earth Pro while the user moves around. Figure 14 shows a sample view of the tracking visualization. These windows provide important information about the aircraft’s current data, such as position, altitude, airspeed, direction, as well as providing a picture of the aircraft, picture of the pilot, and a flag to indicate the country which the aircraft was registered.
The live aircraft are shown in Figure 14 as an optional pop up from the desktop application which shows an image of the aircraft and provides in-flight information. The popup will always stay on top, so the user can move the screen around without the popup minimizing. Figure 15 demonstrates the same flight simulated aircraft; however, the aircraft statistics are shown. An important implementation aspect was creating an instance of this window with the specific aircraft and the application should keep track of which instances are open to avoid having the same aircraft in multiple popups. To design the system in this way, the windows are given a unique ID when initialized, which can be used to refer to a specific window. This is also needed to pass an update of the aircraft information, as the pop ups are purely a visual representation and cannot communicate with the database and derive information. This operation is handled by the processing part of the application. At the bottom of the pop-out for an aircraft is a section for pilot information as well as emergency information in the event of an accident as well as a photograph of the pilot. If the pilot is a student, then ‘Student’ is the prefix in front of their name.
A trail is created behind each aircraft as it flies along, giving some historical information during live track mode, as the user of the desktop application can see where the aircraft was first tracked from and where they have been. The desktop application achieves the live mode by pulling the most recent data from the database. Because each transmission is timestamped, the application will request that the database returns all transmissions which are 4 or less seconds old, the reason 4 s was chosen was because the transmission time between each message is 3 s, so an extra second is given to account for any delays between transmission, storing and retrieving data.
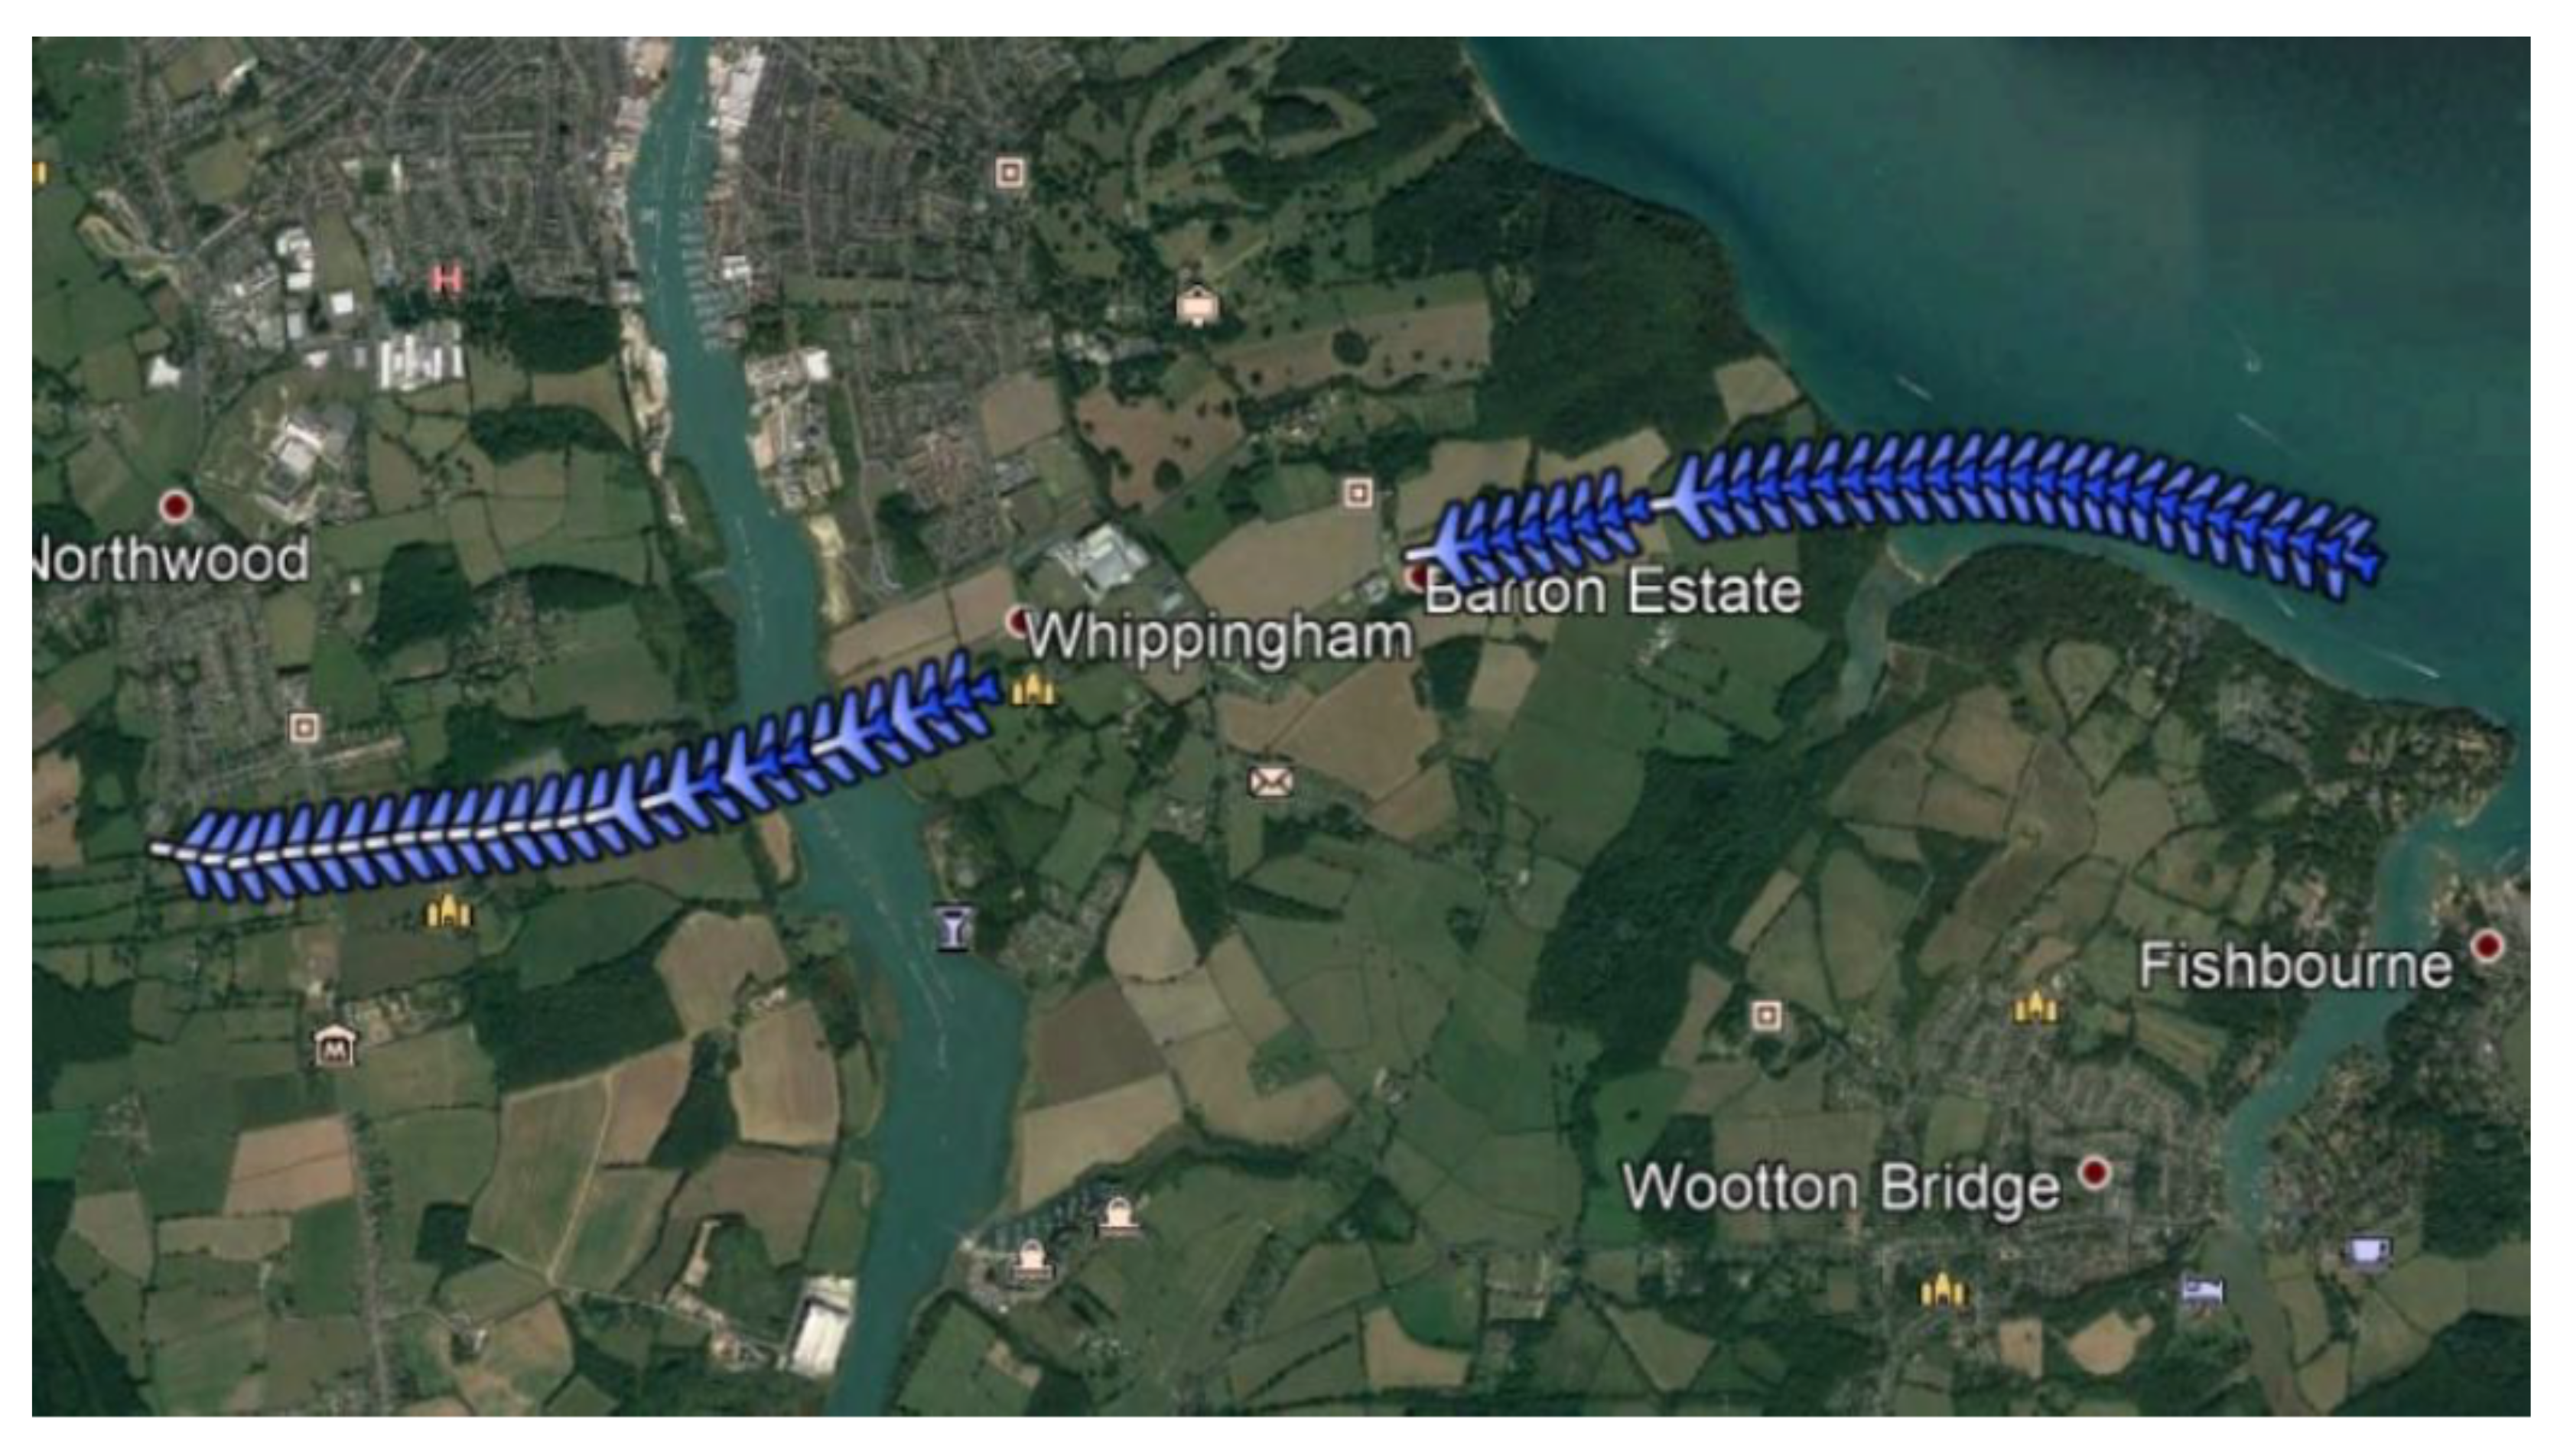
When the data is retrieved, the application’s local records for each aircraft are updated, which will be reflected when the application rewrites the live KML file and aircraft instance windows. Google Earth will update every 3 s as defined in the live link KML file, which bridges the gap between the desktop application and Google Earth. A live update of each aircraft will appear, providing highly accurate, up-to-date information for all tracked aircraft. The application can update many aircraft tracks at once, this is known due to past experience with SSR technology, where Google Earth was used to live update over 200 aircraft simultaneously at a refresh rate of 1 s. As an example, two aircraft data was simulated and tested as shown in Figure 16.
Because of using Google Earth, it was possible to add altitudes for each marker, so a user can see a change in altitude of an aircraft, which would be beneficial for a radio operator to warn an aircraft if they look like they will stray into controlled airspace, based on their altitude. Figure 17 shows an example view. A more accurate altitude is provided in the desktop application in the pop-out window, but the rough marker provided is useful for a quick look at the aircraft.

6. Evaluation and Results

To test if the prototype implementation meets the requirements flight tests were performed in a real aircraft to create a comparable scenario. A detailed test plan has been created and several tests have been carried out to test the functionality prior to the flights. Major test cases are listed below to illustrate the features tested:
  • Mobile application:
    • Determines an accurate position on the ground.
    • Determines an accurate position from a flying aircraft.
    • Determines altitude from a flying aircraft.
    • Calculates ground speed.
    • Calculates aircraft bearing.
    • Transmits data continuously and consistently on the ground.
    • Transmits data continuously and consistently in the air.
    • Begins tracking on button press.
    • Stops tracking, then resumes tracking.
  • Web server:
    • Receives aircraft data.
    • Checks validity of received data.
    • Checks SQL injection in user updates.
  • Desktop application:
    • Reads from the database.
    • Reads past aircraft transmissions to extract data.
    • Extracts CSV or KML file from past aircraft transmissions.
  • User:
    • Updates their aircraft callsign.
    • Updates their username.
    • Defines date/time boundary to extract past transmissions.
    • Filters by aircraft.
  • Main features:
    • Smartphone operates in an aircraft for an hour-long flight, transmitting data.
    • System continues to operate if cellular signal is lost.
    • Two smartphones transmit data simultaneously.
    • Aircraft can be tracked live while they are transmitting
    • Aircraft are accurately displayed according to their actual position.
    • Aircraft statistics window is opened.
    • KML airspace overlay is opened with live aircraft.
All functional tests were carried out and they all passed. Issues were fixed and retested if any. Following two sections, Section 6.1 and Section 6.2, explain the details of the flight tests.

6.1. Flight Test 1

First flight test was held on 16th March 2020 to test the first version of the application. A solo flight lasting from 13:30 to 15:00 which would test the ability to transmit from the air and the accuracy of the tracks. The data was decoded by the prototype desktop application and visualized in Google Earth, as seen in Figure 18.
The first flight test highlighted an overlooked issue which was missed in tests prior to the test. When the device timed out and locked, the location service would still work, meaning coordinates could be obtained; however, transmissions would fail to send, likely due to permissions, meaning the data was not sent to the database. Whenever the device was unlocked during the flight, the device was able to transmit again, which is why the transmissions (aircraft icon) in Figure 18 are consistent until the device auto-locks.
Despite the aforementioned error, the accuracy of the data compared to the instruments on the aircraft was impressive. An example of this occurred during a steady flight at 2000 ft above sea level, and the device reported 2012 ft. Similar results were noticed for the ground speed and bearing, which are both derived from the positional data. The flight tests proved the mobile application’s ability to acquire very accurate data.
Another observation was the lack of interference from the smartphone with the aircraft’s radio, which was a concern during the conception of this research. The aircraft radio could successfully communicate with other aircraft with zero interference.
A follow up test was held on 18th March 2020 after fixing the previous error in the first flight. A small test was held where the device was placed in a car, as well as testing the new update on the desktop application to add a trail to aircraft to map out their path. The tests demonstrated the smartphone tracking data was transmitted consistently, as well as providing accurate data in terms of position, speed, and direction. The aircraft trail also made the data more viewable, as only a single aircraft icon was shown, and the trail gives an indication of the aircraft’s path. When the ‘all transmissions shown’ toggle is selected, all transmissions sent by the device are shown.

6.2. Flight Test 2

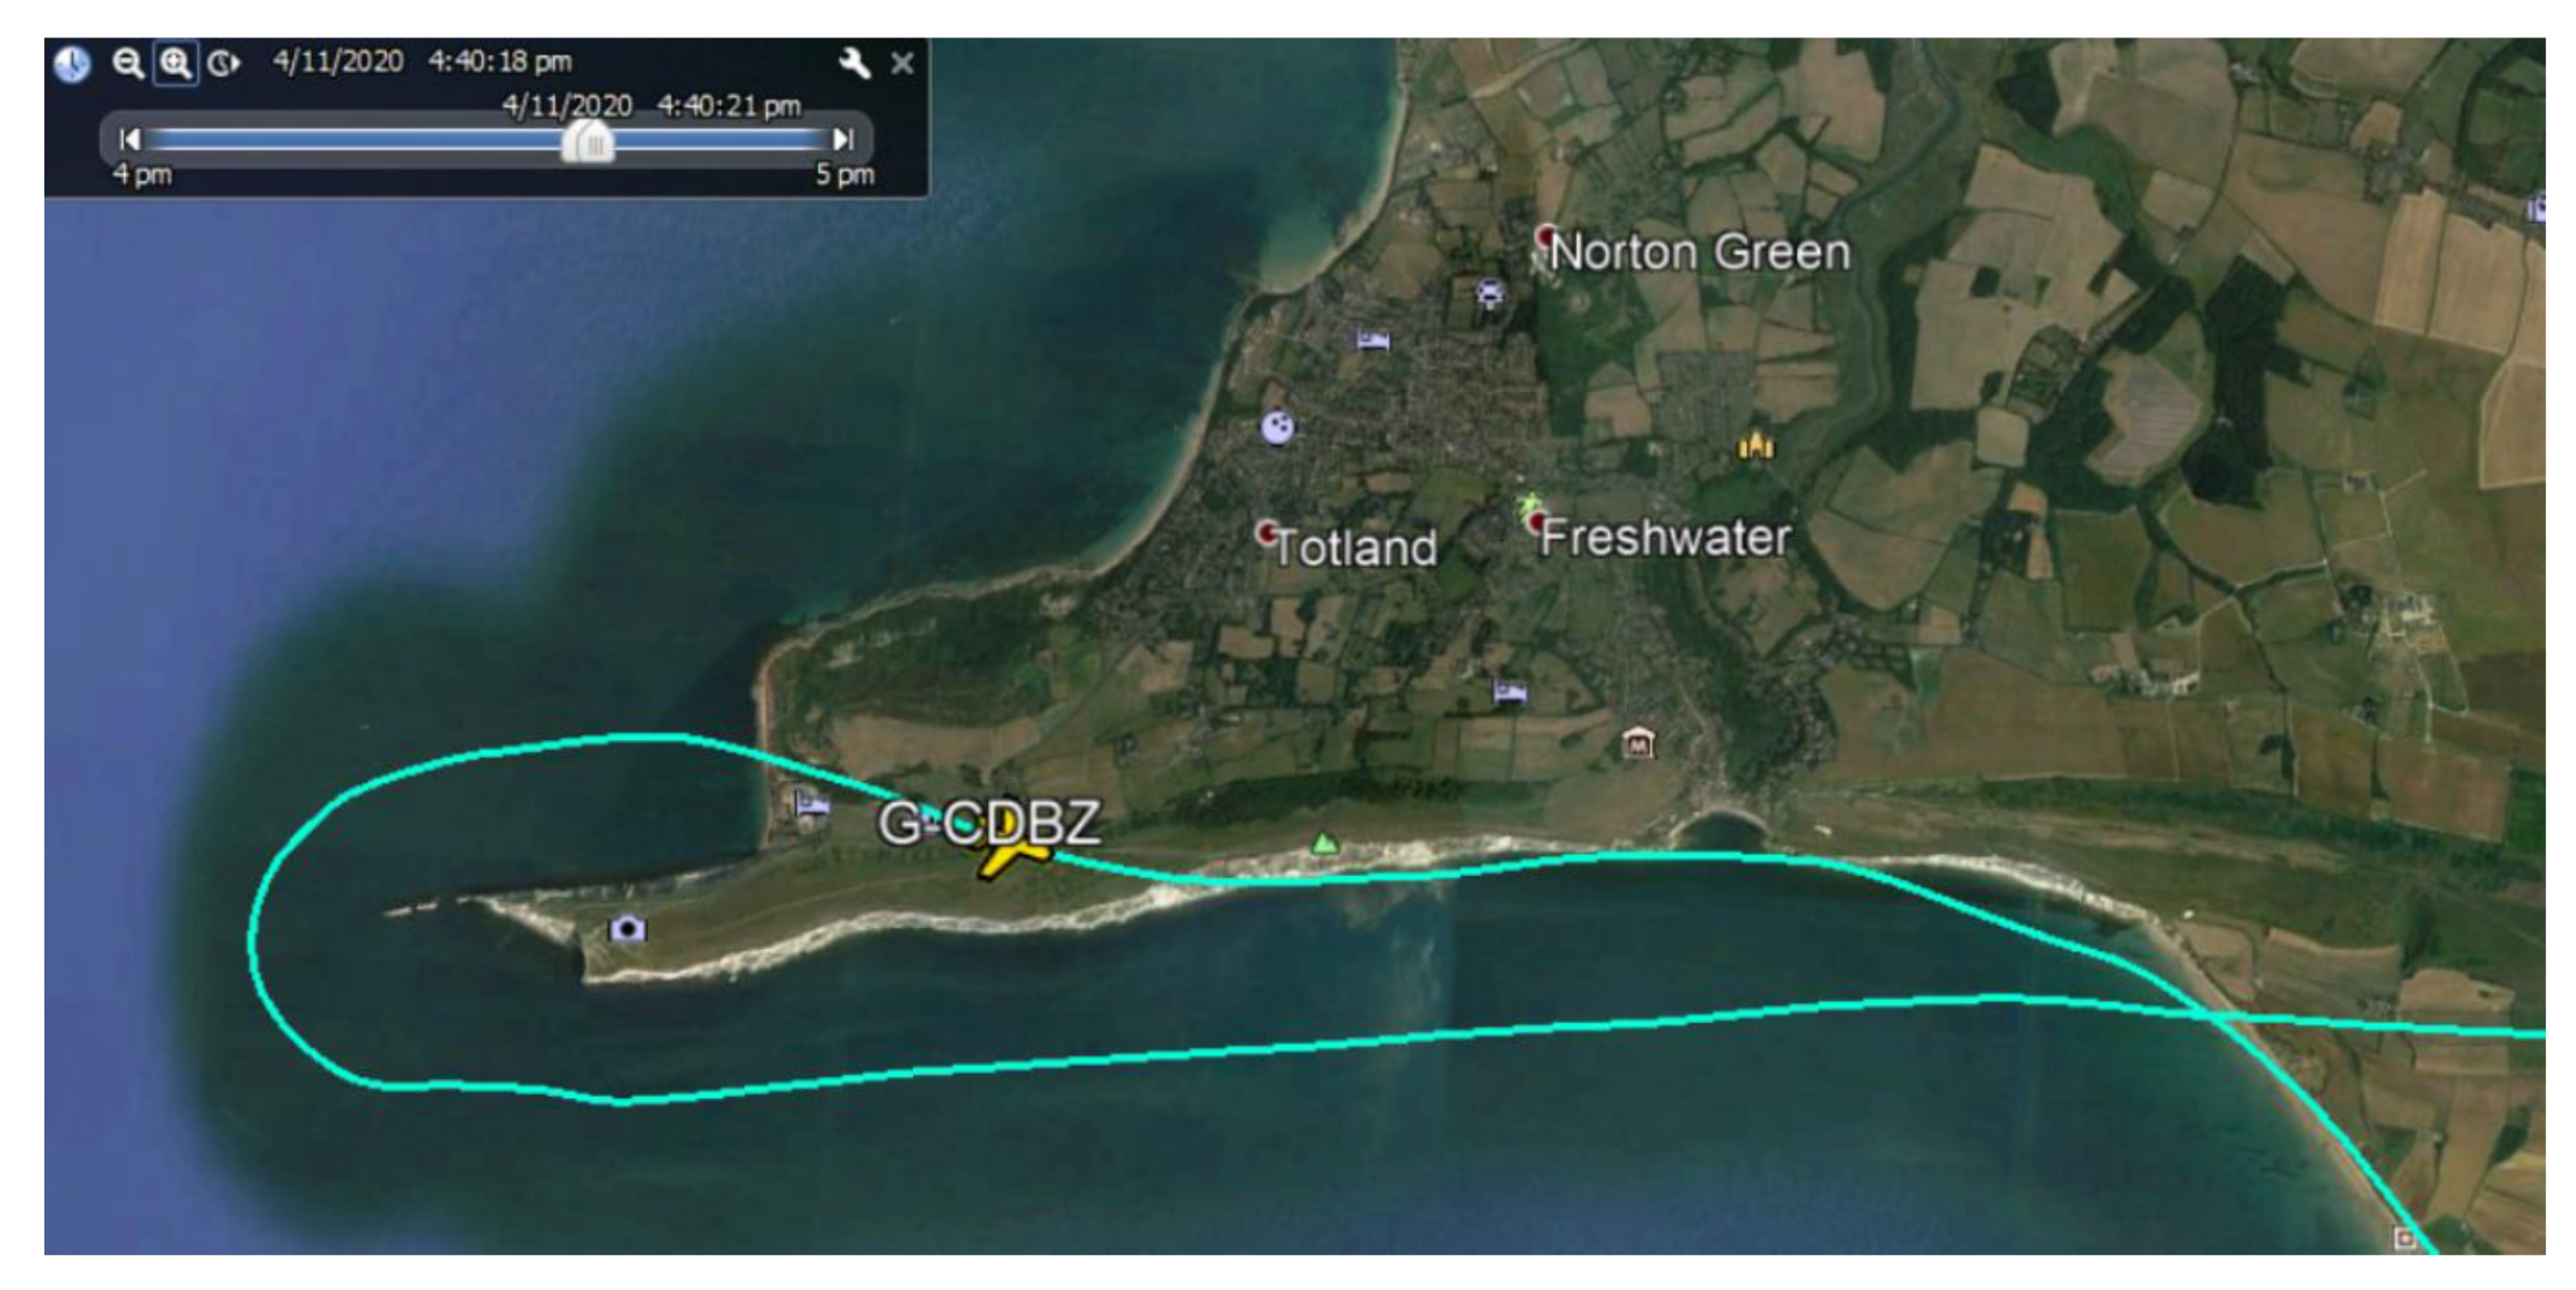
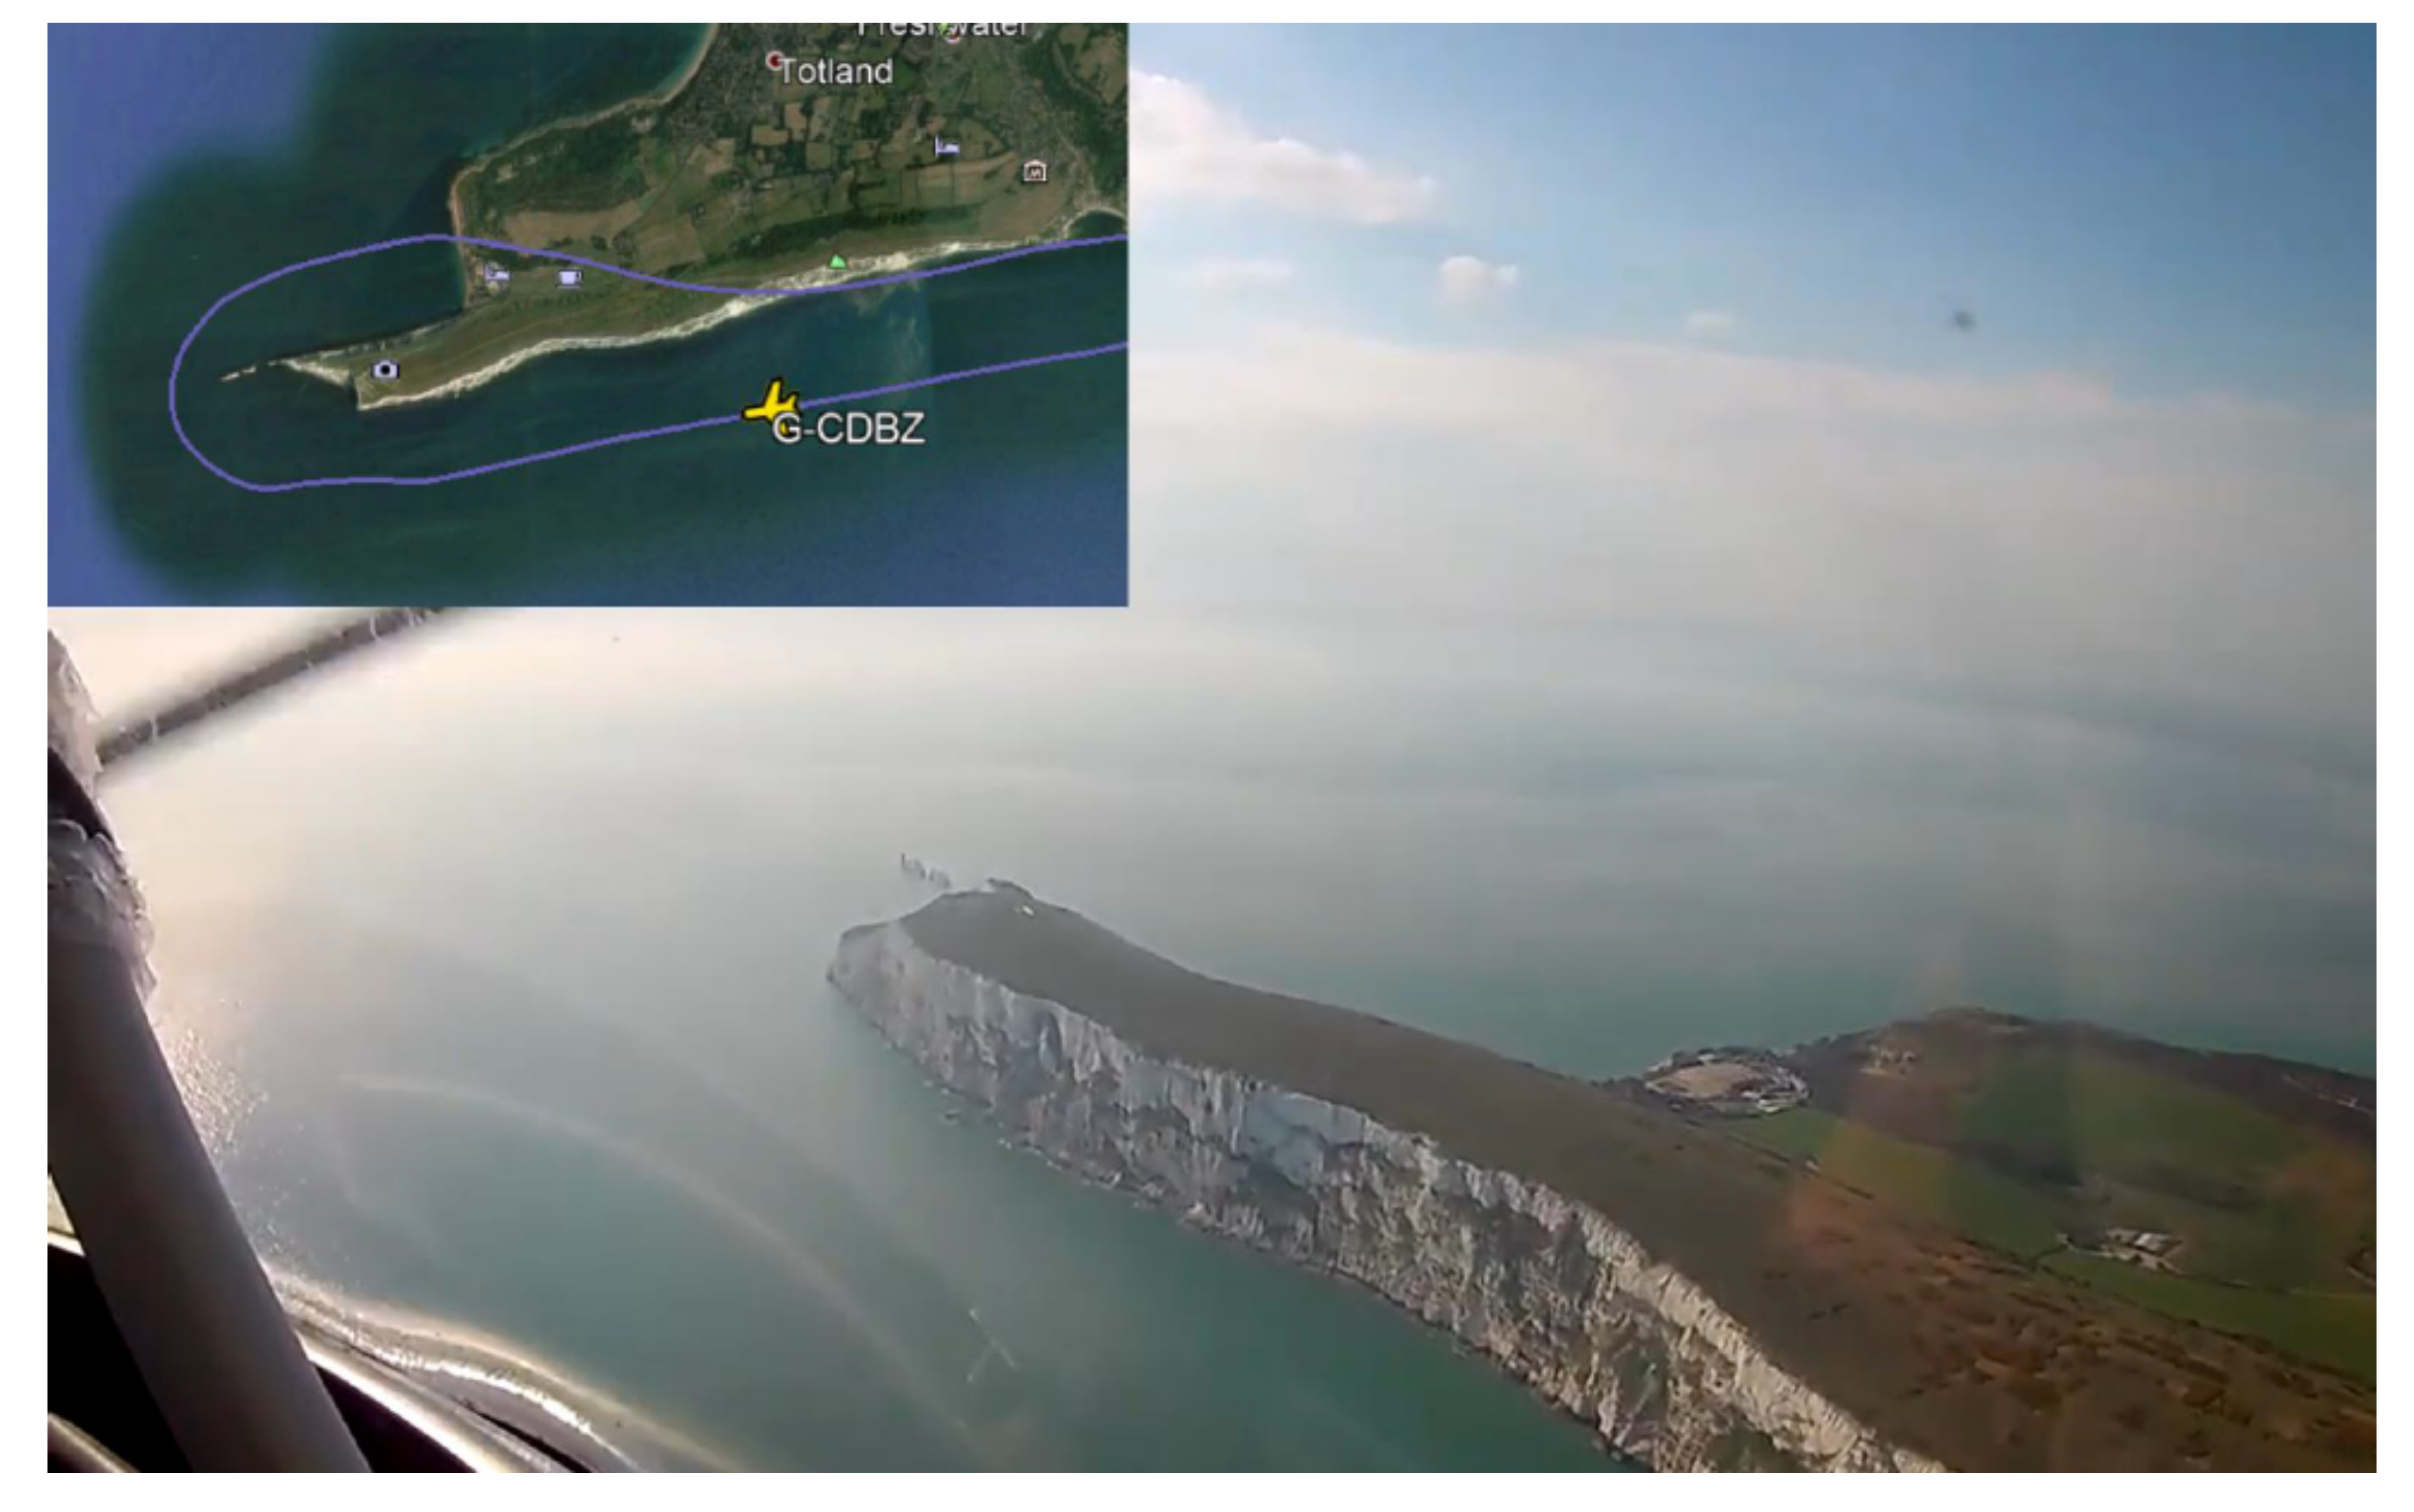
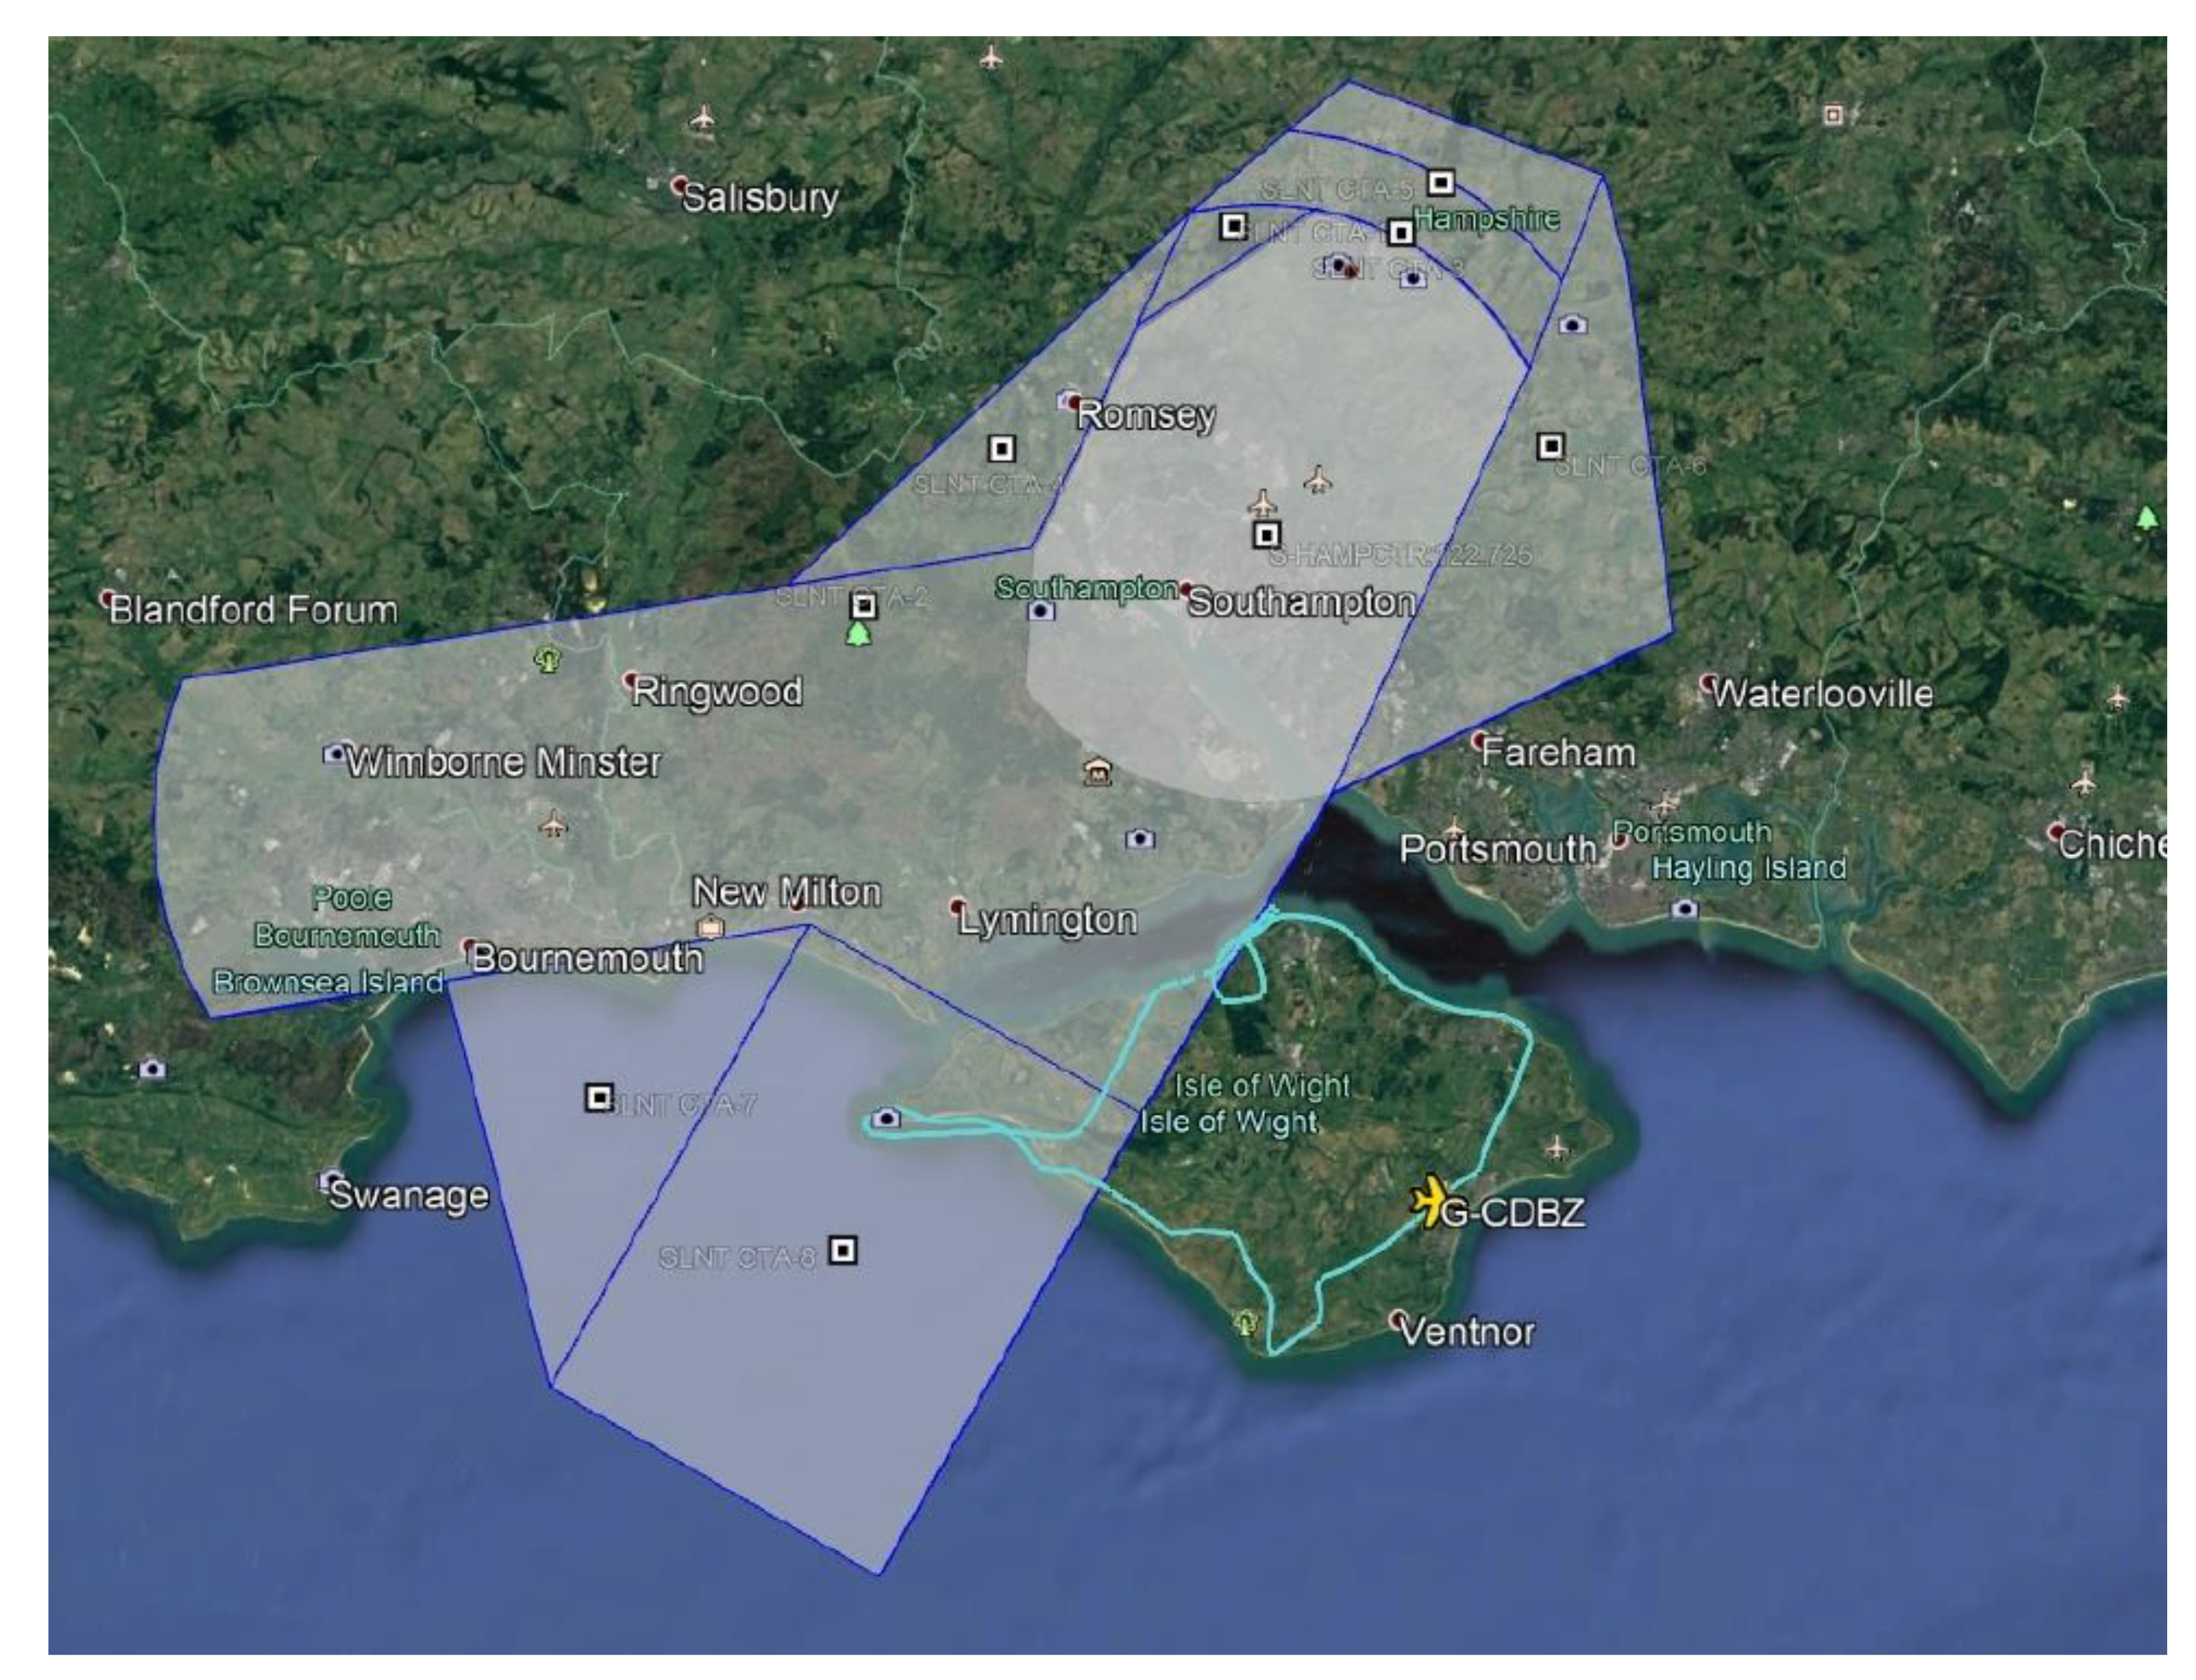
Second flight test was held on 11th April 2020. As the data could be successfully transmitted and played back with good results, the next test will need to be a side-by-side comparison between the transmission and the tracking. For the testing to be thorough the aircraft must be flown at varying altitudes and locations to see if this causes any issues during the transmission. Figure 19 and Figure 20 visualize the tracks for this flight. In Figure 20, overlaid is South Hampshire and Isle of Wight controlled airspace; a user can click on the zones to see the altitudes where this applies.
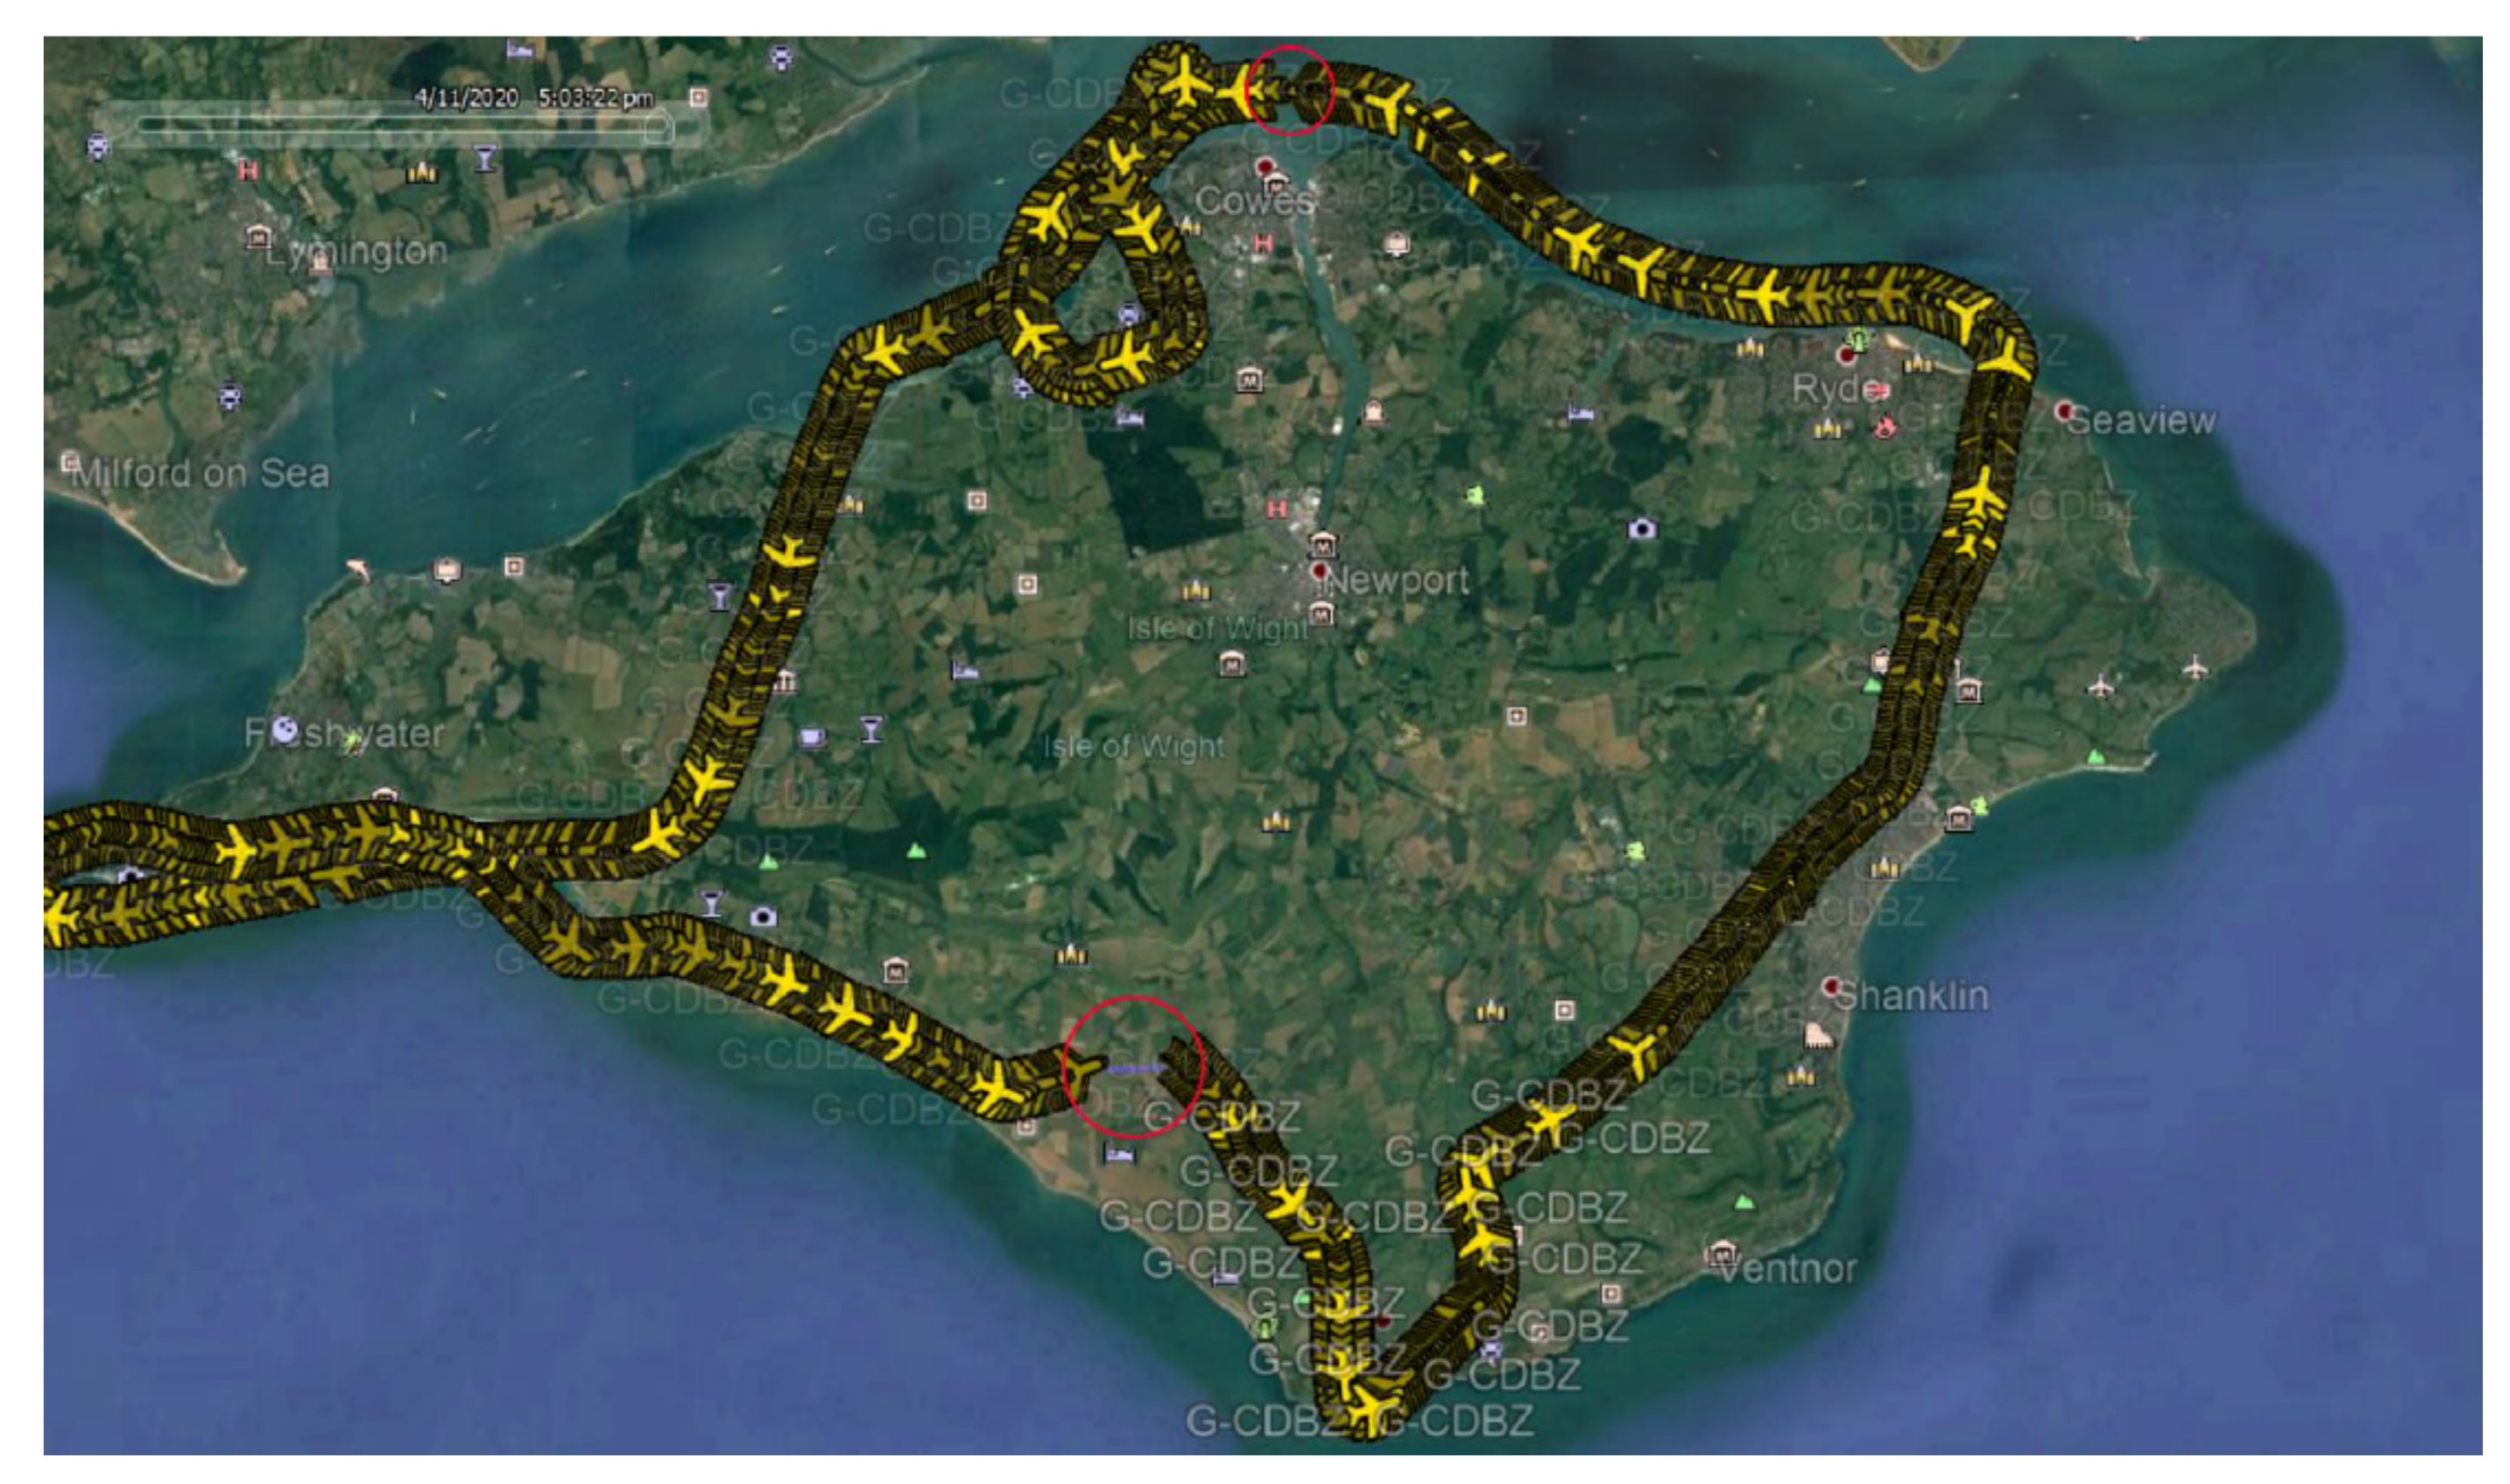
The data produced was highly accurate, with every turn recorded precisely and frequently, because when the view to see all transmissions is enabled, the tracks are consistent throughout, with very few transmissions lost, even when the aircraft was over 3000 ft. Figure 21 displays each aircraft icon as a separate transmission to note the consistency of transmissions throughout. The exception are the areas with a red circle around, the exact reason for the missing transmissions is unknown. A presumption is poor cellular connection.
During the flights, user acceptance testing has demonstrated that the interface is easy to use. In addition, the proposed solution has demonstrated an improved process because of the accuracy and consistency of aircraft tracking while the substantial cost savings over using a transponder.

6.3. Comparative Analysis

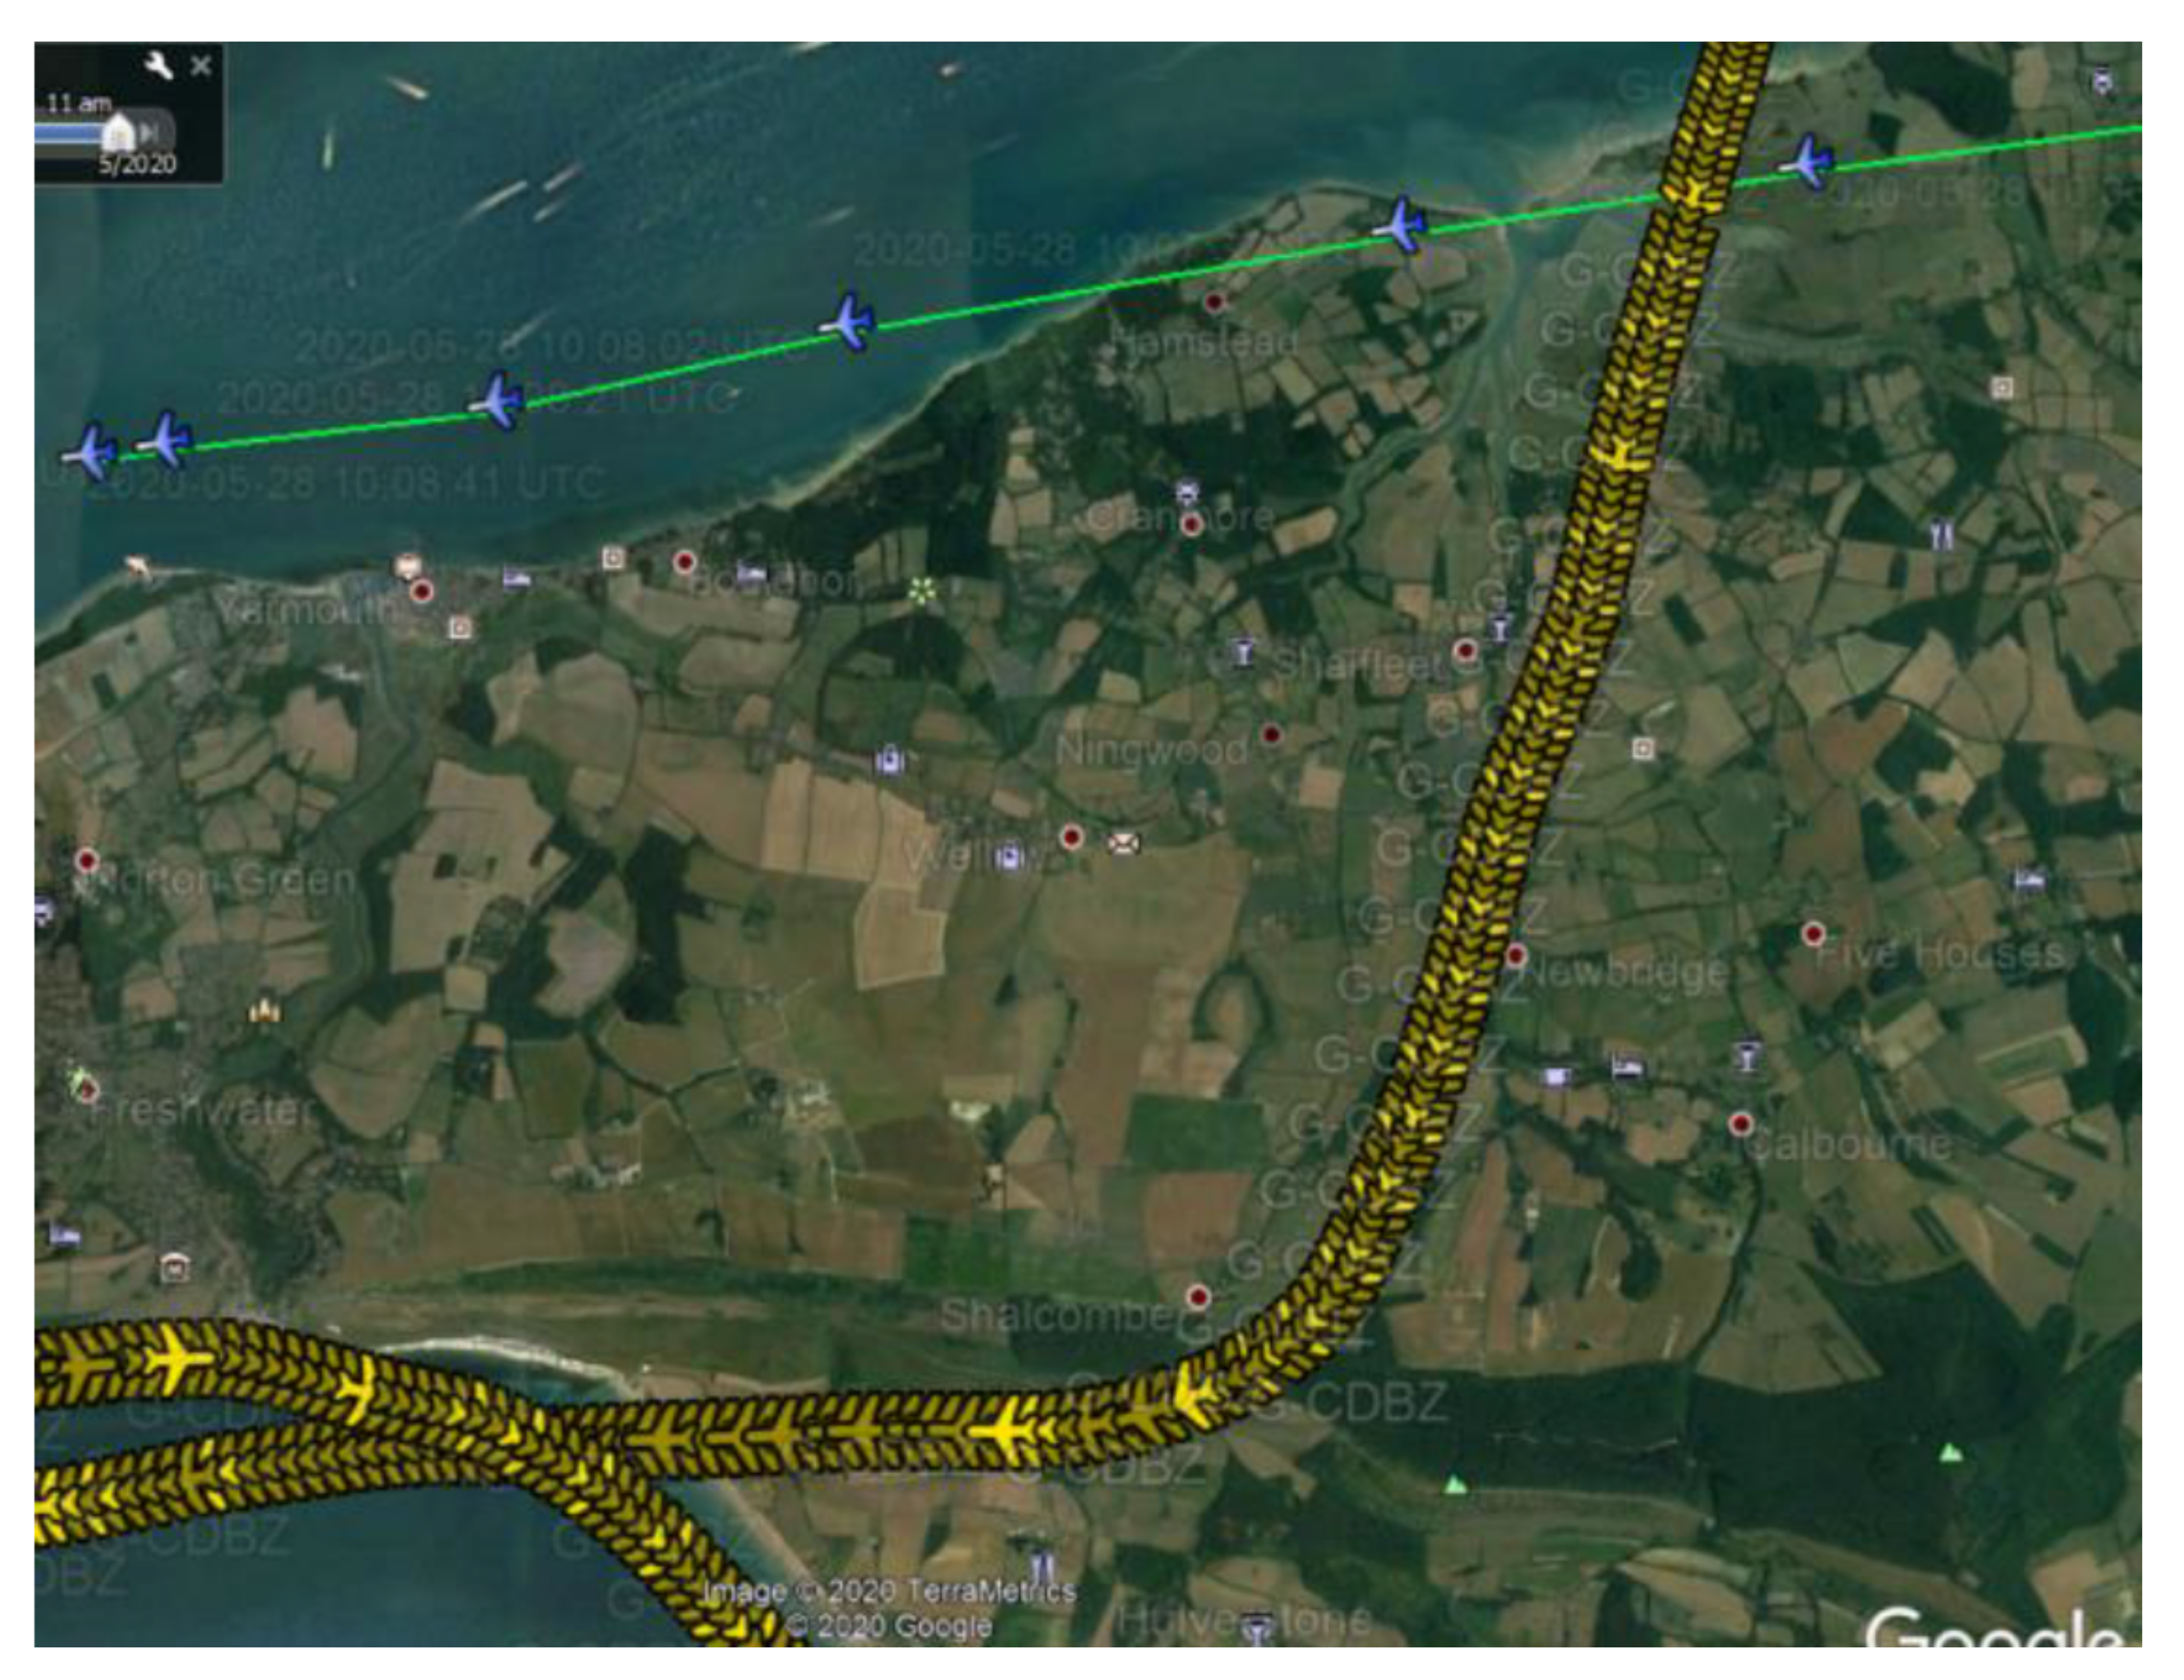
An important part of the project was to overcome the shortcomings of ADS-B on the Isle of Wight with light aircraft. At the airport there is an aircraft (CT-SW) which is fitted with a transponder which could be used in this test. With access to an ADS-B receiver, the outputted data can be used to compare the results with this project and visualized in Google Earth to provide a side-by-side comparison. Historical KML data of a flight in the CT-SW is obtained on Flightradar24, which can be compared to flight data recorded by our prototype. To demonstrate the difference between the current SSR on the Isle of Wight and this project, both tracks have been opened in Google Earth, shown in Figure 22, the blue aircraft and green lines are transmissions from the current fitted SSR whereas yellow aircraft represents transmissions from this project. Yellow path shows more accurate data with more precise location as well as direction information.
The benefits of this project are observable following these flight tests. The ability to achieve live tracking which is accurate and consistent most of the time, easy to setup software, and an intuitive UI. The project demonstrates a great saving to be made over the use of ADS-B and transponders for the light aircraft of the Isle of Wight and most importantly, a great increase in safety for all pilots, as ground crew can track all aircraft positions, which could help in collision avoidance, airspace breaching, lost student pilots. Because the device will continue to transmit even when the aircraft makes an emergency landing, meaning this will aid emergency services to finding the aircraft’s location in the event of aircraft facing emergencies.
The proposed solution is by no means superior to ADS-B and Mode-S for most aircraft, as data transmission on the cellular network cannot function reliably above 4000 ft. However, it excels when performing at low-altitude flying, especially over hills and forests, without investing in a relatively expensive transponder.

6.4. Limitations to the Study

Initially a third flight test was planned which was cancelled due to COVID-19 outbreak. Hence, simulated data is used for further tests. The proof-of-concept implementation is tested with a decent Android smartphone and an Android emulator of a Nexus 5X; however, more tests could be performed with different devices.
Using a smartphone GPS system has a limitation as well. Although using an error correction and calibration mechanism on the receiver eliminated most inaccuracies, more detailed analysis should be carried out to test the efficiency of the solution.
The proof-of-concept implementation is tested on the Isle of Wight with a good 4G coverage, yet more tests should be performed on different areas with multiple aircraft to measure the scalability and performance of the system. On the other hand, we think that our proposed approach and solution will benefit the advances in 5G technology.

7. Conclusions

This research focuses on tracking low-flying aircraft and providing a practical solution for pilots and radio operators. The proposed approach helps to have an improved understanding of the air traffic and in the event of an emergency the position of the aircraft can be relayed to emergency services. The proof-of-concept implementation can collect positional data (latitude, longitude, altitude) from the smartphone accurately and consistently. Smartphone can send the live data to the server whereas the functionality has been tested extensively in the air via the flight tests and with a simulator. Google Earth Pro has been used to show aircraft live as well as showing past flights visually. Ground speed of an aircraft is calculated approximately using the Great Circle Distance formula and two timestamps.
The callsign of the aircraft is transmitted with each message and displayed to the user to identify the aircraft. The desktop application can estimate the vertical rate of the aircraft using timestamps and altitude data. The desktop application shows information provided by the aircraft or looked up online about the aircraft. These include a photograph of the aircraft, the make of aircraft, the current flight data, and callsign. Pilot information can be viewed as well, these include the name of the pilot, emergency contacts, and a photograph. User acceptance testing has demonstrated that the interface is easy to use. In addition, the proposed solution has demonstrated an improved process because of the accuracy and consistency of aircraft tracking while the substantial cost savings over using a transponder.
Potential future improvements would be to support more smart devices and platforms such as branching out to Apple operating systems for the iPhone and the desktop computers. In addition, using a cloud-hosted NoSQL database or a real-time database, such as Firebase, would be better but MySQL is preferred due to limited time and resources. Future work can include using a NoSQL database and testing with many concurrent aircraft.
From the application point of view, while our approach focuses on crewed light aircraft tracking, we believe that it can be applied into low-altitude flying object-tracking in general. Therefore, we are planning to carry out tests with microlight aircraft and especially with smaller unmanned aerial vehicles. Finally, although data validation is performed, more security measures should be put in use to prevent any non-legitimate messages such as data encryption between the smart device and the server or using randomly generated session IDs.

Author Contributions

This work was done mostly during the graduate studies of the first author B.L. under the supervision of the second author D.C. The paper has been improved with the third author’s U.D. review and contributions. B.L. did the research. D.C. provided supervision and guidance as well as reviewed the paper. B.L. and D.C. have written the manuscript. U.D. reviewed the paper and contributed to the outline. All authors have read and agreed to the published version of the manuscript.

Funding

This research received no external funding.

Institutional Review Board Statement

The study was conducted according to the guidelines of Bournemouth University.

Informed Consent Statement

Informed consent was obtained from all subjects involved in the study.

Data Availability Statement

Data is available upon request.

Acknowledgments

The authors would like to thank John Aidan Lynch and Isle of Wight airport for their support during the flight tests.

Conflicts of Interest

The authors declare no conflict of interest.

Abbreviations

The following abbreviations are used in this manuscript:
ADS-BAutomatic Dependent System-Broadcast
BDSBinary Data Store
KMLKeyhole Markup Language
PSRPrimary Surveillance Radar
SSRSecondary Surveillance Radar
UIUser Interface
UXUser Experience

References

  1. Kim, E.; Sivits, K. Blended secondary surveillance radar solutions to improve air traffic surveillance. Aerosp. Sci. Technol. 2015, 45, 203–208. [Google Scholar] [CrossRef]
  2. Semke, W.; Allen, N.; Tabassum, A.; McCrink, M.; Moallemi, M.; Snyder, K.; Arnold, E.; Stott, D.; Wing, M.G. Analysis of Radar and ADS-B Influences on Aircraft Detect and Avoid (DAA) Systems. Aerospace 2017, 4. [Google Scholar] [CrossRef] [Green Version]
  3. RF-Wireless-World. Difference between Primary Radar and Secondary Radar. 2012. Available online: https://www.rfwireless-world.com/Terminology/Primary-radar-vs-Secondary-radar.html (accessed on 4 January 2021).
  4. Ramet. MSSR M10SR—Ramet. 2014. Available online: https://www.ramet.as/mssr-m10sr (accessed on 4 January 2021).
  5. PicClick. Kinetic SBS-3 ADS-B & AIS. 2017. Available online: https://picclick.co.uk/Kinetic-SBS-3-ADS-B-AIS-Aircraft-Marine-222606094455.html (accessed on 4 January 2021).
  6. Schäfer, M.; Strohmeier, M.; Smith, M.; Fuchs, M.; Pinheiro, R.; Lenders, V.; Martinovic, I. OpenSky report 2016: Facts and figures on SSR mode S and ADS-B usage. In Proceedings of the 2016 IEEE/AIAA 35th Digital Avionics Systems Conference (DASC), Sacramento, CA, USA, 25–29 September 2016; pp. 1–9. [Google Scholar] [CrossRef]
  7. De Haan, S.; Sondij, J.; Stringer, S. EMADDC: Towards Operational Collection of Mode-S EHS Observations in Europe. In World Meteorological Organization Newsletter; World Meteorological Organization: Geneva, Switzerland, 2017; Volume 13. [Google Scholar]
  8. Garmin. ADS-B & Transponders | Mode ES, Mode S & Mode C. Available online: https://buy.garmin.com/en-US/US/cInTheAir-cAvionics-cTransponders-p1.html (accessed on 12 March 2020).
  9. UK-Civil-Aviation-Authority. Air Traffic Management Common Requirements. Available online: https://www.caa.co.uk/Commercial-industry/Airspace/Air-traffic-control/Air-navigation-services/The-Air-Traffic-Management-Common-Requirements-Implementing-Regulation/ (accessed on 4 January 2021).
  10. British-Microlight-Aircraft-Association. Technical Information Leaflet Issue 7—Standard Minor Modification—Fitting a Transponder. 2019. Available online: https://www.bmaa.org/files/til_104_transponders.pdf (accessed on 1 March 2021).
  11. Van Diggelen, F. A-GPS: Assisted GPS, GNSS, and SBAS; Artech House: London, UK, 2009. [Google Scholar]
  12. Lin, C.E.; Hung, T.W.; Chen, H.Y. ADS-B Like UTM Surveillance Using APRS Infrastructure. Proc. Inst. Mech. Eng. Part G J. Aerosp. Eng. 2016, 230, 1569–1591. [Google Scholar] [CrossRef]
  13. Castilho, D.S.; Urbina, L.M.; de Andrade, D. STPA for continuous controls: A flight testing study of aircraft crosswind takeoffs. Saf. Sci. 2018, 108, 129–139. [Google Scholar] [CrossRef]
  14. Huan-Jung, L.; Wen-Chi, L.; Chao-Yang, L.; Lin, A.; Chen, H. The Line of Sight Distance Measurement by Drone for CubeSat ADS-B Payload. In Proceedings of the IEEE Eurasia Conference on IOT, Communication and Engineering (ECICE), Yunlin, Taiwan, 3–6 October 2019; pp. 546–549. [Google Scholar] [CrossRef]
  15. Lin, Y.H.; Lin, C.E.; Chen, H.C. ADS-B Like UTM Surveillance Using APRS Infrastructure. Aerospace 2020, 7. [Google Scholar] [CrossRef]
  16. 4G.co.uk. 4G Coverage on the Isle of Wight. 2016. Available online: https://www.4g.co.uk/news/the-isle-of-wight-now-has-strong-4g-coverage/ (accessed on 4 January 2021).
  17. Rekkas, C.; Rees, M. Towards ADS-B implementation in Europe. In Proceedings of the Tyrrhenian International Workshop on Digital Communications—Enhanced Surveillance of Aircraft and Vehicles, Capri, Italy, 3–5 September 2008. [Google Scholar] [CrossRef]
  18. Topková, T.; Pleninger, S. Identification of BDS Registers. In Proceedings of the 10th International Scientific Conference on Aeronautics, Automotive and Railway Engineering and Technologies, Sozopol, Bulgaria, 15–17 September 2018. [Google Scholar] [CrossRef]
  19. Bodart, J. Mode S Surveillance Principle. 2019. Available online: https://www.icao.int/MID/Documents/2019/MICA/MICA-MID%20-%20WP%2002%20-%20Mode%20S%20Surveillance%20Principle.pdf (accessed on 1 March 2021).
  20. Otsuyama, T.; Honda, J.; Shiomi, K.; Minorikawa, G.; Hamanaka, Y. Performance evaluation of Passive Secondary Surveillance Radar for small aircraft surveillance. In Proceedings of the European Radar Conference (EuRAD), Paris, France, 9–11 September 2015; pp. 505–508. [Google Scholar] [CrossRef]
  21. Schäfer, M.; Strohmeier, M.; Lenders, V.; Martinovic, I.; Wilhelm, M. Bringing up OpenSky: A Large-Scale ADS-B Sensor Network for Research. In Proceedings of the 13th International Symposium on Information Processing in Sensor Networks, IEEE, Berlin, Germany, 15–17 April 2014; pp. 83–94. [Google Scholar]
  22. Maas, J.; van Gent, R.; Hoekstra, J. A portable primary radar for general aviation. PLoS ONE 2020, 15. [Google Scholar] [CrossRef] [PubMed]
  23. Šimák, V.; Škultéty, F. Real time light-sport aircraft tracking using SRD860 band. Transport. Res. Procedia 2020, 51, 271–282. [Google Scholar] [CrossRef]
  24. Galati, G.; Perrotta, G.; Di Girolamo, S.; Dellago, R.; Gentile, S.; Lanari, F. Study of an integrated communication, navigation and surveillance satellite system for air traffic management. In Proceedings of the International Radar Conference, Beijing, China, 8–10 October 1996; pp. 238–241. [Google Scholar] [CrossRef]
  25. Shi, F.; Qiu, F.; Li, X.; Tang, Y.; Zhong, R.; Yang, C. A method to detect and track moving airplanes from a satellite video. Remote Sens. 2020, 12. [Google Scholar] [CrossRef]
  26. Hoeher, P.; Badri-Hoeher, S.; Xu, W.; Krakowski, C. Single-antenna co-channel interference cancellation (SAIC) for TDMA cellular radio systems. Wirel. Commun. IEEE 2005, 12, 30–37. [Google Scholar] [CrossRef]
  27. Batory, D. Feature Models, Grammars, and Propositional Formulas. In Proceedings of the 9th International Conference on Software Product Lines, Rennes, France, 26–29 September 2005; Springer: Berlin/Heidelberg, Germany, 2005; pp. 7–20. [Google Scholar] [CrossRef]
  28. Czarnecki, K.; Wasowski, A. Feature Diagrams and Logics: There and Back Again. In Proceedings of the 11th International Software Product Line Conference (SPLC 2007), Kyoto, Japan, 10–14 September 2007; pp. 23–34. [Google Scholar]
  29. Wang, C.; Chen, L.; Zhao, L.; Li, M. Exploring the norms for the UX design of intelligent products: A case study. In Proceedings of the Tsinghua International Design Management Symposium, Shenzhen, China, 1–2 December 2013; pp. 158–165. [Google Scholar] [CrossRef]
  30. Fu, X. Mobile phone UI design principles in the design of human-machine interaction design. In Proceedings of the IEEE 11th International Conference on Computer-Aided Industrial Design Conceptual Design 1, Yiwu, China, 17–19 November 2010; Volume 1, pp. 697–701. [Google Scholar] [CrossRef]
  31. Google. Fused Location Provider API. 2019. Available online: https://developers.google.com/location-context/fused-location-provider (accessed on 5 May 2020).
  32. Wolfram-MathWorld. Great Circle Definition and Formulas. Available online: https://mathworld.wolfram.com/GreatCircle.html (accessed on 25 August 2020).
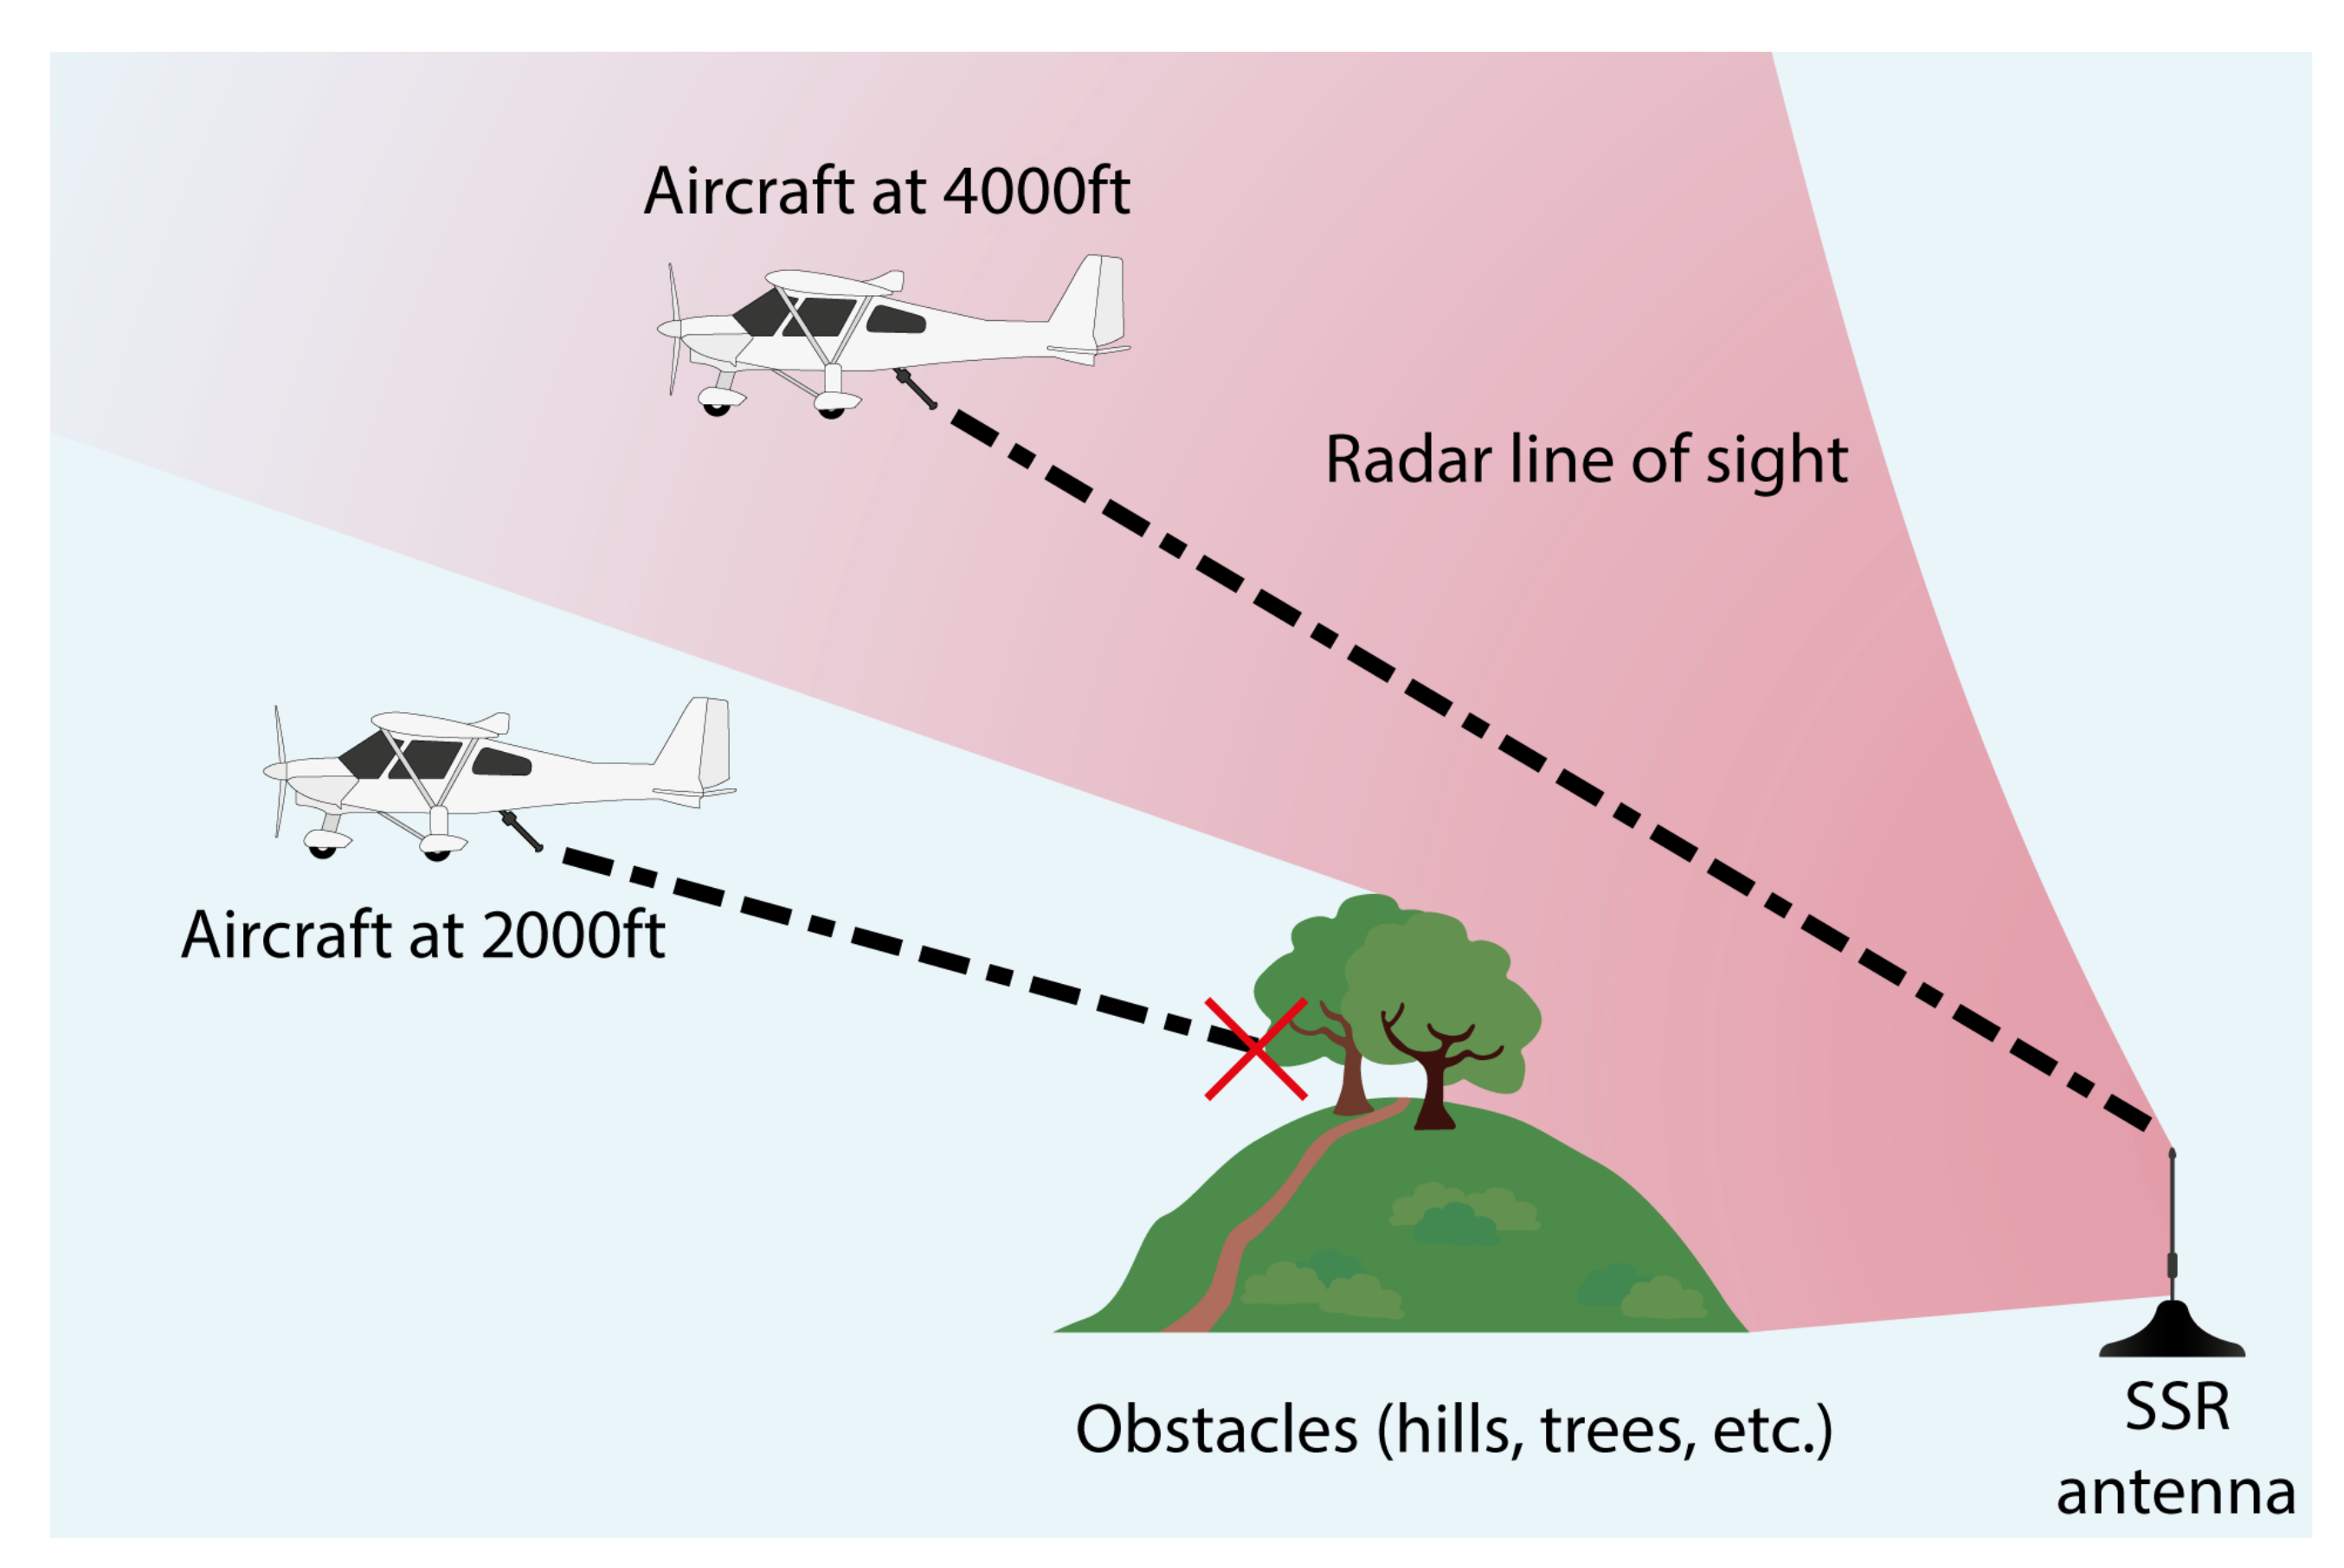
Figure 1. An aircraft at a low altitude is difficult to track with ADS-B/Mode-S where the terrain blocks line of sight to the antenna.
Information 12 00105 g001
Figure 2. 4G coverage on the Isle of Wight, green shows the respective coverage of EE, O2 and Vodafone [16].
Information 12 00105 g002
Figure 3. Feature model for the mobile application.
Information 12 00105 g003
Figure 4. Feature model for the desktop application.
Information 12 00105 g004
Figure 5. Class diagram of the desktop application.
Information 12 00105 g005
Figure 6. Low-fidelity prototype of the mobile application.
Information 12 00105 g006
Figure 7. Low-fidelity prototype for live aircraft tracking on the desktop application.
Information 12 00105 g007
Figure 8. System interaction diagram.
Information 12 00105 g008
Figure 9. An Android Emulator of a Nexus 5X running the mobile application.
Information 12 00105 g009
Figure 10. Partial view of the ‘Transmissions’ table.
Information 12 00105 g010
Figure 11. Partial view of the desktop application UI.
Information 12 00105 g011
Figure 12. Design for the historical data extraction.
Information 12 00105 g012
Figure 13. A screenshot of the historical data view.
Information 12 00105 g013
Figure 14. A screenshot of Google Earth with a live tracked aircraft.
Information 12 00105 g014
Figure 15. A follow up from the previous image, the window can be scrolled on to show more information, which is live updated as the transmissions are received.
Information 12 00105 g015
Figure 16. A screenshot of the application with two flight simulated aircraft instances.
Information 12 00105 g016
Figure 17. A screenshot showing a view which shows the trail of the aircraft’s altitude easier.
Information 12 00105 g017
Figure 18. A screenshot from the first version of the prototype.
Information 12 00105 g018
Figure 19. A photograph taken from G-CDBZ during the second flight test with the aircraft tracking displayed on Google Earth imposed on the top left.
Information 12 00105 g019
Figure 20. A screenshot from the second flight test.
Information 12 00105 g020
Figure 21. A screenshot showing all the transmissions in the second flight test.
Information 12 00105 g021
Figure 22. A comparison between current SSR transmissions (blue) and the transmissions from the devices used in this project (yellow).
Information 12 00105 g022
Table 1. Three most used BDS messages with their respective parameters listed.
BDS No.Message Contents
BDS 4.0Selected altitude (auto-pilot set altitude), and barometric pressure
settings
BDS 5.0Roll angle, true track angle, ground speed, track angle rate (rate at
which aircraft is turning), and true airspeed
BDS 6.0Magnetic heading, indicated airspeed (speed reported by the aircraft’s
instruments), Mach, barometric altitude rate, and inertial vertical rate
Table 2. Interview questions with the pilots.
No.Question
Q1Is your aircraft tracked via a Secondary Surveillance Radar system?
Q2If “Yes” to the previous question, how reliably is the aircraft tracked?
Q3What is your usual cruising altitude?
Q4What are your typical flight plans?
Q5Would you be interested in using a smartphone as a flight tracker?
Q6What features would you like to see in a flight tracking application?
Table 3. Interview questions with the flight instructor.
No.Question
Q1Are any of your aircraft tracked via a Secondary Surveillance Radar system?
Q2If “Yes” to the previous question, how reliably is the aircraft tracked?
Q3What is the usual cruising altitude for your students?
Q4Where would students usually fly?
Q5Would you be interested in tracking your student’s aircraft?
Q6What features would you like to see in a flight tracking application?
Table 4. Interview questions with the radio operators.
No.Question
Q1How well does your current aircraft tracking system perform?
Q2If all the aircraft that landed here were tracked, would it make your work
easier?
Q3What would you like to see in an application to track aircraft?
Q4How do you think this application could improve air safety?
Publisher’s Note: MDPI stays neutral with regard to jurisdictional claims in published maps and institutional affiliations.