Article

Optimization of the Mashaer Shuttle-Bus Service in Hajj: Arafat-Muzdalifah Case Study

1
Deanship of Scientific Research, Umm Al-Qura University, Makkah 24382, Saudi Arabia
2
Department of Computer Engineering, Umm Al-Qura University, Makkah 24382, Saudi Arabia
3
Institute of Consulting Research and Studies, Umm Al-Qura University, Makkah 24382, Saudi Arabia
*
Author to whom correspondence should be addressed.
Information 2021, 12(12), 496; https://doi.org/10.3390/info12120496
Submission received: 31 October 2021 / Revised: 23 November 2021 / Accepted: 23 November 2021 / Published: 29 November 2021
(This article belongs to the Special Issue Big Spatial Data Management)

Abstract

:
Hajj, the fifth pillar of Islam, is held annually in the month of Dhul Al-Hijjah, the twelfth month, in the Islamic calendar. Pilgrims travel to Makkah and its neighbouring areas—Mina, Muzdalifah, and Arafat. Annually, about 2.5 million pilgrims perform spatiotemporally restricted rituals in these holy places that they must execute to fulfil the pilgrimage. These restrictions make the task of transportation in Hajj a big challenge. The shuttle bus service is an essential form of transport during Hajj due to its easy availability at all stages and ability to transport large numbers. The current shuttle service suffers from operational problems; this can be deduced from the service delays and customer dissatisfaction with the service. This study provides a system to help in planning the operation of the service for one of the Hajj Establishments to improve performance by determining the optimal number of buses and cycles required for each office in the Establishment. We will also present a case study in which the proposed model was applied to the non-Arab Africa Establishment shuttle service. At the same time, we will include the mechanism for extracting the information required in the tested model from the considerably large GPS data of 20,000+ buses in Hajj 2018.

1. Introduction

Hajj takes place in Makkah, Saudi Arabia, one of the world’s most crowded events. Every year, around 2.5 million pilgrims gather from different cultures all over the world to perform rituals restricted in location between Makkah city and Mina, Muzdalifah, and Arafat holy sites, and between the 8th and the 13th of Dhul Al-Hijjah in the Islamic calendar. Based on their nationality, Pilgrims from around the world are split into zones also known as Establishments such as Southeast Asia, South Asia, Arab Countries. The Mashaer (Holy sites in Makkah including Mina, Muzdalifah and Arafat) area is divided into seven Establishments where each Establishment has its camps, routes and parking spaces to handle the movement of pilgrims as shown in Figure 1. Each Establishment is further divided into companies/offices where each office mostly has pilgrims from one nationality and around 1000–5000 pilgrims depending on their assigned camp in the Mina (known as the city of tents and it is 8 kilometres (5 miles) southeast of the city of Makkah) area. In Hajj, pilgrims are assigned to Establishments according to their geographical distribution consisting of offices responsible for their transportation and accommodation during the entire journey of Hajj. The Hajj journey begins on the morning of day 8 with the arrival of pilgrims from Makkah to Mina. The following day (day 9), pilgrims move to Arafat and stay till sunset. At sunset, pilgrims move to Muzdalifah to fulfil the night stay ritual. From the midnight of the 10th day to the morning, pilgrims move from Muzdalifah to Mina to perform the Stoning of the Devil ritual. Then, they stay in Mina or Makkah for the following two/three days (11th, 12th, and 13th), after which the pilgrimage ends. One of the biggest challenges that Establishments face during Hajj transporting pilgrims safely, quickly, and comfortably between these holy places according to the spatial and temporal restrictions of the rituals.
The transportation services available to Hajj pilgrims for movement between the holy sites are walking facilities, regular buses (restricted to single round only), shuttle buses, or the Mashaer train. The availability of these services to the pilgrims depends on their availability to the Establishments at the location of each phase of Hajj. Among these services, the shuttle bus is the heaviest running service in Hajj. It functions during all the phases of Hajj and transports the greatest number of pilgrims. For example, the service transports around 1.5 million pilgrims on the first Efadah Muzdalifah, which is the phase when pilgrims on the 9th move from Arafat to Muzdalifah (https://www.stats.gov.sa/sites/default/files/hajj_1439_en.pdf) (accessed on 20 August 2021).
The shuttle service was established in 1992 to transport pilgrims by bus between offices on two different holy sites with pre-set cycles and on isolated routes— like those between Arafat and Muzdalifah. In Figure 1, different colours represent the distribution of Establishments on the map and the shuttle service routes. A complete cycle of the service starts and ends at the same location: Arafat, for example. At present, the number of buses assigned to an Establishment is planned in advance by the Ministry of Hajj, relying only on an approximate number of pilgrims. The Establishments’ current approach to distribute buses and set cycles for each office is dependent on the previous years’ experiences [1]. The problem with this approach is that it might lead to random assignment of buses. Buses might be allocated to offices with quicker service times when they could’ve been assigned to offices with slower service times to improve service. The current operation of the service exhibits inefficient functioning of the service. Thus, an approach that can assess the service time of offices and accordingly allocate the desired number of buses to them that achieve enhanced and reliable service is the need of the hour to have.
In this study, we have developed a tool to help the ministry of Hajj and the Establishment’s parties plan the shuttle-bus service operation configuration. The proposed optimization model determines the optimal number of buses and cycles be assigned to each Establishment office running a shuttle service between Arafat and Muzdalifah to operate it in minimal service time. We also conduct a sensitivity analysis on the proposed model parameters through a varying number of pilgrims in the office, the dwell time in Arafat, and the bus-seat capacity to identify potential factors for service improvement. To examine the proposed model with the African Non-Arab Countries Establishment, GPS traces of more than 20,000 buses were obtained from the car syndicate authority (Naqaba), Ministry of Hajj, and Umrah, Saudi Arabia (https://www.haj.gov.sa/en/InternalPages/Details/92) (accessed on 25 June 2021). They were then migrated to big data platform, enriched, filtered, and analysed to extract the shuttle bus service-related data at the Establishment, including the offices’ pick-up and drop-off times, Arafat-Muzdalifah path’s travel times, and the number of pilgrims at the offices.
The article provides extension of our previous work [1,2] to identify the optimal number of buses and cycles required to transport pilgrims in minimal service time. Section 2 of this paper provides the state-of-the-art. Section 3 outlines the model development. Section 4 focuses on numerical analysis of sensitivity along with the case study. This is followed by the conclusion and suggestions regarding future research on this topic.

2. Literature Review

GPS technology has been launched for all Hajj buses to collect their spatial and temporal information to monitor, manage, and enhance transportation by regular and shuttle buses. At the same time, the concept of big data has been relied upon as a means of storing the massive GPS data streaming from these buses. This will be used later to provide real-time, proactive administrative, and analytical systems for authorities that improve the efficiency of bus transportation during Hajj. This section will review the literature on emerging bus and shuttle GPS applications, in general, as well as in the Hajj domain.

2.1. Bus GPS Applications

The available literature in this field has revealed the dependency of researchers on several sources in collecting spatial-temporal data like embedded GPS devices in buses, vehicles, smartphones, etc., for monitoring, designing, and controlling bus transportation. Relying on the buses’ GPS data, ref. [3] developed a college bus tracking android application. ref. [4] designed a bus schedule by partitioning bus operating hours into intervals with selected bus dwell time and inter-stop travel time based on the passenger demand and network traffic state. Refs. [5,6] introduced systems that predict and display to passengers at-stop bus travel time. Ref. [7] predicted arrival time at-stop and ref. [8] to next stop at signalized intersection. Ref. [9] visualized and identified congestion hot spots in roadways. Ref. [10] applied machine learning to explore trip fuel consumption. Refs. [11,12] estimated and assessed traffic speeds on a roadway. Other GPS data like taxi GPS traces in ref. [13], and ref. [14], and bus passengers’ smartphone GPS data in [15] were used to plan bus routing and predict bus arrival time at various bus stops, respectively. Ref. [16] proposed a recommender system to recommend the best route for university shuttle bus service using Artificial Neural Network and Support Vector Machine. The path from source and destination is a combination of multiple sections or roads, and to find the ideal time of overall journey, authors [17] used a genetic algorithm to find the optimum average time of each section of the road separately. These applications are just to name a few, and the literature is full of other relevant studies.
In the Hajj domain, bus GPS applications are still emerging. Authors in [2] developed an interactive platform to store the GPS trace of 20,000+ buses collected in Hajj 2018 in big data. Later, they analyzed the transformed data to visualize Establishments, offices, bus companies, parking slots, etc., in Hajj and even the movements of individual buses over a period of time.

2.2. Shuttle Bus GPS Applications

The applications of GPS technologies on shuttle bus service in the literature appeared in serving the proposal of bus tracking systems like those in [18,19,20], planning of the bus routes [21] and stops [22], prediction of the bus arrival time at-stop in an educational institution [23], designing of a shuttle bus reservation service for a university campus students [24], the introduction of the concept of electric shuttle bus service [25], spatial perspective deficiencies in transport infrastructure [26] and autonomous shuttle bus [27]. Various GPS data sources were utilized in these applications, such as GPS sensory in-vehicle (e.g., car, taxi, or bus), stand-alone device, smart card, and smartphone.
The literature shows a scarcity in the shuttle bus GPS applications in the Hajj domain due to the limited availability of relevant data. Most of the studies presented in this field are attempts through the use of RFID tags on buses for monitoring purposes as presented in [28] or computer simulation models to analyze performance and design the service. Refs. [29,30,31] proposed a conceptual model for the shuttle bus service operating on the day of Nafarah (i.e., on the night of the 10th day of Dhu al-Hijjah when pilgrims move from Arafat to Muzdalifah) and then translated it into a computer simulation model using ProModel with extensive parameters relate to pilgrims, bus, and road networks data. The proposed stochastic model was validated using real-data of 1996 Hajj and subsequently analyzed to determine the impact of the number of bus stops and stop spacing on the evacuation and average travel time. The number of buses assigned to each service office was also considered. Ref. [32] utilized the Arena Simulation system to model the existing shuttle bus service in Hajj 2002 to understand the service characteristics and limitations and to find a proper operational plan for the service. An interesting finding in this study expresses the need for having 500 buses, at least, to maintain a reasonable evacuation time. The authors of this study further extended this work in [33] to simulate the possible operation of South East Asia Establishment with the service. Their model was validated with real-world data of Hajj 2004.
Although interesting finds have been revealed by the studies related to Hajj shuttle buses in the aspects of service design and performance evaluation, they are limited in two ways. First, the data used in the evaluation of the proposed systems were manually collected in the field. Second, their systems were designed according to the service operation scheme of the study year, running each bus for three cycles only. An improved system can be attained by determining the number of cycles for the offices based on the capacity of each office, which can be measured from the service time of the cycle’s leader (or first) bus. With such a system, continuous loading of pilgrims from an origin—like a stop in Arafat—can be achieved through running buses in circular cycles at full capacity. At the same time, this study also evaluates the proposed system with more accurate data, such as GPS data.

3. Model Development
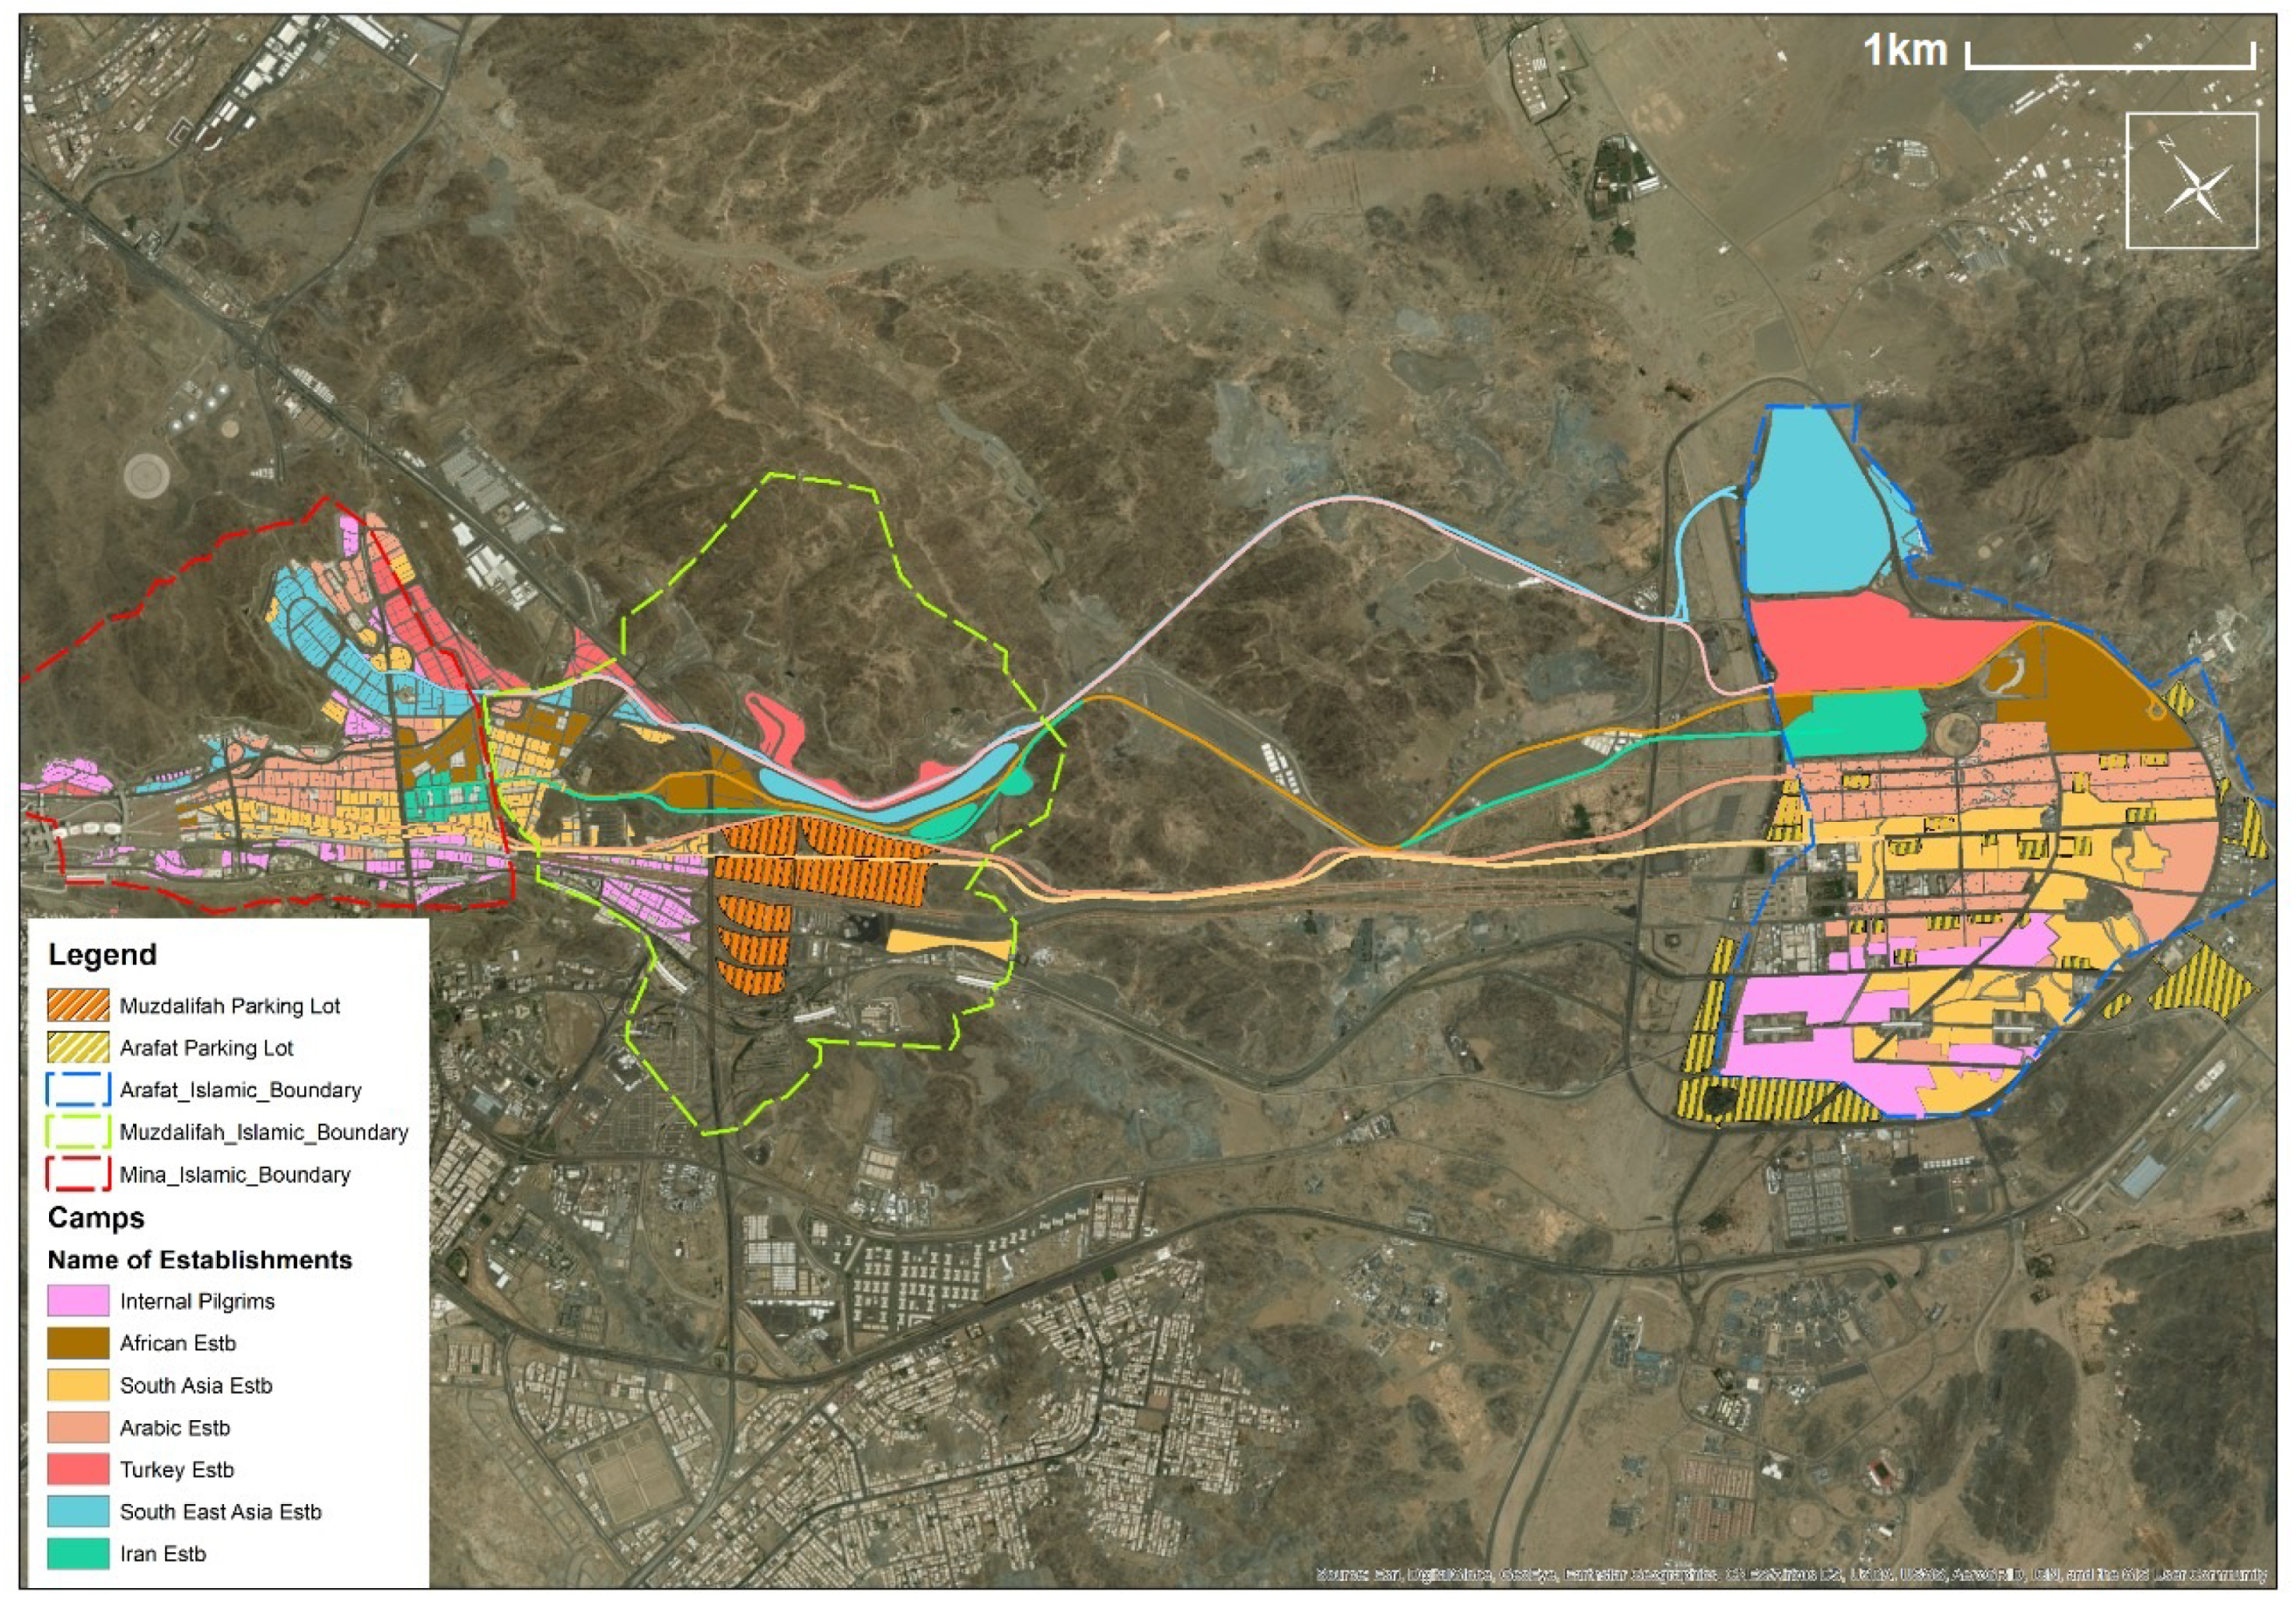
3.1. Setting

To break down the problem into pieces, let us consider one Establishment in Arafat and Muzdalifah and index its offices as i I 1 , 2 , , I with a total of P i pilgrims waiting for shuttle buses at the Arafat office stop i. Let us further assume that the Establishment is limited in resources as it only has N buses in total, with a capacity of B c seats per bus. Since this is a shuttle service, it is anticipated that each bus will serve more than one cycle at one office to discharge all its pilgrims to Muzdalifah. Let us define the length of one cycle at office i, denoted by C L i , as the time between the departure and return of the first bus in the service from and to the office in Arafat, marked with the first red line in Figure 2. C L i can be estimated by (1) from the average pick-up time at the office i in Arafat, denoted by P T i ; the average travel time on the link between Arafat and Muzdalifah, denoted by T T 1 ; the average drop-off time at office i in Muzdalifah, denoted by D T i ; and the average travel time on the returning link between Muzdalifah and Arafat, denoted by T T 2 . Figure 3 illustrates the proposed service configuration.
C L i = P T i + T T 1 + D T i + T T 2
where:
  • CL i 
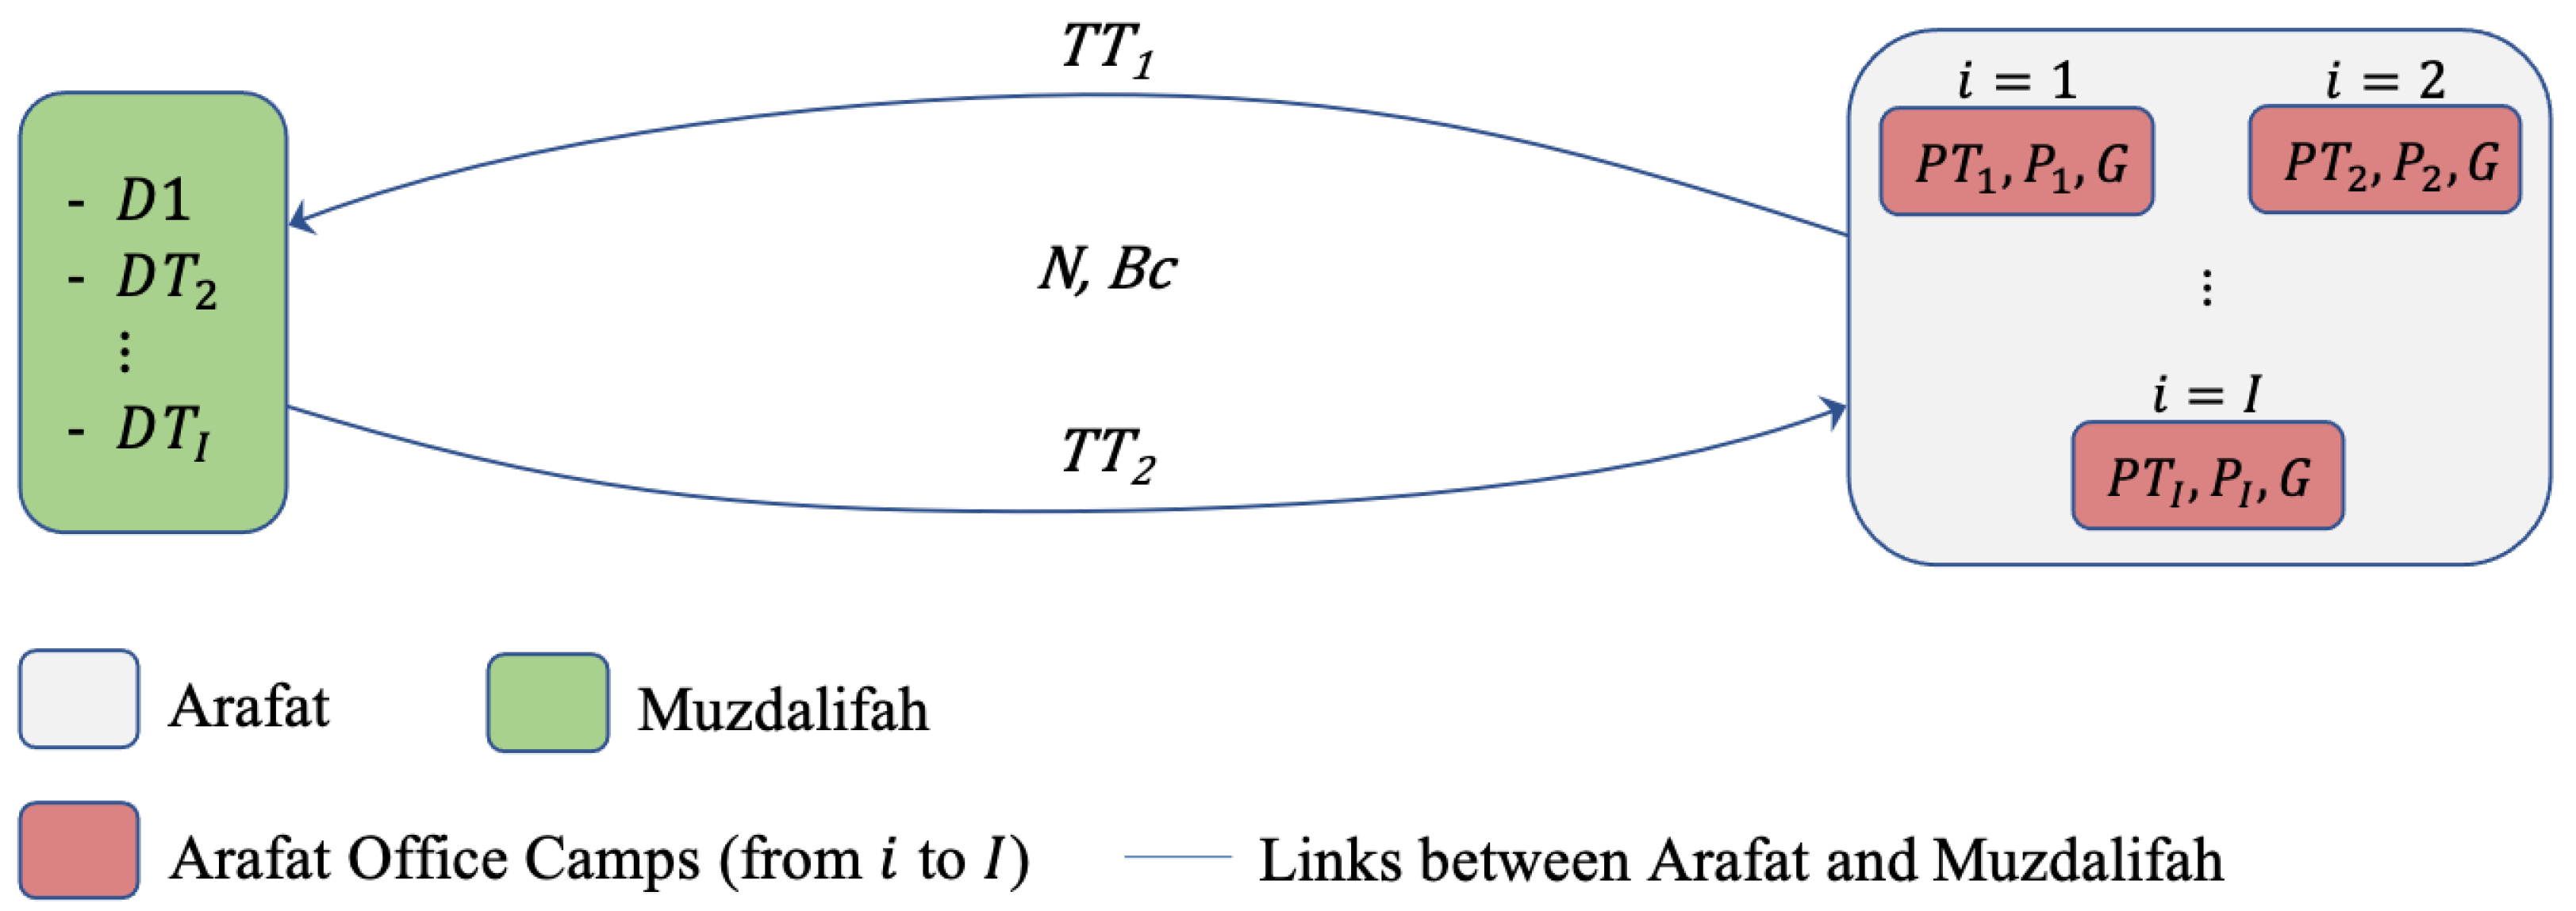
= The length of one cycle at office i
  • PT i = The average pick-up time at the office i in Arafat
  • TT 1 = The average travel time on the link between Arafat and Muzdalifah
  • DT i = The average drop-off time at office i in Muzdalifah
  • TT 2 = The average travel time on the returning link between Muzdalifah and Arafat
Since the first bus can be used as soon as it returns to the office in Arafat, the number of buses that can be assigned to office i during one cycle, denoted by J i , can be calculated by (2), given that G defines the time gap between the departure of one bus and the arrival of another at the stop. J i is formulated to account for the case when the Establishment has been provided with the pre-specified total number of buses—denoted by N—or when the pilgrims in the Arafat office are few so that the full capacity of buses per cycle is unnecessary.
J i = min N , P i B c , C L i max P T i , D T i + G
where:
  • J i = The number of buses can be assigned to office i during one cycle
  • N = The total number of pre-specified buses in the Establishment
  • P i = The total number of pilgrims waiting for shuttle buses at the Arafat office stop i
  • B c = The bus seat capacity
  • G = The time gap between the departure of one bus and arrival of another at the stop
With J i , P i , and B c , the total number of cycles required for an office i to transfer all its pilgrims to Muzdalifah denoted as C i can be given by (3).
C i = P i J i B c
where:
  • C i = The total number of cycles required for an office i to transfer all its pilgrims to Muzdalifah
In the next section, we formulate, the function that estimates the Establishment’s overall service time from individual offices, and the Hajj shuttle bus service optimization problem that solves for the optimal number of buses needed at each office in the Establishment to service with the minimum time.

3.2. Formulation

The Arafat-Muzdalifah shuttle bus service time per Establishment is formulated, as in (4), to estimate the overall service time of an Establishment, denoted by S T . In S T , the service time of any office i is composed of two parts. The first part is an estimate of the time it operated in full cycle’s capacity, determined from C L i and C i cycles. While the second part is an estimate of the needed time by the J C i 1 buses in the last cycle to return to the office in Arafat, where J C i denotes the number of buses required in the last cycle in any office i. When J C i equals J i , it indicates that the pilgrims in the last cycle require the same number of buses as in the previous cycles, however, when the number of remaining pilgrims is small, so that fewer buses are required in the last cycle than the previous cycles, J C i can be given by the upper equation in (5). This usually occurs, for example, when an office consists of P i = 2100 pilgrims with J i = 20 buses operating to transport the pilgrims to Muzdalifah with B c = 50 seats. In this case, C i = 2.1 cycles, and the office will need only J C i = 2 buses at the last cycle to transport the remaining 100 pilgrims.
S T = i C L i max 1 , C i + D T i + G J C i 1
J C i = C i m o d C i J i if C i m o d C i > 0 J i otherwise
where:
  • ST = The overall service time of the Establishment
  • J C i = The number of buses required in the last cycle in any office i
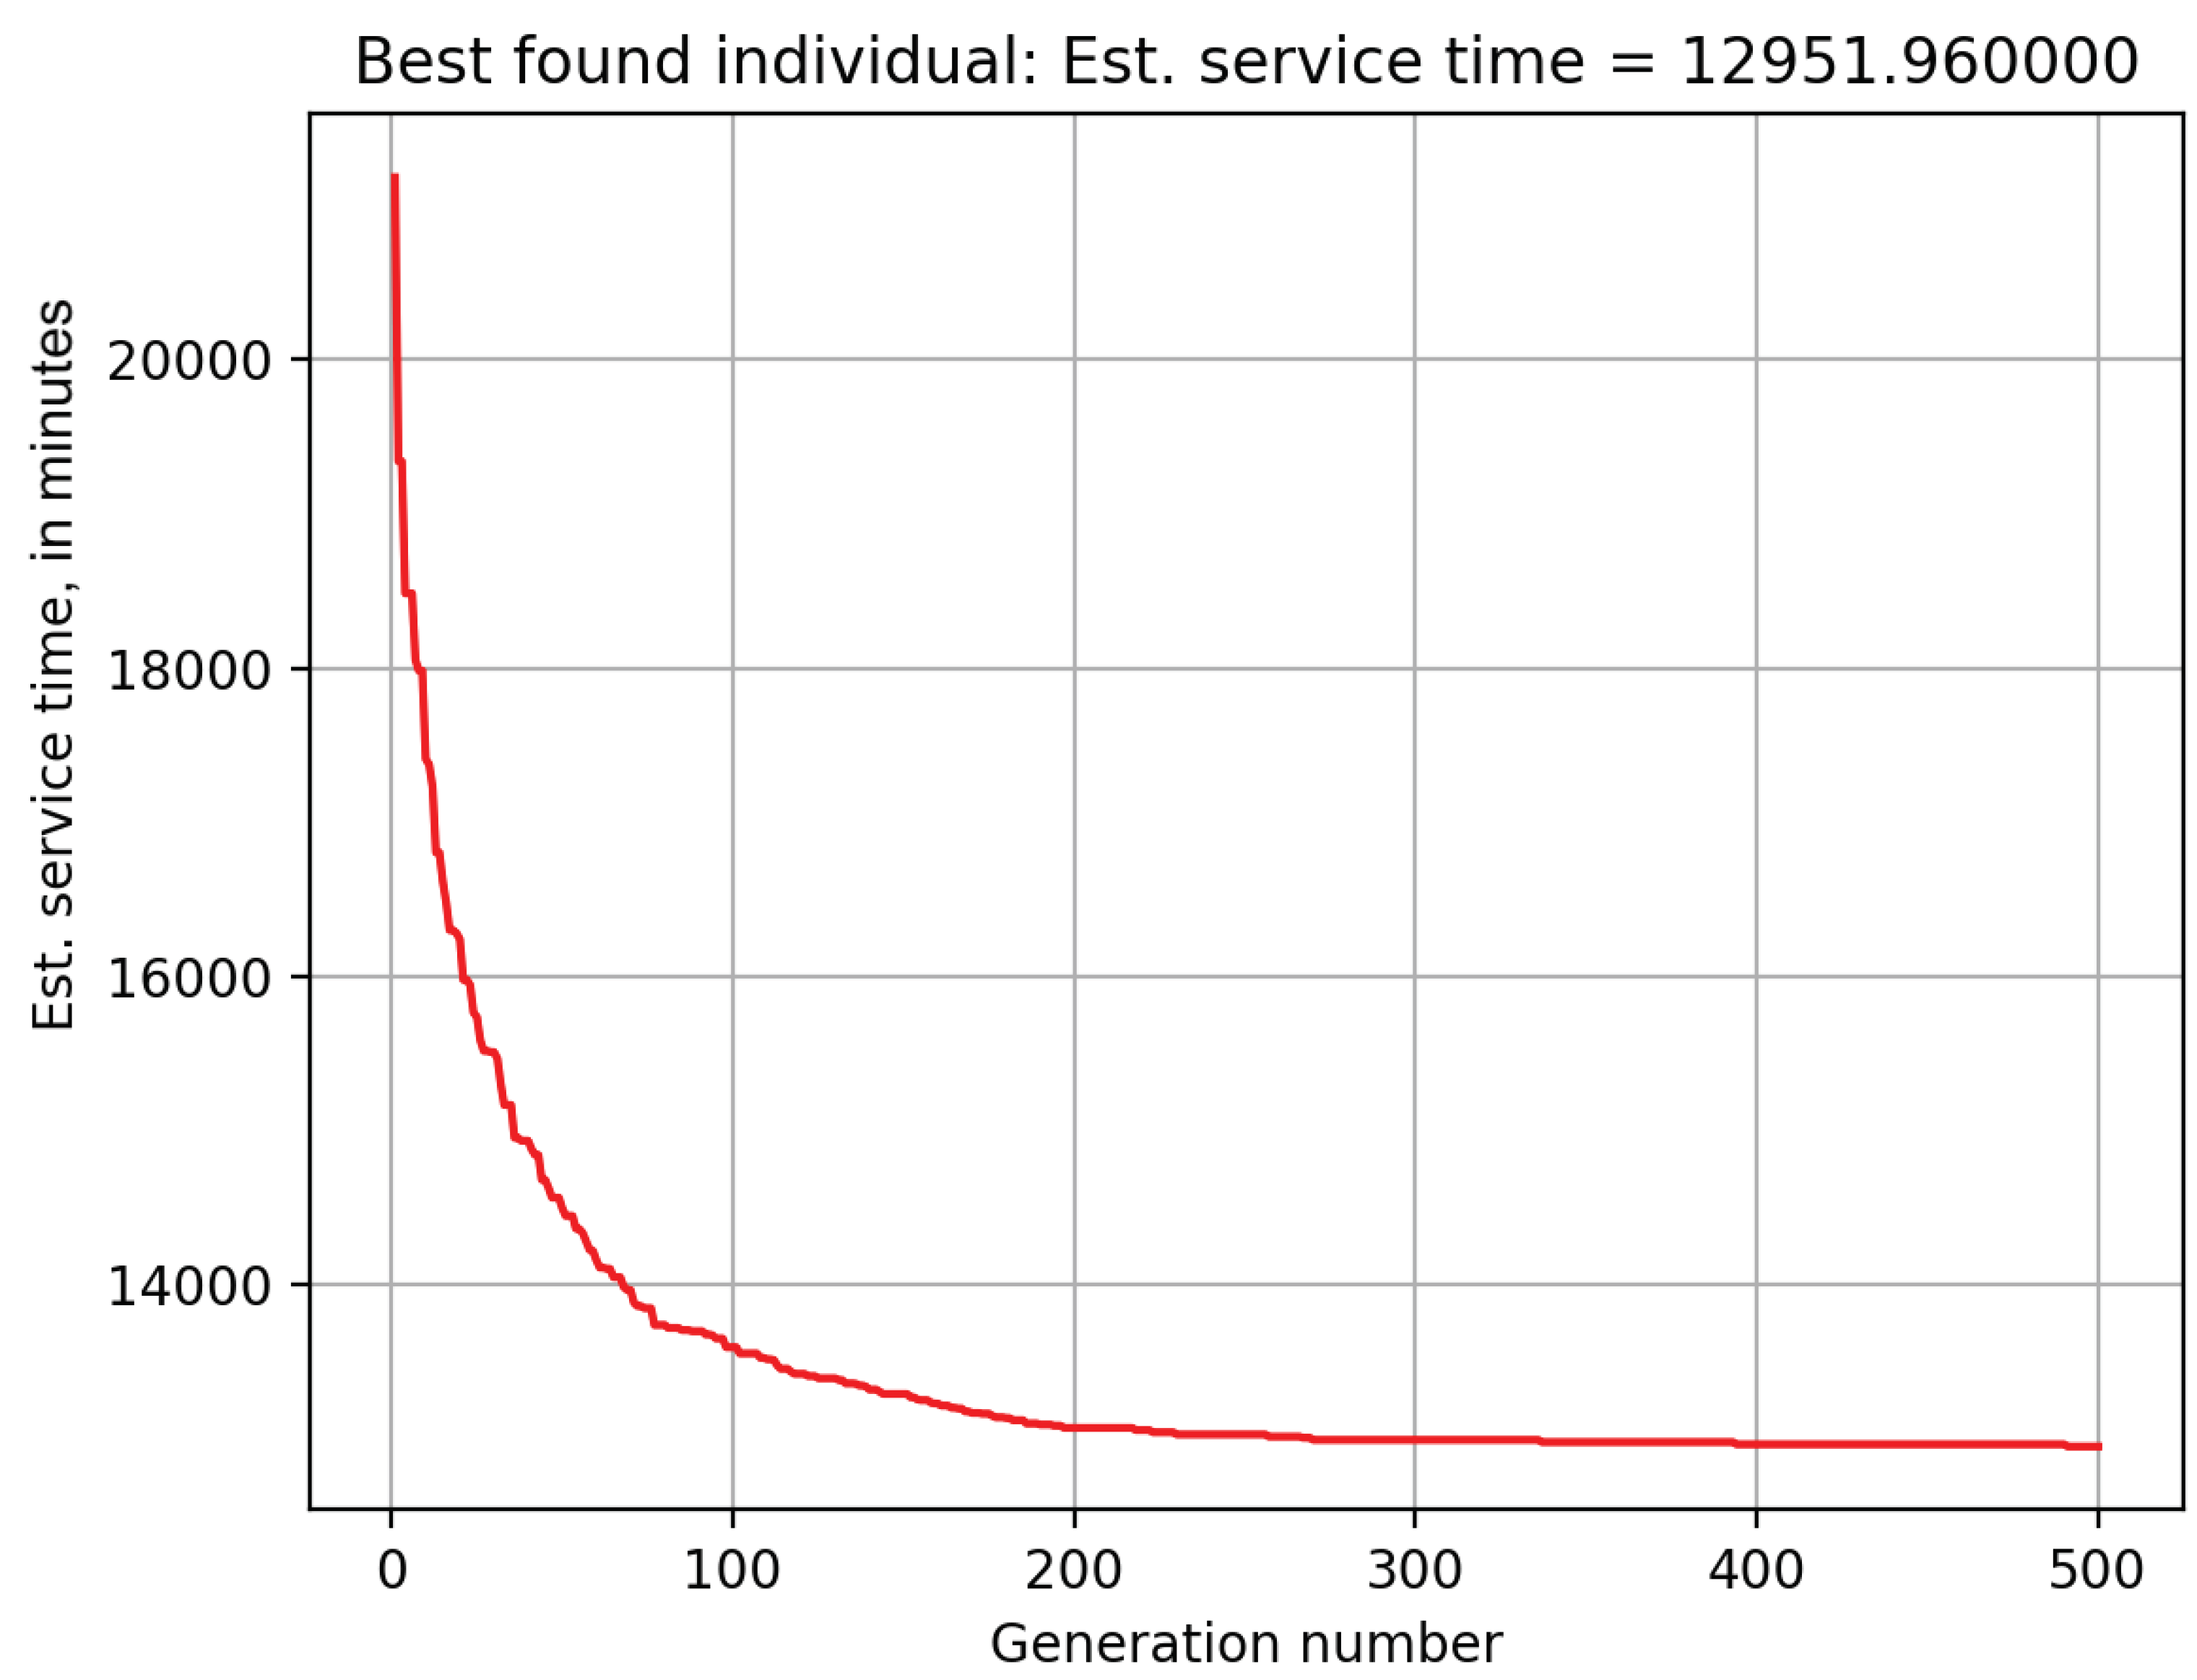
3.3. Optimization

The optimization problem that solves for the optimal J i for each office i in an Establishment to operate its Arafat-Muzdalifah shuttle service at the minimal service time (or evacuation time) is formulated as in (6).
The term ( i J i N ) in (6) is defined to ensure that buses distributed to the offices never exceed the total available buses at the Establishment N. For solving this problem, Genetic Algorithm (GA) [34,35] is utilized as in the numerical analysis in the next sections. The GA parameters in this analysis are set as follows: population size at 80, number of generations at 500, mutation rate at −1, number of genes at 20, cross-rate at 0.7, and tournament selection at 0.8.
min J i       S T = i C L i max 1 , C i + D T i + G J C i 1 s . t . C i P i J i B c , J C i = C i m o d C i J i if C i m o d C i > 0 J i otherwise , , i J i N , J i > 0 , J i min N , P i B c , C L i max P T i , D T i + G ,           i I , J i

4. Numerical Analysis

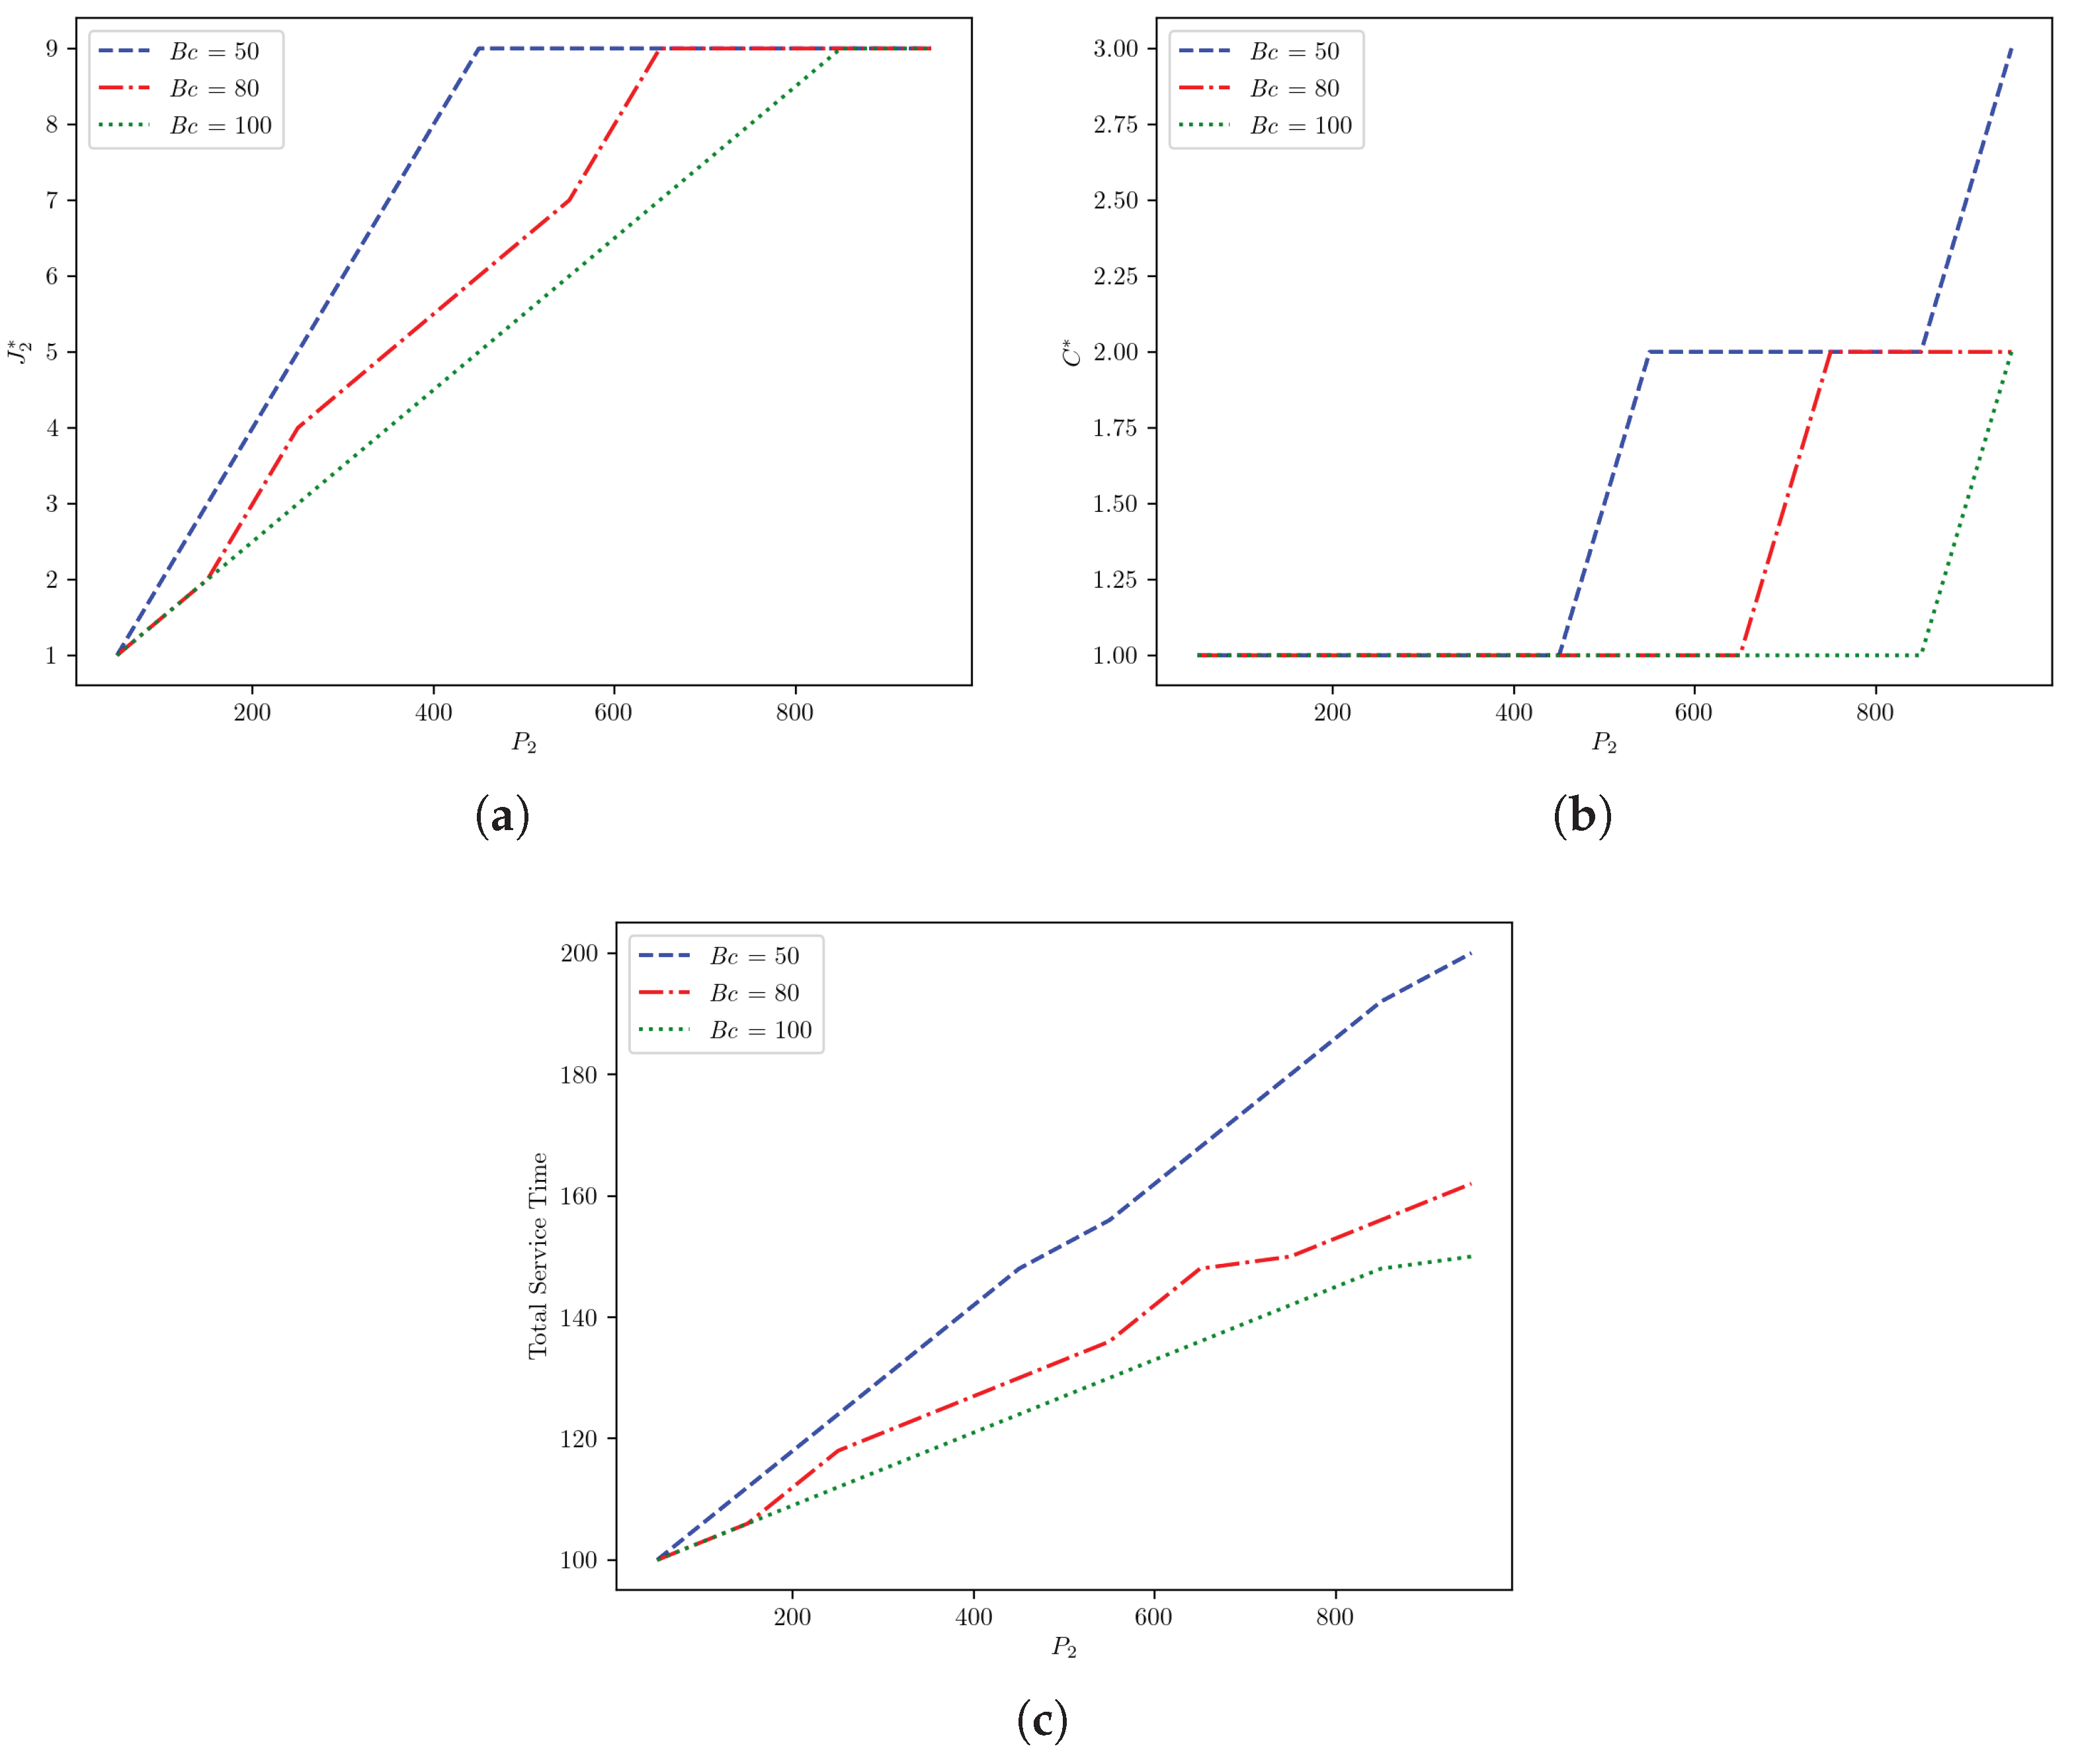
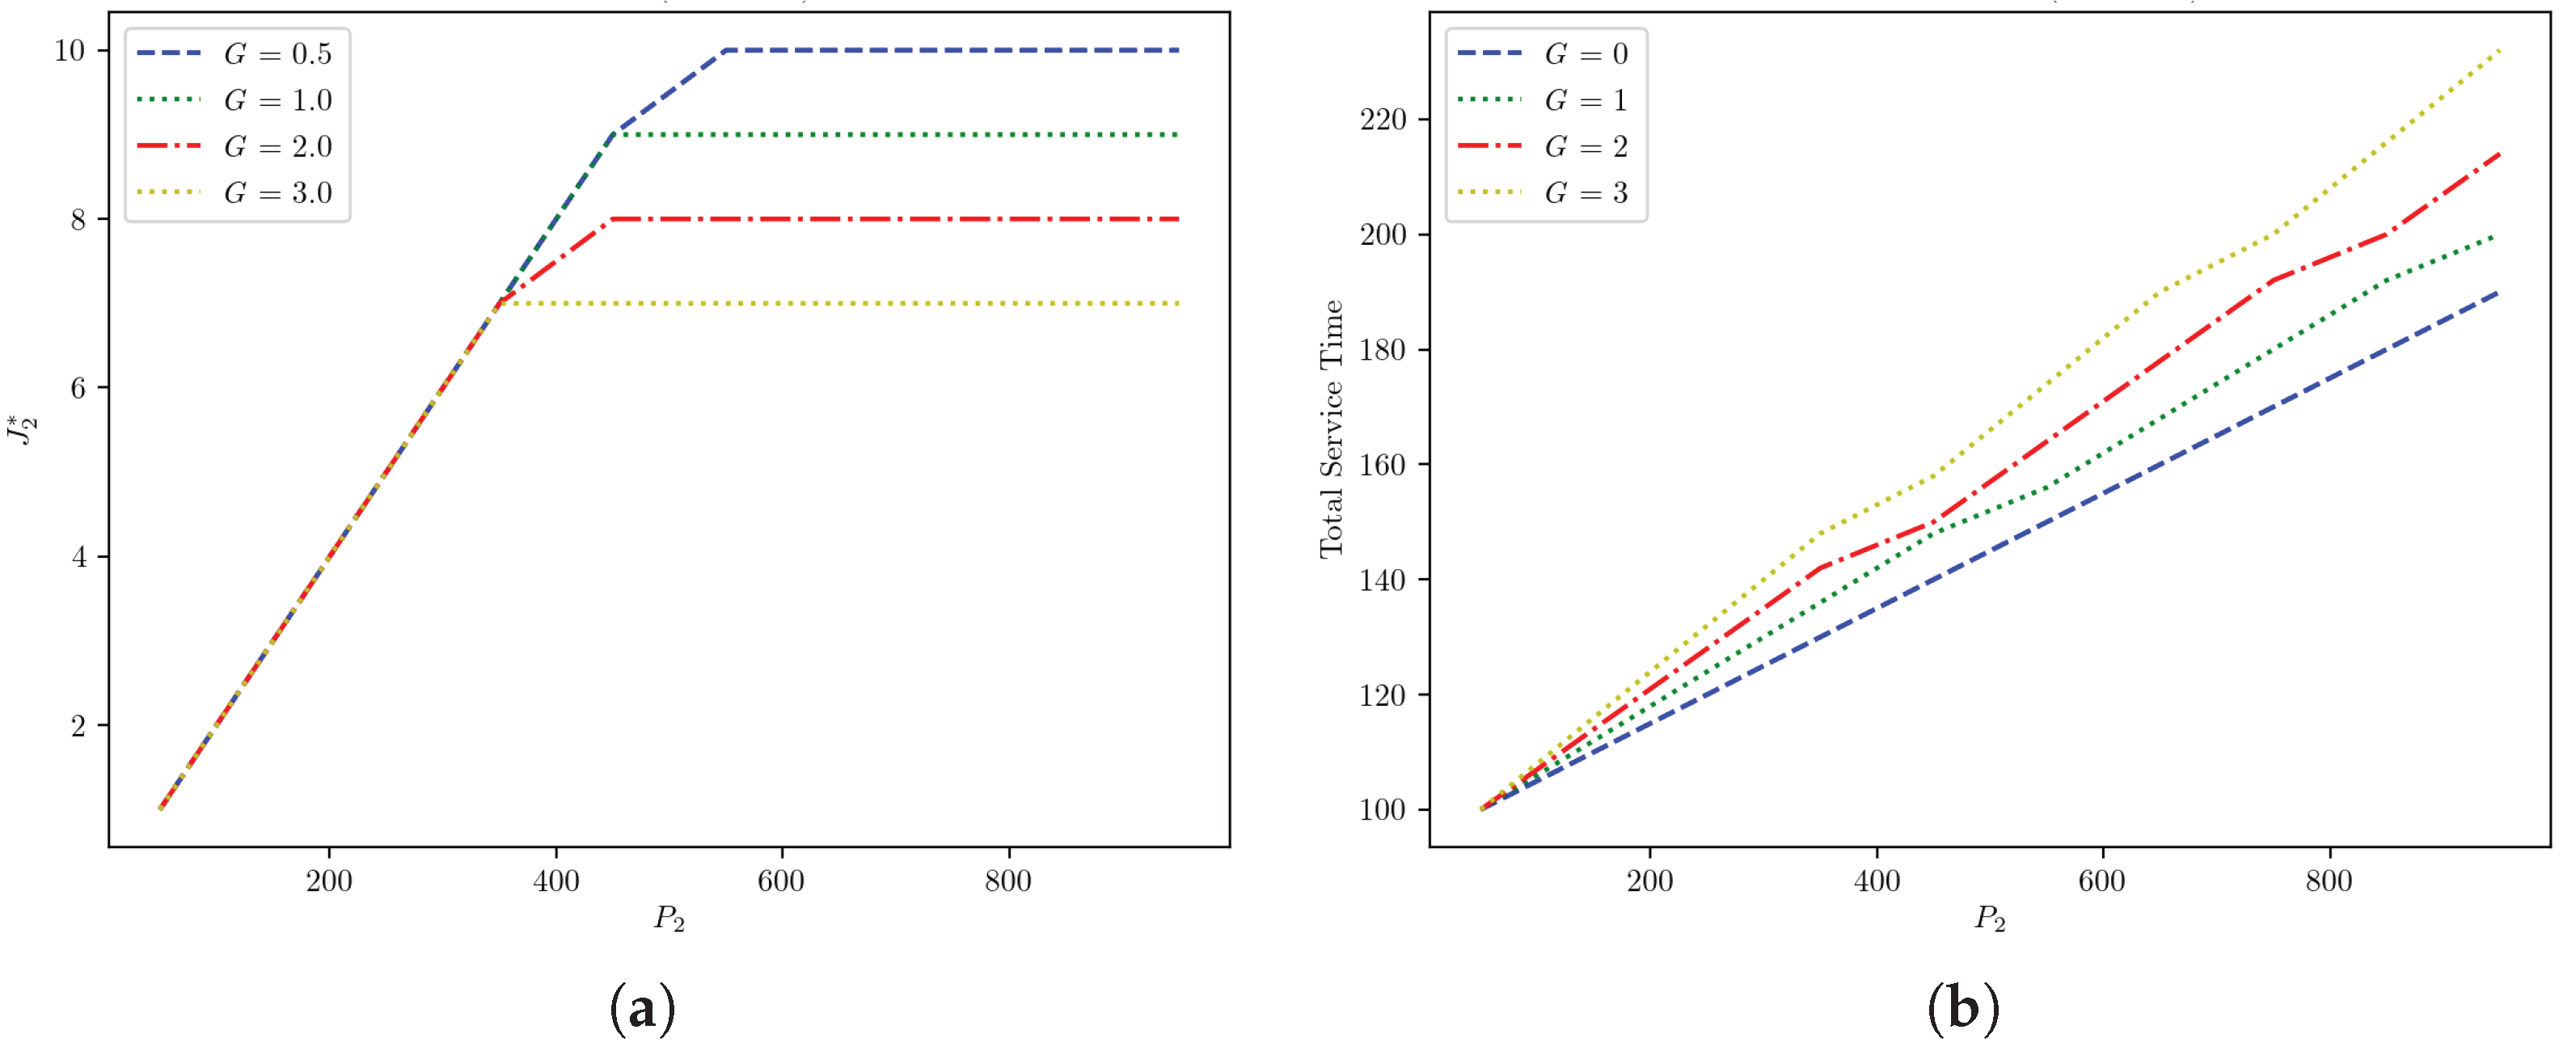
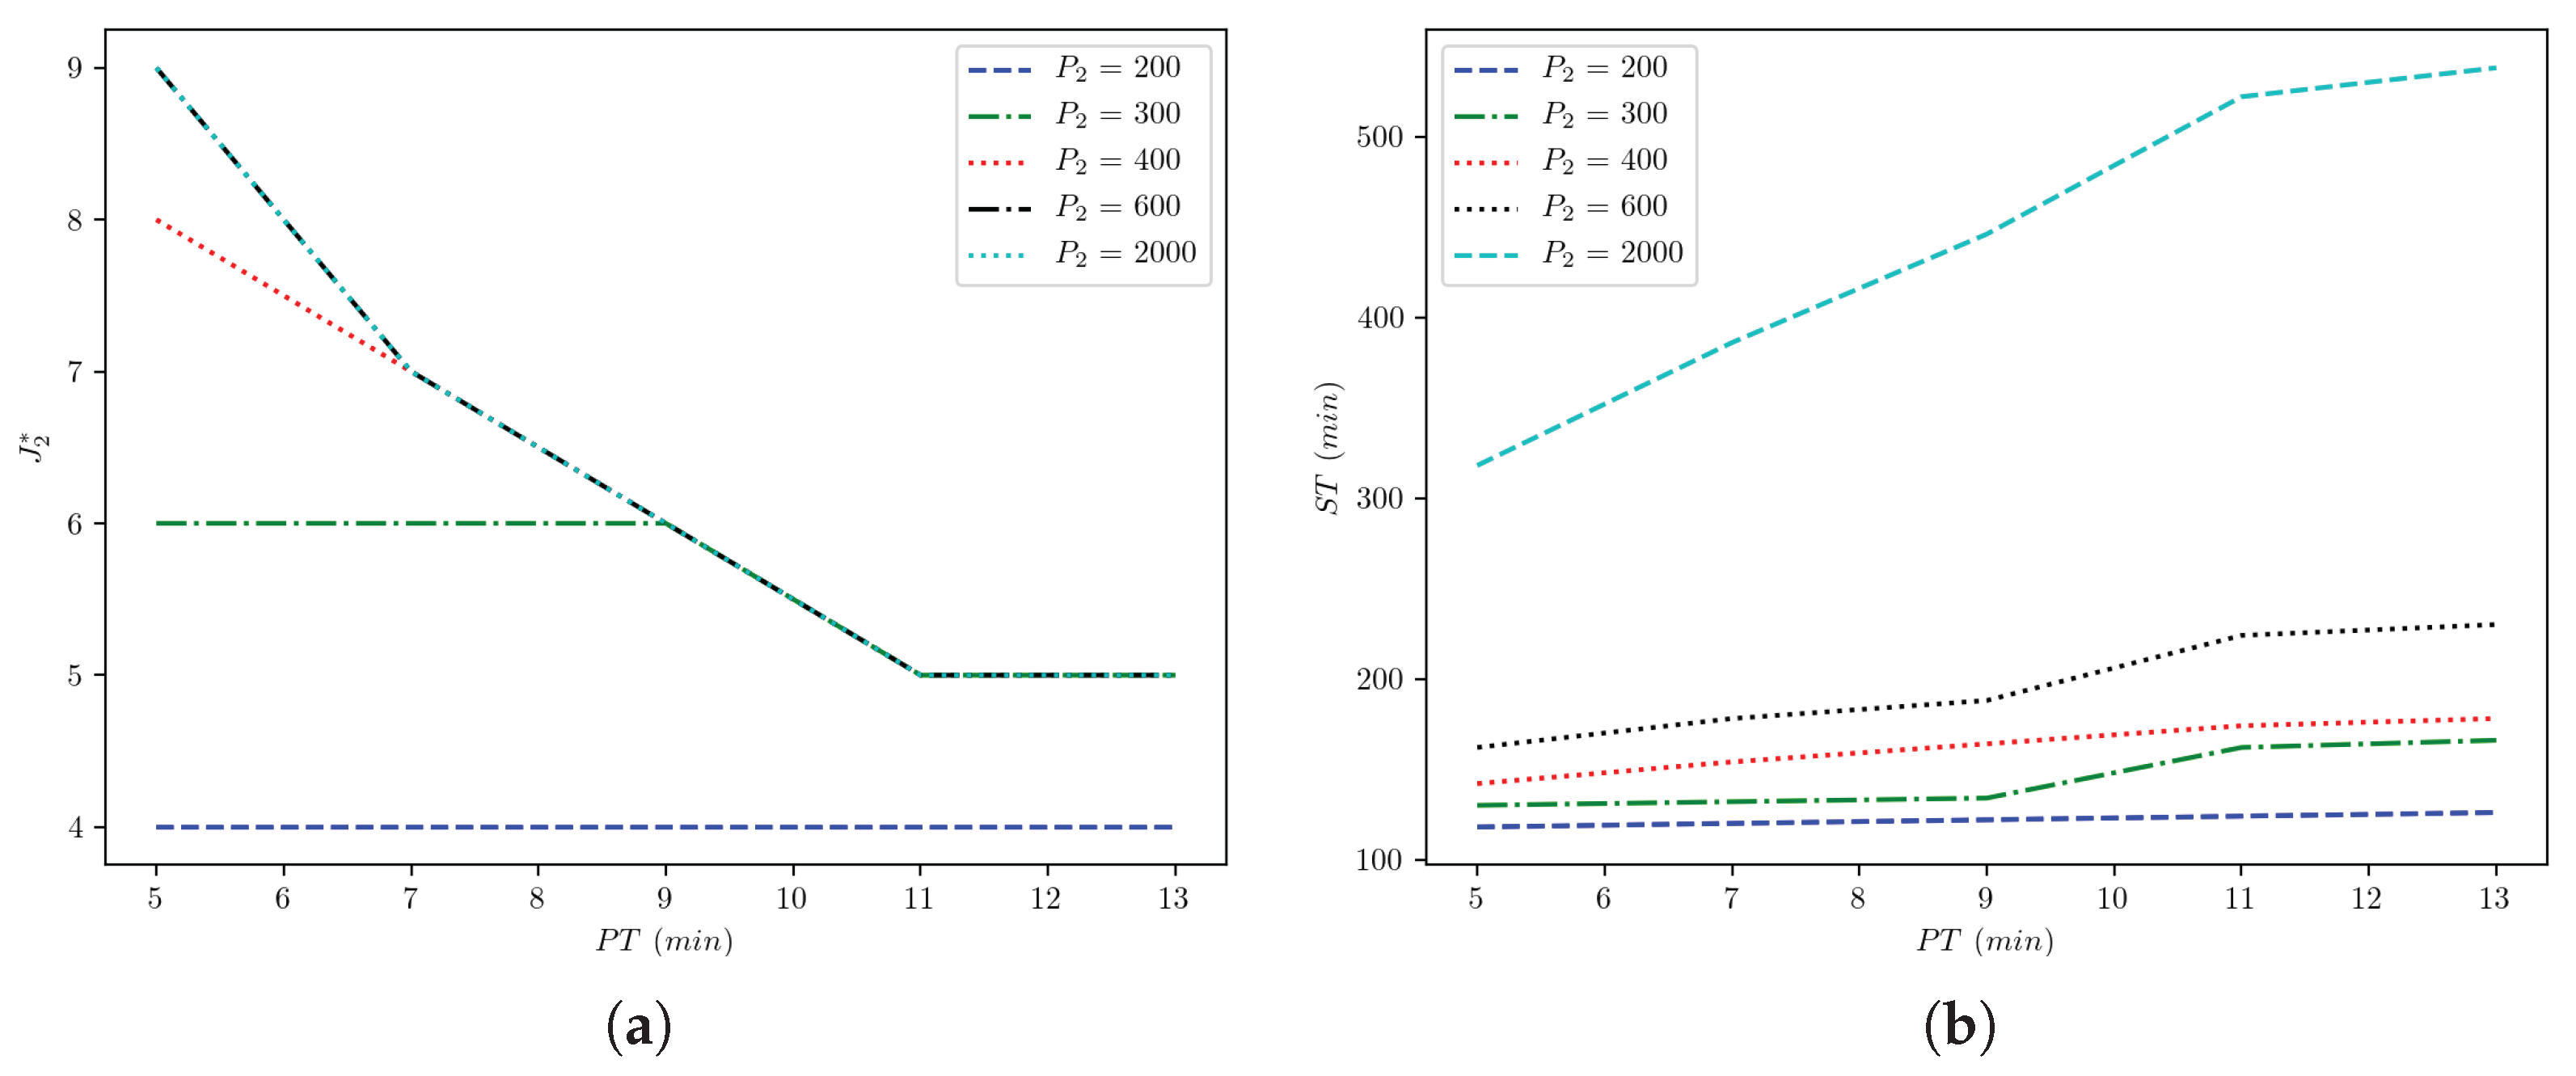
4.1. Sensitivity Analysis

We conducted a sensitivity analysis to gain insight into the model outcomes with the variation of the model parameters. Such analysis can help in future improvement planning of the service operation. In this analysis, we varied the values of the model parameters (e.g., P i , P T i , B c , etc.) and observed potential patterns in the model optimal outcomes (i.e., J i , C i and S T ). For example, one can consider large-size-seat buses to save the office service time as shown in Figure 4c or a small time gap G between buses to achieve large bus capacity in the office as in Figure 5a, or manage the pick-up time in the office to maintain high bus capacity and low service time as seen in Figure 6. Overall, we considered three sets of sensitivity analysis with i = 2 offices using Python as follows: (1) vary P 2 with a set of B c ; (2) vary P 2 with a set of G; and (3) vary P T 2 with a set of P 2 . In all sets of analysis, we set N to 50 buses, and T T 1 and T T 2 to 20 min and investigated the impact of various parameters on J 2 , C 2 and S T .
In the first sensitivity analysis, we investigated the impact of B c at different values of P 2 on the model outcomes. We set the office i = 1 parameters at P 1 = 50 pilgrims, P T 1 = D T 1 = 5 min, and the office i = 2 variables at P 1 = range 50 , 1000 , 100 pilgrims and B c = 50 , 80 , 100 seats. Both P T 2 and D T 2 are set to 5 min and G to 1 min Figure 4c shows that increase of P 2 in general increases the office S T . However, the rate of increase can be lowered if the value of B c (e.g., 80 or 100 seats) is increased. This will result in faster evacuation of pilgrims from Arafat to Muzdalifah. Results in Figure 4a,b show that increase of P 2 increases and office’s need for buses, until reaching its bus capacity at J 2 = 9 buses, at which point the buses run in cycles to accommodate the overcrowding of pilgrims in the office. Figure 4b also shows buses with high capacity (with B c = 100 and 80 seats) are able to carry more pilgrims in one cycle ( P 2 = 850 and 620 pilgrims, respectively) than those with B c = 50 seats ( P 2 = 450 pilgrims).
In the second analysis, we investigated the tendency of improvement of the model output by altering G at different levels of P 2 . In this analysis, we set the parameters of offices 1 and 2 similar to those in the previous analysis, but we fixed B c at 50 seats and varied G as 0.5, 1, 2, and 3 min. Results in Figure 5a show that the actual impact of G is noticed as an increase in the capacity of buses in the office when it is overcrowded with pilgrims, and its buses run more than one cycle. For example, setting G = 0.5 min instead of G = 1 min between two buses increases the capacity of buses at the office from J 2 = 9 to J 2 = 10 buses. In terms of the office S T , Figure 5b shows that lowering G from 1 to 0.5 min reduces S T from 200 to 190 min.
In the last analysis, we intended to observe possible improvement on ST and changes on J 2 through diversification of P T 2 at different levels of P T 2 . We set the parameters of the offices as 1 and 2, and the Establishment as P 1 = 50 pilgrims, P T 1 = D T 1 = 5 min, D T 2 = 5 min, B c = 50 seats, and G = 1 min. At the same time, we set the variables for the office 2 as P 2 = 200 , 300 , 400 , 600 , 2000 pilgrims and P T 2 = range ( 5 , 15 , 2 ) min. Figure 6a shows how a dwell time like 11 min can disable the effects of P 2 in improving the service, and further cuts down the capacity to J 2 = 5 buses. Thus, a lower value of P T 2 is encouraged (such as 7 min) to improve the office bus capacity, resulting in J 2 = 6 buses for P 2 = 300 pilgrims and J 2 = 7 for P 2 > 600 pilgrims. Figure 6b demonstrates how S T is sensitive to P T 2 at different degrees of P 2 . The figure shows that, at any P 2 , the increase of P T 2 increases S T in general, and the rate change of this increase depends on the size of P 2 . This can be seen when changing of P T 2 in Figure 6 from 5 to 13 min with P 2 = 600 and P 2 = 2000 pilgrims. With the prior pilgrim demand, the office ST increases 220 − 160 = 60 min only compare to 550 − 310 = 240 min with the later demand.
As a final note, these analyses help identify the tuning factors in the model that helps save the Establishment maximum service time and increase the service’s efficiency. They also make the process of transporting pilgrims between Arafat and Muzdalifah quicker and within the desired resource limits.

4.2. Case Study

In this study, we have developed a tool to help the ministry of Hajj and the Establishment’s parties plan the shuttle-bus service operation configuration. The proposed optimization model determines the optimal number of buses and cycles be assigned to each Establishment office running a shuttle service between Arafat and Muzdalifah to operate it in minimal service time. In other words—to complete its pilgrims’ movement as quickly as possible. The Arafat-Muzdalifah loop has been chosen because it represented the worst-case scenario of all shuttle service loops during Hajj; it serves a ritual with a short time-frame on the most critical day of Hajj. The service time of an office is the time it needs to transport all its pilgrims from Arafat to Muzdalifah. Our model estimates the service time from the bus dwell times at Arafat and Muzdalifah, their travel times, and the number of assigned cycles to the office. We seek to minimize the sum of the service times of all offices. The proposed model is designed to assign fast service offices with fewer buses and more cycles. It will also help compensate for the service time of slow offices with more buses to reduce the Establishments’ overall service time. We have formulated our model under the assumption that the capacity of the roadways between Arafat and Muzdalifah are capable of handling all buses dispatched by the Establishment. We will also conduct a sensitivity analysis on the proposed model parameters through a varying number of pilgrims in the office, the dwell time in Arafat, and the bus-seat capacity to identify potential factors for service improvement. We evaluated the optimization model in (60) with the real-world data of the African Non-Arab Countries Establishment shuttle bus service, optimized the service, and found the optimal number of buses and cycles needed at each office for maximum efficiency. To accomplish that, we described the GPS trace data of 20,000+ buses collected in Hajj 2018 inside the Makkah city of Saudi Arabia by the car syndicate authority, Ministry of Hajj and Umrah, Saudi Arabia, issues in the data, the management process conducted to convert data into big data platform, the knowledge extracted about African Non-Arab Countries Establishment shuttle bus service (e.g., P i , P T i , D T i , T T 1 , T T 2 , B c , and G) and the optimized service setup.

4.2.1. Data Collection

The data obtained from the car syndicate authority was the GPS trace data of more than 20,000 buses run during Hajj 2018 [1]. The data contains 737+ million rows of buses historical locations collected from the GPS embedded devices in buses every 1, 2, 5, or 10 min up to 25 min for a period of 60 days. Attributes such as record identifier, bus identifier, bus company identifier, angle, latitude, longitude, GSM signal, GPS signal, ignition status, movement, speed, supply cut off status, and record time were included in each record, as shown in Table 1. At the same time, relational tables such as companies, Establishments, offices, zones, garage, movement stages, bus request, bus assignment, stage, etc., were also provided. As the data was in MS SQL format, basic queries on a single location history table took more than 0.15–0.12 h to respond on a high-end workstation. To reduce query time and enhance data management efficiency, we migrated the data from the MS SQL platform to Big Data using Cassandra clusters, as shown in Figure 7 and explained in Data Management. Moreover, we enriched the data—as described in Data Enrichment—using an interpolation technique to fill the intermediate missing location points along a bus route. After this, the data was analyzed to identify the routes assigned to the Establishment, dwell times, locations of offices, and the number of pilgrims.

4.2.2. Data Management

The data migration platform is classified into data lake layer, big data layer, REDIS cache, REST API and App Servers. The data lake layer contains the actual data that we received from the car syndicate authority, Ministry of Hajj and Umrah, Saudi Arabia. The original data that we received from the authority is in Microsoft SQL Server. The master data service contains all the relations of the table that we need to illustrate based on conditions such as company 1 and 2, or bus identifier. Big data layers use the Cassandra cluster to store location history data employing the Extract Transform and Load (ETL) engine to increase the efficiency, whereas data aggregation service is a combination of Hadoop and Presto for batch-based analytics. REDIS is used as a cache to store keys and value pairs to provide high performance. REST API contains the number of APIs to handle the request of the Application server and returns the response to be visualized in the front-end of the app server.

4.2.3. Data Enrichment

Figure 8 shows the data of a bus between two location feeds. If we visualize the data by drawing the line between two points, then that line is straight and not aligned with the roads. The black-coloured line shows the Euclidean distance between two points, whereas the blue line shows the actual path—or the Manhattan distance—that the bus took. To overcome this issue, we performed interpolation, or enrichment, on the data. Figure 9 shows the sample image of the bus data interpolation trajectory after removing noisy data and adding an intermediate location point between two continuous GPS points.

4.2.4. Knowledge Extraction

To evaluate the model in (6) with the African Non Arab Countries Establishment, we first need to extract the model inputs (i.e., P T i , D T i , T T 1 , and T T 2 ) from the migrated-and-enriched data, for each office. Due to the absence of determinants of the state of the bus on its journey between Arafat and Muzdalifah in the Naqaba data—which represented the model inputs —we encountered some difficulty in defining an automatic approach for extracting the spatiotemporal data of buses based on their states. Therefore, we collected these data manually from 41 randomly selected buses—one from each office. Our low sampling is because extracting the bus states by tracking it every 0.5 min on a map requires significant time and effort; often, multiple hours per bus. However, the issue with such a sample is that it cannot statistically represent the average of bus state per office. As a workaround, we decided to deem a single average for all offices in each bus-journey-state, as can be seen in each column in Table 2. The distributions of T T 1 , T T 2 , P T i , and D T i from the manually extracted data for all offices are shown respectively in Figure 10a–d and their average values, used in the model evaluation, in Table 2. The Establishment shuttle bus service identified path is shown in Figure 9.

4.2.5. Model Evaluation

The required model inputs (i.e., P i , P T i , D T i , T T 1 , T T 2 , B c , and G) for the evaluation of the African Non Arab Countries Establishment shuttle bus service were set as in Table 2. B c was set to 50 seats and G to 30 s to maintain a service time that is as close as possible to 7.5 h, reported by the Naqaba in Hajj 2018. The GA, with the setting given in Section 3.3, was used to solve the problem of transporting a total of 139,145 pilgrims from i = 41 offices in Arafat to Muzdalifah with the J i and C i needed at the offices that minimize the Establishment overall service time. The convergence of the evaluated model service time to the minimum time is shown in Figure 11. The last two columns in Table 2 show the J i and C i for the first three offices in the Establishment. The minimal service time, or the quickest possible evacuation time, at the Establishment can be achieved in 7 h and 9 min. This value can be reduced if the extracted dwell times, P T i and D T i , are managed by the office operators. A reduction of P T i to 7 min, for example, can expedite the service time at the Establishment, bringing it to 6.2 h.
Results from this analysis reveal that a fleet of N = 615 buses in total (instead of the 700 buses that were actually operated in Hajj 2018) can run the African Non-Arab Countries Establishment shuttle bus service. Although J i at all offices are fixed to 15 buses, they run at various cycles according to each office’s pilgrims’ need.

5. Conclusions

This study proposed a static planning system for the shuttle bus service during Hajj. The system was designed to optimize the shuttle service between Arafat and Muzdalifah at one Establishment and determine the optimal number of buses and cycles needed at each office to run the service in minimal time possible. Main components in the assessment of each office’s service time were included in the proposed model. These included the number of pilgrims at the office, bus dwell times at Arafat and Muzdalifah, and the travel times on the links between them. Additionally, this study conducted the manifold analysis as follows: (1) sensitivity analysis to find out that maximum service time enhancement can be achieved by reducing dwell times at Arafat and Muzdalifah gates. (2) an evaluation of the Africa Non-Arab Countries Establishment shuttle bus service with the proposed model. The prior analysis included— descriptions of the migration and enrichment processes performed on GPS data of more than 20,000 buses obtained from the Car Syndicate Authority and the manual extraction process of the knowledge needed in the model and the service optimization. Finally, this study can be expanded in various ways. First, it can be enhanced by estimating each office’s dwell and travel times means, instead of one mean representative of all offices, by increasing the sampling rate of buses. Second, by designing a dynamic system for allocation of buses to offices which will account for the variation of the model inputs throughout the time of the service. The proposed study can also be applied in different crowded events, including Olympics, Kumbh Mela or sports events, to evacuate the pilgrims from the place of the event to another location such as bus station, train station or parking area using bus shuttles quickly and efficiently.

Author Contributions

Conceptualization, E.F. and F.U.R.; methodology, E.F.; software, F.U.R.; validation, O.H., E.F. and F.U.R.; formal analysis, O.H.; investigation, O.H.; resources, E.F.; data curation, F.U.R.; writing—original draft preparation, O.H.; writing—review and editing, O.H.; visualization, O.H.; supervision, F.U.R.; project administration, E.F.; funding acquisition, E.F. All authors have read and agreed to the published version of the manuscript.

Funding

The authors would like to thank Deanship of Scientific Research and Prince Khalid Al-Faisal Chair for Developing Makkah Al-Mukarramah and the Holy Places at Umm Al-Qura University (project # DSRUQU.PKC-43-1) for the financial support.

Institutional Review Board Statement

Not applicable.

Informed Consent Statement

Not applicable.

Data Availability Statement

The dataset used in this research are provided by General Syndicate of Cars https://www.haj.gov.sa/en/InternalPages/Details/92 (accessed on 25 June 2021).

Acknowledgments

The authors would like to thank Deanship of Scientific Research and Prince Khalid Al-Faisal Chair for Developing Makkah Al-Mukarramah and the Holy Places at Umm Al-Qura University (project # DSRUQU.PKC-43-1) for the financial support. We would also like to thank Eng. Osama Fatheldin from The General car Syndicate (Naqaba) for providing us with the buses data.

Conflicts of Interest

The authors have no conflict of interest.

References

  1. Felemban, E.; Rehman, F.U.; Biabani, A.A.; Naseer, A.; Hussain, O.; Warriach, E.U. An Interactive System for Analyzing Movement of Buses in Hajj. J. Theor. Appl. Inf. Technol. 2020, 98, 3468–3481. [Google Scholar]
  2. Felemban, E.; Rehman, F.U.; Biabani, A.A.; Naseer, A.; AlAbdulwahab, U. Towards Building an Interactive Platform for Analyzing Movement of Buses in Hajj. In Proceedings of the IEEE International Conference on Big Data (Big Data), Los Angeles, CA, USA, 9–12 December 2019; pp. 3775–3778. [Google Scholar] [CrossRef]
  3. Kumar, G.K.; Aishwarya, C.; Mounika, A.S. College Bus Tracking Android Application using GPS. Int. J. New Innov. Eng. Technol. 2016, 4, 40–44. [Google Scholar]
  4. Bie, Y.; Gong, X.; Liu, Z. Time of day intervals partition for bus schedule using GPS data. Transp. Res. Part C Emerg. Technol. 2015, 60, 443–456. [Google Scholar] [CrossRef]
  5. Fan, W.; Gurmu, Z. Dynamic Travel Time Prediction Models for Buses Using Only GPS Data. Int. J. Transp. Sci. Technol. 2015, 4, 353–366. [Google Scholar] [CrossRef]
  6. Chang, H.; Park, D.; Lee, S.; Lee, H.; Baek, S. Dynamic multi-interval bus travel time prediction using bus transit data. Transportmetrica 2010, 6, 19–38. [Google Scholar] [CrossRef]
  7. Zhang, M.; Xiao, F.; Chen, D. Bus Arrival Time Prediction Based on GPS Data. In Proceedings of the 4th International Conference on Transportation Engineering, ICTE 2013, Chengdu, China, 19–20 October 2013; pp. 1470–1475. [Google Scholar] [CrossRef]
  8. Bie, Y.; Wang, D.; Qi, H. Prediction model of bus arrival time at signalized intersection using GPS data. J. Transp. Eng. 2012, 138, 12–20. [Google Scholar] [CrossRef]
  9. Stoll, N.B.; Glick, T.; Figliozzi, M.A. Using high-resolution bus GPS data to visualize and identify congestion hot spots in urban arterials. Transp. Res. Rec. 2016, 2539, 20–29. [Google Scholar] [CrossRef] [Green Version]
  10. Zeng, W.; Miwa, T.; Morikawa, T. Exploring trip fuel consumption by machine learning from GPS and CAN bus data. J. East. Asia Soc. Transp. Stud. 2015, 11, 906–921. [Google Scholar]
  11. Weng, J.; Wang, C.; Huang, H.; Wang, Y.; Zhang, L. Real-time bus travel speed estimation model based on bus GPS data. Adv. Mech. Eng. 2016, 8, 1687814016678162. [Google Scholar] [CrossRef] [Green Version]
  12. Stoll, N.B. Potential of Using High Resolution Bus GPS Data to Assess Traffic Speeds. 26; Civil and Environmental Engineering Master’s Project Reports; 2016; Available online: https://pdxscholar.library.pdx.edu/cengin_gradprojects/26/ (accessed on 22 November 2021).
  13. Chen, C.; Zhang, D.; Zhou, Z.H.; Li, N.; Atmaca, T.; Li, S. B-planner: Night bus route planning using large-scale taxi GPS traces. In Proceedings of the IEEE International Conference on Pervasive Computing and Communications, PerCom 2013, San Diego, CA, USA, 18–22 March 2013; pp. 225–233. [Google Scholar] [CrossRef] [Green Version]
  14. Lei, S.; Li, Z.; Wu, B.; Wang, H. Research on multi-objective bus route planning model based on taxi GPS data. In Proceedings of the International Conference on Cyber-Enabled Distributed Computing and Knowledge Discovery (CyberC), Chengdu, China, 13–15 October 2016; pp. 249–255. [Google Scholar]
  15. Zhou, P.; Zheng, Y.; Li, M. How long to wait? Predicting bus arrival time with mobile phone based participatory sensing. In Proceedings of the 10th International Conference on Mobile Systems, Applications, and Services, Ambleside, UK, 25–29 June 2012; pp. 379–392. [Google Scholar]
  16. Noor, R.M.; Rasyidi, N.B.G.; Nandy, T.; Kolandaisamy, R. Campus Shuttle Bus Route Optimization Using Machine Learning Predictive Analysis: A Case Study. Sustainability 2021, 13, 225. [Google Scholar] [CrossRef]
  17. Ali, S.; Qureshi, A.; Gupta, R.K. Genetic Algorithm based Optimization of Travel Time from Source to Destination. In Proceedings of the 7th International Conference on Reliability, Infocom Technologies and Optimization (Trends and Future Directions) (ICRITO), Noida, India, 29–31 August 2018; pp. 893–901. [Google Scholar] [CrossRef]
  18. Pholprasit, T.; Pongnumkul, S.; Saiprasert, C.; Mangkorn-ngam, S.; Jaritsup, L. LiveBusTrack: High-frequency location update information system for shuttle/bus riders. In Proceedings of the 13th International Symposium on Communications and Information Technologies (ISCIT), Surat Thani, Thailand, 4–6 September 2013; pp. 565–569. [Google Scholar]
  19. Juhari, M.N.Z.; Mansor, H. IIUM Bus On Campus Monitoring System. In Proceedings of the International Conference on Computer and Communication Engineering (ICCCE), Kuala Lumpur, Malaysia, 26–27 July 2016; pp. 138–143. [Google Scholar]
  20. Chit, S.M.; Chaw, L.Y.; Thong, C.L.; Lee, C.Y. A pilot study: Shuttle bus tracker app for campus users. In Proceedings of the International Conference on Research and Innovation in Information Systems (ICRIIS), Langkawi, Malaysia, 16–17 July 2017; pp. 1–6. [Google Scholar]
  21. Kong, X.; Li, M.; Tang, T.; Tian, K.; Moreira-Matias, L.; Xia, F. Shared subway shuttle bus route planning based on transport data analytics. IEEE Trans. Autom. Sci. Eng. 2018, 15, 1507–1520. [Google Scholar] [CrossRef]
  22. Liu, Y.; Jia, G.; Tao, X.; Xu, X.; Dou, W. A stop planning method over big traffic data for airport shuttle bus. In Proceedings of the IEEE Fourth International Conference on Big Data and Cloud Computing, Sydney, Australia, 3–5 December 2014; pp. 63–70. [Google Scholar]
  23. Low, B.Y.; Dahlan, S.H.; Abd Wahab, M.H. Real-time bus location and arrival information system. In Proceedings of the IEEE Conference on Wireless Sensors (ICWiSE), Langkawi, Malaysia, 10–12 October 2016; pp. 50–53. [Google Scholar]
  24. Martinez, M.V.; Simari, G.I.; Castillo, C.D.; Peer, N.J. A GPS-Based On-Demand Shuttle Bus System; Technical Report; Department of Computer Science, University of Maryland: College Park, MD, USA, 2006. [Google Scholar]
  25. Abas, M.A.; Ardani, I.; Mohamad, M.; Ling, C.H.; Latif, S.; Mohamad, S.; Halim, M. The efficiency of electric bus shuttle services in UTM campus: A pilot study. AIP Conf. Proc. 2019, 2059, 020028. [Google Scholar] [CrossRef]
  26. Balsa-Barreiro, J.; Ambuühl, L.; Menéndez, M.; Pentland, A. Mapping Time-Varying Accessibility and Territorial Cohesion with Time-Distorted Maps. IEEE Access 2019, 7, 41702–41714. [Google Scholar] [CrossRef]
  27. Iclodean, C.; Cordos, N.; Varga, B.O. Autonomous Shuttle Bus for Public Transportation: A Review. Energies 2020, 13, 2917. [Google Scholar] [CrossRef]
  28. Abdessemed, F. An integrated system for tracking and control pilgrims shuttle buses. In Proceedings of the 14th International IEEE Conference on Intelligent Transportation Systems (ITSC), Washington, DC, USA, 5–7 October 2011; pp. 384–389. [Google Scholar]
  29. Seliaman, M.E. A Simulation Model for the Shuttle Bus Traffic during Nafrah Period. Ph.D. Thesis, King Fahd University of Petroleum and Minerals, Dhahran, Saudi Arabia, 2001. [Google Scholar]
  30. Andijani, A.; Duffuaa, S.; Seliaman, M. The Use of Shuttle Buses in Hajj to Transport Pilgrims: A Simulation Study. In Proceedings of the Seventh ISSAT International Conference on Reliability and Quality in Design, Las Vegas, NV, USA, 1–3 August 2001. [Google Scholar]
  31. Seliaman, M.; Duffuaa, S.; Andijani, A. AStochastic Simulation Model for the Design of a Shuttle Bus System to Transport Pilgrims in Hajj; Researchgate: Berlin, Germany, 2013. [Google Scholar]
  32. Al-Sabban, S.A.; Ramadan, H.M. A Simulation study of the shuttle-bus pilgrim transportation system between the Holy sites for the 1422H Hajj Season. Eng. Sci. 2005, 16, 22. [Google Scholar] [CrossRef] [Green Version]
  33. Ramadan, H.M.; Al-Sabban, S.A. Performance Analysis of the New Shuttle-bus Pilgrim Transportation System for the Pilgrims of South East Asia in the 1424 Hajj Season Using Computer Simulation Models. J. King Saud Univ. Eng. Sci. 2007, 19, 1427. [Google Scholar]
  34. Montero Villar, G.; Lindblad, D.; Andersson, N. Multi-Objective Optimization of an Counter Rotating Open Rotor using Evolutionary Algorithms. In Proceedings of the Multidisciplinary Analysis and Optimization Conference, Volterra, Italy, 13–16 September 2018. [Google Scholar]
  35. Montero Villar, G.; Lindblad, D.; Andersson, N. Effect of Airfoil Parametrization on the Optimization of Counter Rotating Open Rotors. In Proceedings of the AIAA Scitech 2019 Forum, San Diego, CA, USA, 7–11 January 2019. [Google Scholar]
Figure 1. Map-based distribution of Establishments in Mashaer area (Mina, Muzdalifah and Arafat), their assigned routes.
Information 12 00496 g001
Figure 2. Time-space diagram of one office shuttle service.
Information 12 00496 g002
Figure 3. Arafat-Muzdalifah shuttle bus service configuration.
Information 12 00496 g003
Figure 4. Impacts of change of P 2 with B c on J 2 , S T , and C 2 .
Information 12 00496 g004
Figure 5. Impacts of change of P 2 with G on J 2 and S T .
Information 12 00496 g005
Figure 6. Impacts of change of P T 2 with P 2 on J 2 and S T .
Information 12 00496 g006
Figure 7. High-Level architecture of data migration.
Information 12 00496 g007
Figure 8. Data before interpolation (Image from Google Maps).
Information 12 00496 g008
Figure 9. After Interpolation shuttle bus service path (blue color) between Arafat and Muzdalufah.
Information 12 00496 g009
Figure 10. Histograms of buses’ dwell and travel times. (a) T T 1 . (b) T T 2 . (c) P T . (d) D T .
Information 12 00496 g010
Figure 11. Convergence of the service time.
Information 12 00496 g011
Table 1. Sample data format.
IDBus IDComp IDAngleLatLong
409717755144621610282021.353039.9903
4097177561462161028021.368839.9583
40971775916462161030024.462439.6169
GSMGPSIgnitionMovementSpeedRecord-Time
32ON15020/08/2018 19:36:44
32ON0020/08/2018 19:36:44
32OFF0020/08/2018 19:36:44
Table 2. African Non Arab Countries Establishment shuttle bus service model input parameters and optimized outcomes (Times are in minutes).
Office ID P i TT 1 TT 2 PT i DT i G J i * C i *
1322431.925.95.52.90.5154.3
2301631.925.95.52.90.5154
3281731.925.95.52.90.5153.7
Publisher’s Note: MDPI stays neutral with regard to jurisdictional claims in published maps and institutional affiliations.

