
Effect of Personality Traits on Banner Advertisement Recognition


Abstract
:1. Introduction
2. Literature Review
2.1. Advertisement Recall
2.2. Personality Traits
3. Materials and Methods
3.1. Participants and Procedures
3.2. Experiment Protocol, Metrics, and Instruments
- Welcome to our online store.
- Your mission is to an order that will contain at least two items from each product category of the store place in your cart.
- In case you find online discount coupons, use them before placing your order.
- The process is completed upon order submission.
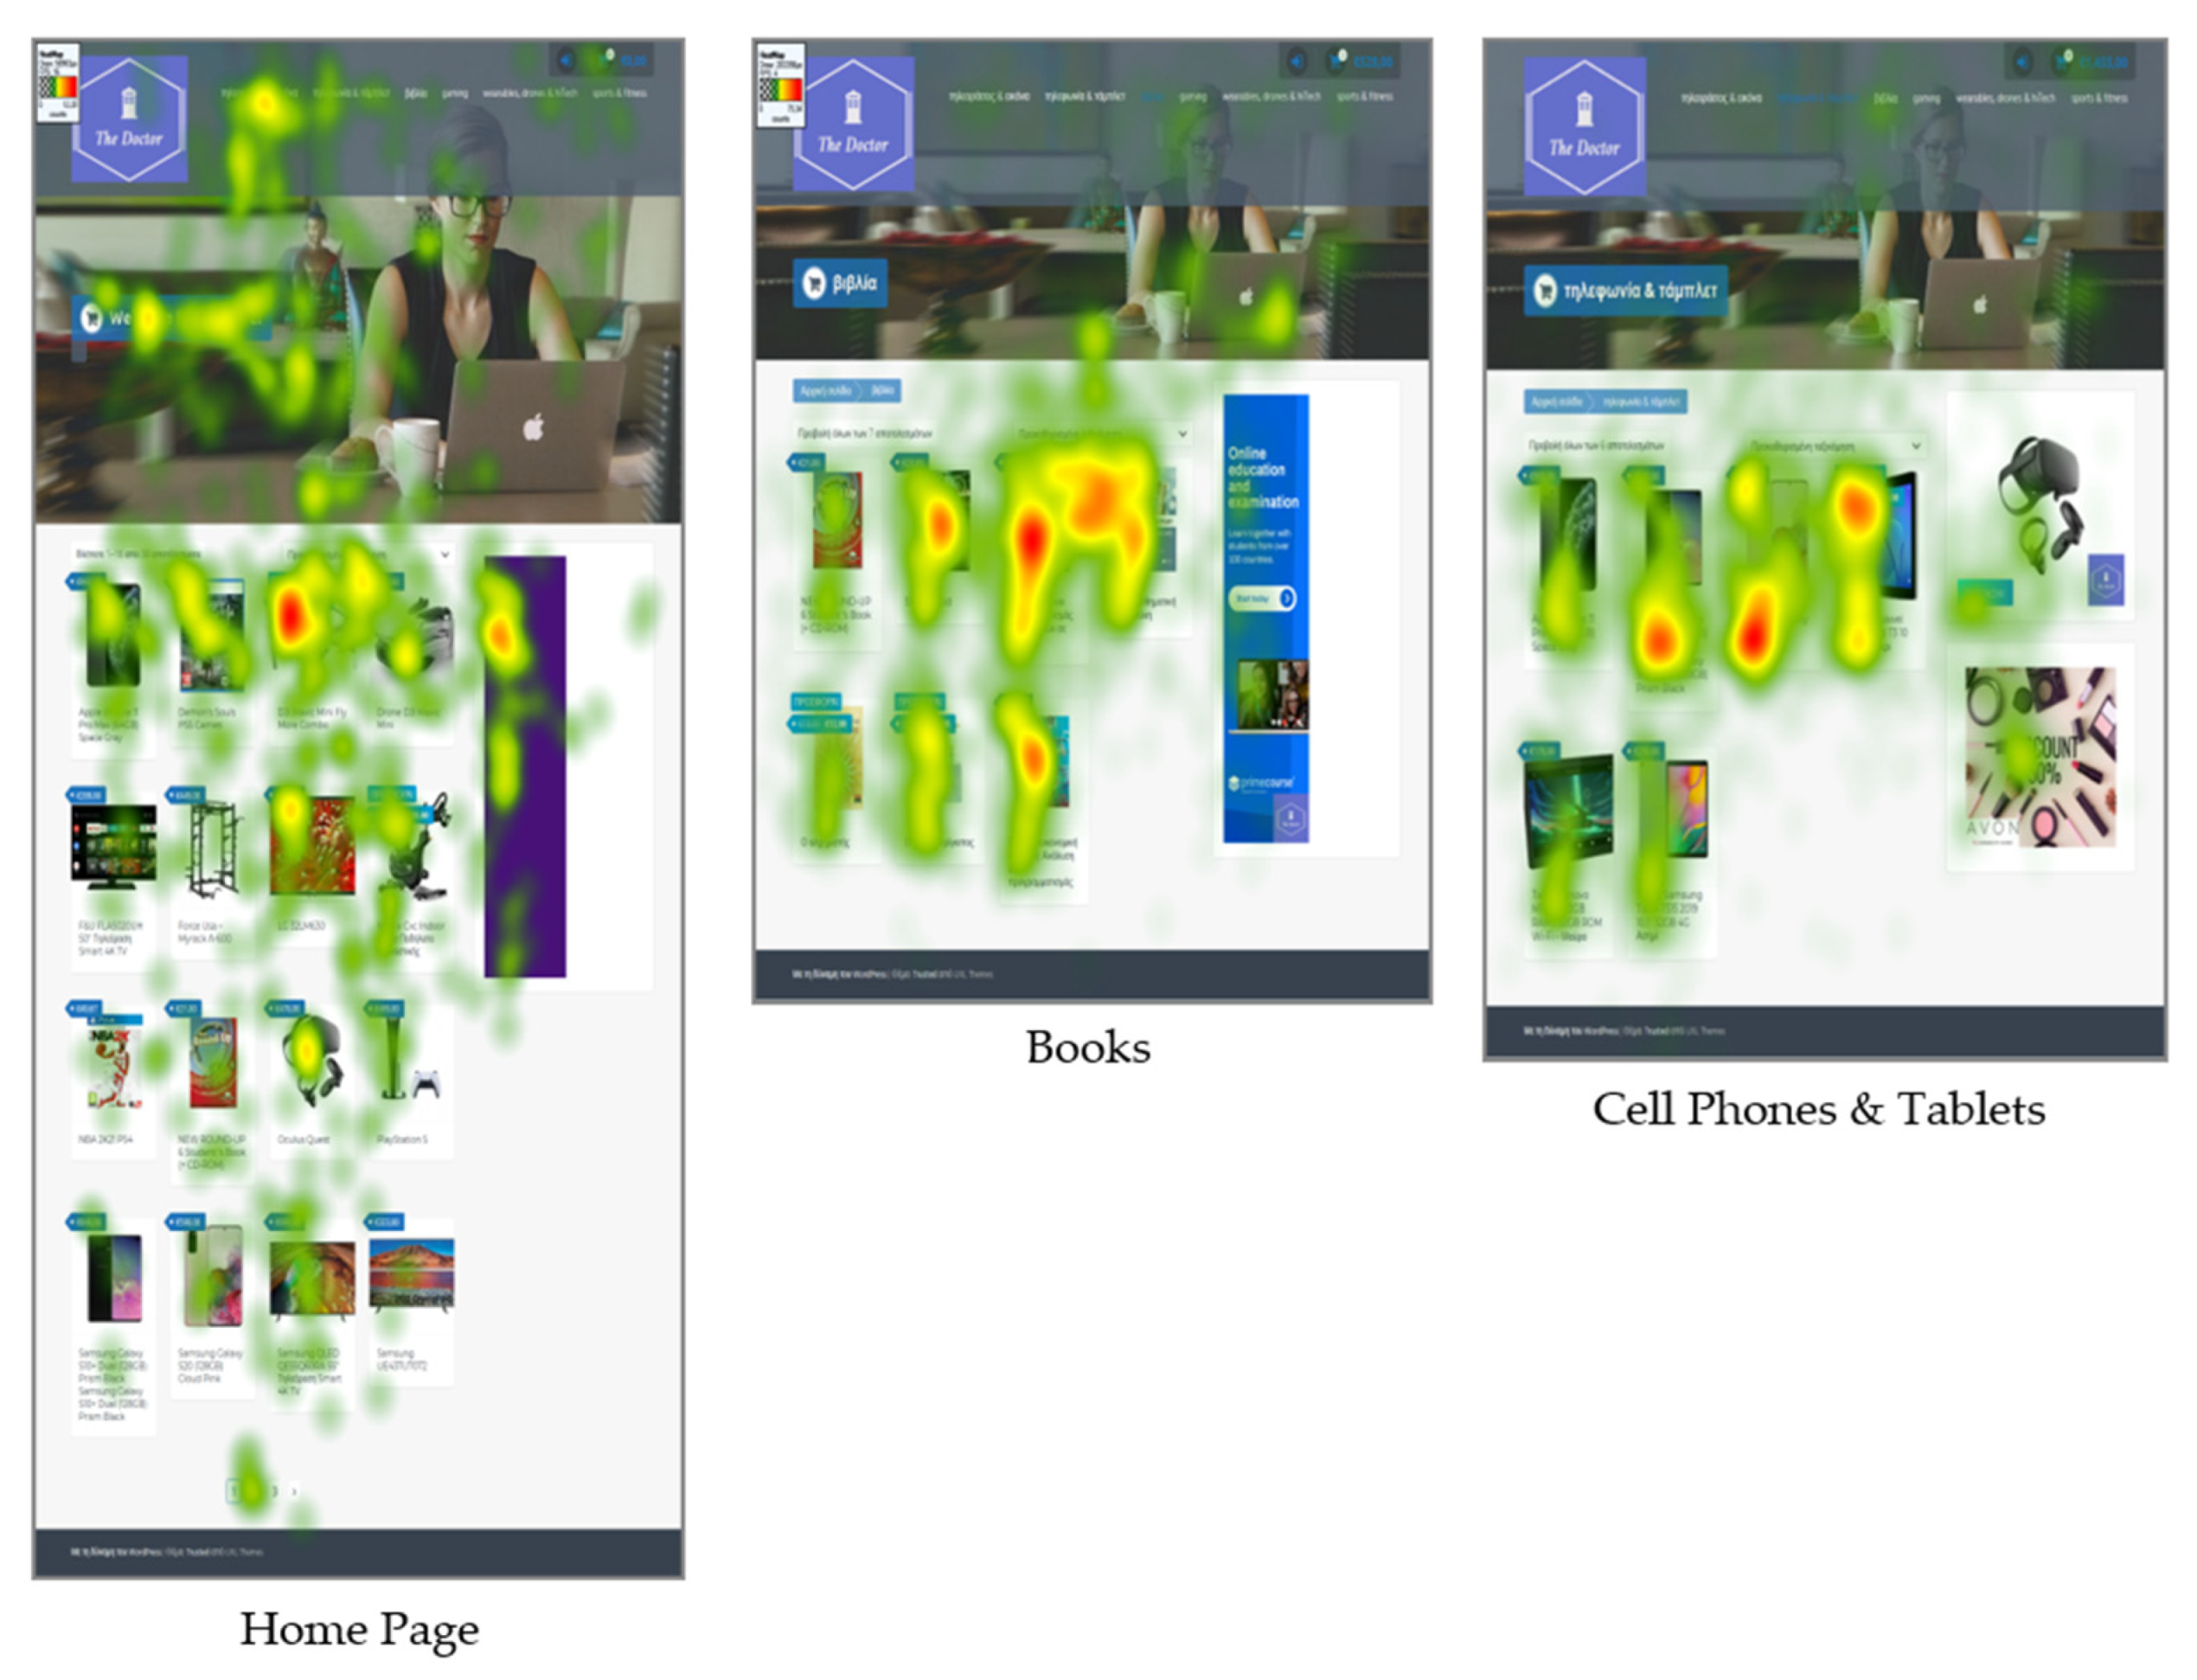
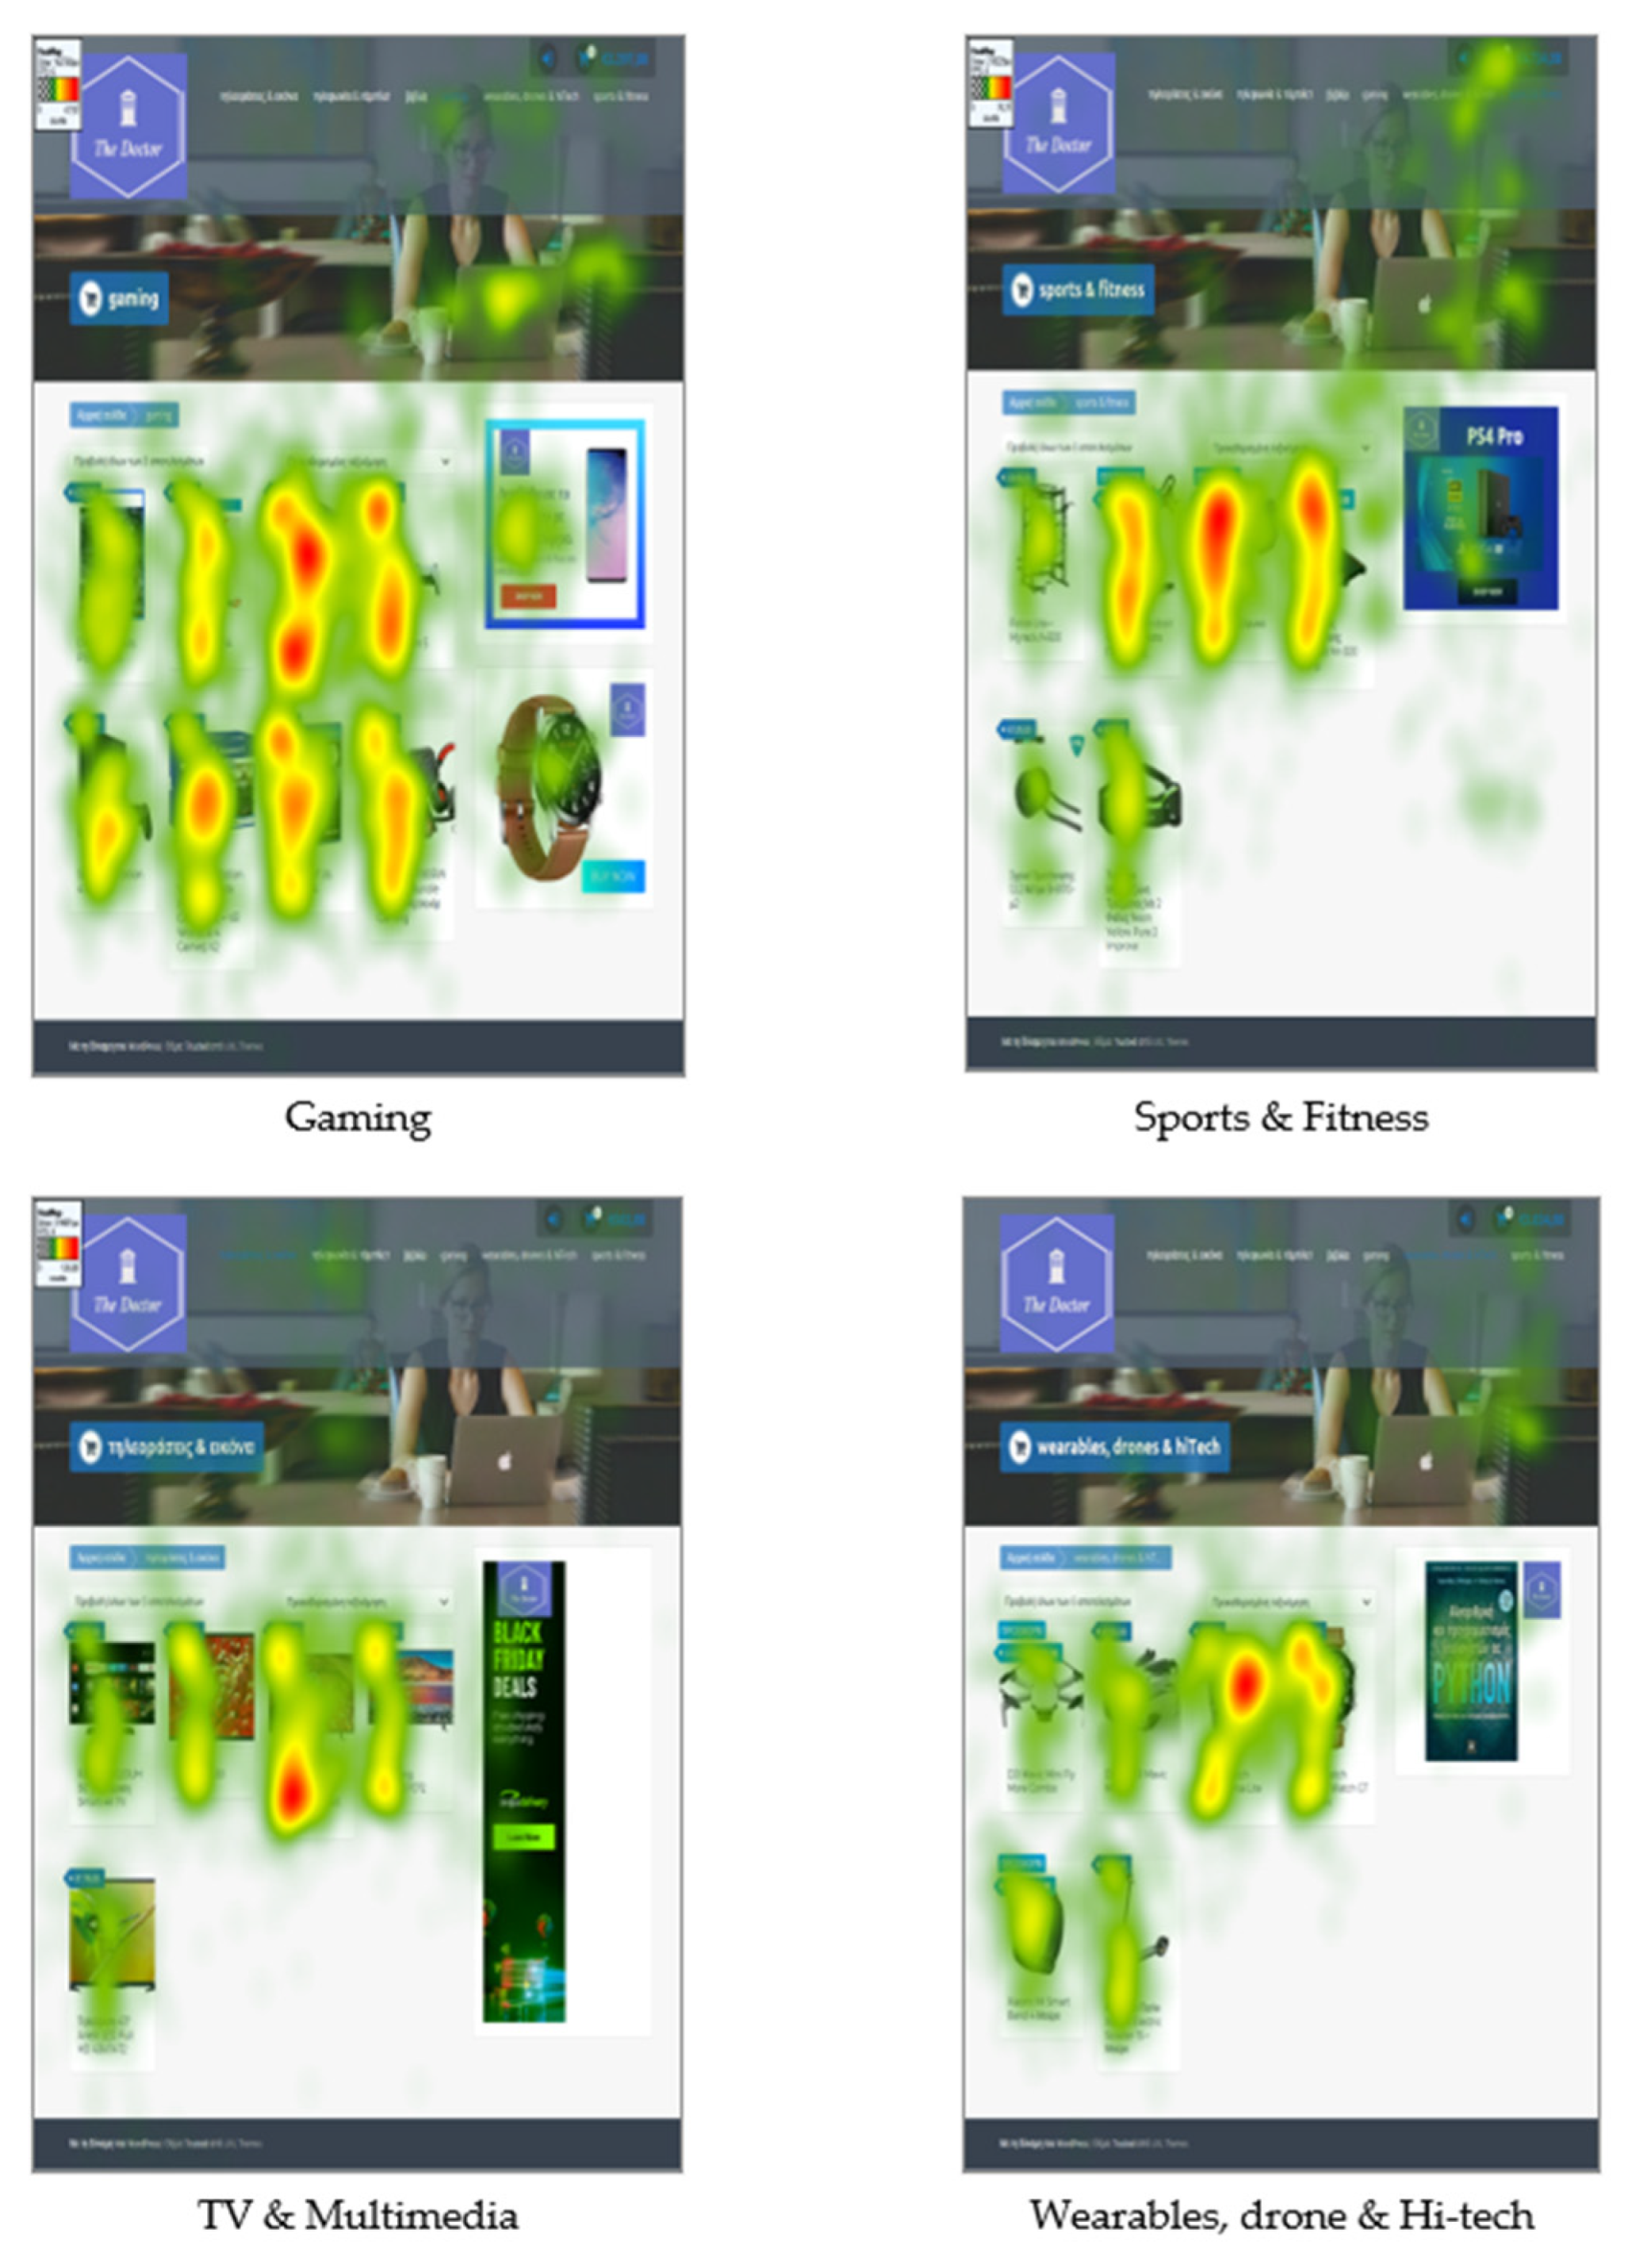
Eye-Tracking Results
4. Discussion
5. Limitations
6. Conclusions
Author Contributions
Funding
Institutional Review Board Statement
Informed Consent Statement
Data Availability Statement
Acknowledgments
Conflicts of Interest
References
- Kurtz, D.L.; Boone, E.L. Contemporary Marketing, 16th ed.; Cengage Learning: Boston, MA, USA, 2014. [Google Scholar]
- Ryan, D. Understanding Digital Marketing: Marketing Strategies for Engaging the Digital Generation, 4th ed.; Kogan Page: London, UK, 2017. [Google Scholar]
- Issa, T.; Turk, A. Applying usability and HCI principles in developing marketing websites. Int. J. Comput. Inf. Syst. Ind. Manag. Appl. 2012, 4, 76–82. [Google Scholar]
- Benbasat, I. HCI research: Future challenges and directions. AIS Trans. Comput. Hum. Interact. 2010, 2, 1. [Google Scholar] [CrossRef] [Green Version]
- Al-Samarraie, H.; Eldenfria, A.; Dawoud, H. The impact of personality traits on users’ information-seeking behavior. Inf. Process. Manag. 2017, 53, 237–247. [Google Scholar] [CrossRef]
- Dey, S.; Duff, B.R.; Chhaya, N.; Fu, W.; Swaminathan, V.; Karahalios, K. Recommendation for video advertisements based on personality traits and companion content. In Proceedings of the 25th International Conference on Intelligent User Interfaces, Cagliari, Italy, 17–20 March 2020; pp. 144–154. [Google Scholar]
- Carter, B.T.; Luke, S.G. Best practices in eye tracking research. Int. J. Psychophysiol. 2020, 155, 49–62. [Google Scholar] [CrossRef] [PubMed]
- Duchowski, A.T.; Duchowski, A.T. Eye Tracking Methodology: Theory and Practice; Springer: Berlin/Heiidelberg, Germany, 2017. [Google Scholar]
- Novak, T.P.; Hoffman, D.L.; Duhachek, A. The influence of goal-directed and experiential activities on online flow experiences. J. Consum. Psychol. 2003, 13, 3–16. [Google Scholar] [CrossRef]
- Danaher, P.J.; Mullarkey, G.W. Factors affecting online advertising recall: A study of students. J. Advert. Res. 2003, 43, 252–267. [Google Scholar] [CrossRef]
- Angell, R.; Gorton, M.; Sauer, J.; Bottomley, P.; White, J. Don’t distract me when I’m media multitasking: Toward a theory for raising advertising recall and recognition. J. Advert. 2016, 45, 198–210. [Google Scholar] [CrossRef]
- Drèze, X.; Hussherr, F.X. Internet advertising: Is anybody watching? J. Interact. Advert. 2003, 17, 8–23. [Google Scholar] [CrossRef] [Green Version]
- Hoyer, W.D.; MacInnis, D.J. Consumer Behaviour, 2nd ed.; Houghton Mifflin Company: Boston, MA, USA, 2001. [Google Scholar]
- Broadbent, D.E. The hidden preattentive processes. Am. Psychol. 1977, 32, 109. [Google Scholar] [CrossRef]
- Krugman, H.E. Memory without recall, exposure without perception. J. Advert. Res. 1977, 40, 49–54. [Google Scholar] [CrossRef]
- Lutz, S.; Huitt, W. Information Processing and Memory: Theory and Applications. Educational Psychology Interactive; Valdosta State University: Valdosta, GA, USA, 2003. [Google Scholar]
- Wu, S.I.; Wei, P.L.; Chen, J.H. Influential factors and relational structure of Internet banner advertising in the tourism industry. Tour. Manag. 2018, 29, 221–236. [Google Scholar] [CrossRef]
- Muñoz-Leiva, F.; Hernández-Méndez, J.; Gómez-Carmona, D. Measuring advertising effectiveness in Travel 2.0 websites through eye-tracking technology. Physiol. Behav. 2019, 200, 83–95. [Google Scholar] [CrossRef] [PubMed]
- Labrecque, L.I.; Milne, G.R. Exciting red and competent blue: The importance of color in marketing. J. Acad. Mark. Sci. 2012, 40, 711–727. [Google Scholar] [CrossRef]
- Kassin, S. Psychology; Prentice-Hall, Inc.: Hoboken, NJ, USA, 2003. [Google Scholar]
- Eysenck, H.J. Biological basis of personality. Nature 1963, 199, 1031–1034. [Google Scholar] [CrossRef] [PubMed]
- Allport, G.W.; Odbert, H.S. Trait-names: A psycho-lexical study. Psychol. Monogr. 1936, 47, 211. [Google Scholar] [CrossRef]
- Costa, P.T.; McCrae, R.R.; Holland, J.L. Personality and vocational interests in an adult sample. J. Appl. Psychol. 1984, 69, 390. [Google Scholar] [CrossRef]
- Costa, P.T., Jr.; McCrae, R.R. Revised NEO Personality Inventory (NEO-PI-R) and NEO Five Factor Model (NEO-FFI) Professional Manual; Psychological Assessment Resources: Odessa, FL, USA, 1992. [Google Scholar]
- Goldberg, L.R. “An alternative” description of personality: The big-five factor structure. J. Personal. Soc. Psychol. 1990, 59, 1216. [Google Scholar] [CrossRef]
- Lee, K.; Ashton, M.C. Psychometric properties of the HEXACO personality inventory. Multivar. Behav. Res. 2004, 39, 329–358. [Google Scholar] [CrossRef]
- Ashton, M.C.; Lee, K. Empirical, theoretical, and practical advantages of the HEXACO model of personality structure. Personal. Soc. Psychol. Rev. 2007, 11, 150–166. [Google Scholar] [CrossRef]
- Ashton, M.C.; Lee, K. The HEXACO–60: A short measure of the major dimensions of personality. J. Personal. Assess. 2009, 91, 340–345. [Google Scholar] [CrossRef]
- Ashton, M.C.; Lee, K.; Paunonen, S.V. What is the central feature of extraversion? Social attention versus reward sensitivity. J. Personal. Soc. Psychol. 2002, 83, 245. [Google Scholar] [CrossRef]
- Gilbert, P. Human Nature and Suffering; Lawrence Erlbaum: Hillsdale, NJ, USA, 1989. [Google Scholar]
- Gilbert, P. Depression: The Evolution of Powerlessness; Guilford: New York, NY, USA, 1992. [Google Scholar]
- Chance, M.R.A.; Jolly, C.J. Social Groups of Monkeys, Apes and Men; Jonathan Cape: London, UK, 1970. [Google Scholar]
- Živanović, M.; Čerović, S.; Bjekić, J. A six-factor model of brand personality and its predictive validity. Psihologija 2017, 50, 141–155. [Google Scholar] [CrossRef] [Green Version]
- Abbasi, A.Z.; Ting, D.H.; Hlavacs, H.; Wilson, B.; Rehman, U.; Arsalan, A. Personality differences between videogame vs. non-videogame consumers using the HEXACO model. Curr. Psychol. 2020, 1, 1–14. [Google Scholar] [CrossRef]
- Williams, B.; Damstra, D.; Stern, H. Professional WordPress: Design and Development; John Wiley & Sons: New York, NY, USA, 2015. [Google Scholar]
- Williams, B.; Tadlock, J.; Jacoby, J.J. Professional WordPress Plugin Development; John Wiley & Sons: New York, NY, USA, 2020. [Google Scholar]
- Hahn, S.; Buttaccio, D.R.; Hahn, J.; Lee, T. Personality and attention: Levels of neuroticism and extraversion can predict attentional performance during a change detection task. Q. J. Exp. Psychol. 2015, 68, 1041–1048. [Google Scholar] [CrossRef] [PubMed]
- Blumenthal, T.D. Extraversion, attention, and startle response reactivity. Pers. Individ. Differ. 2001, 31, 495–503. [Google Scholar] [CrossRef]
- Kobayashi, A.; Ishikawa, Y.; Minamikawa, A. A study on effect of big five personality traits on ad targeting and creative design. In International Conference on Persuasive Technology, Proceedings of the PERSUASIVE 2019: Persuasive Technology: Development of Persuasive and Behavior Change Support Systems, Limassol, Cyprus, 9–11 April 2019; Springer: Cham, Switzerland, 2019; pp. 257–269. [Google Scholar]
- Souiden, N.; Chtourou, S.; Korai, B. Consumer attitudes toward online advertising: The moderating role of personality. J. Promot. Manag. 2017, 23, 207–227. [Google Scholar] [CrossRef]
- Açan, B.; Akkaya, D.T. The impact of online advertising perceptions and personality traits on purchase intention. Curr. Res. Econ. Adm. Sci. 2020, 1, 194–218. [Google Scholar]
- Ashton, M.C.; Lee, K. Objections to the HEXACO model of personality structure—And why those objections fail. Eur. J. Personal. 2020, 34, 492–510. [Google Scholar] [CrossRef]


| Personality Dimensions | Cronbach’s Alpha α |
|---|---|
| Honesty–humility | 0.862 |
| Emotionality | 0.683 |
| Extraversion | 0.797 |
| Agreeableness | 0.615 |
| Conscientiousness | 0.697 |
| Openness to experience | 0.815 |
| HEXACO—60 Scale | H | E | X | A | C | O |
|---|---|---|---|---|---|---|
| Honesty–humility (H) | 1 | 0.224 | −0.209 | 0.410 * | 0.337 | 0.417 * |
| Emotionality (E) | 1 | −0.424 * | 0.227 | 0.291 | 0.154 | |
| Extraversion (X) | 1 | −0.057 | 0.217 | −0.013 | ||
| Agreeableness (A) | 1 | 0.367 * | 0.699 ** | |||
| Conscientiousness (C) | 1 | 0.479 | ||||
| Openness to experience (O) | 1 |
| B | Wald | p-Value | |
|---|---|---|---|
| Product 6 (Relevant3) Conscientiousness | 2.22 | 4.20 | 0.040 |
| Content 1 (Irrelevant TV) Honesty–humility | −2.65 | 4.06 | 0.044 |
| Color 2 (Irrelevant 2) Honesty–humility | −1.56 | 4.45 | 0.035 |
| Color 3 (Animated–Irrelevant) Extraversion | −7.23 | 4.50 | 0.034 |
| Banner 3 (Animated) Honesty–humility | −2.51 | 5.56 | 0.018 |
| Banner 3 (Irrelevant 1) Openness to experience | −2.39 | 4.01 | 0.045 |
| Not at all 2 (Irrelevant 2) Honesty–humility | 2.67 | 7.16 | 0.007 |
| Not at all 3 (Animated–Irrelevant) honesty–humility | 2.16 | 4.32 | 0.038 |
| Not at all 12 (Promo Cart) Conscientiousness | −2.61 | 3.85 | 0.050 |
| Time to First Fixation—Relevant Advertisements | ||||||
|---|---|---|---|---|---|---|
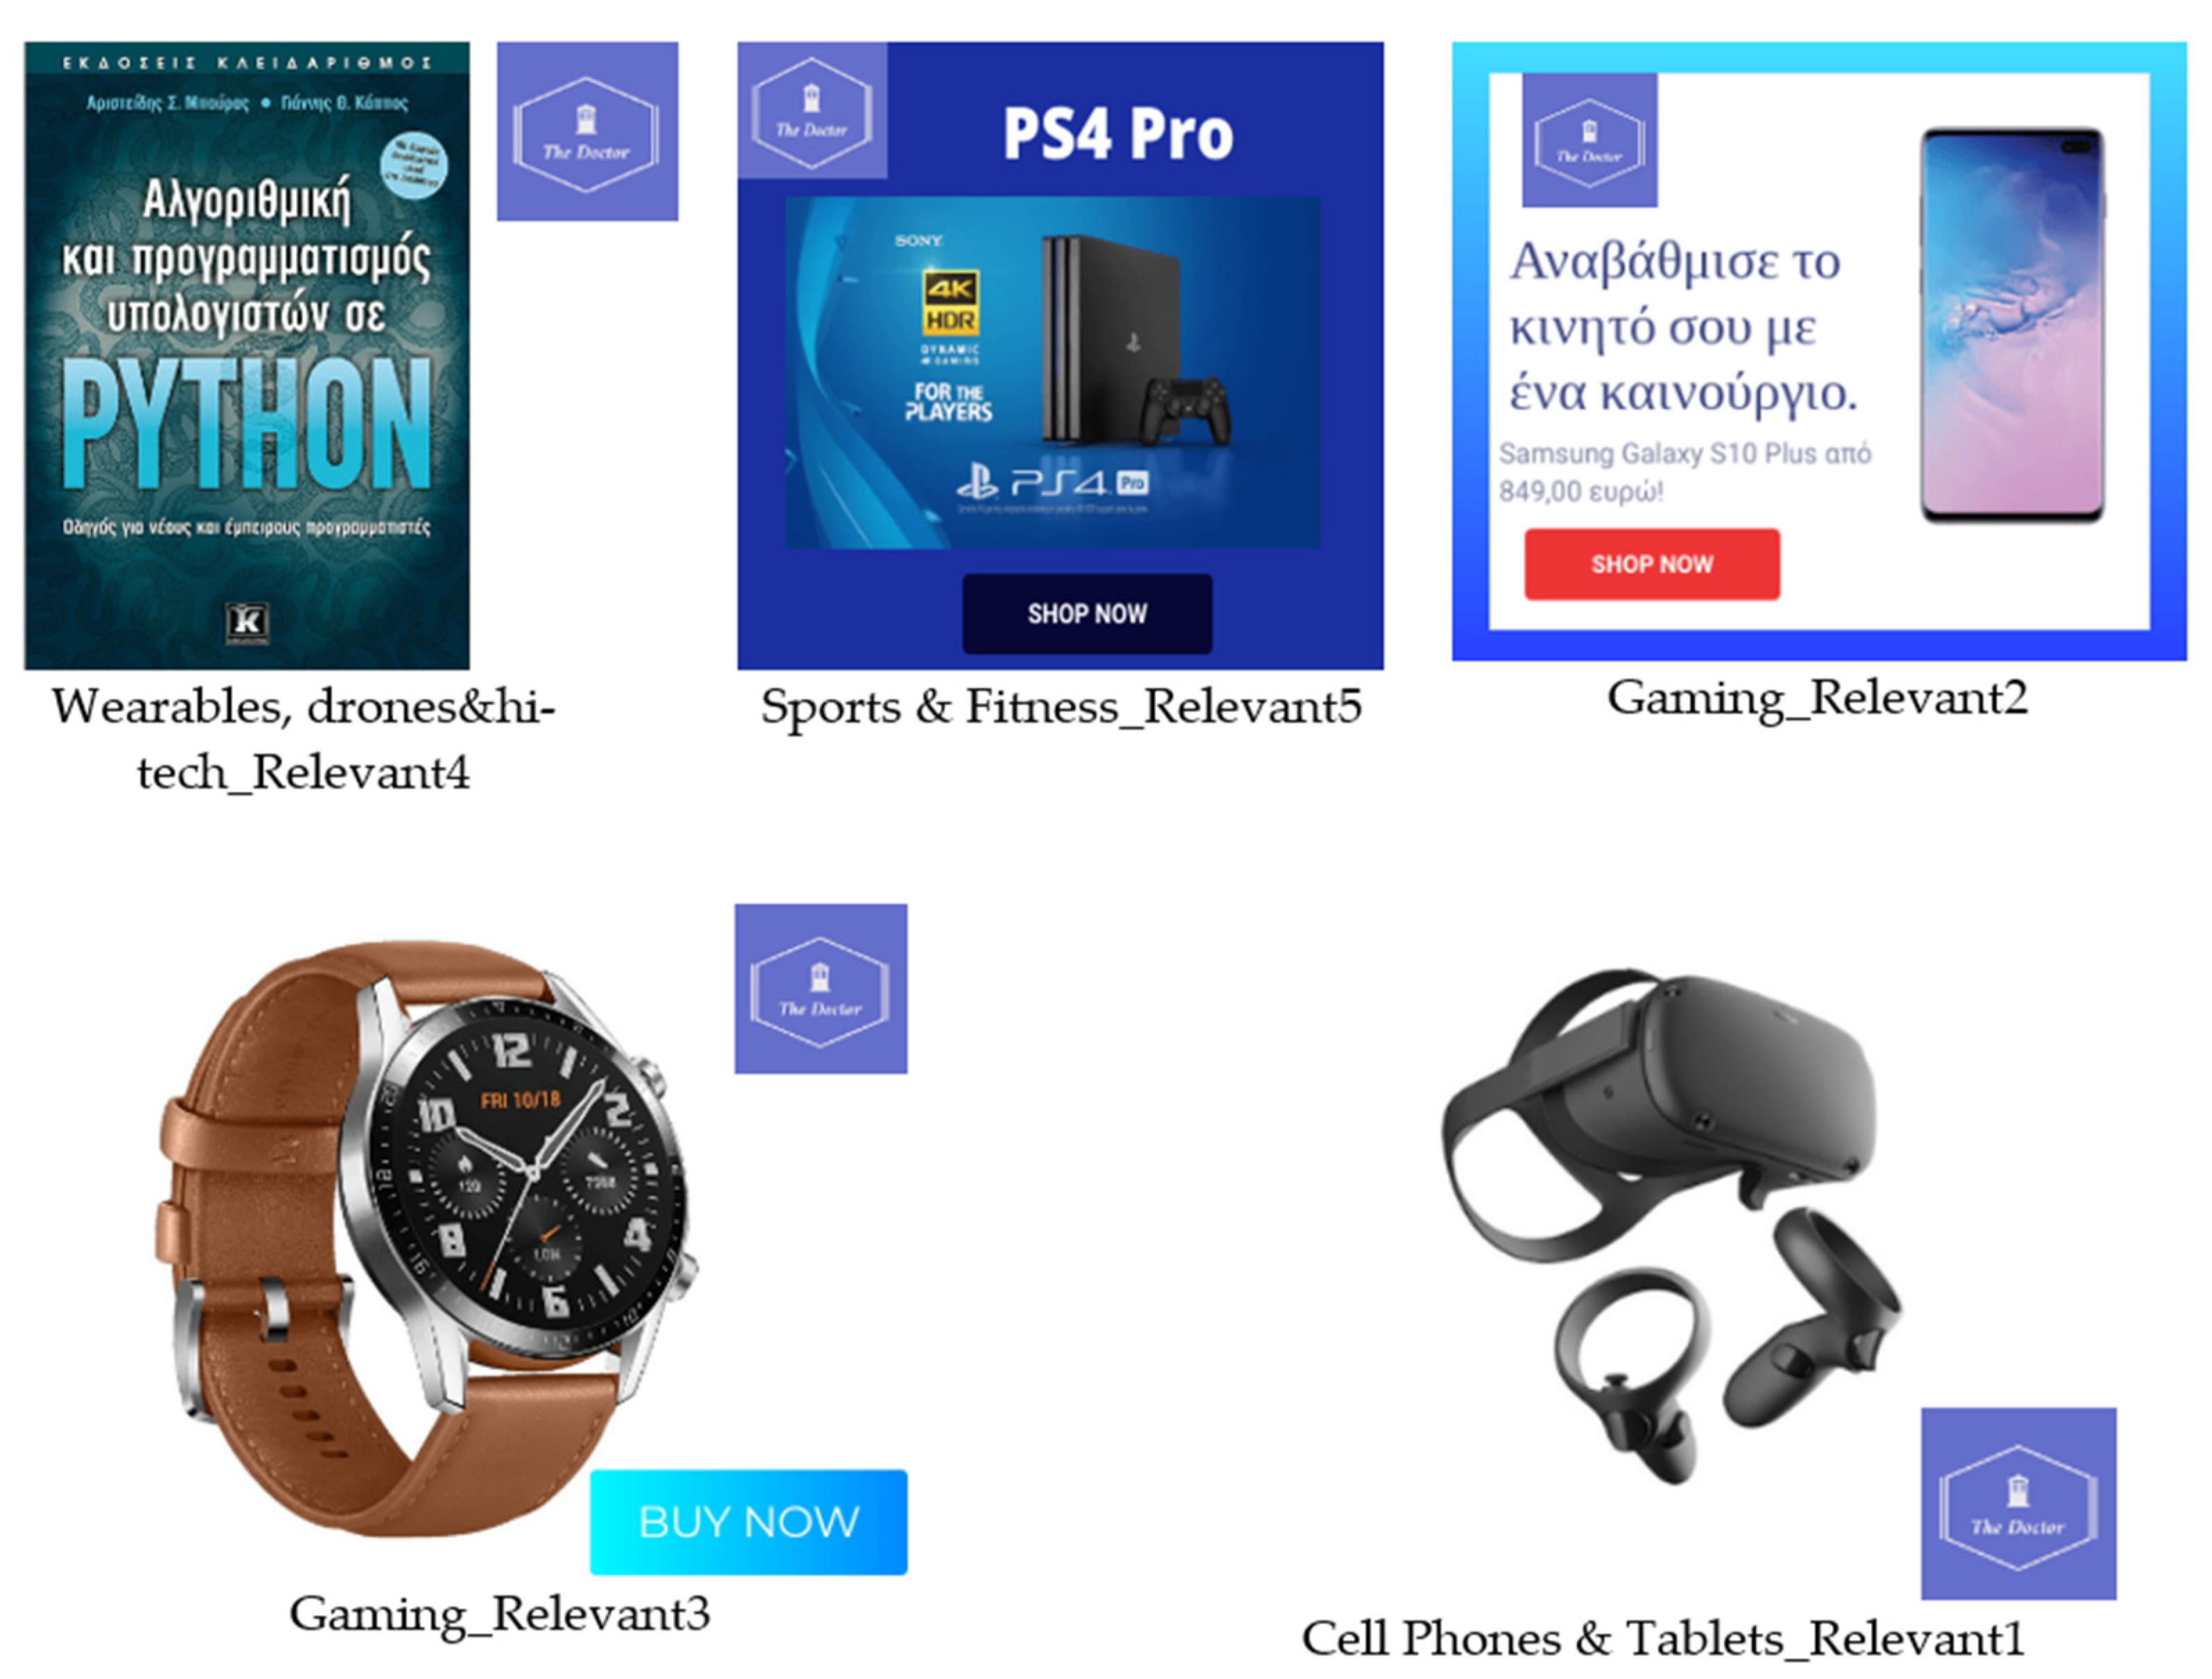
| Relevant1 (Cell Phones & Tablets) | Relevant2 (Gaming) | Relevant3 (Gaming) | Relevant4 (Wearables, Drones & Hi-Tech) | Relevant5 (Sports & Fitness) | Cart Promo | |
| N | 24 | 24 | 24 | 23 | 25 | 23 |
| Mean | 6.11 | 7.63 | 9.94 | 8.04 | 12.24 | 18.61 |
| SD | 8.12 | 7.88 | 9.64 | 9.38 | 11.74 | 14.14 |
| Max | 28.61 | 29.65 | 32.72 | 37.04 | 39.23 | 63.95 |
| Min | 0.28 | 0.26 | 0.93 | 0.33 | 1.00 | 2.09 |
| Time to First Fixation—Irrelevant Advertisements | ||||
|---|---|---|---|---|
| Irrelevant1 (Cell Phones & Tablets) | Irrelevant2 (Books) | Irrelevant_TV (TV & Multimedia) | Animated Banner (Homepage) | |
| N | 22 | 21 | 27 | 8 |
| Mean | 7.69 | 10.91 | 6.99 | 15.58 |
| SD | 10.02 | 10.18 | 7.53 | 21.02 |
| Max | 34.78 | 35.41 | 28.29 | 59.04 |
| Min | 0.76 | 0.14 | 0.39 | 0.00 |
| Visit Duration—Relevant Advertisements | ||||||
|---|---|---|---|---|---|---|
| Relevant1 (Cell Phones & Tablets) | Relevant2 (Gaming) | Relevant3 (Gaming) | Relevant4 (Wearables, Drones & Hi-Tech) | Relevant5 (Sports & Fitness) | Cart Promo | |
| N | 113 | 74 | 52 | 60 | 107 | 98 |
| Mean | 0.50 | 0.62 | 0.47 | 0.50 | 0.49 | 0.57 |
| SD | 0.52 | 0.47 | 0.32 | 0.33 | 0.55 | 0.50 |
| Max | 4.06 | 2.05 | 1.55 | 1.74 | 3.09 | 2.70 |
| Min | 0.02 | 0.12 | 0.01 | 0.04 | 0.01 | 0.01 |
| Visit Duration—Irrelevant Advertisements | ||||
|---|---|---|---|---|
| Irrelevant1 (Cell Phones & Tablets) | Irrelevant2 (Books) | Irrelevant_TV (TV & Multimedia) | Animated Banner (Homepage) | |
| N | 110 | 77 | 118 | 40 |
| Mean | 0.49 | 0.51 | 0.54 | 0.51 |
| SD | 0.47 | 0.50 | 0.63 | 0.37 |
| Max | 3.34 | 2.80 | 4.57 | 1.82 |
| Min | 0.02 | 0.04 | 0.01 | 0.06 |
Publisher’s Note: MDPI stays neutral with regard to jurisdictional claims in published maps and institutional affiliations. |
© 2021 by the authors. Licensee MDPI, Basel, Switzerland. This article is an open access article distributed under the terms and conditions of the Creative Commons Attribution (CC BY) license (https://creativecommons.org/licenses/by/4.0/).
Share and Cite
Balaskas, S.; Rigou, M. Effect of Personality Traits on Banner Advertisement Recognition. Information 2021, 12, 464. https://doi.org/10.3390/info12110464
Balaskas S, Rigou M. Effect of Personality Traits on Banner Advertisement Recognition. Information. 2021; 12(11):464. https://doi.org/10.3390/info12110464
Chicago/Turabian StyleBalaskas, Stefanos, and Maria Rigou. 2021. "Effect of Personality Traits on Banner Advertisement Recognition" Information 12, no. 11: 464. https://doi.org/10.3390/info12110464
APA StyleBalaskas, S., & Rigou, M. (2021). Effect of Personality Traits on Banner Advertisement Recognition. Information, 12(11), 464. https://doi.org/10.3390/info12110464