Article

A Web-Based Approach for Visualizing Interactive Decision Maps

1
Forest Research Centre, School of Agriculture, University of Lisbon, Tapada da Ajuda, 1349-017 Lisboa, Portugal
2
Centre for Environmental and Marine Studies, Campus Universitário de Santiago, University of Aveiro, 3810-193 Aveiro, Portugal
3
Mathematics Department, School of Sciences and Technology, University of Evora, Colégio Luís António Verney, Rua Romão Ramalho, 59, 7000-671 Évora, Portugal
4
Research Centre for Mathematics and Applications, Colégio Luís António Verney, Rua Romão Ramalho, 59, 7000-671 Évora, Portugal
5
Corvallis Forestry Sciences Laboratory, Pacific Northwest Research Station, Forest Service, US Department of Agriculture, 3200 SW Jefferson Way, Corvallis, OR 97331, USA
*
Author to whom correspondence should be addressed.
Information 2021, 12(1), 9; https://doi.org/10.3390/info12010009
Submission received: 27 October 2020 / Revised: 9 December 2020 / Accepted: 10 December 2020 / Published: 24 December 2020
(This article belongs to the Special Issue Artificial Intelligence and Decision Support Systems)

Abstract

:
This research expands the applicability of the Feasible Goals (FGoal) Pareto frontier multiple criteria method to display the Edgeworth–Pareto hull using interactive decision maps (IDMs). Emphasis is placed upon the development of a communication architecture to display the Pareto frontiers, which includes a client device, a web server, and a dedicated computation server implemented with sockets. A standalone application on the latter processes client-server requests and responses to display updated information on the client. Specifically, the dedicated computation server is responsible for calculating the information needed to generate the Edgeworth–Pareto hull. This is delivered to the web server to generate the IDM to be displayed on the client device. The key innovation of this work is a tool that is developed to aid decision-makers with a network-based computational architecture that includes a computational server constantly in communication with a web server for fast responses to client requests to represent IDMs. Results show that this innovation avoids time-consuming communication, and this approach to represent IDMs on the web facilitates collaboration among decision-makers because they can analyze several complex problems in different browser windows and decide which problem and solution better correspond to their aims.

1. Introduction

Considerable advances in the evolution of interactive decision maps (IDMs) have occurred—beginning at the end of the 20th Century and extending to the present time—due to improvements in the processing speed of personal computers and devices and, at same time, the increasing need to visualize tradeoffs on Pareto frontiers to aid decision-makers with multicriteria decision analysis [1]. Forest science, and environmental sciences more generally, are important contexts that can benefit from decision-making, using IDMs to support planning and multicriteria optimization, because decision-makers in natural resource management typically have to deal with multiple tradeoffs in their multicriteria optimization problems, including, for example, many possible combinations of ecosystem services and products. These tools target the increase in the efficiency and the effectiveness of forest management decision support system (DSS) tools and address the trends identified by Reynolds et al. [2] and Borges et al. [3]—namely, the need to consider multiple decision criteria and, at the same time, to be capable of responding to multiple stakeholders with conflicting interests [4]. Currently, stakeholders tend to have a more active role in the participatory process. Therefore, contemporary DSS development tends to be linked to stakeholder involvement [5,6,7,8,9]. Web-based decision tools have been developed in order to help stakeholders and researchers in their decision tasks, making remote access to advanced decision methods and techniques possible [10]. The forestry literature reports several examples of DSSs to address multicriteria analysis and the management of ecosystem services [2,3,11,12,13,14,15,16,17]. Nevertheless, few are dedicated to the development and visualization of Pareto frontiers to support further collaborative management planning processes targeting the supply of several ecosystem services.
Some examples of multicriteria optimization problems involving tradeoff analysis include [18,19,20] and more recent studies carried out at the School of Agriculture (University of Lisbon) in collaboration with the University of Évora [7,8,21,22,23]. In the latter studies, the IDMs were either encapsulated in decision support systems as standalone packages or desktop application tools or used as application tools for building and showing Pareto frontiers on devices such as laptops and smart phones. Other web-based Pareto frontier decision tools related to forest and environmental sciences have been built, although using other methodologies, as in the work of Tóth et al. [4]: ECOSEL: an auction mechanism for forest ecosystem services.
All the web-based applications of IDMs mentioned above can be classified into two types of system architectures. On the one hand, there are systems that encapsulate a stand-alone tool developed in C++ in PHP code to communicate with the client computer, responding to its requests for calculations, to develop the visualization of Pareto frontiers for a client. On the other hand, there are systems in which a Java applet on the server computer performs all needed calculations and visualizations to be shown in the client by means of XHTML pages. Both types of applications are examples of web applications that implement remote rendering. Nevertheless, these systems are built on an architecture distributed over one or two machines. The main objective of this work is to show the possibility of communication between the client and PHP server to receive and respond to the requests of a client server. The PHP server is responsible for communicating with a dedicated computation server to generate the vertices and constraints of the Edgeworth–Pareto hull. This communication is performed using sockets [24] among the web server and computation server with a common free port and the computation server’s Internet Protocol (IP) address. After the Edgeworth–Pareto hull is built, the web-based graphical user interface (wgui) with IDMs is displayed on the client computer and updated according to the communications (sequences of requests and responses between the three computers). This is an innovation of the former architectures for building IDMs in forest management as it distributes calculations over three computers in the network, one of which is dedicated to generating the Edgeworth–Pareto hull.
The decision tool architecture of this research is thus motivated by the need to efficiently and effectively address collaborative management planning processes targeting the provision of several ecosystem services. By combining a client, a PHP server, and a computational server, it becomes very feasible to build IDM representations of problems with numerous constraints and decision variables for the client in close to real time. Moreover, it takes advantage of the network to perform the calculations and representation of IDMs instead of having an application running standalone on a personal computer. For collaborative decision-making in forest management, this architecture offers significant advantages to stakeholders as the tool is free and does not require the purchase of expensive hardware or software. The computation server is a particularly important element of the architecture because it enables solutions to very large IDM problems in close to real time in situations such as workshop settings.
This work aims to present: (a) an approach to develop web-based decision maps that allows decision-makers to develop their tradeoff analyses (how much they are able to sacrifice one objective to improve other objectives) more easily and promoting collaboration among decision-makers who have formulated their decision problem as a linear programming problem; (b) a computational architecture capable of dealing with complex linear programs with a great number of decision variables and constraints by running the iterative algorithm for generating IDMs, displaying the Pareto frontiers and the solution chosen by decision-makers in a short period of time; (c) a flexible decision tool that can be used to analyze several concurrent problems at the same time in different Google Chrome (for which it is optimized) windows, providing the decision-makers with a good number of tools to make an informed decision concerning their main objectives.
The structure of this work encompasses: the Introduction that characterizes the state-of-the-art technology and provides the motivation for this research; the Materials and Methods, which include subsections to describe the optimization and visualization processes (Optimization and Visualization of Interactive Decision Maps) and to present implementations of these processes (Implementations); the Results section presents some outcomes of the use of the decision tool and includes a subsection with a forest management application; the Discussion section is dedicated to the discussion of our work; the Conclusion makes some final remarks about our decision tool.

2. Materials and Methods

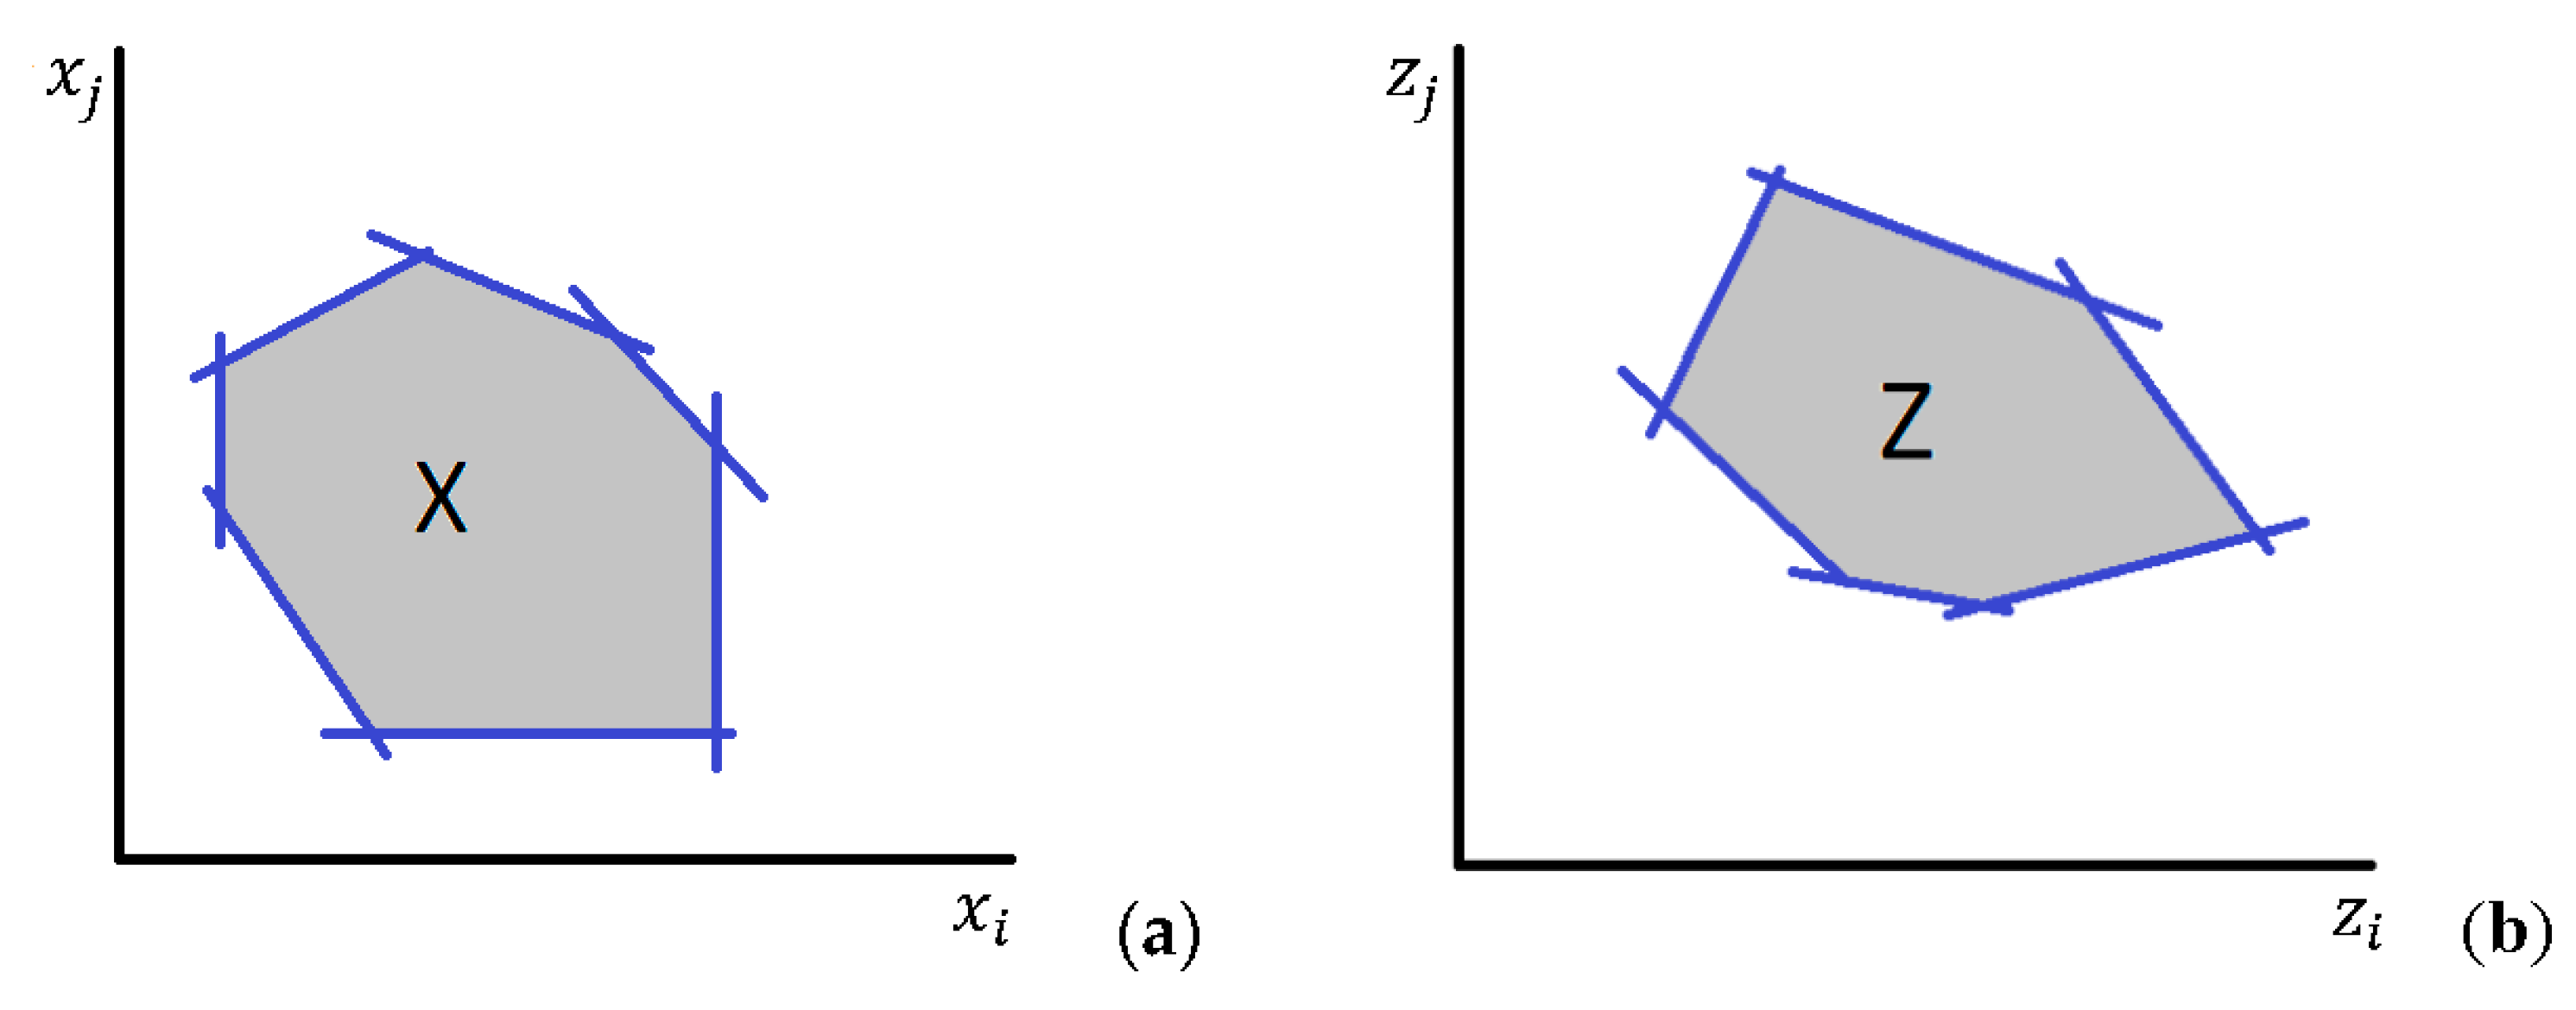
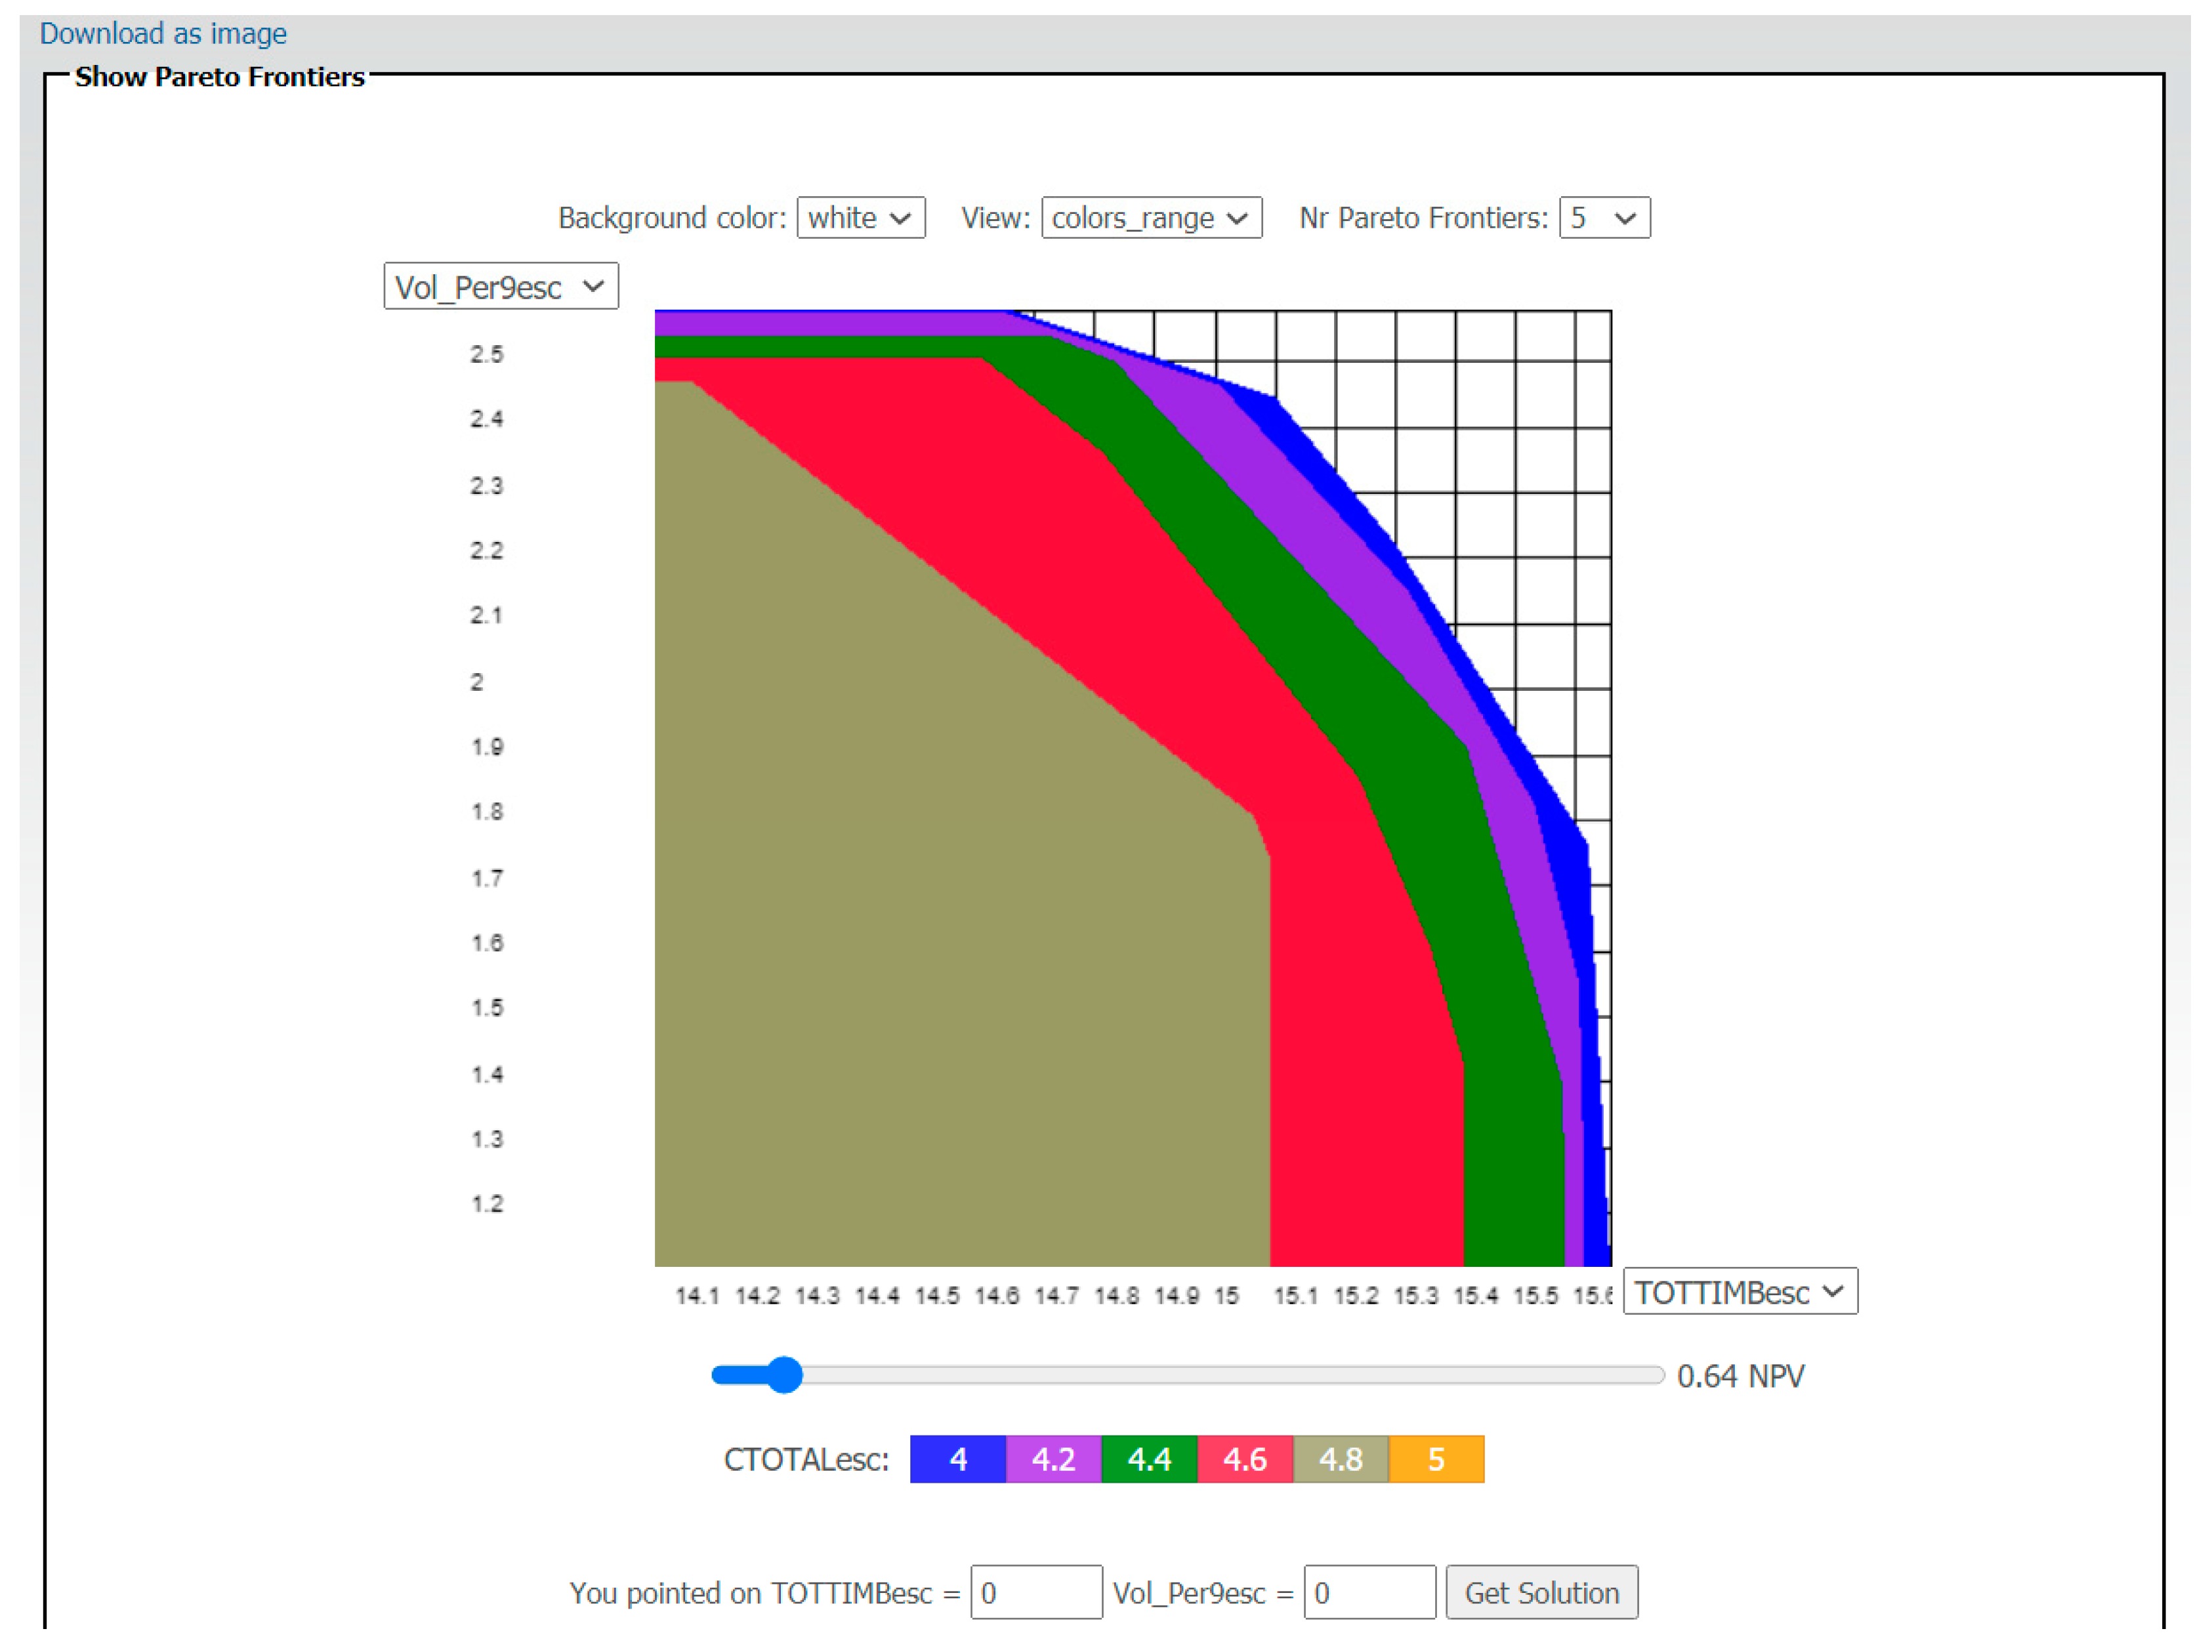
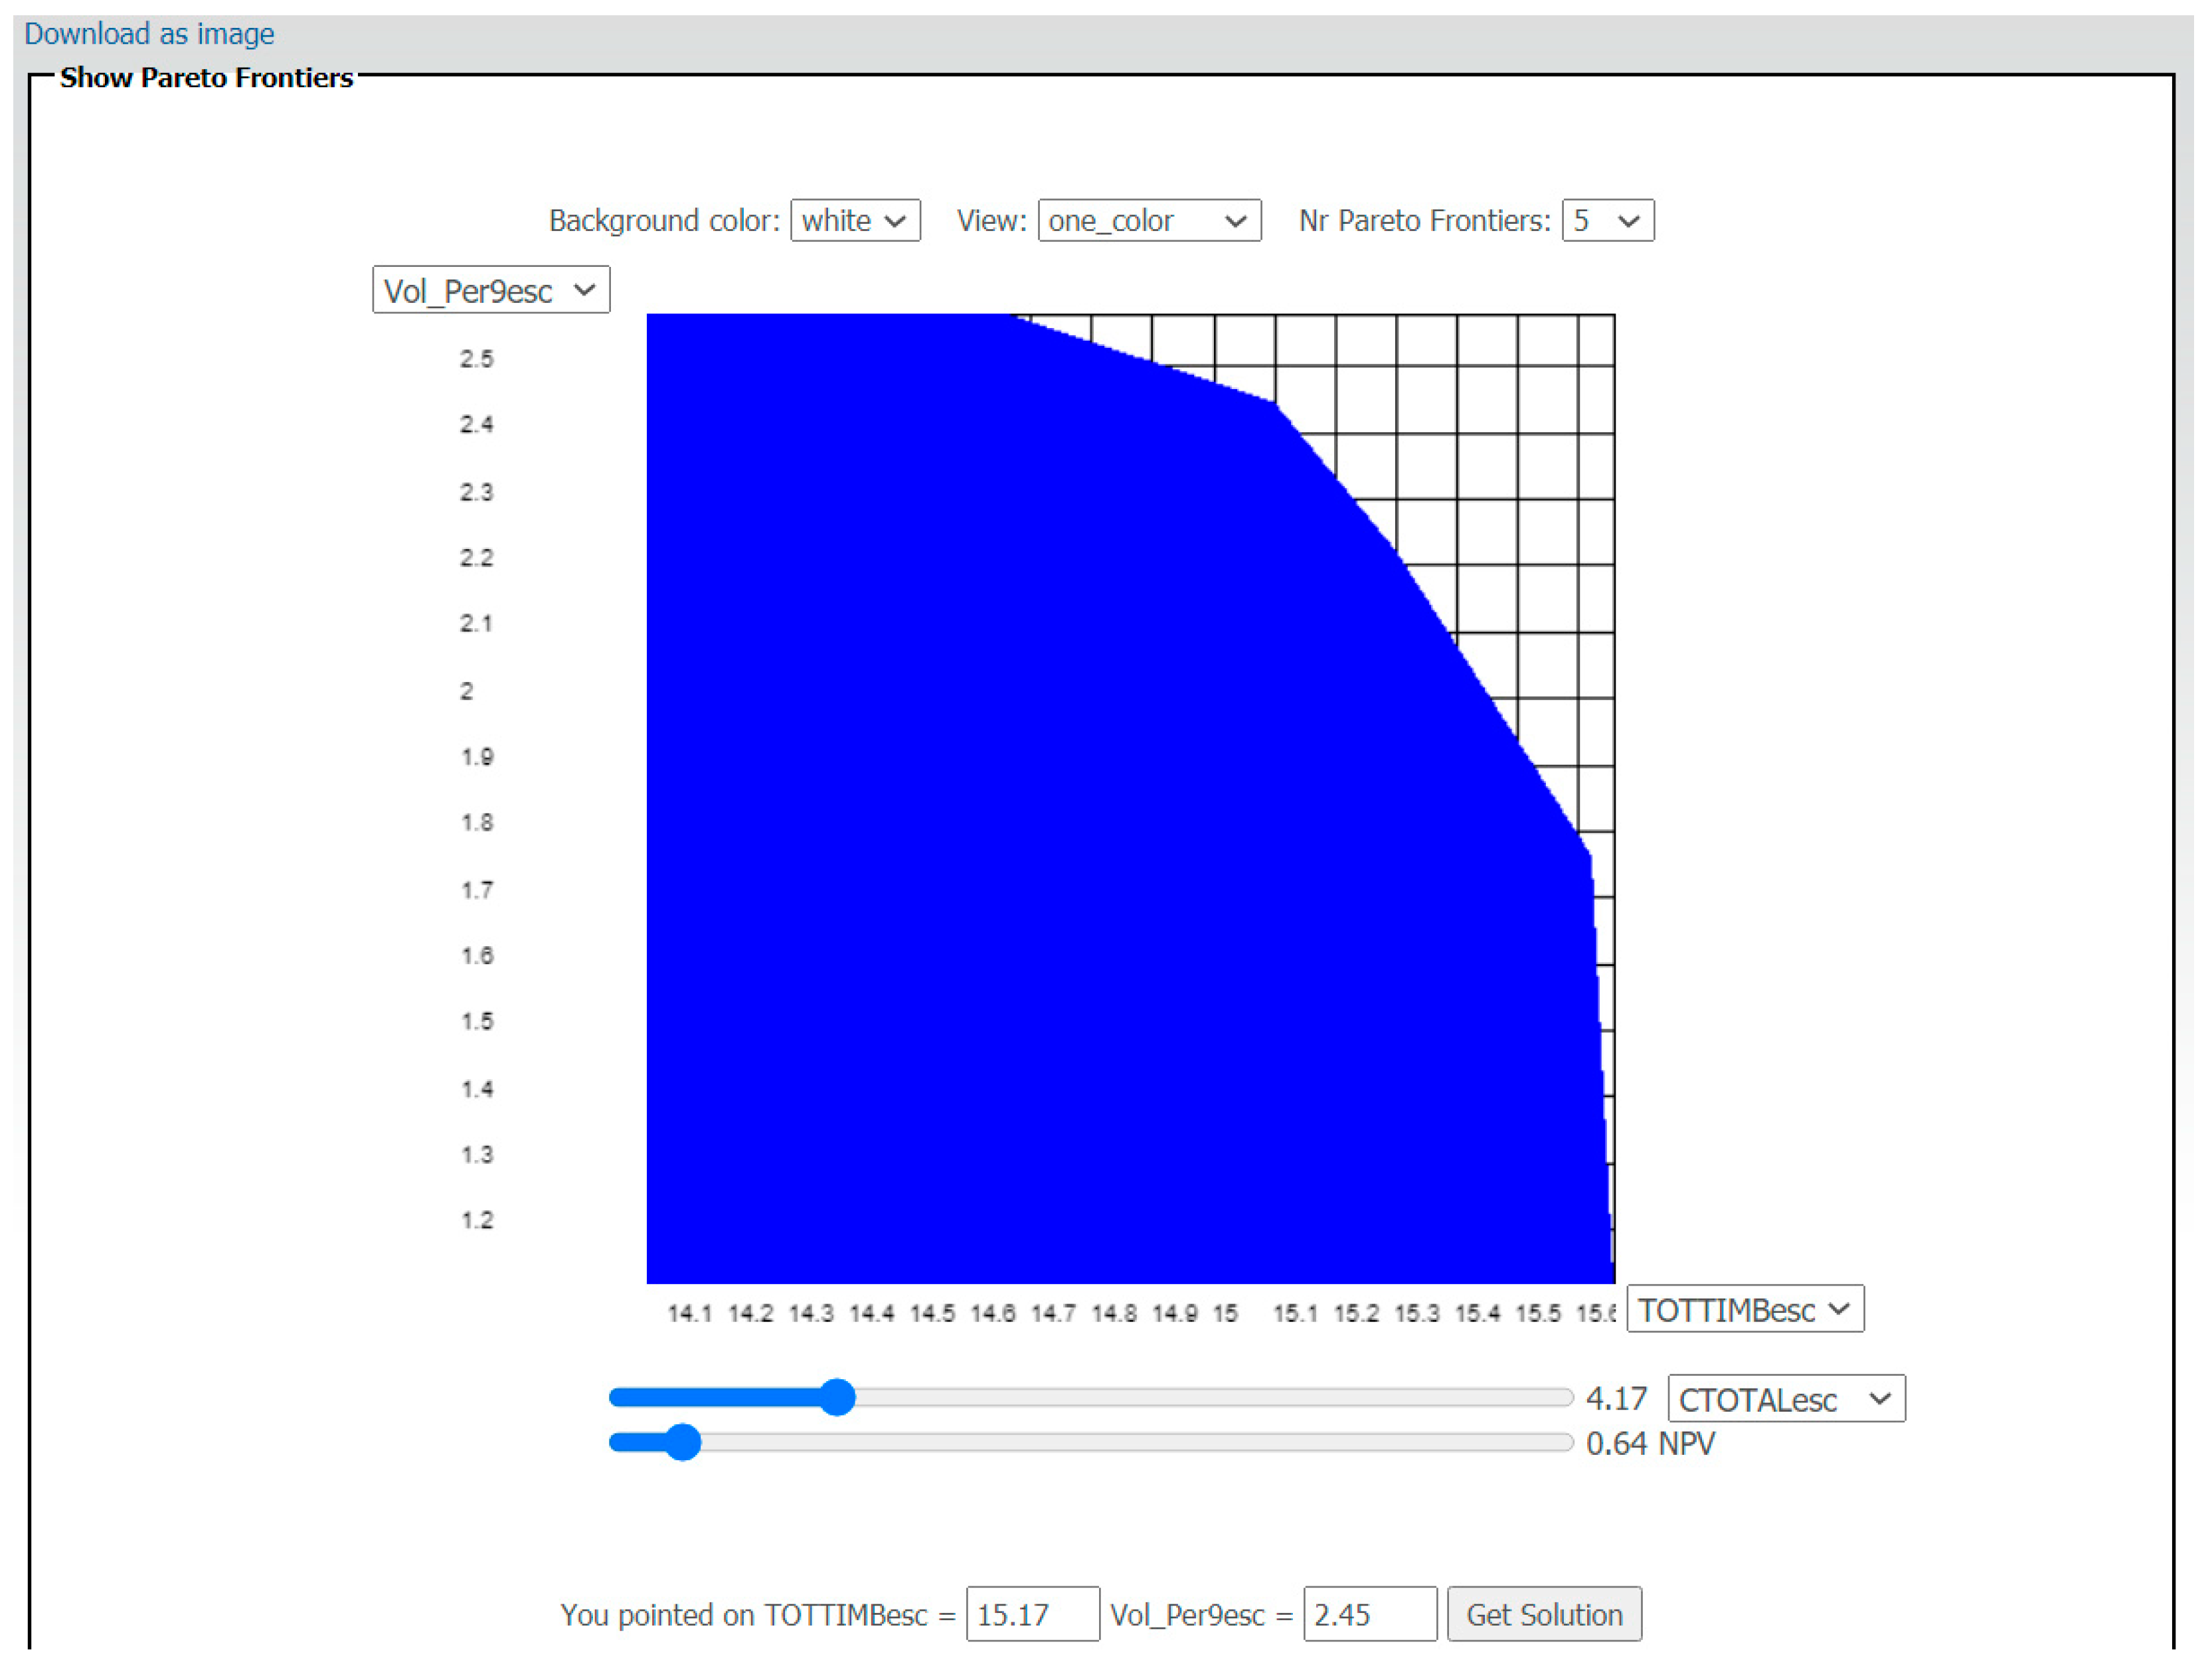
2.1. Optimization and Visualization of Interactive Decision Maps

The methods of multicriteria linear programming can be classified according to the degree of decision-maker intervention [25,26,27]. According to these classifications, the multicriteria methods can be divided into three types: (i) the decision-maker chooses their preferences a priori; (ii) the decision-maker chooses their preferences in a previous dialogue phase and there is a sequence of computation phases and dialogue phases during the decision process in order to calculate new efficient solutions; (iii) the decision-maker takes their a posteriori decisions, before the set of proposed solutions is generated, from which the decision-maker will make their choice. The Pareto frontiers method shown in our IDMs falls into the third type.
To display the solution space for more than one criterion, a two- or three-dimensional graph needs to be use. The types of graph visualization include: (a) the representation of a set of efficient solutions in two or three dimensions as proposed by Tóth et al. [10]; (b) the representation of solutions for two to three criteria in a triangle as proposed by Climaco and Antunes [28]; (c) a Pareto frontier representation using IDMs, with the third criterion represented by colored sliders, each one with a different value associated to the third criterion. In the remainder of this paper, we focus on the representation of IDMs for a bicriterion Pareto frontier, which was first developed by Gass and Saaty [29] using standard parametric linear programming.
The representation using standard parametric linear programming is not an easy task if there are more than two criteria to be shown. Zeleny [30] and Steuer [27] demonstrate how linear multicriteria methods, based on the idea of Gass and Saaty [29], can be used to construct the list of all nondominated vertices. However, sometimes the vertices are not located regularly on the Pareto frontier, in which case they may fail to accurately represent the Pareto frontier. As a result, the nondominated faces are provided as well, and they are an analogue to the line segments for bicriterion Pareto frontiers. Although the access to all multidimensional information such as faces and vertices are relevant for representing the multidimensional convex hull, sometimes it is hard to formulate a decision from a very complex visualization. Then, decision maps are very useful in order to simplify the visualization and analyze such information, as we describe below.
For three criteria, we can efficiently construct a bicriteria tradeoff curve by fixing the third criterion within a range of values. However, for four or more criteria, and with hundreds or thousands of decision variables, it can take a lot of computational time to construct a decision map. Therefore, for the latter higher dimensional problems, some preprocessing work is needed to speed up the computations needed to generate the decision maps. A useful preprocessing algorithm developed by Lotov et al. [20] is based on approximating the Edgeworth–Pareto hull (EPH) for all chosen criteria (see reference [20] for additional details).
The set X (feasible solutions set) is mathematically defined for the linear case by the following expression:
X = { x   n   : H x h }
The EPH is the non-negative convex set in the space m ( m 2 ) , delimited by the nondominated frontier, which is composed by the set of weakly nondominated criteria points and straight-line segments that connect these points. A point z Z is considered a weakly nondominated point when there is not another feasible point which satisfies z i   z i   ( i   =   1 , , m ) , z Z   z z . We assumed the linearity of the system of inequalities due to the given matrix H and given vector h. Setting f ( x ) = F x , where F is a given matrix, the EPH we want to find is [20]:
Z = { z   m : z = F x ,     H x h }
Or alternatively,
Q * = { z   m : D * z d * }
where Q * is the multidimensional set of feasible solutions on the decision space. The matrix D * and the vector d * need to be found. Given x X , all feasible values for decision variables, and z Z , all feasible values for the criteria, we can define the graph
Y * = { ( x , z )   n ×   m   : z   F x ,     H x h }
Thus, all we need is to construct the projection of Y * onto m , the set Z * . This set can be found using convolution methods. The process is described in reference [20] (pp. 201–202). Figure 1a–e illustrates the process used for visualizing and generating Pareto frontiers with two or three criteria. The convex hull of the decision variables X (Figure 1a) was transformed into the criteria’s convex hull Z (Figure 1b) by matrix F . Figure 1c shows in purple the set of nondominated solutions from set Z (supposing only one value for the third criterion, k), while Figure 1d extends this set to the axis and, finally, Figure 1e represents the frontiers for some values of the third criterion (k). In the case of four or five criteria, the graphical representation will be similar to (e), but with sliders on the bottom of the decision map for the user to choose the values to be fixed for the fourth and fifth criteria, and in this way change the representation of Pareto frontiers.
The optimization process in this decision tool lets the decision-maker interact with dynamic and web-based graphical decision interfaces (e.g., iterative decision maps). Based on the selected decision criteria, the decision-maker can analyze the results of the dynamic interactions that optimize his/her preferences. The concept of gamification [31] applies here to the conception and development of this decision tool, which focuses on graphical representation, dynamic interfaces, and real-time information.
The decision-maker can maximize or minimize criteria to be considered together in the multicriteria mathematical programming problem. The interface for generating the convex hull encompasses the criteria to be optimized, the maximum and the minimum values to be shown in the Pareto frontiers (or more correctly, Edgeworth–Pareto hull) and, finally, for generating the Edgeworth–Pareto hull set (an iterative process that is graphically represented). In the interface of the EPH, the decision-maker can visualize and interact with the graphical representation of tradeoff frontiers for the chosen set of concurrent criteria and choose the point on the frontier that satisfies his/her objectives.
To draw the EPH, the values of two criteria are considered, while the values for all other criteria are fixed. An algorithm, based on the Gift-Wrapping Algorithm for building Convex hulls [32], was implemented in PHP to sort the two-dimensional vertices of each slice of the EPH in the criteria space.
Although the process of acquiring a solution based on the graphical representation of the EPH is conceptually quite simple, the computational process is complex. The decision-maker identifies a feasible goal directly on the IDM, first selecting a point on the map that maximizes his/her preferences. Before choosing that point, all criteria except two are fixed. The two criteria ( u ^ , v ^ ) are fixed when they click on the map and the goal vector z ^ = ( u ^ , v ^ , w ^ ) is identified ( w ^ is the vector of other criteria that the user can change by moving the sliders among the minimum and maximum values). The multicriteria optimization of the point chosen by the decision-maker is obtained as the solution of the following problem, where X is the set of feasible solutions of the original problem, the goal z ^ is the reference point ([33]), ε i represents small positive numbers, and m is the number of criteria considered. So, without loss of generality, we can define this problem as the following optimization problem:
minimize {   m a x i = 1 , , m ( z ^ i z i ) +   i = 1 m ε i ( z ^ i z i ) } s u b j e c t   t o :   z   = f ( x ) x     X
The expression i = 1 m ε i   ( z ^ i z i ) is important in this case to avoid weakly nondominated solutions [34]. The results (e.g., a strategic plan for forest management purposes) are shown in a CPLEX XML format or simply in a CSV flat file representing all basic variables of the last optimization interaction.
The next section describes which tools and computational architectures were developed in chronological order to program and display the IDMs with Pareto frontiers in the client.

2.2. Implementations

2.2.1. Standalone Implementation

Currently, most web browsers do not allow Java applets, and, for large linear programming problems (e.g., >1 GB of information), it is not computationally practical to run the problems in real time in any case. Instead, the standalone application Feasible Goals (FGoal) [21] can be run ahead of time to save the set of Pareto frontiers that have been optimized for a problem in order to be available when needed for decision-makers, stakeholders or other users. This standalone application, which evolved over the last few decades of the 20th century, has already proven very useful when there is limited access to the internet, or the optimization problem requires dealing with big linear programming files. The standalone application, in which users can develop and explore Pareto frontiers tradeoffs in real time or run and save a set of solutions ahead of time, to be shown later to decision-makers, has proven very useful for assisting with analysis and negotiation before decision-makers arrive at a consensus about which final solution will be chosen.

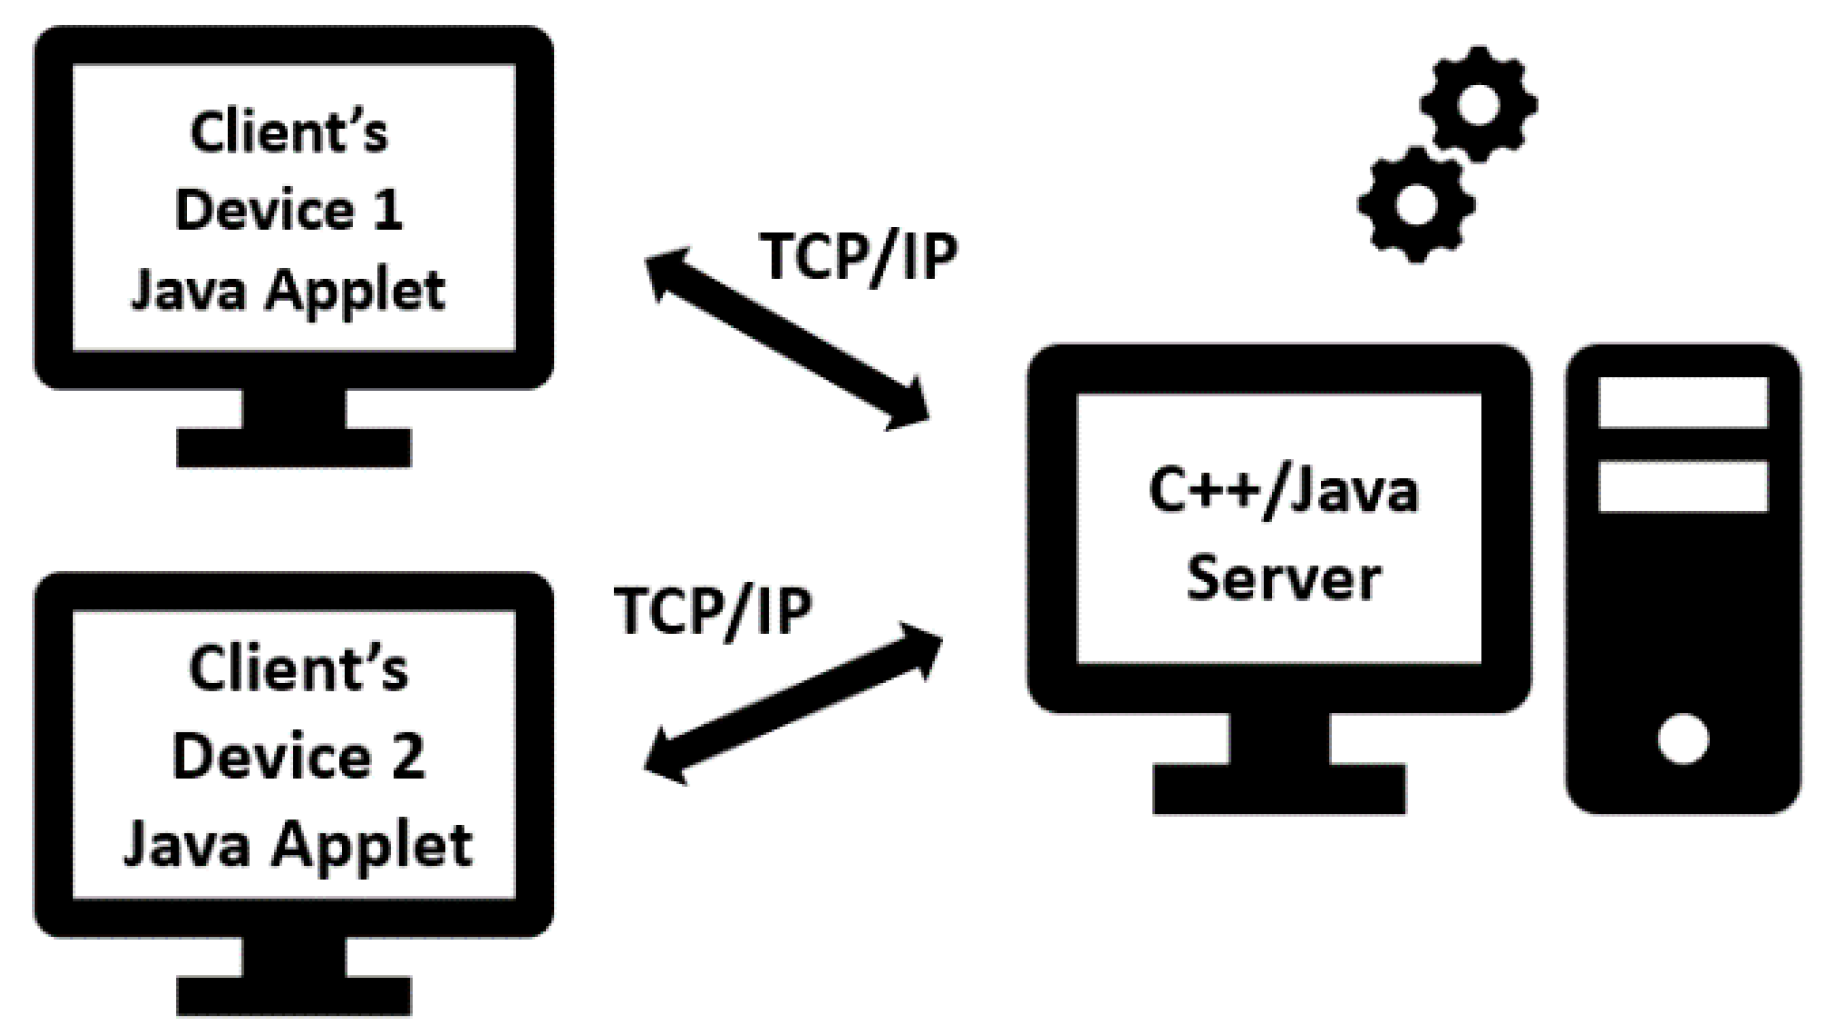
2.2.2. Java Applets Implementation

The first web-based implementation of Pareto frontiers was based on a client-server structure (Figure 2). The IDM technique separates the phase of approximation of the EPH from the phase of visualization. Thus, the server is used to approximate the EPH, and the Java applet is responsible for visualization of the Pareto frontiers. The server software was usually coded in C++ and Java, while Pareto frontiers were shown on client devices using XHTML and the Java Applet.

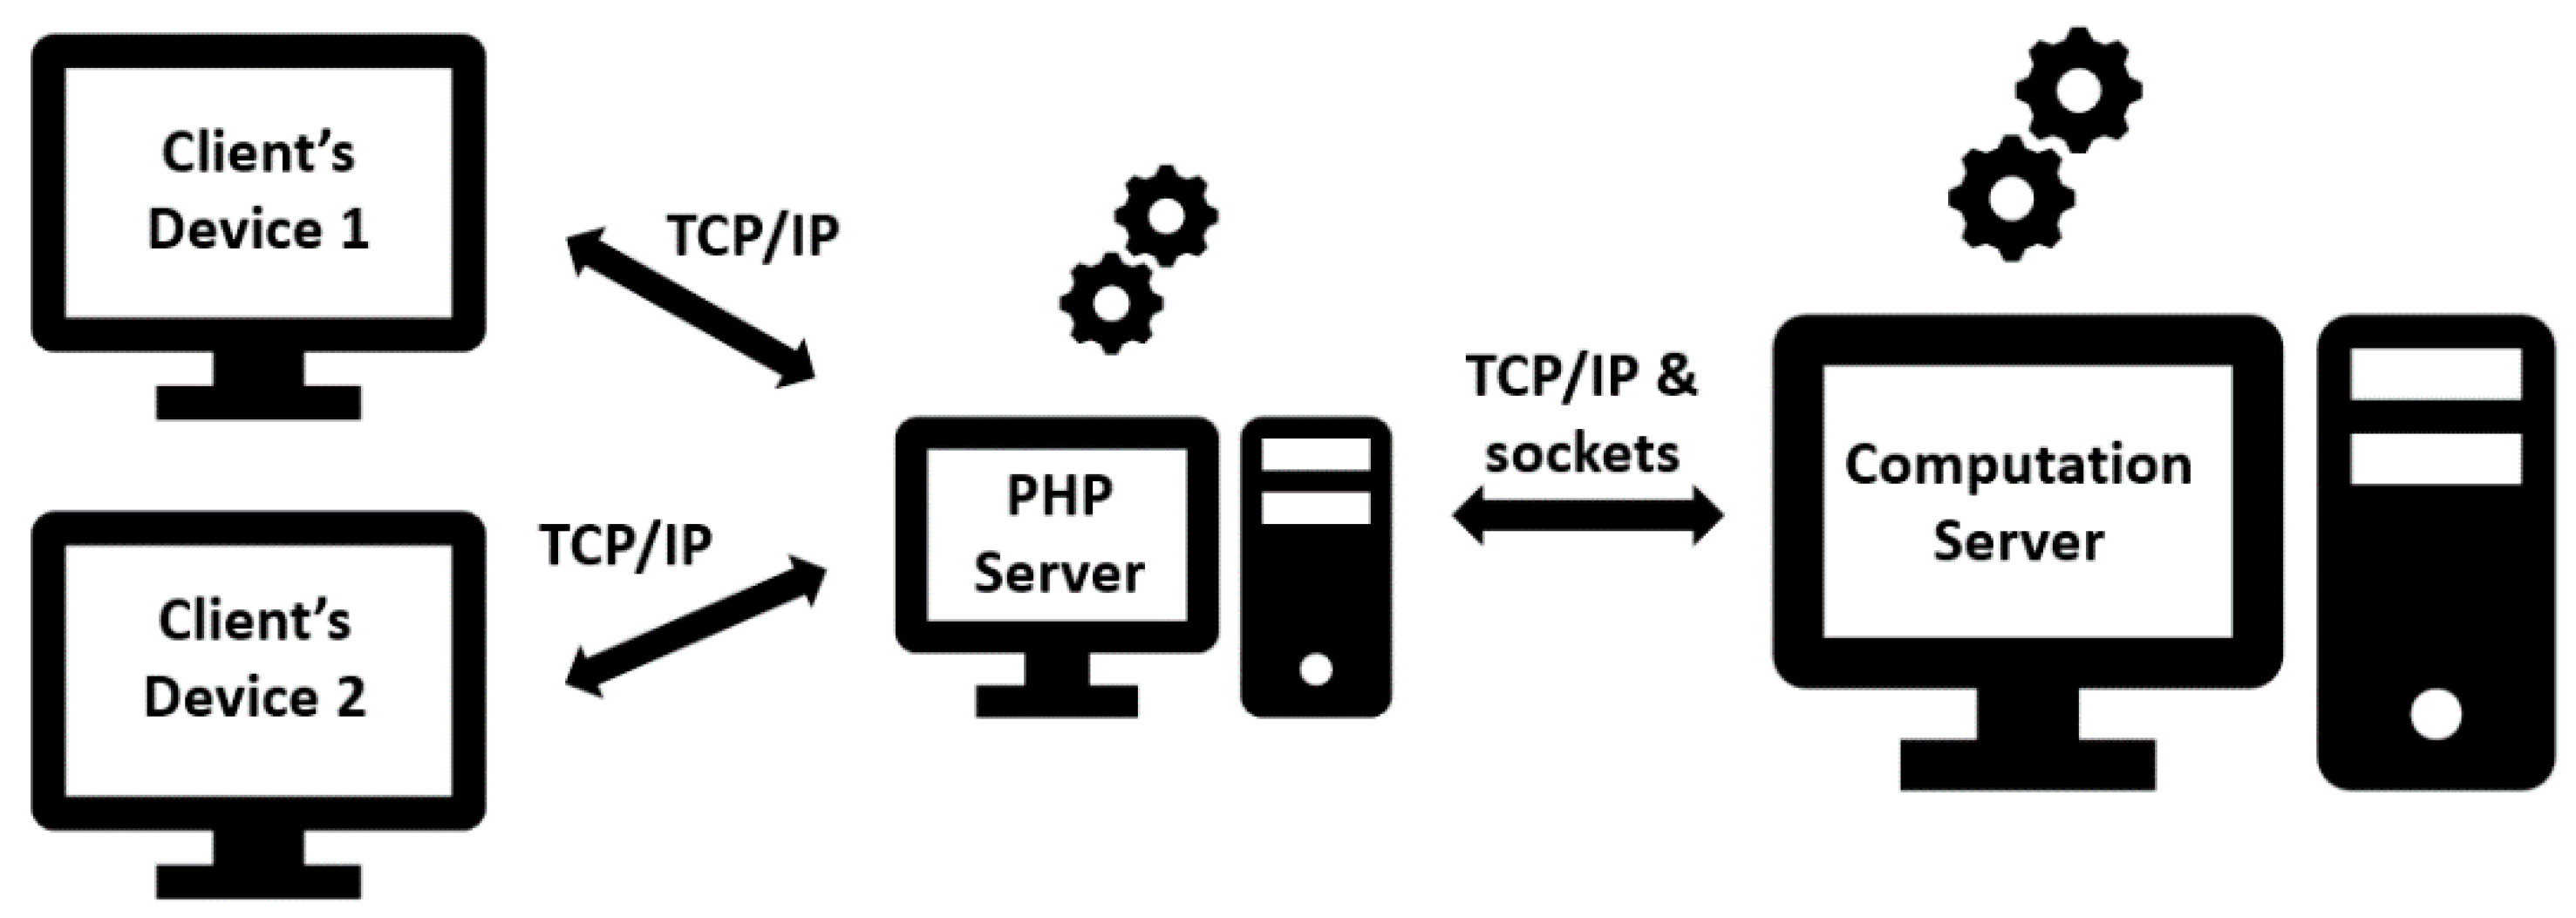
2.2.3. PHP Implementation
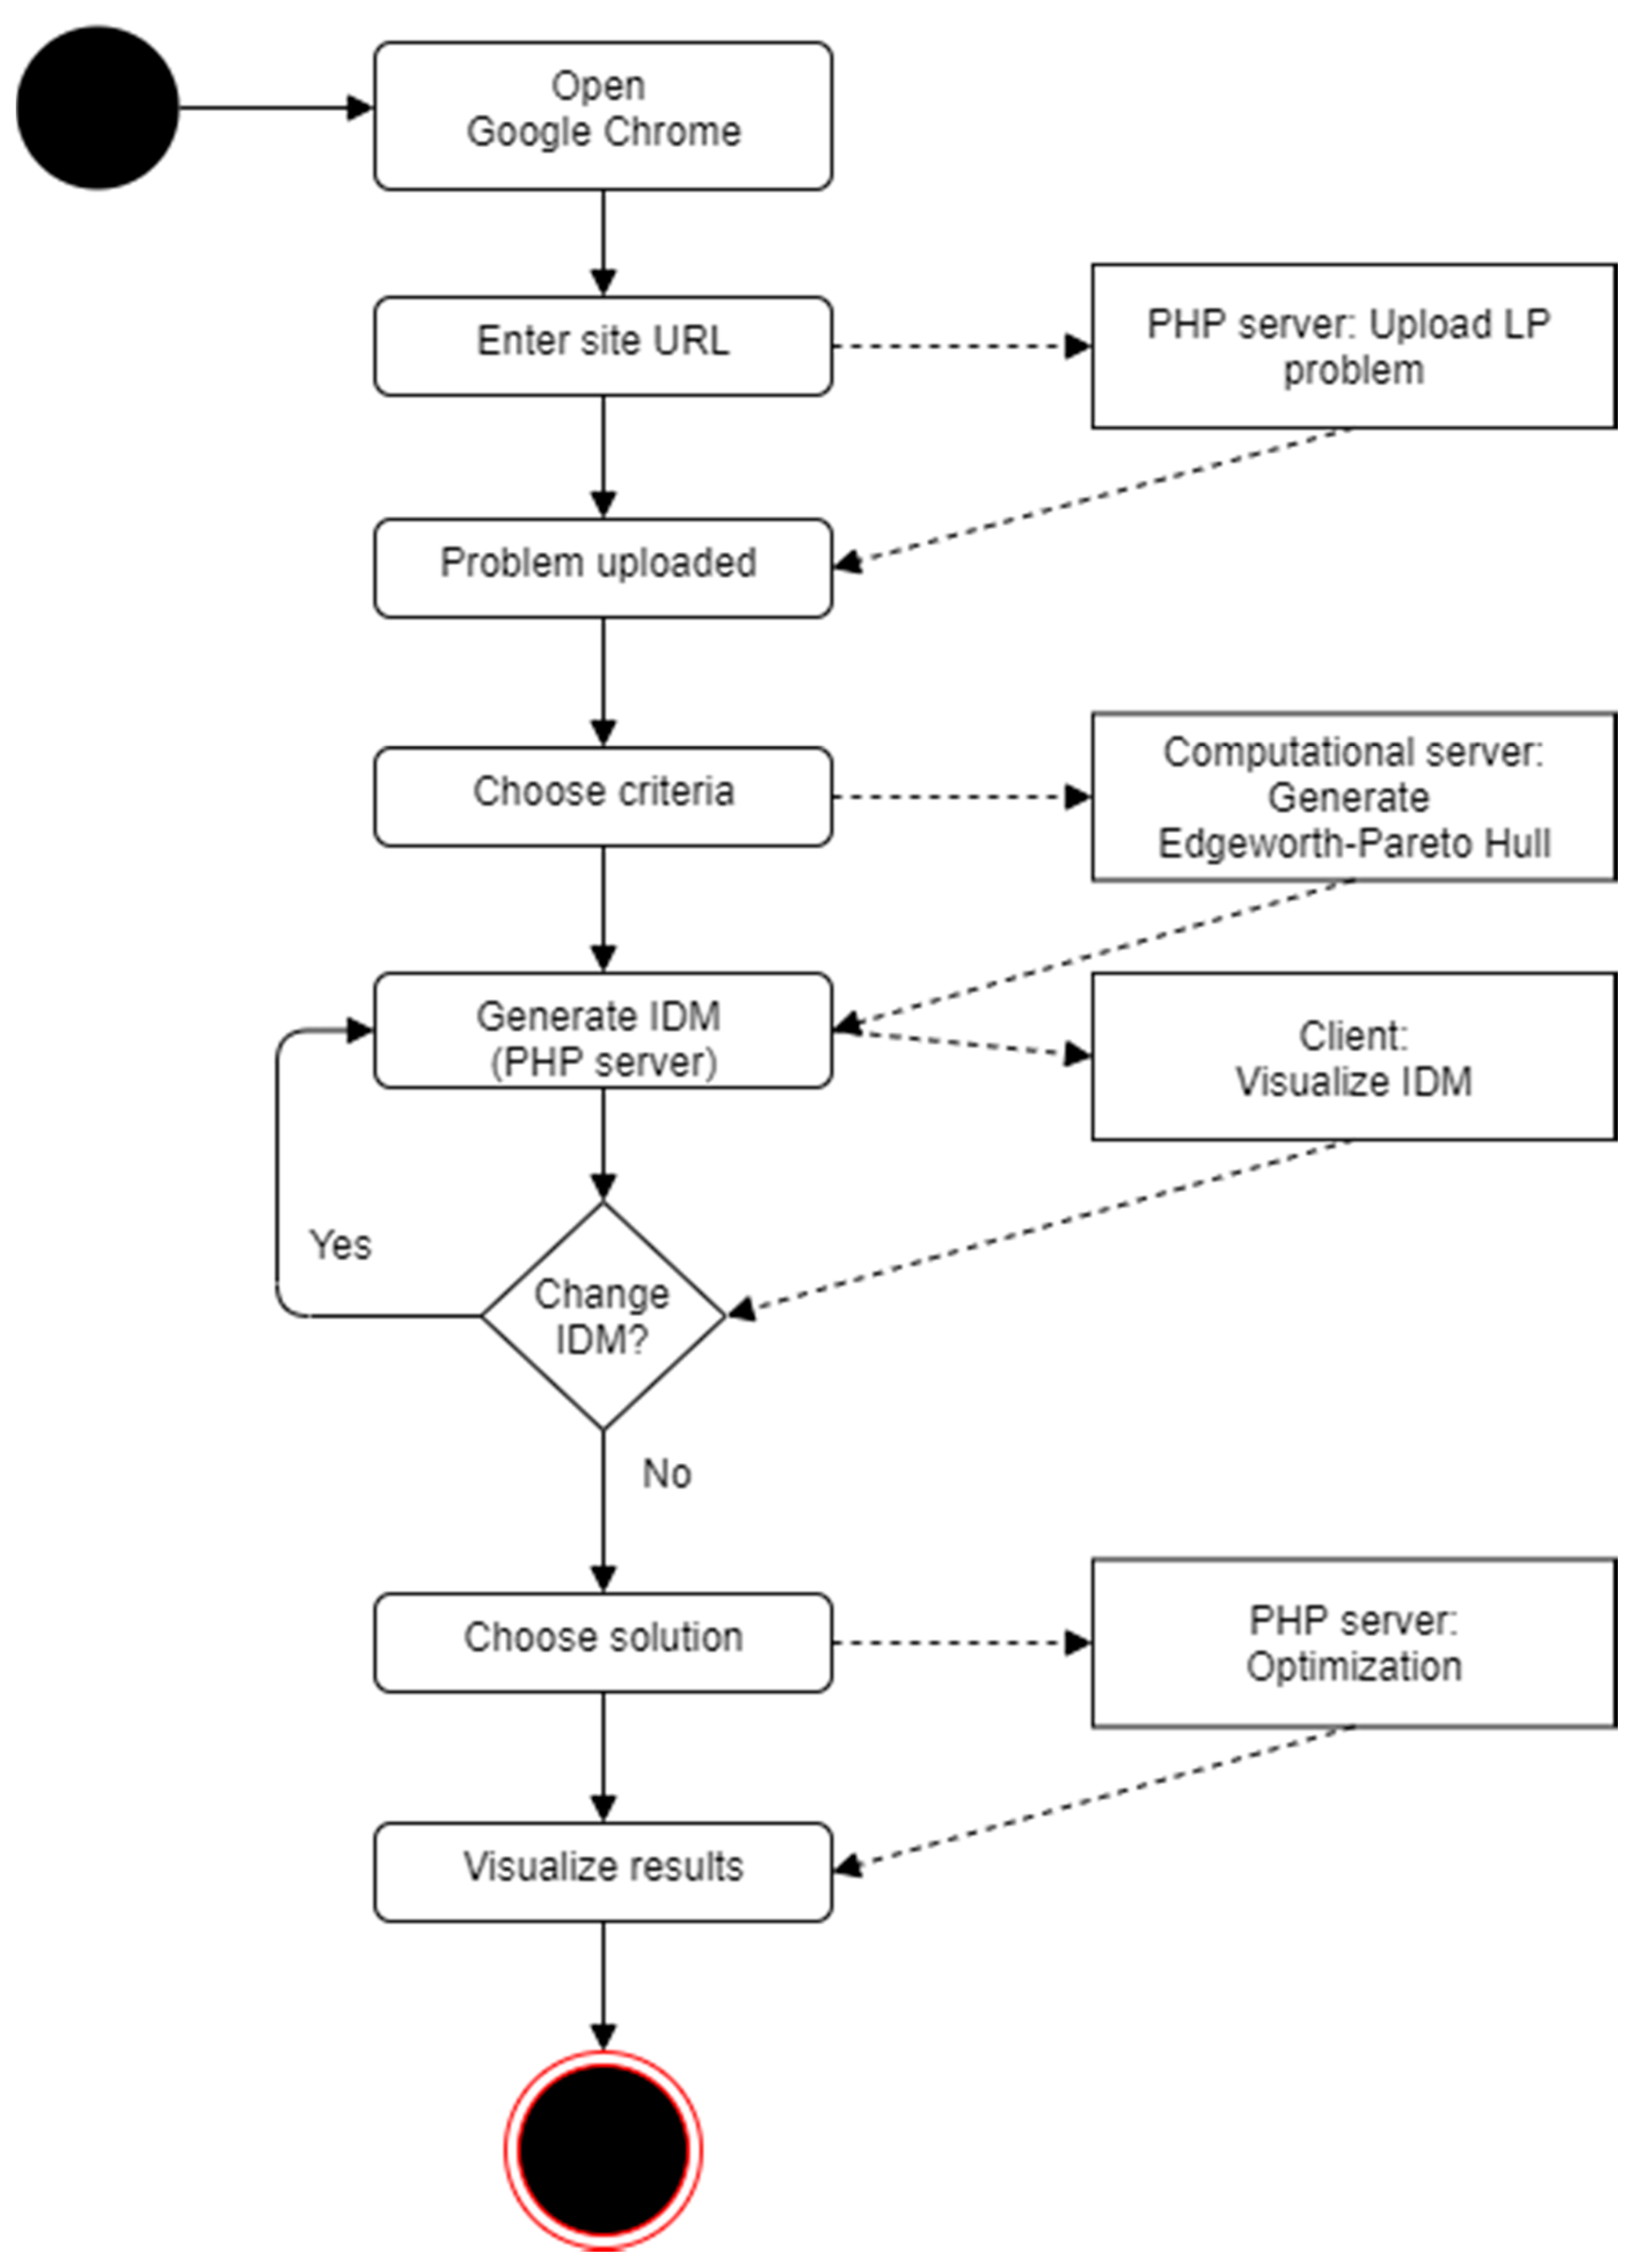
In this application, all the computational work required to generate all the vertices and constraints defining the EPH in each request from the client’s device is performed by the computational server with algorithms written in C++. Subsequently, the EPH is built using the PHP programming language (PHP version 5 and JavaScript version ECMAScript 2015) in the PHP server, and the results are finally displayed on the client side (Figure 3).
In this configuration (Figure 3), communication uses the Transmission Control Protocol (TCP), and only needs an internet protocol (IP) address and a port to make communication possible between the server and client. We defined a free port to communicate data between the two servers and a source address to permit the correct communication. In our case, the source address is our server PHP IP. Based on this source address, the socket is used to send and receive data from the computation server to generate the vertices and constraints of a mathematical programming problem, generating the EPH. This schema of communication is definitely convenient to acquire solutions and improve decision-making, because mathematical programming problems supporting forest management and planning typically need to be analyzed in real time by decision-makers.
The computational flow supported by our architecture (Figure 3) is best explained with a unified modeling language (UML) flowchart (Figure 4). The user starts the decision tool by entering, in the site, information in Google Chrome. The user uploads their formatted linear programming problem (problem.lp) that can be read with CPLEX, and which includes a table at the end of the flat file for identifying the criteria that will be used in the decision problem (initial wgui in PHP). The users choose the criteria to maximize or minimize the decision problem. They can impose some constraints for the minimum or maximum value for each criterion. After that, they submit the information provided and this starts the iterative process for generating the EPH. The algorithms used to generate the hull are described in Lotov et al. [20]. The convergence process stops when the discrepancy is less than 0.1 or the number of vertices in the hull is 64. This process runs in the computational server, which is communicating with the PHP server. A wgui was developed for the PHP server with the PHP and JavaScript languages, and with the available criteria and a progress bar to show the convergence. The PHP server reads the information provided by the computational server (vertices and constraints), sorts the vertices according to a Gift-Wrapping Algorithm [32], and makes all the calculations and configurations in order to show the IDMs in the client. When any changes in choices are made on the client side, the client communicates with the PHP server, the PHP server recreates the IDM and displays it on the client again (the Pareto hull is already generated). The wgui was developed with PHP and JavaScript. Finally, the users (on the client) choose one point in the IDM, and the optimization algorithm developed with PHP and CPLEX projects the solution to the closest point on the closest Pareto frontier using a Chebyshev distance. This is the final solution that can be stored in a CPLEX XML file or in a CSV file.

3. Results

In order to demonstrate our decision tool, we present an environmental decision problem that builds from the description by Lotov et al. (reference [20], pp. 32–34). It involves a region with a lake and a river that is used for intensive agricultural production. The water resources are used for irrigation and managers are concerned with the environmental impacts of the application of chemical fertilizers as well as with shortages of water in the lake. In our application, we considered the variables: totcrop (the sum of agriculture production in two zones of the region in percentage of the maximum), leveldrp (the level of the lake in percentage of the maximum), and lakepol (the additional water pollution in the lake in mg L−1).
After uploading the *.lp file in the predefined format, we chose which criteria to maximize, minimize, or ignore for the construction of the EPH. Data were entered in the wgui (Figure 5) to run the iterative process to generate our Edgeworth–Pareto hull. In this example, we chose to maximize totcrop, and minimize leveldrp and lakepol. A constraint was introduced in the criterion totcrop (totcrop 80%), and all other criteria were unconstrained. The generation of the EPH ran in a few seconds, and its approximation was built with an associated error of 0.09649937 (discrepancy = 0.09649937 < 0.1; discrepancy reflects the error associated with the representation error of the real Pareto hull in the iterative process). The EPH is represented by 11 facets (polytope’s features, line segments in 2D, triangles in 3D, etc.) and 15 tops (which are a generalization of slicing a reflexive polytope; a formal definition can be found in Bouchard and Skarke [35]). After the communication between the PHP server and the computation server, the EPH was defined and was ready to be represented in the IDMs as the known Pareto frontiers.
The result of our EPH computation has five colored slices and their Pareto frontiers (Figure 6). The five colors show the variation in the variable lakepol, with totcrop on the horizontal axis (limited by the constraint totcrop ≤ 80%), and leveldrp on the vertical axis. The configuration of the Pareto frontiers is easily changed by changing the criteria represented on the axes. The user can take a snapshot of the decision map (Figure 6), which is saved in a *.jpg file (hyperlink “Download as image”). After choosing a point on the IDM, the decision-maker can get the optimal solution according to his/her decision, as the corresponding point on the nearest Pareto frontier minimizing the Chebyshev distance ( L ), similar to goal programming methodology. The optimization result was saved online either in a CSV file or in an XML file and represents a strategic management plan for forest management.
Figure 7 presents an alternative view of the IDM (in Figure 6), in which the polygon has only one slice (and one color), and instead of having the range of colors to represent the criterion lakepol, it has an additional slider to select values of lakepol. Thus, as in Figure 6, the configuration of the IDM changes when the selected value of the lakepol criterion changes. As we were maximizing the first criterion (totcrop) and minimizing the other two criteria (leveldrp, lakepol), if we increased the value of lakepol, the area of the polygon would increase.

Forest Management Application

In this section, we provide a small example of an application in forest management. The reader is referred to [36] for a detailed description of the case study area. The tool was used to support a collaborative planning process involving several stakeholders and targeting the provision of several ecosystem services over a 90-year planning horizon. Indeed, a version of this application of our decision tool is included in wSADfLOR [36]. Figure 8 shows the wgui used for the user to choose the criteria and additional constraints they want to include, for example, maximum and minimum limits for each criterion. Given that input, the EPH is generated. The criteria considered were: total wood volume harvested and thinned for all forest species considered (TOTTIMBesc, measured in 106 m3); standing volume at the end of the planning horizon or volume of ending inventory (90 years), (Vol_Per9esc measured in 106 m3); the average carbon sequestration during the planning horizon (CTOTALesc, measured in Mg year−1); net present value (NPV, resulting from the silvicultural operations and value of cut wood in the planning horizon, measured in 108 EUR). Definitions of discrepancy, facets, and tops are the same as in the previous example.
The IDM representation and the tradeoffs between the criteria are shown in Figure 9. They can be analyzed using the Pareto frontiers, one for each different value of colored scale (CTOTALesc), considering a given value of NPV = 0.64 × 10⁸ EUR. In this example, if the user wants to analyze only a specific value of CTOTALesc, this is also an option as shown in Figure 10.

4. Discussion

There are various ways to show tradeoffs in multicriteria decision analysis. Moreover, the visualization of IDMs may be supported by programming languages other than PHP with XHTML, (e.g., JavaScript or C++, R, Python) [4,28]. Some authors analyze the tradeoffs by using an explicit tri-dimensional visualization and can only infer the outline of Pareto frontiers as the tool only shows the vertices of the nondominated solutions [4]. Moreover, in order to analyze the tradeoffs among more than three criteria, we need to use another kind of representation for the nondominated solutions. The decision maps generated by the decision tool described in reference [28] are limited to a maximum of three criteria. The decision space is represented by a triangle and the tradeoff analysis was performed by analyzing the topologic relations among vertices and edges that belong to the solutions, which are represented by polygons inside the triangle. Our general computational methodology builds from earlier approaches [18,19,20] to increase the efficiency of the generation of IDMs. This web-based approach has a limitation of five criteria, while the standalone approach can deal with seven criteria, but it is easily extensible to deal with more than five criteria.
The development and visualization of the Edgeworth–Pareto hull is not a simple task. Reference [4] used a different method to visualize its points in a tridimensional space, whereas in the present work, as in previous works developed at the Forest Research Centre of the School of Agriculture in collaboration with University of Évora, we have used IDMs. Our representation of Pareto frontiers shows several two-dimensional frontiers, each one delimiting a space with a different color, representing different values of a third criterion for the values on the x- and y-axes of the first and second criteria. Responses to additional criteria can be represented by varying sliders at the bottom of the IDMs. Currently, the decision tool presented in this study can handle variations in up to five criteria and is an interesting approach to visualize multiple color Pareto frontiers that makes it easier for decision-makers to select a point on the frontier. Further work on visualization and analysis with web-based IDMs is continuing to make the tool presented here more user friendly for decision-makers.
The current work demonstrates a new architecture for computing the Edgeworth–Pareto hull, based on sockets communication between the PHP server and the computation server (Figure 1). This architecture is very convenient, because, in this case, we have a powerful server dedicated to the computational effort of this task, thus making it possible to represent Pareto frontiers in a few seconds on the client device. Furthermore, the client can change the IDM built by the PHP server to be shown in the client device in a few seconds as well. Decision-makers, who want to make decisions and identify new feasible solutions in a short time, can benefit from this tool. Due to the fast processing time to display the IDMs, the decision-maker can run the tool in various tabs in the same Google Chrome session, and compare the different solutions and strategic plans resulting from these solutions. In terms of decision analysis, this is a positive point.
This web-based tool was built to run on the Google Chrome browser. Although we have partially tested it in Microsoft’s Edge and in Apple’s Safari with good performance results, it has not been fully tested, and some wguis may not respond as expected or may respond with some limitations. Thus, additional effort is needed to develop this tool, making it more responsive for other web browsers. A very similar tool has been integrated into the wSADfLOR forest and natural resources decision support system [36], and the latter has already been tested using an encapsulated standalone C++ package to generate the EPH. Akin to wSADfLOR, there are other works that have used encapsulated Pareto frontier tools as packages in C++ or Java, or Pareto frontiers developed with other architectures and methodologies, web-based or not. Other applications include those by references [4,7,8,21,22,23]. The present work is a result of experience gained in previous projects developed at the Forest Research Centre of School of Agriculture in collaboration with the Mathematics Department of the University of Evora, on developing and analyzing Pareto frontiers.
Our web-based decision tool is freeware and based on PHP web programming that continues to evolve with the evolution of web browsers, and the feedback of decision-makers and researchers. A very similar version, but without sockets, is already successfully implemented in wSADfLOR, but this current decision tool can easily be integrated into other decision support systems. Its architecture makes it easier to interact with IDMs from other places around the world with internet access. It has essentially been developed to serve the needs of analysis and planning for forest and natural resources management, but it can be useful in other fields as well. Reference [20] presents some examples of successful applications to environmental problems, real estate, and automobile businesses, but the method of building Pareto frontiers with the present architecture can easily be applied to any decision problem that can be formulated as a mathematical programming problem. It only needs a *.lp flat file, ready to be compiled by CPLEX or GLPK, and with the additional ScreenVariables block at the end of the file.
Finally, another important aspect to take into account is the user friendliness of the tool and helping decision-makers to be comfortable with their decisions. In these respects, decision-makers not only need good decisions, but transparent decisions [11]. This aspect of transparency in decision processes continues to drive the design of decision tools and decision support systems in business and science.

5. Conclusions

The architecture that we describe in this work makes it possible to deal with very high dimensional mathematical programming problems (e.g., numerous variables and constraints), because all computational effort needed for construction of the Edgeworth–Pareto hull is performed by a dedicated server. On one hand, this architecture supports faster responses to the client, and consequently faster visualizations of the requests for changes by the client, with close-to-real-time responses. On the other hand, some problems were previously impossible to solve in reasonable times because of their complexity, but, with the proposed architecture, now the tradeoffs of Pareto frontiers can be shown and updated in almost real time even in the worst cases. This improved capacity enables a faster decision process and permits the use of the decision tool in any geographic location with internet access and at any time, with few or no limitations. The mathematical programming problem needs to conform to a predefined format in order to be well interpreted by the web Pareto frontier decision tool. This format is very similar to the traditional CPLEX or GLPK format, with a few more lines of code at the end of the file for the wgui to easily identify the criteria to be used in the optimization process.
Finally, while the decision support tool presented here represents a significant advance in evaluating tradeoffs on Pareto frontiers for high-dimensional decision problems posed by contemporary forest management, and the architecture described makes it quite feasible to handle such problems in real time in collaborative settings such as workshops, there are also additional opportunities to enhance the system with additional features to improve the quality and effectiveness of forest management decision-making, namely by extending it to address more than five criteria.

Author Contributions

Conceptualization, M.M. and V.A.B.; methodology, M.M., V.A.B. and K.M.R.; software, M.M. and V.A.B.; validation, M.M., V.A.B. and K.M.R.; formal analysis, M.M. and V.A.B.; investigation, M.M. and V.A.B.; resources, M.M.; writing—original draft preparation, M.M.; writing—review and editing, K.M.R., M.M., J.G.B. and S.M.; visualization, M.M.; supervision, V.A.B., K.M.R., J.G.B. and S.M.; project administration, V.A.B., J.G.B. and S.M.; funding acquisition, J.G.B. and S.M. All authors have read and agreed to the published version of the manuscript.

Funding

This research has received funding from the Marie Skodowska-Curie Research and Innovation Staff Exchange (RISE) within the H2020 Work Programme (H2020-MSCA-RISE-2015), through the project Models and decision Support tools for integrated Forest policy development under global change and associated Risk and Uncertainty (SUFORUN), which specifically funded the collaboration of the authors, by the Forest Research Centre, a research unit funded by Fundação para a Ciência e a Tecnologia I.P. (FCT), Portugal (UIDB/00239/2020), by the project LISBOA-01-0145-FEDER-030391 with the title “Forest ecosystem management decision-making methods—an integrated bio-economic approach to sustainability” (BIOECOSYS), project PCIF/MOS/0217/2017 with the title MODFIRE—A multiple criteria approach to integrate wildfire behavior in forest management planning, by the project INCCA–POCI-01-0145-FEDER-030842 with the title “Integrated Coastal Climate Change Adaptation for Resilient Communities” (INCCA), by project UID/MAT/04674/2019 and by the FCT’s Ph.D. grant of Marco Marto SFRH/BD/108225/2015.

Acknowledgments

The authors would like to thank the Portuguese Science Foundation for fund.

Conflicts of Interest

The authors declare no conflict of interest.

Disclaimer

Responsibility for the information and views set out in this article/publication lies entirely with the authors. The use of trade or firm names in this publication is for reader information and does not imply endorsement by the U.S. Department of Agriculture of any product or service.

References

  1. Kitano, H. Computational systems biology. Nature 2002, 420, 206. [Google Scholar] [CrossRef]
  2. Reynolds, K.M.; Twery, M.; Lexer, M.J.; Vacik, H.; Ray, G.; Shao, D.; Borges, J.G. Decision support systems in natural resource management. In Handbook on Decision Support Systems; International Handbooks on Information Systems Series; Handbook on Decision Support System 2; Burstein, F., Holsapple, C., Eds.; Springer: Berlin/Heidelberg, Germany, 2008; pp. 499–534. [Google Scholar] [CrossRef]
  3. Borges, J.G.; Nordström, E.M.; Garcia-Gonzalo, J.; Hujala, T.; Trasobares, A. (Eds.) Computer-Based Tools for Supporting Forest Management. In The Experience and the Expertise World-Wide; Deptartment of Forest Resource Management; Swedish University of Agricultural Sciences: Umeå, Sweden, 2014; 503p. [Google Scholar]
  4. Tóth, S.F.; Ettl, G.J.; Rabotyagov, S.S. ECOSEL: An auction mechanism for forest ecosystem services. Math. Comput. Nat. Resour. Sci. 2010, 2, 99–116. [Google Scholar]
  5. Marques, A.F.; Borges, J.G.; Sousa, P.; Pinho, A.M. An enterprise architecture approach to forest management support systems design: An application to pulpwood supply management in Portugal. Eur. J. For. Res. 2011, 130, 935–948. [Google Scholar] [CrossRef]
  6. Marques, A.F.; Fricko, A.; Kangas, A.; Rosset, C.; Ferreti, F.; Rasinmaki, J.; Packalen, T.; Gordon, S. Empirical guidelines for forest management decision support systems based on the past experiences of the expert’s community. For. Syst. 2013, 22, 320–339. [Google Scholar] [CrossRef] [Green Version]
  7. Borges, J.G.; Garcia-Gonzalo, J.; Bushenkov, V.; McDill, M.E.; Marques, S.; Oliveira, M.M. Addressing multicriteria forest management with Pareto frontier methods: An application in Portugal. For. Sci. 2014, 60, 63–72. [Google Scholar] [CrossRef] [Green Version]
  8. Borges, J.G.; Marques, S.; Garcia-Gonzalo, J.; Rahman, A.U.; Bushenkov, V.; Sottomayor, M.; Carvalho, P.O.; Nordström, E.M. A multiple criteria approach for negotiating ecosystem services supply targets and forest owners’ programs. For. Sci. 2017, 63, 49–61. [Google Scholar] [CrossRef]
  9. Sheppard, S.R.; Meitner, M. Using multi-criteria analysis and visualisation for sustainable forest management planning with stakeholder groups. For. Ecol. Manag. 2005, 207, 171–187. [Google Scholar] [CrossRef]
  10. Chichernea, V.; Pop, D.P. Web operations management: A web-based decision support systems for concret transportation in industrial are of the smart city. J. Inf. Syst. Oper. Manag. 2014, 8, 48–60. [Google Scholar]
  11. Reynolds, K.M.; Hessburg, P.F.; Bourgeron, P.S. Making Transparent Environmental Management Decisions; Springer: Berlin/Heidelberg, Germany, 2014. [Google Scholar] [CrossRef]
  12. Nute, D.; Potter, W.D.; Maier, F.; Wang, J.; Twery, M.; Rauscher, H.M.; Knopp, P.; Thomasma, S.; Dass, M.; Uchiyama, H.; et al. NED-2: An agent-based decision support system for forest ecosystem management. Environ. Model. Softw. 2004, 19, 831–843. [Google Scholar] [CrossRef]
  13. Baskent, E.Z.; Başkaya, Ş.; Terzioğlu, S. Developing and implementing participatory and ecosystem based multiple use forest management planning approach (ETÇAP): Yalnızçam case study. For. Ecol. Manag. 2008, 256, 798–807. [Google Scholar] [CrossRef]
  14. Küçüker, D.M.; Baskent, E.Z. Sustaining the Joint Production of Timber and Lactarius Mushroom: A Case Study of a Forest Management Planning Unit in Northwestern Turkey. Sustainability 2017, 9, 92. [Google Scholar] [CrossRef] [Green Version]
  15. Seely, B.; Nelson, J.; Wells, R.; Peter, B.; Meitner, M.; Anderson, A.; Harshaw, H.; Sheppard, S.; Bunnell, F.L.; Kimmins, H.; et al. The application of a hierarchical, decision-support system to evaluate multi-objective forest management strategies: A case study in northeastern British Columbia, Canada. For. Ecol. Manag. 2004, 199, 283–305. [Google Scholar] [CrossRef]
  16. Damme, L.V.; Russell, J.S.; Doyon, F.; Duinker, P.N.; Gooding, T.; Hirsch, K.; Rothwell, R.; Rudy, A. The development and application of a decision support system for sustainable forest management on the Boreal Plain. J. Environ. Eng. Sci. 2003, 2, S23–S34. [Google Scholar] [CrossRef]
  17. Ouhimmou, M.; Haddad, S.; Boukherroub, T. Decision support system for selection of harvest areas and wood allocation to mills. IFAC-PapersOnLine 2015, 48, 628–633. [Google Scholar] [CrossRef]
  18. Efremov, R.; Insua, D.R.; Lotov, A. A framework for participatory decision support using Pareto frontier visualization, goal identification and arbitration. Eur. J. Oper. Res. 2009, 199, 459–467. [Google Scholar] [CrossRef]
  19. Dietrich, J.; Schumann, A.H.; Lotov, A.V. Workflow oriented participatory decision support for integrated river basin planning. In Topics on System Analysis and Integrated Water Resources Management; Castelletti, A., Sessa, R.S., Eds.; Elsevier: Amsterdam, The Netherlands, 2006; pp. 207–221. [Google Scholar]
  20. Lotov, A.V.; Bushenkov, V.A.; Kamenev, G.K. Interactive Decision Maps: Approximation and Visualization of Pareto Frontier; Springer Science & Business Media: Berlin/Heidelberg, Germany, 2013; Volume 89. [Google Scholar]
  21. Garcia-Gonzalo, J.; Bushenkov, V.; McDill, M.; Borges, J. A decision support system for assessing trade-offs between ecosystem management goals: An application in Portugal. Forests 2015, 6, 65–87. [Google Scholar] [CrossRef] [Green Version]
  22. Marques, S.; Marto, M.; Bushenkov, V.; McDill, M.; Borges, J. Addressing Wildfire Risk in Forest Management Planning with Multiple Criteria Decision Making Methods. Sustainability 2017, 9, 298. [Google Scholar] [CrossRef] [Green Version]
  23. Marto, M.; Reynolds, K.M.; Borges, J.G.; Bushenkov, V.A.; Marques, S. Combining decision support approaches for optimizing the selection of bundles of ecosystem services. Forests 2018, 9, 438. [Google Scholar] [CrossRef] [Green Version]
  24. Bittinger, R.R.; Fraenkel, M.L.; Housel, B.C., III; Lindquist, D.B. Client/Server Communication System. U.S. Patent 5,754,774, 19 May 1998. [Google Scholar]
  25. Climaco, J.N.; Antunes, C.H.; Alves, M.J.G. Programação Linear Multiobjectivo: Do Modelo de Programação Linear Clássico à Consideração Explícita de Várias Funções Objective; Imprensa da Universidade de Coimbra/Coimbra University Press: Coimbra, Portugal, 2003; p. 393. [Google Scholar]
  26. Goicoechea, A.; Hansen, D.R.; Duckstein, L. Multiobjective decision analysis with engineering and business applications. J. Oper. Res. Soc. 1982, 34, 449–450. [Google Scholar]
  27. Steuer, R.E. Multiple Criteria Optimization: Theory, Computation, and Application; Wiley: New York, NY, USA, 1986. [Google Scholar]
  28. Climaco, J.C.N.; Antunes, C.H. Implementation of a user-friendly softwa-re package—A guided tour of TRIMAP. In Models and Methods in Multiple Criteria Decision Making; Elsevier: Amsterdam, The Netherlands, 1989; pp. 1299–1309. [Google Scholar] [CrossRef]
  29. Gass, S.; Saaty, T. The computational algorithm for the parametric objective function. Nav. Res. Logist. Q. 1995, 2, 39–45. [Google Scholar] [CrossRef]
  30. Zeleny, M. Linear Multiobjective Programming; Springer Science & Business Media: Berlin/Heidelberg, Germany, 2012; Volume 95. [Google Scholar] [CrossRef]
  31. Deterding, S.; Dixon, D.; Khaled, R.; Nacke, L. From game design elements to gamefulness: Defining gamification. In Proceedings of the 15th International Academic MindTrek Conference: Envisioning Future Media Environments, Tampere, Finland, 28–30 September 2011; pp. 9–15. [Google Scholar] [CrossRef]
  32. Preparata, F.P.; Hong, S.J. Convex hulls of finite sets of points in two and three dimensions. Commun. ACM 1977, 20, 87–93. [Google Scholar] [CrossRef]
  33. Wierzbicki, A.P. A Mathematical Basis for Satisficing Decision Making. In Organizations: Multiple Agents with Multiple Criteria; Lecture Notes in Economics and Mathematical Systems; Morse, J.N., Ed.; Springer: Berlin/Heidelberg, Germany, 1981. [Google Scholar] [CrossRef] [Green Version]
  34. Lewandowski, A.; Grauer, M. The Reference Point Optimization Approach—Methods of Efficient Implementation, WP-82-019; International Institute for Applied Systems Analysis: Laxenburg, Austria, 1982. [Google Scholar]
  35. Bouchard, V.; Skarke, H. Affine Kac-Moody algebras, CHL strings and the classification of tops. Adv. Theor. Math. Phys. 2003, 7, 205–232. Available online: https://arxiv.org/abs/hep-th/0303218 (accessed on 24 December 2020). [CrossRef] [Green Version]
  36. Marto, M.; Reynolds, K.M.; Borges, J.G.; Bushenkov, V.A.; Marques, S.; Marques, M.; Barreiro, S.; Botequim, B.; Tomé, M. Web-Based Forest Resources Management Decision Support System. Forests 2019, 10, 1079. [Google Scholar] [CrossRef] [Green Version]
Figure 1. Generation of Pareto frontiers from the Pareto hull. (a) Initial convex hull of feasible solutions ( x i , x j ). (b) Edgeworth–Pareto hull in the criteria decision space ( z i , z j ). (c) Set of efficient solutions in the criteria decision space ( z i , z j ). (d) Extension to the Pareto frontier for the efficient solutions set considering two criteria ( z i , z j ) in order to simplify the representation. (e) Pareto frontiers representation considering three criteria ( z i , z j ,   z k ).
Information 12 00009 g001aInformation 12 00009 g001b
Figure 2. Communication client-server based on a Java Applet to show Pareto frontiers.
Information 12 00009 g002
Figure 3. Communication between client’s device, PHP server and computation server.
Information 12 00009 g003
Figure 4. Decision tool’s flowchart.
Information 12 00009 g004
Figure 5. Web graphical user interface (wgui) to choose the criteria to maximize or minimize, define any constraints on the criteria space (in this case totcrop ≤ 80%) and generate the Edgeworth–Pareto hull. This wgui shows the discrepancy between the convergence process and the real hull, the number of facets of the hull and the number of tops of the hull.
Information 12 00009 g005
Figure 6. Representation of Pareto frontiers for the criteria totcrop (horizontal axis; in %), leveldrp (vertical axis; in %), and lakepol (represented by slices; in mg L−1).
Information 12 00009 g006
Figure 7. Representation of Pareto frontier with only one frontier (one color) with tradeoffs between totcrop (in %) and leveldrp (in mg L−1) and the lakepol (in %) defined by the movement of the slider.
Information 12 00009 g007
Figure 8. Wgui for choosing the criteria to be used in the construction of the Pareto hull.
Information 12 00009 g008
Figure 9. Interactive decision map showing the tradeoff between four criteria: volume of ending inventory (106 m3; Vol_Per9esc) in the y-axis; total wood (106 m3; TOTTIMBesc) in the x-axis; the average carbon sequestered (Mg year−1; CTOTALesc) in the colored scale and the chosen level of net present value level (108 EUR; NPV) in the slider (0.64 × 10⁸ EUR).
Information 12 00009 g009
Figure 10. Interactive decision map showing the tradeoff between four criteria: volume of ending inventory (106 m3; Vol_Per9esc) in the y-axis; total wood (106 m3; TOTTIMBesc) in the x-axis; the chosen level of average carbon sequestered (Mg year−1; CTOTALesc) in the first slider (4.17 Mg year−1) and the chosen level of net present value level (108 EUR; NPV) in the second slider (0.64 × 10⁸ EUR).
Information 12 00009 g010
Publisher’s Note: MDPI stays neutral with regard to jurisdictional claims in published maps and institutional affiliations.

