Article

Cyclists’ Crossing Intentions When Interacting with Automated Vehicles: A Virtual Reality Study

Transport and Planning, Faculty of Civil Engineering and Geosciences, Delft University of Technology, Stevinweg 1, 2628 CN Delft, South Holland, The Netherlands
*
Author to whom correspondence should be addressed.
Information 2021, 12(1), 7; https://doi.org/10.3390/info12010007
Submission received: 20 November 2020 / Revised: 18 December 2020 / Accepted: 22 December 2020 / Published: 24 December 2020

Abstract

:
Most of cyclists’ fatalities originate from collisions with motorized vehicles. It is expected that automated vehicles (AV) will be safer than human-driven vehicles, but this depends on the nature of interactions between non-automated road users, among them cyclists. Little research on the interactions between cyclists and AVs exists. This study aims to determine the main factors influencing cyclists’ crossing intentions when interacting with an automated vehicle as compared to a conventional vehicle (CV) using a 360° video-based virtual reality (VR) method. The considered factors in this study included vehicle type, gap size between cyclist and vehicle, vehicle speed, and right of way. Each factor had two levels. In addition, cyclist’s self-reported behavior and trust in automated vehicles were also measured. Forty-seven participants experienced 16 different crossing scenarios in a repeated measures study using VR. These scenarios are the result of combinations of the studied factors at different levels. In total, the experiment lasted 60 min. The results show that the gap size and the right of way were the primary factors affecting the crossing intentions of the individuals. The vehicle type and vehicle speed did not have a significant effect on the crossing intentions. Finally, the 360° video-based VR method scored relatively high as a research method and comparable with the results of a previous study investigating pedestrians’ crossing intentions confirming its suitability as a research methodology to study cyclists’ crossing intentions.

1. Introduction

The majority of cyclists’ fatalities originate from collisions with motorized vehicles in the Netherlands [1]. As the share of cyclists is increasing, and not only in the Netherlands [2], it is of importance to understand how they behave and will behave when interacting with new types of motorized vehicles, such as automated vehicles. The effects of automated vehicles (AVs), possibly with a new driving style, might lead other road users to change or adapt their behavior. To successfully implement AVs in urban settings, AVs need to be able to understand the intent of cyclists. Therefore, computer algorithms are being developed that can predict intention of cyclists based on hand signaling [3]. AVs need to detect and recognize other road users, automated or non-automated, to interact safely with them. Multiple studies have been performed from the point of view of AVs regarding their ability to recognize other road users [4,5]. Also, smart infrastructure is proposed to create a safer environment in which cyclists can interact with AVs. The AVs could send information to an upcoming intersection and the intersection could then adapt to create an environment that fits the upcoming interaction [6]. However, there is less emphasis on how these AVs will interact and communicate with other road users, such as manually driven cars, pedestrians, and cyclists [7,8], and how these other road users will interact with AVs. Non-automated road users need to adapt to a changing road traffic system and to a new type of vehicles [9]. An important factor is the non-verbal communication between driver and other road users, such as eye-contact or a hand gesture [10,11]. However, such communication may not be available in the same way or would even be impossible when there is no driver present in the AV. How this would affect the interaction between cyclists and AVs is still unclear and has until recently been overlooked in the literature.
Microscopic simulations of interactions between AVs and cyclists show that a decrease in conflicts between AVs and cyclists can be expected. This is assuming a penetration rate of 100% of AVs. Furthermore, the severity of conflicts is also expected to decrease. However, before reaching a 100% penetration rate the safety of cyclists should be considered when interacting with AVs [12]. However, before reaching a 100% penetration rate AVs need to be able to perform in a mixed environment. Initial video analysis of footage recorded during the CityMobil2 demonstrations shows how cyclist adapt to AVs. Where possible cyclists avoided getting too close to AVs. However, when it was not possible to keep distance, cyclists stayed close to AVs instead of waiting for the AV to pass. This could be seen as a risky behavior [13]. In line with these results, Bjørnskau et al. [14] found that cyclists adapted their behavior. Over time, cyclists gave the right of way less to AV shuttles and overtook the shuttles more.
Hagenzieker et al. [7] performed a small-scale photo study to investigate whether there is a difference in the expectations and behavioral intentions of cyclists when interacting with an AV at an intersection as compared to a contemporary vehicle (CV) using signs stating that the vehicle was automated mounted on several places. Overall, the researchers found that the way the vehicles are perceived depended on the scenario. Given the fact that AVs are expected to be safer, it is surprising that no clear preference for the AVs over the CV was found. The authors explain that the balanced results for AVs and CVs indicate that the participants have a conservative and cautious disposition toward AVs.
In contrast with previous findings, a small preference was found in favor of AVs in a follow-up study building on Hagenzieker’s and colleagues [7] design [15]. AVs were perceived as more likely to stop for the cyclist. When interacting with AVs, participants stated that they felt more likely to be noted and were more confident that the car would stop for them compared to the CV. Furthermore, the results of the administered trust in self-driving technology questionnaire were compared to the answers on the scenarios. The findings show that participants with more trust in AVs reported to be more noticed by the AVs, that AVs would stop for them, and decided to continue cycling more often than participants with less trust.
Finally, another study on cyclists crossing intentions was performed using animated videos [16]. The videos were made from the perspective of the cyclists and contained three types of vehicles: automated, automated, and disclosing its intentions, and a CV. Furthermore, five situations were presented with the use of the videos. The researchers report that cyclists yielded more often when the vehicle was automated and less often when the vehicle was automated and also displayed its intention, as compared to the CV. In contrast to the previous two studies, the cyclist yielded more for both types of automated vehicles if they received the negatively framed information about AVs. The researchers explain that the effect of an instruction video may be more effective in affecting the participants than written instructions. In addition, a negative correlation was found between yielding and trust in AVs. So, when participants experienced low trust in AVs they yielded more. All in all, most of the results of this study are in line with the previous two. Cyclists act carefully when interacting with AVs. Also, trust seems to be an important factor that can affect cyclists’ decisions.
The present study aims at gaining insights into the crossing intentions of cyclists while interacting with AVs as compared to CVs. Our main research question was the following: How does the physical appearance of a vehicle affect the crossing intentions of cyclists? We also investigated how the vehicles’ motion cues intentions and how the existing priority regulations affected cyclists’ crossing intentions. In contrast to the presented studies, this study made use of 360° video-based virtual reality (VR) to provide control over the interaction. Psychological factors such as trust in AVs and perceived risk and perceived behavioral control were studied to provide insights into how these factors are affected by AVs. Vehicle factors-vehicle speed and gap size were also included. Furthermore, the right of way was included in our studies.

2. Research Methodology
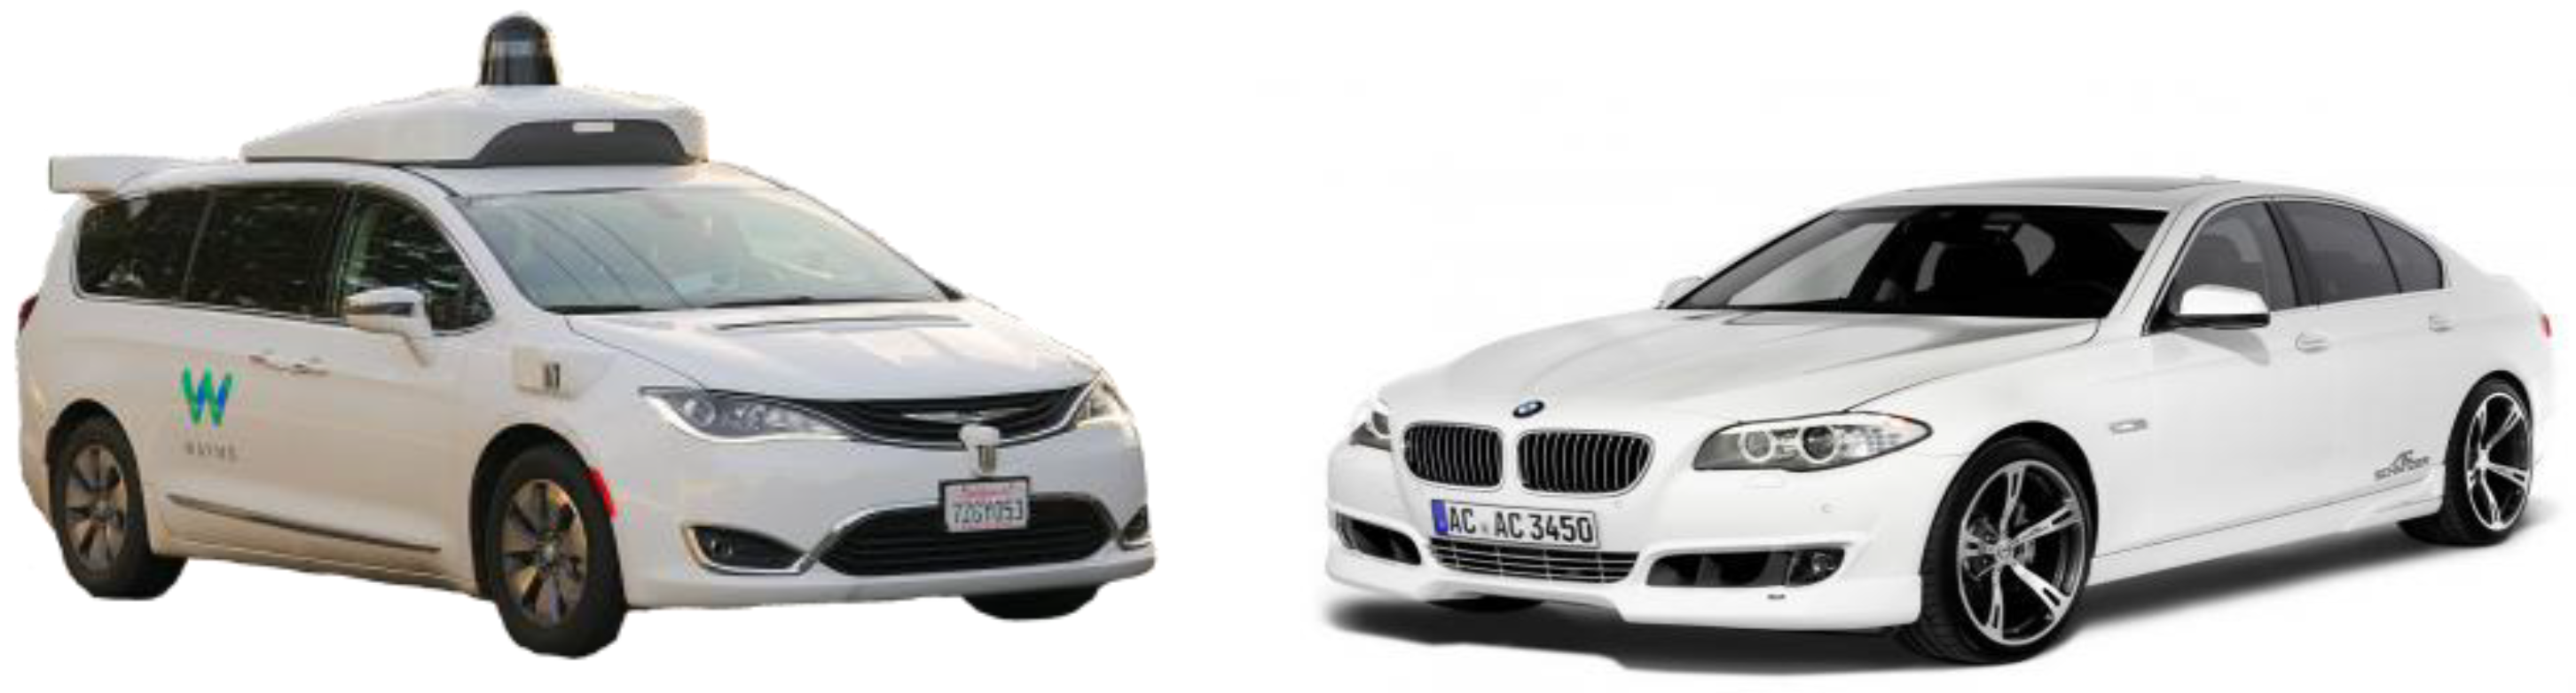
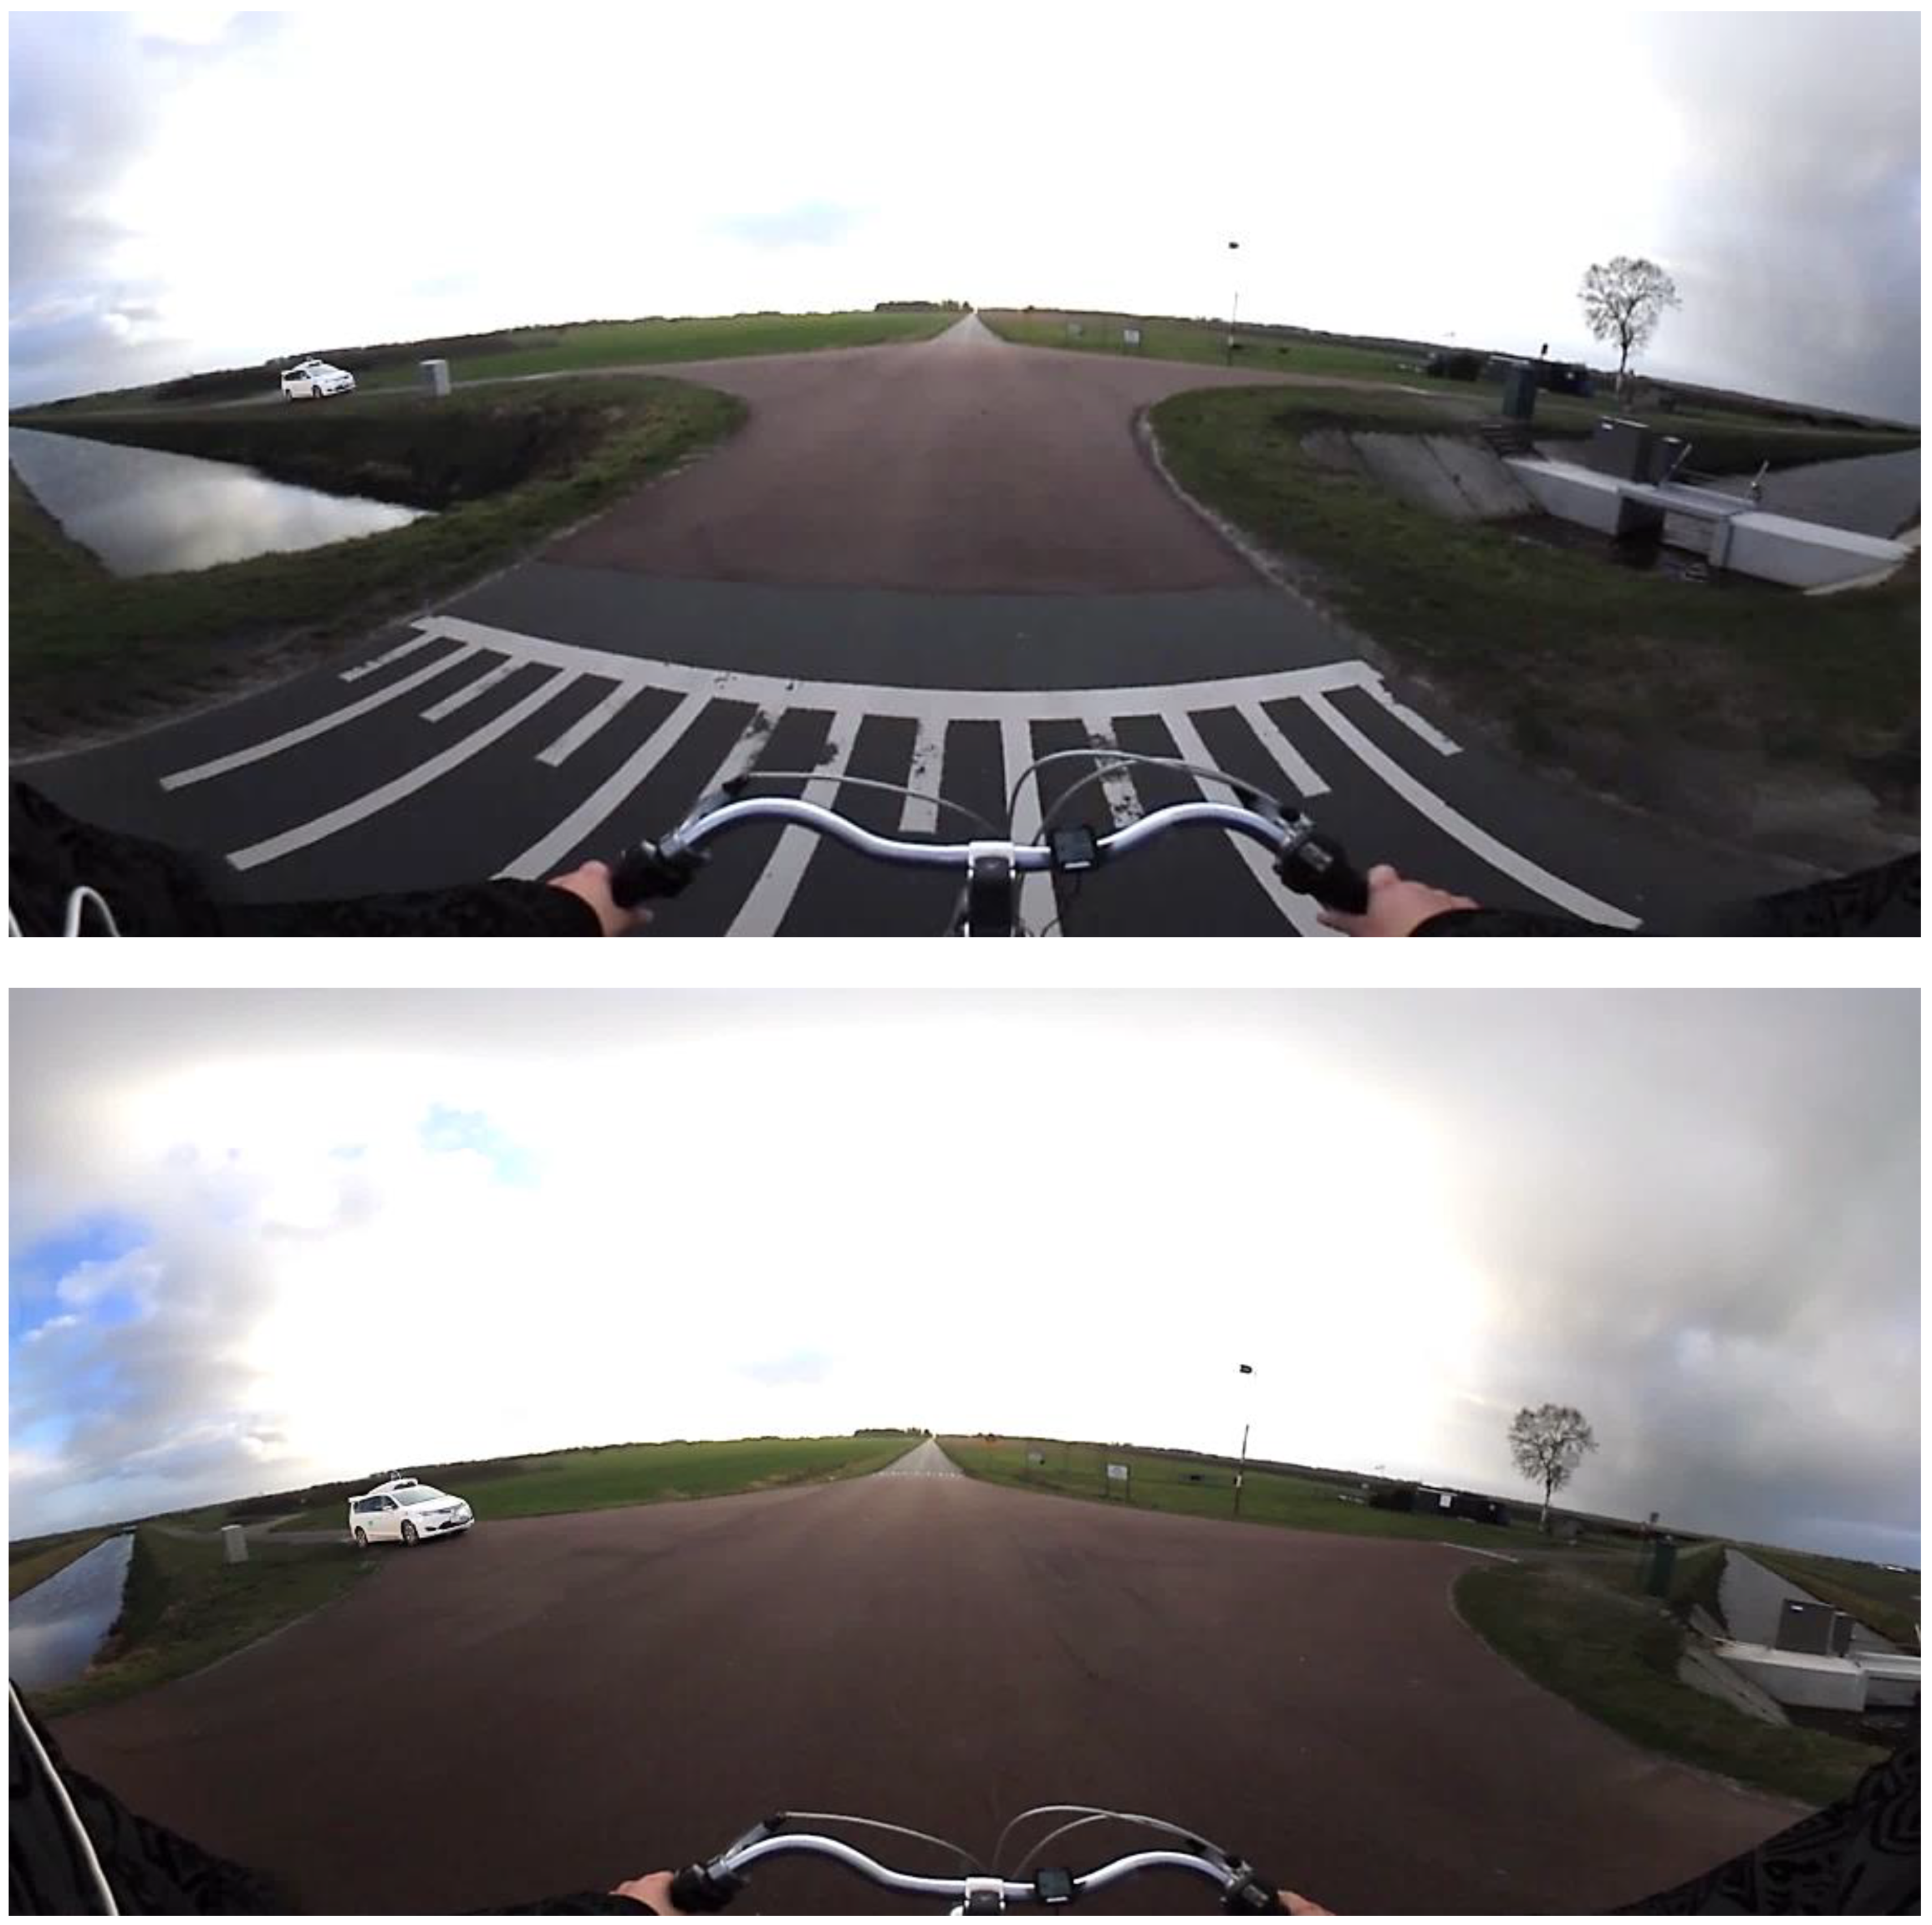
A repeated measures experiment was designed where each participant completed 16 scenarios using a 360° video-based VR method. 360° video-based VR has been used in pedestrians’ studies but has not been used to study cyclists. VR can facilitate having participants immerse in the VR environment to study cyclist interaction with automated vehicles in contrast to photos and videos that lack this level of immersiveness. VR is a useful tool due its realism, reproducibility, increased control over the environment, and absence of exposure to physical danger in contrast to real-life experiments [17]. Despite the advantages of VR, its use in scientific research is relatively scarce when it comes to crossing intentions of cyclists. Nevertheless, studies on the behavior of pedestrians at crossings show that VR experiments can display differences in crossing intentions [18]. The participants did not show reckless behavior and they adopted a crossing behavior that is common in real-life [17,19]. Therefore, VR is a useful tool to study crossing intentions [20]. The 16 scenarios were created considering a set of 4 variables each with 2 levels as described in Table 1. The gap size was calculated as the time needed before the vehicle crossed the path of the cyclist and was achieved by stopping the video at the desired time gap. The 16 scenarios were completed twice per participant (session 1 and session 2). Before the second session started, the participants were told explicitly that there were two types of vehicles present in the experiment and which vehicle of the two was a CV and which was an AV. That ensured there was a complete data set where the participants knew they were interacting with an AV. The two vehicles are illustrated in Figure 1.

2.1. Apparatus

All the videos were recorded using the Nikon Keymission 360. The camera has two lenses making it possible to film in 360°. The videos had a resolution of 3480 × 2160 pixels with a 24 frames per seconds. A special camera mount (i.e., GoPro mouth mount) was used that allowed to record videos from the height of one’s chin. The videos were shown to the participants using an iPhone 7 with a screen resolution of 1334 × 750 pixels and using a consumer app (VR Media Player) downloaded from the App Store and a consumer level head-mounted smartphone holder such as the Samsung Gear with a field of view of roughly 100 degrees. The intersection on which the scenarios were filmed was a quiet rural crossing with nothing obstructing the view of the car. A screenshot of one of the videos can be seen in Figure 2. The videos represented a cyclist riding towards a crossing while a vehicle was moving towards the cyclist from one of the side directions. The video stopped at the critical moment (i.e., when the desired gap size was reached). This stopping point (determining the gap size) was based on the needed braking distance for the cyclists in case she/he would decide to stop, so that participants would still be able to stop [21]. The participants were asked what they would do: (1) continue cycling, (2) cycle faster, or (3) slow down. They were free to imagine how much they would change their speed if they chose to cycle faster or to slow down. Slowing down could also include the option to come to a complete stop. The participants had to answer verbally and was noted by the researcher. Every participant watched all 16 different scenarios per session. The videos were randomized and three versions were made.

2.2. Location

Two locations were tested before choosing the one used for the experiment. Both locations contained an intersection of two roads. Two of the intersections were in urban areas with traffic. Other road users appeared on the videos often. This could have an additional (in this case undesired) effect on the participants. Furthermore, the urban environment contained obstacles often blocking the view of the car. Thus, we decided against using these locations. We searched for an intersection with the least amount of obstacles and the lowest amount of traffic for our filming location. Other requirements were: the asphalt had to be smooth to reduce shaking in the videos, and without priority markings present at the location. A location in a rural area was found that met our requirements and was used in the final videos.

2.3. Pilot Studies

Three pilot studies were conducted before setting the final experiment. The first pilot study was to attain a realistic cycling speed. The speeds tested were 12 km/h, 15 km/h, and 18 km/h as these are average cycling speeds [22]. Ten out of sixteen participants reported that, to them, a cycling speed of 15 km/h felt the most realistic of all the three. In the second pilot study the speed of the vehicle, the gap sizes, and the vehicle’s color were investigated. The speed of the vehicle (i.e., 20 and 30 km/h) was chosen for practical reasons. It was important that the vehicle would be visible (in the VR) for the cyclist to be able to notice it. This was not possible if the speed of the vehicle was higher than 30 km/h. Similarly, the gap sizes were chosen based on what was found to be the most realistic to the participants using the VR in the pilot studies. Besides gap sizes of 0.5 and 2.0 s, also a gap size of 4.0 s was tested but it did not result in a variation in the crossing intention among the participants of the pilot study since the vehicle would be too far out of sight of the cyclist. Therefore, only gap sizes of 0.5 and 2.0 s were used. A gap size of 0.5 s was tested as this was the shortest possible gap size in which the cyclist could cross the road without accelerating. This gap size proved to elicit variation in the crossing intentions of the pilot study and was therefore maintained. Furthermore, a dark vehicle was hard to distinguish in the recordings and therefore a light color vehicle was chosen. In the third pilot study, the vehicle appearances and the priority markings were chosen. The vehicle used in the recordings was a white BMW 5-series, since it was comparable in size to the AV (which in this study was the Waymo Fiat Chrysler as can be seen in Figure 1 [23]). As can be seen in Figure 1 the white color was clearly visible. Since AVs are not widely used yet, it was difficult to get a real AV vehicle for the recordings. Therefore, the AV was created via video editing which also ensured that the AV had the same size and speed as the CV, because it was placed over the CV and tracked to its exact movements. Figure 1 shows the appearance of both vehicles in the videos. The software used to edit was Adobe Photoshop, Adobe Premiere Pro and Adobe after Effects. The Waymo Fiat Chrysler turned out to be the most realistic appearance compared to the Google Firefly of an AV in the video and was therefore used in the experiment.
To simulate priority for the vehicle, video edited priority markings were tested, but they proved to be hard to see. Therefore, the vehicle approached the cyclists from the right in half of the videos, thus in these cases it had the right of way. To simulate priority to the cyclists, the vehicle approached the cyclists from the left.

2.4. Sample

To collect the data, 47 participants (24 males; 23 females) took part in the experiment. The participants had to be 18 years old or older and cycle in daily life. Participants had to be able to see clearly without glasses as these could not be used while wearing the head mounted display. Since the experiment was conducted at the TU Delft, most of the participants were (former) students. As age was found in the literature to have an influence on the crossing behavior of cyclists and the set of participants was relatively small, a homogenous age was chosen for all the participants, so that the differences in their intentions were not due to differences in their age [24,25]. The participants were informed that the experiment was about crossing behavior of cyclists. Automated vehicles were not mentioned in order not to influence or bias their crossing decisions in the first session. We also tested whether the participants noticed any difference between the vehicles. The experiment was approved by the ethical committee of the Delft University of Technology.

2.5. Questionnaires

All participants filled in a set of questionnaires before, during and after the experiment. The first survey contained questions about the participants’ demographics and the pedestrian behavioral scale (PBS) adjusted for cyclists [26]. This questionnaire included items such as “Cycle on the road instead of a bicycle lane,” “See a small gap in traffic and ‘go for it,’” and “Think it is OK to cross safely, but a car is coming faster than you though.” One had to respond on a scale from 1 (never) to 5 (often) how often they performed certain behaviors. So, the higher the score the riskier one behaves. The results of this questionnaire were used to divide the group in the lower risk group and a higher risk group by dividing the participants based on the mean score of the whole group.
Furthermore, the level of trust in AVs was measured per participant using the trust in AVs scale [27,28]. This scale contained questions such as “Globally, I trust the automated vehicle,” “I trust the automated vehicle to have seen me,” and “I trust the automated vehicle to drive safe.”
To determine how the participants experienced the VR environment, the Presence Questionnaire has been used [29]. It contained items such as “How natural did your interactions with the environment seem,”How completely were your senses engaged in this experience?,” and “How completely were your senses engaged in this experience?.”
A side-effect of using VR is that participants may get sick due to visually induced motion sickness [30,31]. Although most people do not experience this, previous research has shown that not everybody can tolerate the virtual environment [20]. To ensure participants did not suffer from motion sickness, they filled in a misery scale (MISC) before, during, and at the end of the experiment [32]. The participants could score to what extent they experienced simulation sickness symptoms on a scale from 0 to 10 with 0 being not experiencing any symptoms and 10 being extremely simulation sick. If their scores increased significantly during the experiment, the experiment was paused, and we checked with the participant whether he/she was able to continue.
Perceived behavioral control (PBC) was measured using 2 items; “For me, crossing the road in this way would be…,” and “I believe that I have the ability to cross the road in this way…” [33]. PBC was measured for the BMW and the Waymo vehicle after session 1 if participants indicated to have noticed a difference between the vehicles, otherwise the questions were skipped. After session 2, all the participants answered the PBC items.
Perceived risk (PR) was a 1 item scale that was applied using the same procedure as PBC [33]. The item was the following: “Crossing the road in this situation would be…” Both PBC and PR were answered using a 7-point Likert scale. The scale was inverted for PBC. So, the higher the score the less PBC one experienced.

2.6. Procedure

At the very beginning, the participants had to sign an informed consent form before the experiment could begin. Then, the participants filled in a survey. The survey contained questions about their demographics and regarding their vision (eyesight). Following this, the adapted pedestrian questionnaire and the MISC were filled in. Then, they watched the first 8 videos of session 1, which took 3 min in total. A MISC questionnaire was filled in once again and then the last 8 videos of session 1 were shown. After the first session, the participants were asked to fill in the MISC for the third time. Following this, they were asked whether they had perceived any difference between the vehicles, about their perceived risk and their perceived behavioral control per vehicle, and they were asked to report how much they knew about AVs. Furthermore, they filled in the Trust in AVs questionnaire. Then, they were told about the AV and the CV types used in the experiment, by showing pictures of the vehicles. In session 2, the same videos were shown. The first 8 videos were presented. Then, a MISC was filled in. Finally, the last 8 videos of session 2 were shown. The final MISC was filled in after session 2. At the end, the participants completed the Presence questionnaire before they were debriefed. In total, the experiment lasted 60 min, and each session (i.e., 8 scenarios) took 3 min.

3. Results

We first present descriptive statistics followed by the overall results of the multinomial logistic mixed regression (MLMR) model regarding the crossing intentions. In addition, the results of the perceived behavioral control (PBC) and perceived risk (PR) are presented. Then, the results of the MLMR models per session are displayed. Finally, the results of the VR assessment are reported.

3.1. Descriptive Statistics

Forty-seven individuals (24 males; 23 females) participated in the experiment. Their mean age was 24.0 (SD = 2.7). All the participants had normal or corrected to normal vision. Forty-six participants cycled daily. Most of their daily cycling trips lasted between 15 to 60 min accumulated. Almost all, 43, stated to know what an automated vehicle was. On a scale from 1 to 6, the self-reported mean score on how much one knew about automated vehicles—1 is “almost nothing” and 6 “a great deal”—was 3.4 (SD = 1.2). No statistically significant difference was found between genders, t (45) = −0.16; p = 0.87. Thirty-five of the participants noticed a difference between the two vehicles. However, only five thought that some of the vehicles were automated in session 1.
The Trust in AVs mean score was 4.7 (SD = 0.9) on a 7-point Likert scale—1 means “low trust” and 7 means “high trust”–, and no statistically significant difference was found between genders (males M = 4.7, SD = 1.0; females M = 4.6, SD = 0.9), t(45) = 0.53; p = 0.60. The participants stated whether they had more, less, or equal trust in AVs as compared to CVs. Six stated that they had more trust in AVs, 14 stated to have less trust in AVs and 27 stated that they trusted them equally. The trust in AVs score differed significantly between the groups, F(2, 44) = 8.21, p = 0.001. The group that trusted the AVs more than CVs (M = 5.4, SD = 0.5) and the group that trusted them equally (M = 4.8, SD = 0.8) scored significantly higher on the Trust in AV scale than the group that had less trust in AVs (M = 4.0, SD = 1.0) as revealed by a Bonferroni post-hoc test. Further, the participants were divided into two groups based on their score on the adapted Pedestrian Behavior Scale (PBS); those that scored higher than the total mean were labeled “higher risk group” and those that scored lower than mean were labeled “lower risk group.” The mean score on the adapted PBS was 2.7 (SD = 0.6) on a scale from 1 to 7, 24 participants (12 females and 12 males) were labeled as lower risk group (M = 2.3, SD = 0.3) and the other 23 as higher risk group (M = 3.1, SD = 0.4). The difference in PBQ score between groups was statistically significant, t(45) = −7.10; p < 001. No difference was found in Trust in AVs score between the higher risk group (M = 4.9, SD = 0.7) and lower risk group (M = 4.4, SD = 1.1), t(45) = −0.16; p = 0.87.

3.2. Crossing Intentions

Each of the 47 participants watched 32 videos and made just as many crossing intention decisions. Therefore, the data set consisted of 1504 choices. In four occasions a participant missed the vehicle in the video and could therefore not answer, these occasions were eliminated, so that the total data set contained 1500 decisions. To analyze which factors influenced participants’ crossing intentions, multinomial logistic mixed regression models were estimated. A mixed model with a random intercept was chosen to capture the correlation between the decisions made in different scenarios by the same participant [34]. An unstructured covariance matrix has been chosen for the error structure [35,36]. The multinomial logistic mixed regression model was estimated using maximum likelihood.
The participants were given three options in the experiment: continue cycling, cycle faster, and slow down. In the models “continue cycling” was chosen as the reference category to which slow down, and cycle faster were compared to. The variable time gap size was converted to distance gap, since people select a gap mostly based on distance, instead of a gap in time [27,37]. Furthermore, a gap size measured in meters enables to remove speed from the equation, which allows to measure the effect of speed and gap size separately [37]. Trust in AVs, gender, and speed have been omitted from the succeeding models as they proved insignificant in all the models. Also, the random intercept was found to be insignificant in all the models and was therefore omitted from the models.
As shown in Table 2, participants’ intentions to cross did not differ significantly between the two vehicles. When the gap size was 4.2 m or smaller the participants chose to slow down significantly more compared to continue cycling. The effect size was very large for the case of slowing down. Cycling faster was chosen significantly more compared to continue cycling only when the vehicle was 2.8 m from the cyclist. The effect size was relatively large. If the cyclists had priority, they chose significantly less to slow down or to cycle faster compared to continue cycling. The effect was large when it comes to slow down and large when choosing to cycle faster.
The lower risk group decided to slow down and to cycle faster significantly more than the higher risk group. The effect size was medium for both. The participants were divided into groups based on their stated trust in AVs as compared to CVs. They were divided into three groups, the ones who stated they trusted AVs more than CVs, the ones who trusted AVs less than CVs and the ones who said there was no difference for them. However, no statistically significant difference was found between the three groups. The interaction between vehicles and stated trust showed a significant effect but only on the probability to slow down and only when the vehicle was a CV. When the participants had less trust in the AV as compared to the CV, then they slowed down less. The effect size was medium [38].

3.3. Perceived Behavioral Control and Perceived Risk

The participants answered questions per vehicle about their perceived behavioral control (PBC) and perceived risk (PR). Only participants who noticed a difference between vehicles in the first session (N = 35) answered the PBC and PR questions. All the participants filled this questionnaire after session 2 since they were explicitly told about the two types of vehicles before session 2 started.
The participants reported a PBC score of 5.0 (SD = 0.8) before session 2 and 5.1 (SD = 1.0) after, thus no significant difference. For the PR score it was respectively, 4.6 (SD = 0.7) before and 4.9 (SD = 0.9) after. The mean PBC scores per vehicle type per session can be found in Table 3. There were no significant differences between the sessions or vehicles score pairs’, except the PR scores of CVs and the scores of AVs in session 1, t(34) = −3.02; p = 0.005, and the PR scores of CVs before and the scores in session 2, t(34) = −3.76; p = 0.001. The other test statistics have been left out for the sake of clarity.

3.4. Models Per Session

Only 14% thought they had seen an AV in the first session, so it is interesting to analyze the differences between the sessions before and after participants were told one vehicle was an AV. Therefore, two separate models were created based on the data of only session 1 or 2. Also, we added the respective PBC and PR scores as factors to the model to see how they perform as predictors of the participants’ crossing intentions. As seen in Table 4, both models performed better than the full model based on the data from both sessions together. The model with the data of session 1 had the best performance of the three models.
In Table 5 the models’ results of session 1 and session 2 can be found. Vehicle type remained an insignificant predictor of the crossing intentions. Gap distance was a significant predictor of cyclists slowing down. It had a very large positive effect in both sessions. However, gap distance had only a significant positive effect on cycling faster in session 2. As shown in Table 5 the effect size is large in the case of 2.8 m and a medium effect size in the case of 4.2 m as compared to 16.7 m. To have priority had a significant negative effect on the decision to slow down and cycle faster as compared to continue cycling. The effect size was very large for the slow down option and medium to large for the cycle faster option. Those who reported that they trust the AV more than the CV had significantly lower intentions to slow down or cycle faster compared to continue cycling in session 2. Both effect sizes were large. Interestingly, one’s knowledge about AVs had only a significant negative effect to slow down or cycle faster compared to continue cycling in session 1. The effect was small. One’s PBC when interacting with a CV had a significant negative effect on the decision to slow down as compared to continue cycling in session 1. The effect size was small. One’s PBC when interacting with an AV was only significant in session 2. Furthermore, it had positive effects on both choice options. The effect size was medium. In addition, one’s PR when interacting with an AV was only significant in session 2, too. The effect sizes were medium and negative, in this case. Finally, when participants have less trust in AVs, and are interacting with a CV, they chose to continue cycling more as compared to slow down and cycle faster in session 2. The effect size was large.

3.5. Performance of the VR Method

The results of the Presence Questionnaire pointed toward participants experiencing the VR environment as realistic (Table 6). The lowest score was found for the quality of the interface (i.e., 2.67). Overall, the scores as reported in Table 6 are comparable to previous research [27]. Furthermore, the score on the MISC (Table 7) were relatively low meaning that participants experienced fewer symptoms of simulation sickness. The scores were slightly increasing over time. The range of the self-reported scores was 0 to 10, with 10 being chosen only thrice.
Thirty-eight participants felt that crossing the road in the VR was different as compared to real life. Twenty-eight participants felt “slightly safer” to “safer” as compared to real life. Seven participants did not experience any difference and twelve felt slightly unsafe in the VR environment as compared to real life.

4. Discussion

The main aim of this research was to determine what the differences are in crossing intentions of cyclists when interacting with AVs compared to CVs. To this end AVs were simulated in the present experiment. In addition, the perceived realism of 360° video-based VR for research purposes was assessed for cyclists’ crossing intentions. The variables vehicle type, the gap between the cyclist and vehicle, right-of-way priority, trust in AVs, perceived behavioral control, and perceived risk were included as potential factors that could affect the crossing intentions. This resulted in two sessions each of total 16 scenarios divided by an intervention in which the participants were told that the Waymo Fiat Chrysler vehicle was an AV. The scenarios were presented to 47 individuals by using a smartphone based virtual reality.
The main findings of both sessions were the following. The distance between the cyclist and the vehicle at an intersection and whether having right of way are the primary factors influencing cyclists’ crossing intentions. This is in accordance with findings on vulnerable road users’ crossing intentions [27,37]. Participants choose to adapt their speed (i.e., cycling faster or slowing down) when the gap size was shorter. This indicates that the cyclists did not feel safe and therefore intervened by adapting their cycling speed when gap sizes were short. Speed of the approaching vehicle was not of influence on the crossing intentions. This points toward gap size (measured in distance) being the more important factor of the two. When the participants had the right of way, they preferred to continue cycling instead of adapting their cycling speed. So, the cyclists felt safer when they had the right of way and decided not to adapt their speed relying on the vehicle to do so. Also, the fact that less effort is required to continue cycling as compared to cycle faster and to slow down, could be a reason why the participants preferred to continue cycling. It could be that the participants tried to minimize effort while maximizing safety. So, if the situation is safe one would prefer not to adapt their speed in contrast to when the situation is unsafe. The vehicle appearance and vehicle automation did not have a significant effect on the crossing intentions. This was in accordance with the literature on previous studies on cyclists’ interactions with AVs [7,16]. No clear preference was found for the AV in contrast to what could be expected because AVs ought to be safer. The participants may not perceive the AV as safer than the CV and therefore interact with both vehicles in the same manner. Second, this could indicate that cyclists use their learned strategies even when interacting with a new type of vehicle. Either way, the participants did not perceive the need to interact with AVs differently than with CVs.
In accordance with Nuñez Velasco, et al. [27], the Trust in AVs in itself was not a significant predictor of the crossing intentions. However, participants’ statements whether they trusted AVs more or less as compared to CVs was a significant predictor of the crossing intentions. Thus, the absolute trust does not capture the relative value of trust between vehicles. One could score highly in the Trust in AVs scale but have more trust in CVs, still. The limitation of the trust scale used in this study is that it is 1 item only. A scale consisting of multiple items comparing the trust in both types of vehicles could be a better predictor and explain cyclists’ intentions better.
The main findings regarding session 2 are the following: Participants who were categorized in the lower risk group chose to cycle faster or to slow down more often than the higher risk group. Curiously, this was only the case in session 2 where they knew that they were interacting with an AV in addition to a CV. The group that had more trust in AVs decided to continue cycling more often overall as compared to the other two options involving speed adaptation. This indicates that they might have felt safer and therefore did not adapt their speed. In Rodríguez Palmeiro, and colleagues study they also found a relation between trust and perceived safety when interacting with AVs [39]. However, we found that cyclists who stated that they trust AVs less (than CVs) decided to continue cycling more as compared to slowing down and cycling faster when interacting with a CV. This means that those cyclists perceived less risk when they were interacting with a CV than with an AV and thus, did not feel the need to adapt their speed. In contrast to the findings of Rodríguez Palmeiro, and colleagues [39]) where participants chose riskier answers when scenarios were presented that contained AVs. So, instead of changing their intentions (by adapting their speed) when interacting with AVs, they chose to not adapt their intentions when they interacted with a CV. PR of AVs had a significant negative effect which means that those that perceived a higher risk when interacting with AVs decided to slow down and to cycle faster less. The opposite is true for PBC when interacting with an AV. When the participants experience more perceived behavioral control when interacting with AVs they decided to adapt their behavior more. Overall, a positive relation was found between adaptation of speed and PBC and a negative between adaptation of speed and PR. Lastly, the effect of the gap size became even more pronounced in session 2. So, knowing that one of the vehicles was automated, increased the effect of the gap size on the crossing intentions. It could be that the knowledge is not the reason the effect size increases but the repetition of the task. Participants could have become better at deciding when to cross based on the gap size. To examine this effect, the data of the first session was split in two halves and the crossing intention model was estimated for each part of the data separately and the results were compared regarding the effect of gap size on crossing intentions and found that the effect was larger in the second half of session 1 (for example odds ratio (OR) = 6.6 versus OR = 10.3 for distance gap in the first and second half, respectively) proving that it is a learning effect.
The 360° video-based VR was useful as a research method to investigate the crossing intentions of cyclists. Participants did not suffer from motion sickness and everyone was able to finish the experiment. Furthermore, the scores on the Presence questionnaire were similar to those previously found [27]. Even though 60% of the participants indicated they felt safer in VR than in real life, their crossing decisions still showed a trade-off, and nobody crossed in all scenarios. It is unclear why some of the participants reported to feel less safe in VR. A reason could be that they felt that in real life they do not experience these kinds of critical scenarios often. Future research could focus on creating insights into this. The recording angle of the videos, from the viewing perspective of the cyclist was found very realistic by the participants and the recordings were steady and comfortable to watch. However, due to the use of a head mounted smartphone holder that places the display in front of one’s eyes, no peripheral vision could be used by the participants. This could have had the implication that the cyclists had to actually look at the vehicles to be able to see them. The peripheral vision affects the moment of detection. So, if the cyclist detected the car in a later stage that would affect the remaining gap at the moment the cyclist arrived to the intersection, and as a result the crossing intention/decision. In real life, peripheral vision could have provided the cyclists with vehicles’ location and movement cues without them having to have looked at them. Further research could focus on how the lack of peripheral vision impacts cyclists’ crossing intentions and behavior. Furthermore, research should focus on the comparison of VR and real-world cyclists’ behavior studies to increase our understanding of the transferability of results in VR studies to the real world.

5. Conclusions

The answer to our main research question “How does the physical appearance of a vehicle affect the crossing intentions of cyclists?” is the following: Cyclists’ do not seem to have different behavioral intentions when interacting with AVs as compared to when they interact with CVs. The vehicle appearance and type were not found to influence their intentions. The answers to the other research questions “How do the vehicles” motion cues intentions and the existing priority regulations affected cyclists’ crossing intentions are the following: the gap size and the right of way were the most important factors affecting cyclists’ crossing intentions. Participants’ statements whether they trusted AVs as compared to CVs was found to be a stronger predictor of the crossing intentions than the Trust in AVs by itself. The 360° video-based VR method was useful as a research method to investigate the crossing intentions of cyclists.

Author Contributions

Formal analysis, J.P.N.V. and A.d.V.; investigation, J.P.N.V.; A.d.V. and M.P.H.; methodology, J.P.N.V.; A.d.V. and H.F.; supervision, H.F.; B.v.A. and M.P.H.; writing—original draft, J.P.N.V. and A.d.V.; writing—review & editing, H.F. and M.P.H. All authors have read and agreed to the published version of the manuscript.

Funding

The APC was funded by Nederlandse Organisatie voor Wetenschappelijk Onderzoek: 438-15-161.

Institutional Review Board Statement

The study was conducted according to the guidelines of the Declaration of Helsinki, and approved by the Ethics Committee of Delft University of Technology (January 2019).

Informed Consent Statement

Informed consent was obtained from all subjects involved in the study.

Data Availability Statement

The data presented in this study are available on request from the corresponding author. The data are not publicly available due to privacy requirements.

Acknowledgments

The work reported in this paper was funded as part of the project Spatial and Transport impacts of Automated Driving (STAD) by the Netherlands Organization for Scientific Research (NWO) under contract 438-15-161.

Conflicts of Interest

The authors declare no conflict of interest.

References

  1. SWOV. 2017. Available online: https://www.swov.nl/feiten-cijfers/factsheet/fietsers (accessed on 23 December 2020).
  2. Pucher, J.; Buehler, R. Cycling towards a more sustainable transport future. Transp. Rev. 2017, 37, 689–694. [Google Scholar] [CrossRef] [Green Version]
  3. Saleh, K.; Abobakr, A.; Nahavandi, D.; Iskander, J.; Attia, M.; Hossny, M.; Nahavandi, S. Cyclist Intent Prediction using 3D LIDAR Sensors for Fully Automated Vehicles. In Proceedings of the 2019 IEEE Intelligent Transportation Systems Conference (ITSC), Auckland, New Zealand, 27–30 October 2019. [Google Scholar] [CrossRef]
  4. Keller, C.G.; Gavrila, D. Will the Pedestrian Cross? A Study on Pedestrian Path Prediction. IEEE Trans. Intell. Transp. Syst. 2014, 15, 494–506. [Google Scholar] [CrossRef] [Green Version]
  5. Schmidt, S.; Färber, B. Pedestrians at the kerb—Recognising the action intentions of humans. Transp. Res. Part F Traffic Psychol. Behav. 2009, 12, 300–310. [Google Scholar] [CrossRef]
  6. Grembek, O.; Kurzhanskiy, A.; Medury, A.; Varaiya, P.; Yu, M. Making Intersections Safer with I2V Communication. Available online: https://par.nsf.gov/servlets/purl/10101212 (accessed on 23 December 2020).
  7. Hagenzieker, M.; Van Der Kint, S.; Vissers, L.; Van Schagen, I.N.L.G.; De Bruin, J.; Van Gent, P.; Commandeur, J.J.F. Interactions between cyclists and automated vehicles: Results of a photo experiment. J. Transp. Saf. Secur. 2020, 12, 94–115. [Google Scholar] [CrossRef] [Green Version]
  8. Merat, N.; Louw, T.; Madigan, R.; Wilbrink, M.; Schieben, A. What externally presented information do VRUs require when interacting with fully Automated Road Transport Systems in shared space? Accid. Anal. Prev. 2018, 118, 244–252. [Google Scholar] [CrossRef] [PubMed]
  9. Vissers, L.; Van der Kint, S.; Van Schagen, I.; Hagenzieker, M.P. Safe interaction between cyclists, pedestrians and automated vehicles. What do we know and what do we need to know? Hague SWOV Inst. Road Saf. Res. 2016, 46, 92. [Google Scholar]
  10. Guéguen, N.; Meineri, S.; Eyssartier, C. A pedestrian’s stare and drivers’ stopping behavior: A field experiment at the pedestrian crossing. Saf. Sci. 2015, 75, 87–89. [Google Scholar] [CrossRef]
  11. Lundgren, V.M.; Habibovic, A.; Andersson, J.; Lagström, T.; Nilsson, M.; Sirkka, A.; Fagerlönn, J.; Fredriksson, R.; Edgren, C.; Krupenia, S.; et al. Will there be new communication needs when introducing automated vehicles to the urban context? In Advances in Human Aspects of Transportation; Springer: Cham, Germany, 2017; p. 786. [Google Scholar]
  12. Tafidis, P.; Pirdavani, A.; Brijs, T.; Farah, H. Can automated vehicles improve cyclist safety in urban areas? Safety 2019, 5, 57. [Google Scholar] [CrossRef] [Green Version]
  13. Madigan, R.; Nordhoff, S.; Fox, C.; Amini, R.E.; Louw, T.; Wilbrink, M.; Schieben, A.; Merat, N. Understanding Interactions between Automated Road Transport Systems and Other Road Users: A Video Analysis. Available online: https://scihub.wikicn.top/10.1016/j.trf.2019.09.006 (accessed on 23 December 2020).
  14. Bjørnskau, T.; De Ceunynck, T.; Fyhri, A.; Hagenzieker, M.; Ivina, D.; Johansson, O.J.; Laureshyn, A. Cyclists interacting with self-driving buses–hypotheses and empirical findings in real traffic. In Proceedings of the International Cycling Safety Conference, Brisbane, Australia, 18–20 November 2019. [Google Scholar]
  15. Rodríguez Palmeiro, A.; van der Kint, S.; Hagenzieker, M.P.; van Schagen, I.N.L.G.; de Winter, J.C.F. Interactions between cyclists and automated vehicles: Results of an international photo-based survey. In Proceedings of the 7th International Cycling Safety Conference, Barcelona, Spain, 10–11 October 2018. [Google Scholar]
  16. Vlakveld, W.; Van der Kint, S.; Hagenzieker, M. Cyclists’ intentions to yield for automated cars at intersections when they have right of way: Results of an experiment using high-quality video animations. Transp. Res. Part F Traffic Psychol. Behav. 2020, 71, 288–307. [Google Scholar] [CrossRef]
  17. Simpson, G.; Johnston, L.; Richardson, M. An investigation of road crossing in a virtual environment. Accid. Anal. Prev. 2003, 35, 787–796. [Google Scholar] [CrossRef]
  18. Clancy, T.A.; Rucklidge, J.J.; Owen, D. Road-Crossing Safety in Virtual Reality: A Comparison of Adolescents with and Without ADHD. J. Clin. Child Adolesc. Psychol. 2006, 35, 203–215. [Google Scholar] [CrossRef] [PubMed] [Green Version]
  19. Plumert, J.M.; Kearney, J.; Cremer, J.F. Children’s Perception of Gap Affordances: Bicycling Across Traffic-Filled Intersections in an Immersive Virtual Environment. Child Dev. 2004, 75, 1243–1253. [Google Scholar] [CrossRef] [PubMed]
  20. Deb, S.; Carruth, D.W.; Sween, R.; Strawderman, L.J.; Garrison, T.M. Efficacy of virtual reality in pedestrian safety research. Appl. Ergon. 2017, 65, 449–460. [Google Scholar] [CrossRef] [PubMed]
  21. CROW. Available online: https://www.crow.nl/ (accessed on 23 December 2020).
  22. KiM. Mobiliteitsbeeld. 2016. Available online: https://www.kenniscentrumsportenbewegen.nl/kennisbank/publicaties/?mobiliteitsbeeld-2016&kb_id=21518 (accessed on 23 December 2020).
  23. Waymo. On the Road. 2018. Available online: https://waymo.com/ontheroad/ (accessed on 27 September 2018).
  24. Bernhoft, I.M.; Carstensen, G. Preferences and behaviour of pedestrians and cyclists by age and gender. Transp. Res. Part F Traffic Psychol. Behav. 2008, 11, 83–95. [Google Scholar] [CrossRef]
  25. Demiroz, Y.; Onelcin, P.; Alver, Y. Illegal road crossing behavior of pedestrians at overpass locations: Factors affecting gap acceptance, crossing times and overpass use. Accid. Anal. Prev. 2015, 80, 220–228. [Google Scholar] [CrossRef]
  26. Granié, M.-A.; Pannetier, M.; Guého, L. Developing a self-reporting method to measure pedestrian behaviors at all ages. Accid. Anal. Prev. 2013, 50, 830–839. [Google Scholar] [CrossRef] [Green Version]
  27. Velasco, J.P.N.; Farah, H.; Van Arem, B.; Hagenzieker, M.P. Studying pedestrians’ crossing behavior when interacting with automated vehicles using virtual reality. Transp. Res. Part F Traffic Psychol. Behav. 2019, 66, 1–14. [Google Scholar] [CrossRef] [Green Version]
  28. Payre, W.; Cestac, J.; Delhomme, P. Fully automated driving: Impact of trust and practice on manual control recovery. Hum. Factors 2015, 58, 229–241. [Google Scholar] [CrossRef]
  29. Witmer, B.G.; Jerome, C.J.; Singer, M.J. The factor structure of the presence questionnaire. Teleoperators Virtual Environ. 2005, 14, 298–312. [Google Scholar] [CrossRef]
  30. Bos, J.E.; Bles, W.; Groen, E.L. A theory on visually induced motion sickness. Displays 2008, 29, 47–57. [Google Scholar] [CrossRef]
  31. Lubeck, A.J.A.; Bos, J.E.; Stins, J.F. Motion in images is essential to cause motion sickness symptoms, but not to increase postural sway. Displays 2015, 38, 55–61. [Google Scholar] [CrossRef]
  32. Van Emmerik, M.L.; De Vries, S.C.; Bos, J.E. Internal and external fields of view affect cybersickness. Displays 2011, 32, 169–174. [Google Scholar] [CrossRef]
  33. Zhou, R.; Horrey, W.J.; Yu, R. The effect of conformity tendency on pedestrians’ road-crossing intentions in China: An application of the theory of planned behavior. Accid. Anal. Prev. 2009, 41, 491–497. [Google Scholar] [CrossRef] [PubMed]
  34. Lund Research Ltd. Repeated Measures ANOVA. 2018. Available online: https://statistics.laerd.com/statistical-guides/repeated-measures-anova-statistical-guide.php (accessed on 22 October 2018).
  35. Kincaid, C. Guidelines for Selecting the Covariance Structure in Mixed Model Analysis. Computational Statistics and Data Analysis. 2005, pp. 1–8. Available online: https://support.sas.com/resources/papers/proceedings/proceedings/sugi30/198-30.pdf (accessed on 23 December 2020).
  36. Singer, J.D. Using SAS PROC MIXED to Fit Multilevel Models, Hierarchical Models, and Individual Growth Models. J. Educ. Behav. Stat. 1998, 23, 323–355. [Google Scholar] [CrossRef] [Green Version]
  37. Oxley, J.; Ihsen, E.; Fildes, B.N.; Charlton, J.L.; Day, R.H. Crossing roads safely: An experimental study of age differences in gap selection by pedestrians. Accid. Anal. Prev. 2005, 37, 962–971. [Google Scholar] [CrossRef] [PubMed]
  38. Chen, H.; Cohen, P.; Chen, S. How Big is a Big Odds Ratio? Interpreting the Magnitudes of Odds Ratios in Epidemiological Studies. Commun. Stat. Simul. Comput. 2010, 39, 860–864. [Google Scholar] [CrossRef]
  39. Palmeiro, A.R.; Van Der Kint, S.; Vissers, L.; Farah, H.; De Winter, J.; Hagenzieker, M.P. Interaction between pedestrians and automated vehicles: A Wizard of Oz experiment. Transp. Res. Part F Traffic Psychol. Behav. 2018, 58, 1005–1020. [Google Scholar] [CrossRef] [Green Version]
Figure 1. Appearance of automated vehicles (AV) (left) and conventional vehicle (CV) (right).
Information 12 00007 g001
Figure 2. Screenshots of the 360° videos with the vehicle at different distances.
Information 12 00007 g002
Table 1. Variables included in the VR experiment.
Variable NameLevelsAnnotationExplanation
Vehicle type2AVAutomated Vehicle
CVConventional Vehicle
Vehicle speed220Vehicle driving speed 20 km/h
30Vehicle driving speed 30 km/h
Gap size2Small Gap (SG)Gap between vehicle and cyclist was 0.5 s/2.8 m (V = 20)/4.2 m (V = 30)
Large Gap (LG)Gap between vehicle and cyclist was 2 s/11.1 m (V = 20)/16.7 m (V = 30)
Priority to the cyclist2YesCyclist had priority over the vehicle
NoVehicle had priority over the cyclist
Table 2. Results of the Crossing Intention Multinomial Logistic Mixed Regression (MLMR) Model for both sessions combined.
Fixed CoefficientsΒ (SE)Odds Ratio95% CIp
Slow down
Intercept−0.74(2.22)0.48[0.01,37.50]0.73
Vehicle type (1 = CV, 2 * = AV)−0.19(0.19)0.83[0.57,1.21]0.33
Gap distance (meters; 1 = 2.8 m, 4 * = 16.7 m)2.36(0.21)10.55[7.03,15.85]<0.001
Gap distance (meters; 2 = 4.2 m, 4 * = 16.7 m)2.39(0.20)10.92[7.31,16.31]<0.001
Gap distance (meters; 3 = 11.1 m, 4 * = 16.7 m)0.10(0.21)1.01[0.73,1.65]0.65
Priority to cyclist (1 = yes, 2 * = no)−2.03(0.15)0.13[0.10,0.17]<0.001
Risk group (1 = low, 2 * = high)0.56(0.15)1.76[1.31,2.37]<0.001
Stated Trust (1 = More, 3 * = No difference)−0.30(0.32)0.74[0.40,1.38]0.34
Stated Trust (2 = Less, 3 * = No difference)−0.10(0.23)0.91[0.58,1.42]0.67
Vehicle * Stated Trust (CV * More)0.76(0.44)2.14[0.90,5.10]0.09
Vehicle * Stated Trust (CV * Less)−0.75(0.33)0.47[0.25,0.90]0.02
Cycle faster
Intercept−0.23(2.22)0.74[0.01,62.14]0.92
Vehicle type (1 = CV, 2 * = AV)0.26(0.19)1.29[0.89,1.88]0.18
Gap distance (meters; 1 = 2.8m, 4 * = 16.7 m)1.05(0.20)2.86[1.91,4.27]<0.001
Gap distance (meters; 2 = 4.2 m, 4 * = 16.7 m)0.31(0.21)1.36[0.91,2.04]0.14
Gap distance (meters; 3 = 11.1 m, 4 * = 16.7 m)0.02(0.20)1.02[0.69,1.50]0.93
Priority to cyclist (1 = yes, 2 * = no)−0.99(0.15)0.37[0.28,0.50]<0.001
Risk group (1 = low, 2 * = high)0.30(0.15)1.35[1.00,1.81]0.05
Stated Trust (1 = More, 3 * = No difference)−0.44(0.32)0.65[0.34,1.21]0.17
Stated Trust (2 = Less, 3 * = No difference)−0.13(0.23)0.88[0.56,1.39]0.59
Vehicle * Stated Trust (CV * More)−0.10(0.45)0.90[0.37,2.18]0.82
Vehicle * Stated Trust (CV * Less)−0.56(0.33)0.57[0.30,1.08]0.08
Note: * = Reference category. Odd ratios size: 1.68 = small, 3.47 = medium, 6.71 = large [38].
Table 3. Mean perceived behavioral control (PBC) and perceived risk (PR) scores per vehicle per session.
Session 1Session 2
AVCVAVCV
PBC5.2 (SD = 1.0)4.8 (SD = 1.2)5.0 (SD = 1.1)5.2 (SD = 1.3)
PR5.0 (SD = 1.1)4.2 (SD = 1.0)4.7 (SD = 1.2)5.0 (SD = 1.2)
Table 4. Performance of the models.
Model−2 LLAICBIC
Full model (Table 2)10970.210974.210984.8
Session 1 model (Table 4)4095.74099.84108.3
Session 2 model (Table 5)5407.75411.75420.9
Table 5. Results of the crossing intentions MLMR model for both sessions.
Fixed CoefficientsSession 1Session 2
Odds Ratio95% CIOdds Ratio95% CI
Slow down
Intercept12.31[0.10,1578.9]3.82[0.04,349.3]
Vehicle type (1 = AV, 2 + = CV)0.64[0.35,1.17]1.00[0.59,1.70]
Gap distance (meters; 1 = 2.8 m, 4 + = 16.7 m)8.35 ***[4.27,16.34]13.32 ***[7.50,23.67]
Gap distance (meters; 2 = 4.2 m, 4 + = 16.7 m)10.40 ***[5.34,20.22]12.77 ***[7.26,22.45]
Gap distance (meters; 3 = 11.1 m, 4 + = 16.7 m)1.07[0.54,2.11]1.11[0.63,1.97]
Priority to cyclist (1 = yes, 2 + = no)0.16 ***[0.10,0.25]0.11 ***[0.08,0.17]
Risk group(1 = low, 2 + = high)1.46[0.84,2.55]1.66 *[1.07,2.60]
Stated Trust AV as compared to CV(1 = More, 3 + = No difference)0.66[0.23,1.89]0.39[0.15,1.01]
Stated Trust AV as compared to CV(2 = Less, 3 + = No difference)0.50[0.22,1.10]0.77[0.36,1.68]
Knowledge AVs0.77 *[0.62,0.95]1.03[0.86,1.23]
PBC CV0.73 *[0.53,1.00]0.79[0.56,1.11]
PR CV1.11[0.78,1.57]0.89[0.65,1.24]
PBC AV0.87[0.57,1.35]1.69 *[1.11,2.58]
PR AV1.00[0.69,1.46]0.54 ***[0.39,0.75]
Vehicle * Stated Trust(CV * More)2.26[0.69,8.86]2.09[0.62,7.11]
Vehicle * Stated Trust(CV * Less)1.32[0.44,3.98]0.31 *[0.13,0.78]
Cycle faster
Intercept23.66[0.18,3050.2]3.72[0.04,337.0]
Vehicle type (1 = AV, 2 + = CV)1.34[0.73,2.47]1.28[0.75,2.19]
Gap distance (meters; 1 = 2.8 m, 4 + = 16.7 m)1.44[0.74,2.80]4.84 ***[2.74,8.54]
Gap distance (meters; 2 = 4.2 m, 4 + = 16.7 m)0.97[0.50,1.90]1.75[0.98,3.11]
Gap distance (meters; 3 = 11.1 m, 4 + = 16.7 m)0.95[0.51,1.80]1.12[0.65,1.93]
Priority to cyclist (1 = yes, 2 + = no)0.39 ***[0.25,0.63]0.37 ***[0.25,0.56]
Risk group(1 = low, 2 + = high)1.22[0.70,2.12]1.43[0.92,2.22]
Stated Trust AV as compared to CV(1 = More, 3 + = No difference)0.92[0.32,2.61]0.24 **[0.09,0.62]
Stated Trust AV as compared to CV(2 = Less, 3 + = No difference)0.61[0.27,1.36]0.84[0.38,1.83]
Knowledge AVs0.88[0.71,1.09]1.02[0.85,1.22]
PBC CV0.91[0.66,1.25]0.78[0.55,1.10]
PR CV0.78[0.55,1.11]0.80[0.58,1.11]
PBC AV0.84[0.55,1.29]2.09 ***[1.37,3.20]
PR AV0.99[0.68,1.45]0.53 ***[0.38,0.74]
Vehicle * Stated Trust(CV * More)0.51[0.13,2.06]1.24[0.36,4.32]
Vehicle * Stated Trust(CV * Less)1.18[0.39,3.52]0.34 **[0.14,0.84]
Note: + = Reference category. Odd ratios size: 1.68 = s, 3.47 = m, 6.71 = l [38] * p ≤ 0.05; ** p ≤ 0.01; *** p ≤ 0.001.
Table 6. Results of the Presence Questionnaire (1 (low presence)—7(high presence)).
InvolvementAdaptation/ImmersionInterface QualityTotal Mean
Mean4.695.202.674.47
SD0.570.811.000.64
Table 7. Results of the MISC (0 (no symptoms)—10 (vomiting)).
MISC BaselineMISC 1 Session 1MISC 2 Session 1MISC 1 Session 2MISC Final
Mean1.471.891.851.942.26
SD0.982.181.021.391.82
Publisher’s Note: MDPI stays neutral with regard to jurisdictional claims in published maps and institutional affiliations.

