The Spatial Analysis of the Malicious Uniform Resource Locators (URLs): 2016 Dataset Case Study


 , ,
, , 
Abstract
1. Introduction
- Which nations are the top for origins, by count, of cyber attacks?
- Which nations are the top for origins, by relative risk, of cyber attacks?
- Do the spatial hotspots for cyber attack origins differ from the spatial relative risk hotspots for cyber attack?
2. Background
2.1. Data Collection
2.2. Software and Tools Used
- Perform geographical surveillance of disease, to detect spatial or space-time disease clusters, as well as to see if they are statistically significant.
- Test whether a disease is randomly distributed over space, over time, or over space and time.
- Evaluate the statistical significance of disease cluster alarms.
- Perform prospective real-time or time-periodic disease surveillance for the early detection of disease outbreaks.
2.3. Data Manipulation
3. Methodology
- Location IDs: the geographic center and a list of countries that belong to the cluster.
- Population: the number of internet users in each cluster.
- Observed/expected: the observed number of cases within the cluster divided by the expected number of cases within the cluster (under the null hypothesis that risk is the same inside and outside the cluster). Put another way, this is the estimated risk within the cluster divided by the estimated risk for the study region as a whole.
- Relative risk: the estimated risk within the cluster divided by the estimated risk outside the cluster. It is calculated as the observed divided by the expected within the cluster divided by the observed divided by the expected outside the cluster.
- p-Value: the probability of obtaining the observed (or a greater) number of cases in a cluster if the risk were the same as it is outside the cluster.
4. Results and Discussion
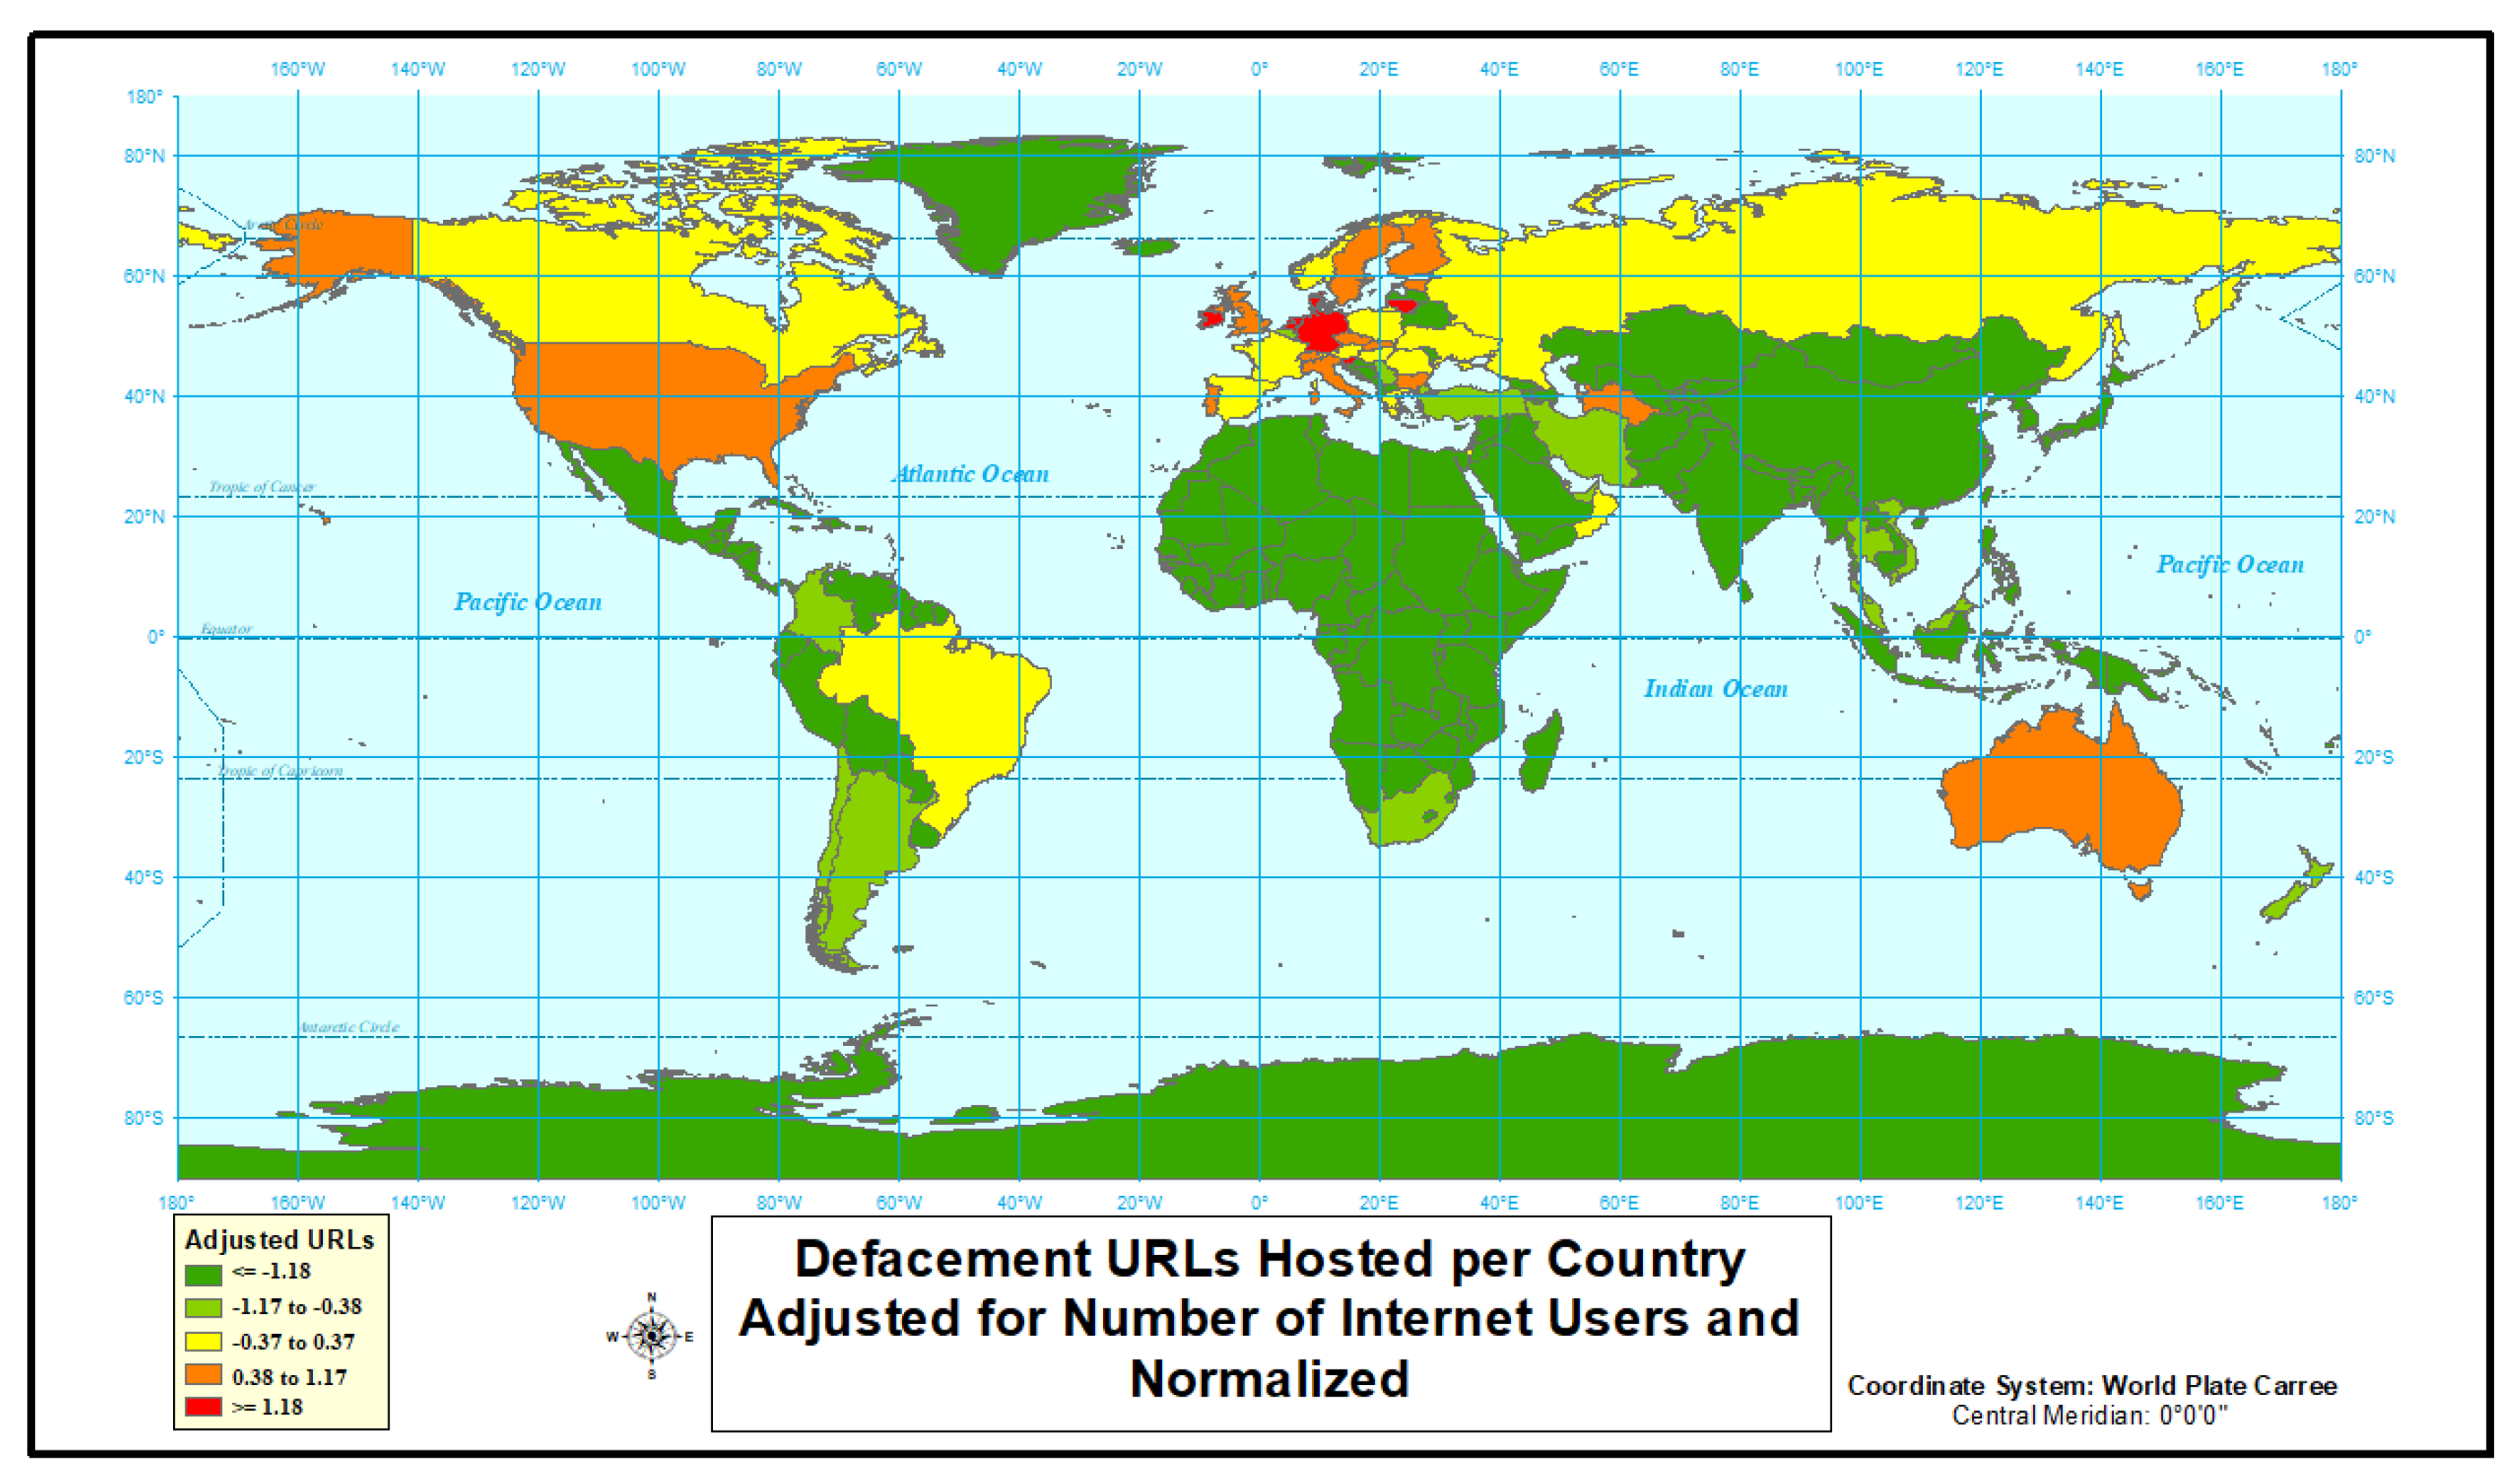
4.1. Type of Cyber Attacks by Rate
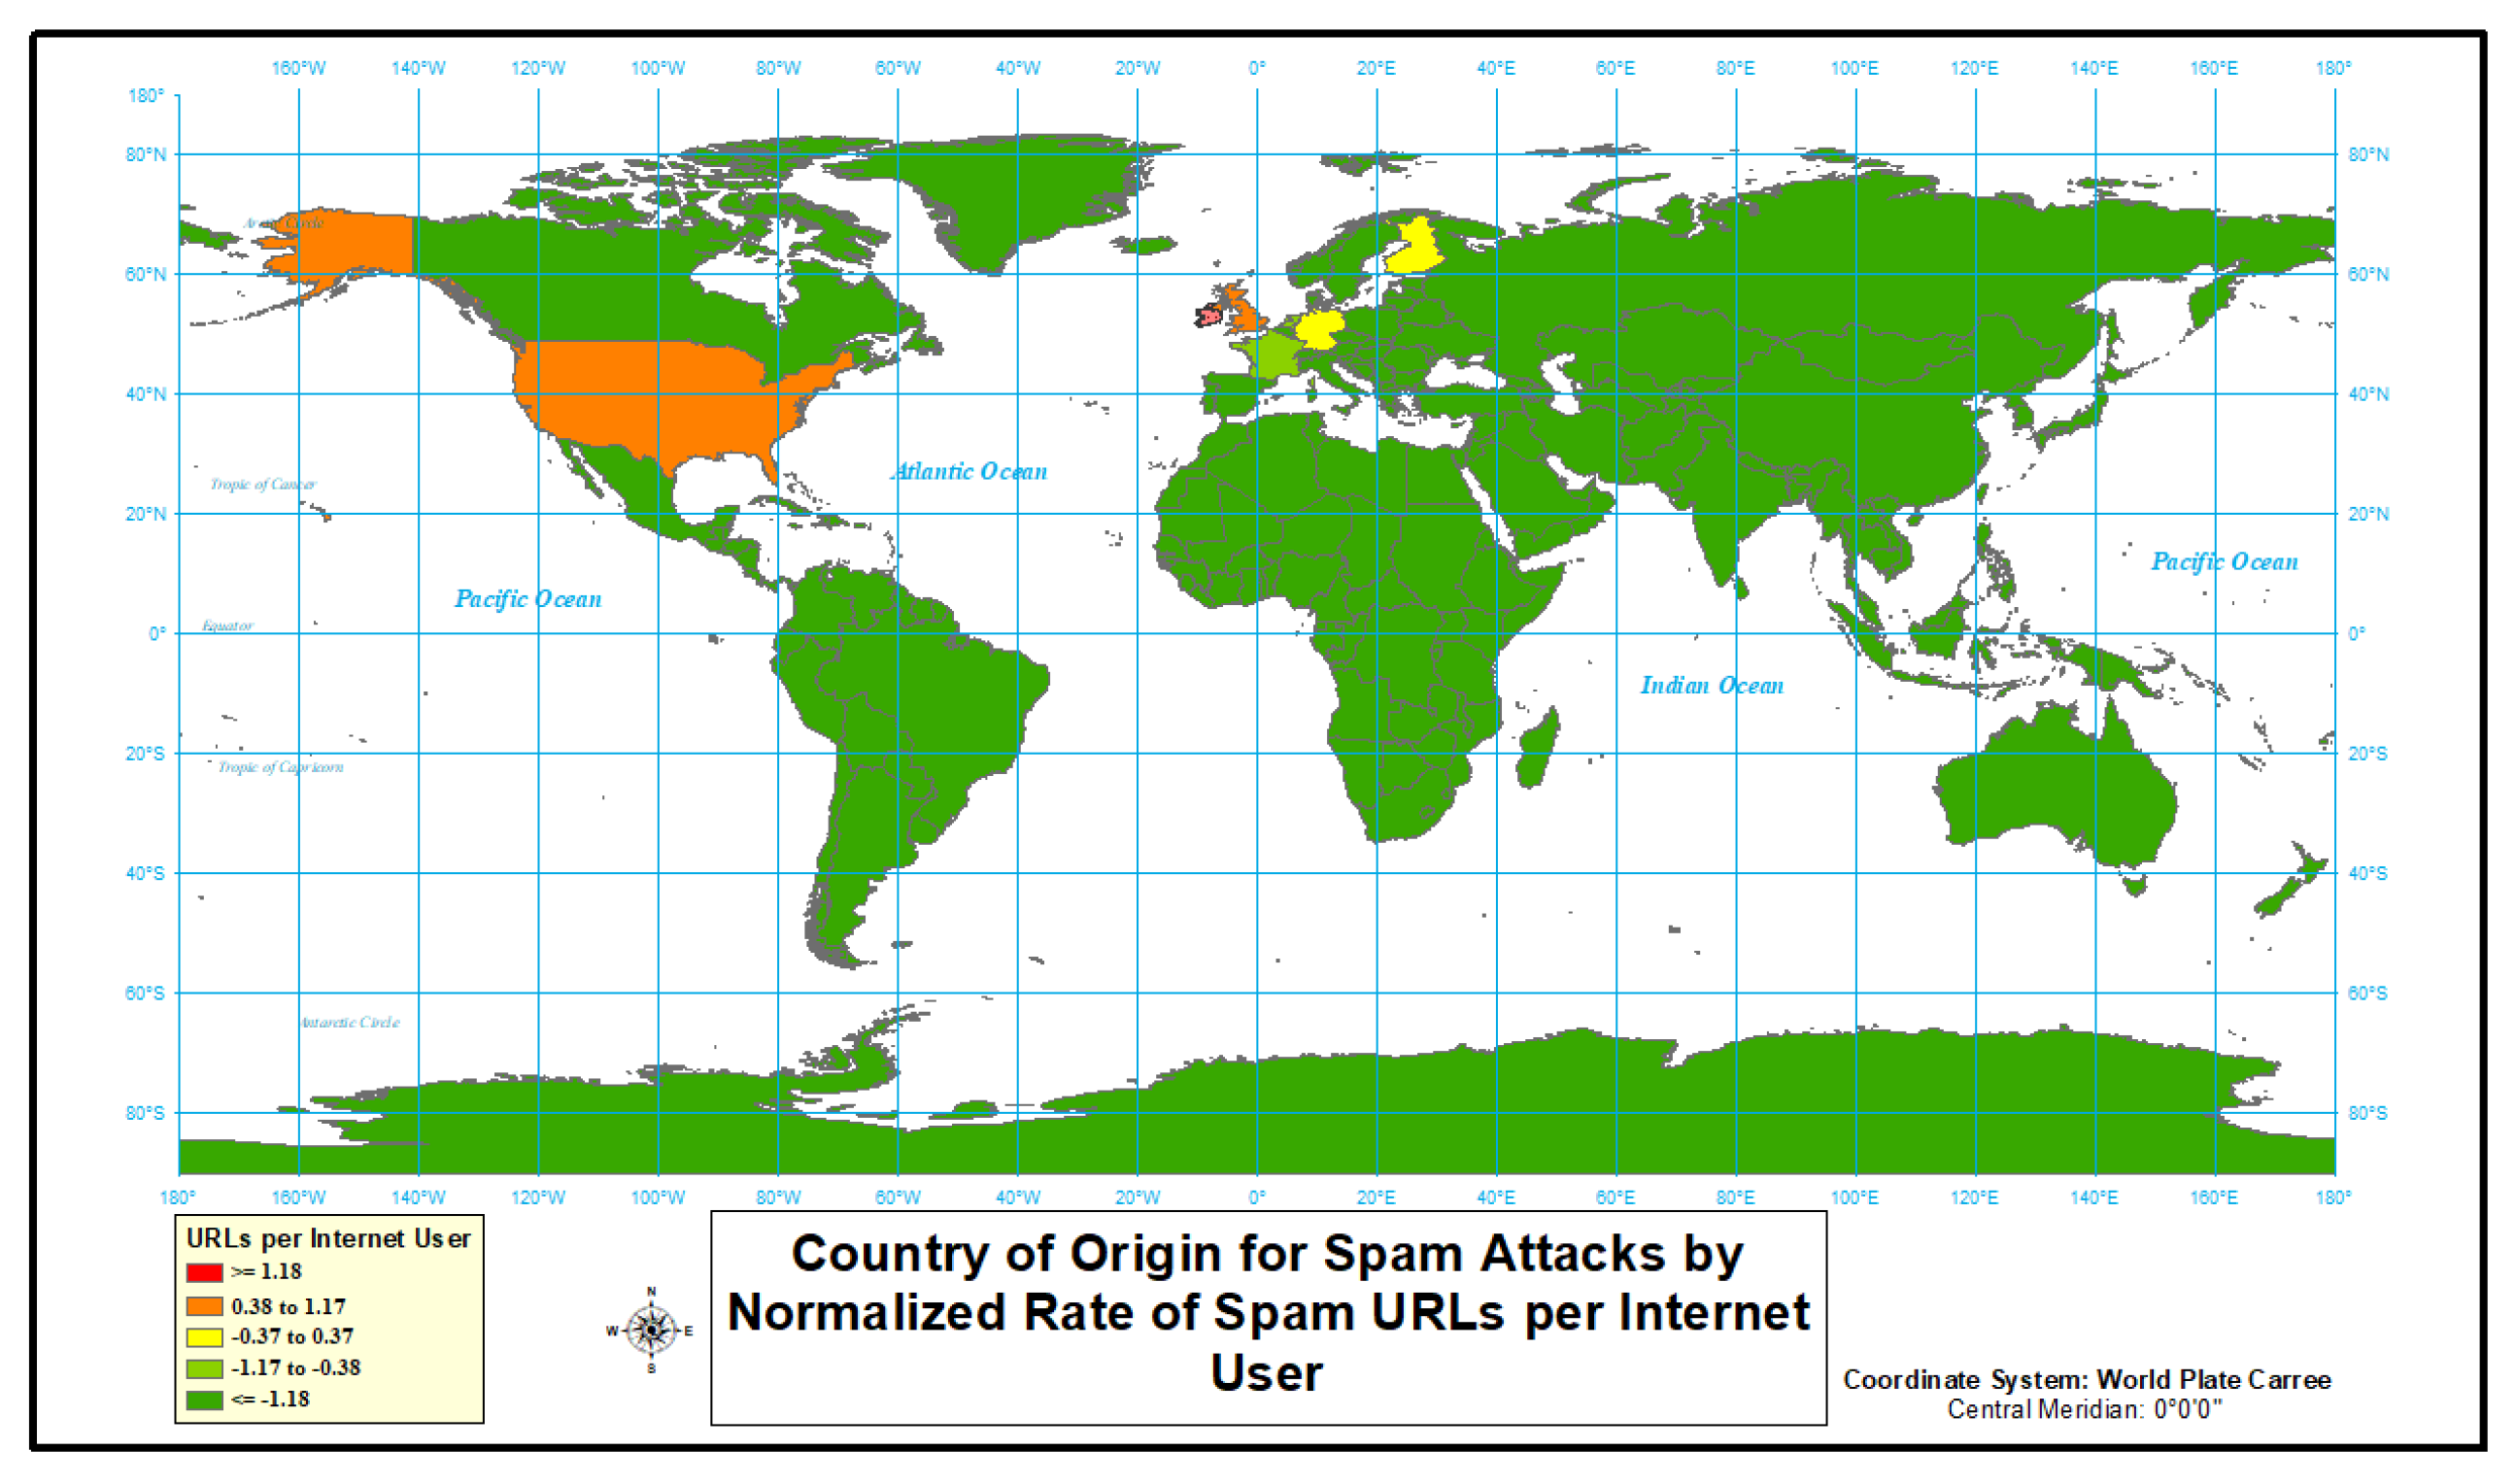
- “Red” represents normalized rates at or above 1.18 standard deviations above the mean.
- “Orange” represents normalized rates 0.38 to 1.17 standard deviations above the mean.
- “Yellow” represent normalized rates centered on the mean (plus or minus 0.37).
- “Light Green” represents normalized rates 0.38 to 1.17 standard deviations below the mean.
- “Dark Green” represents normalized rates more than 1.18 standard deviations below the mean.
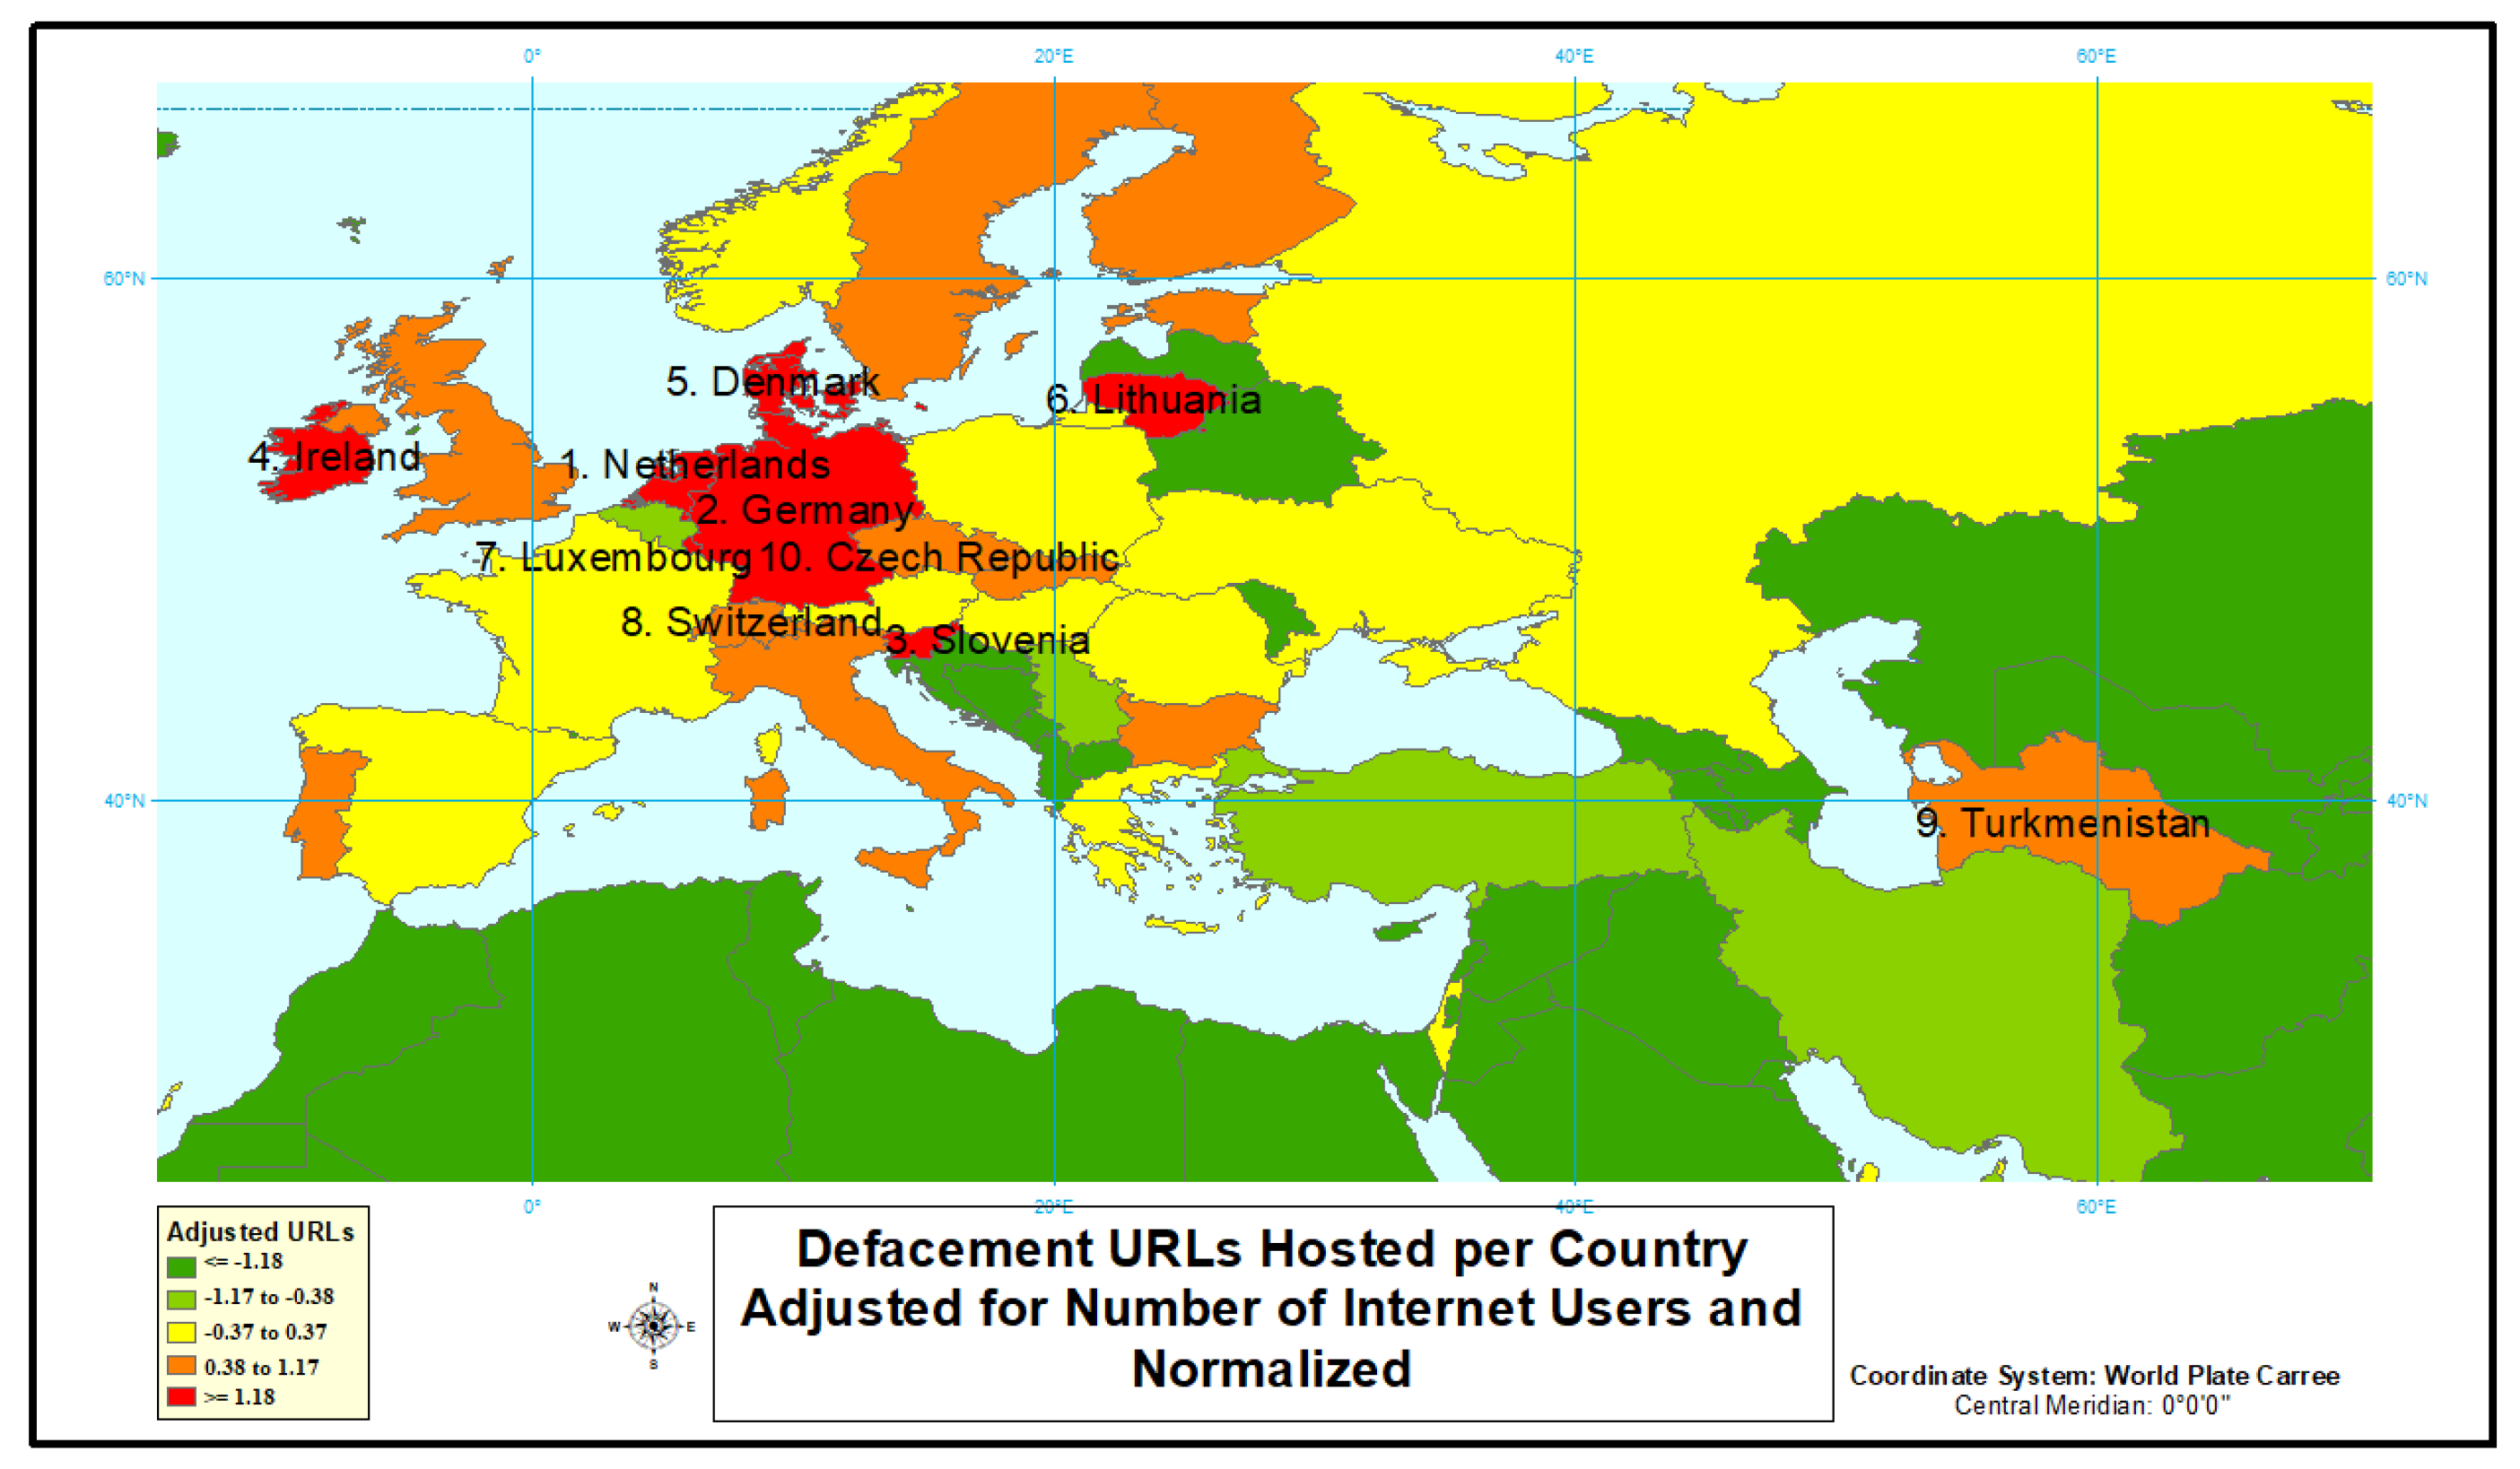
4.1.1. Defacement
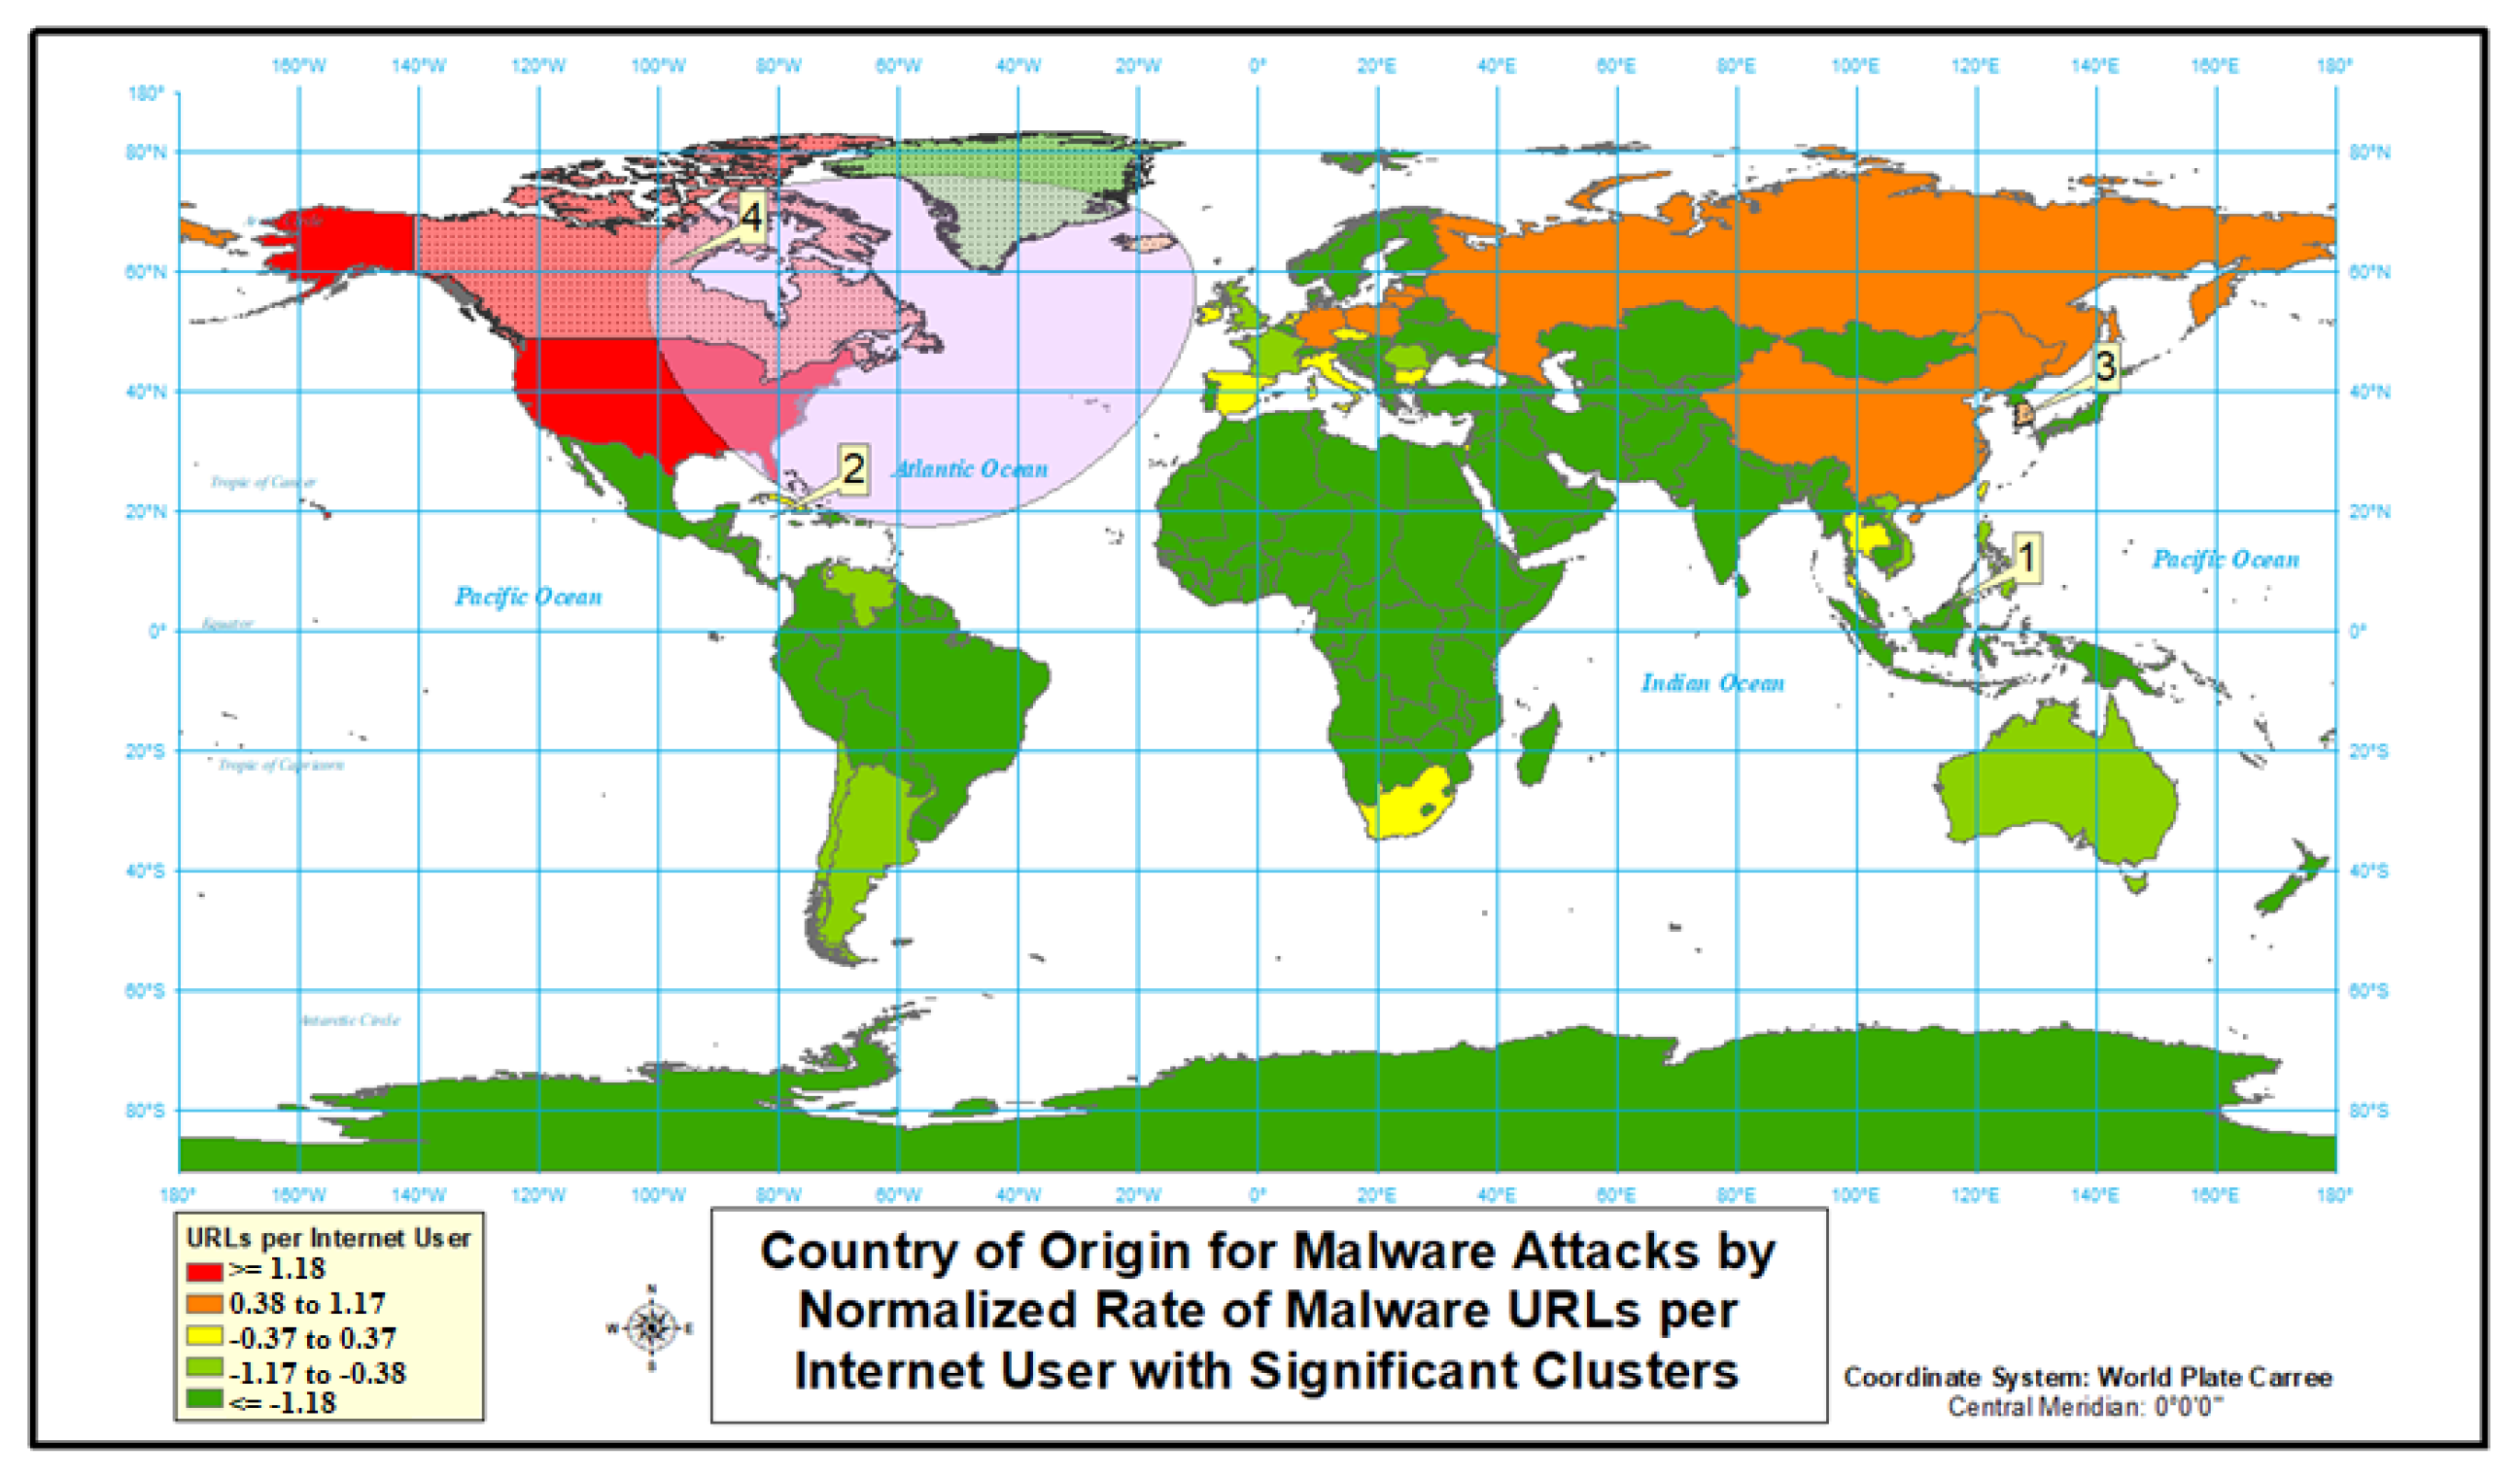
4.1.2. Malware
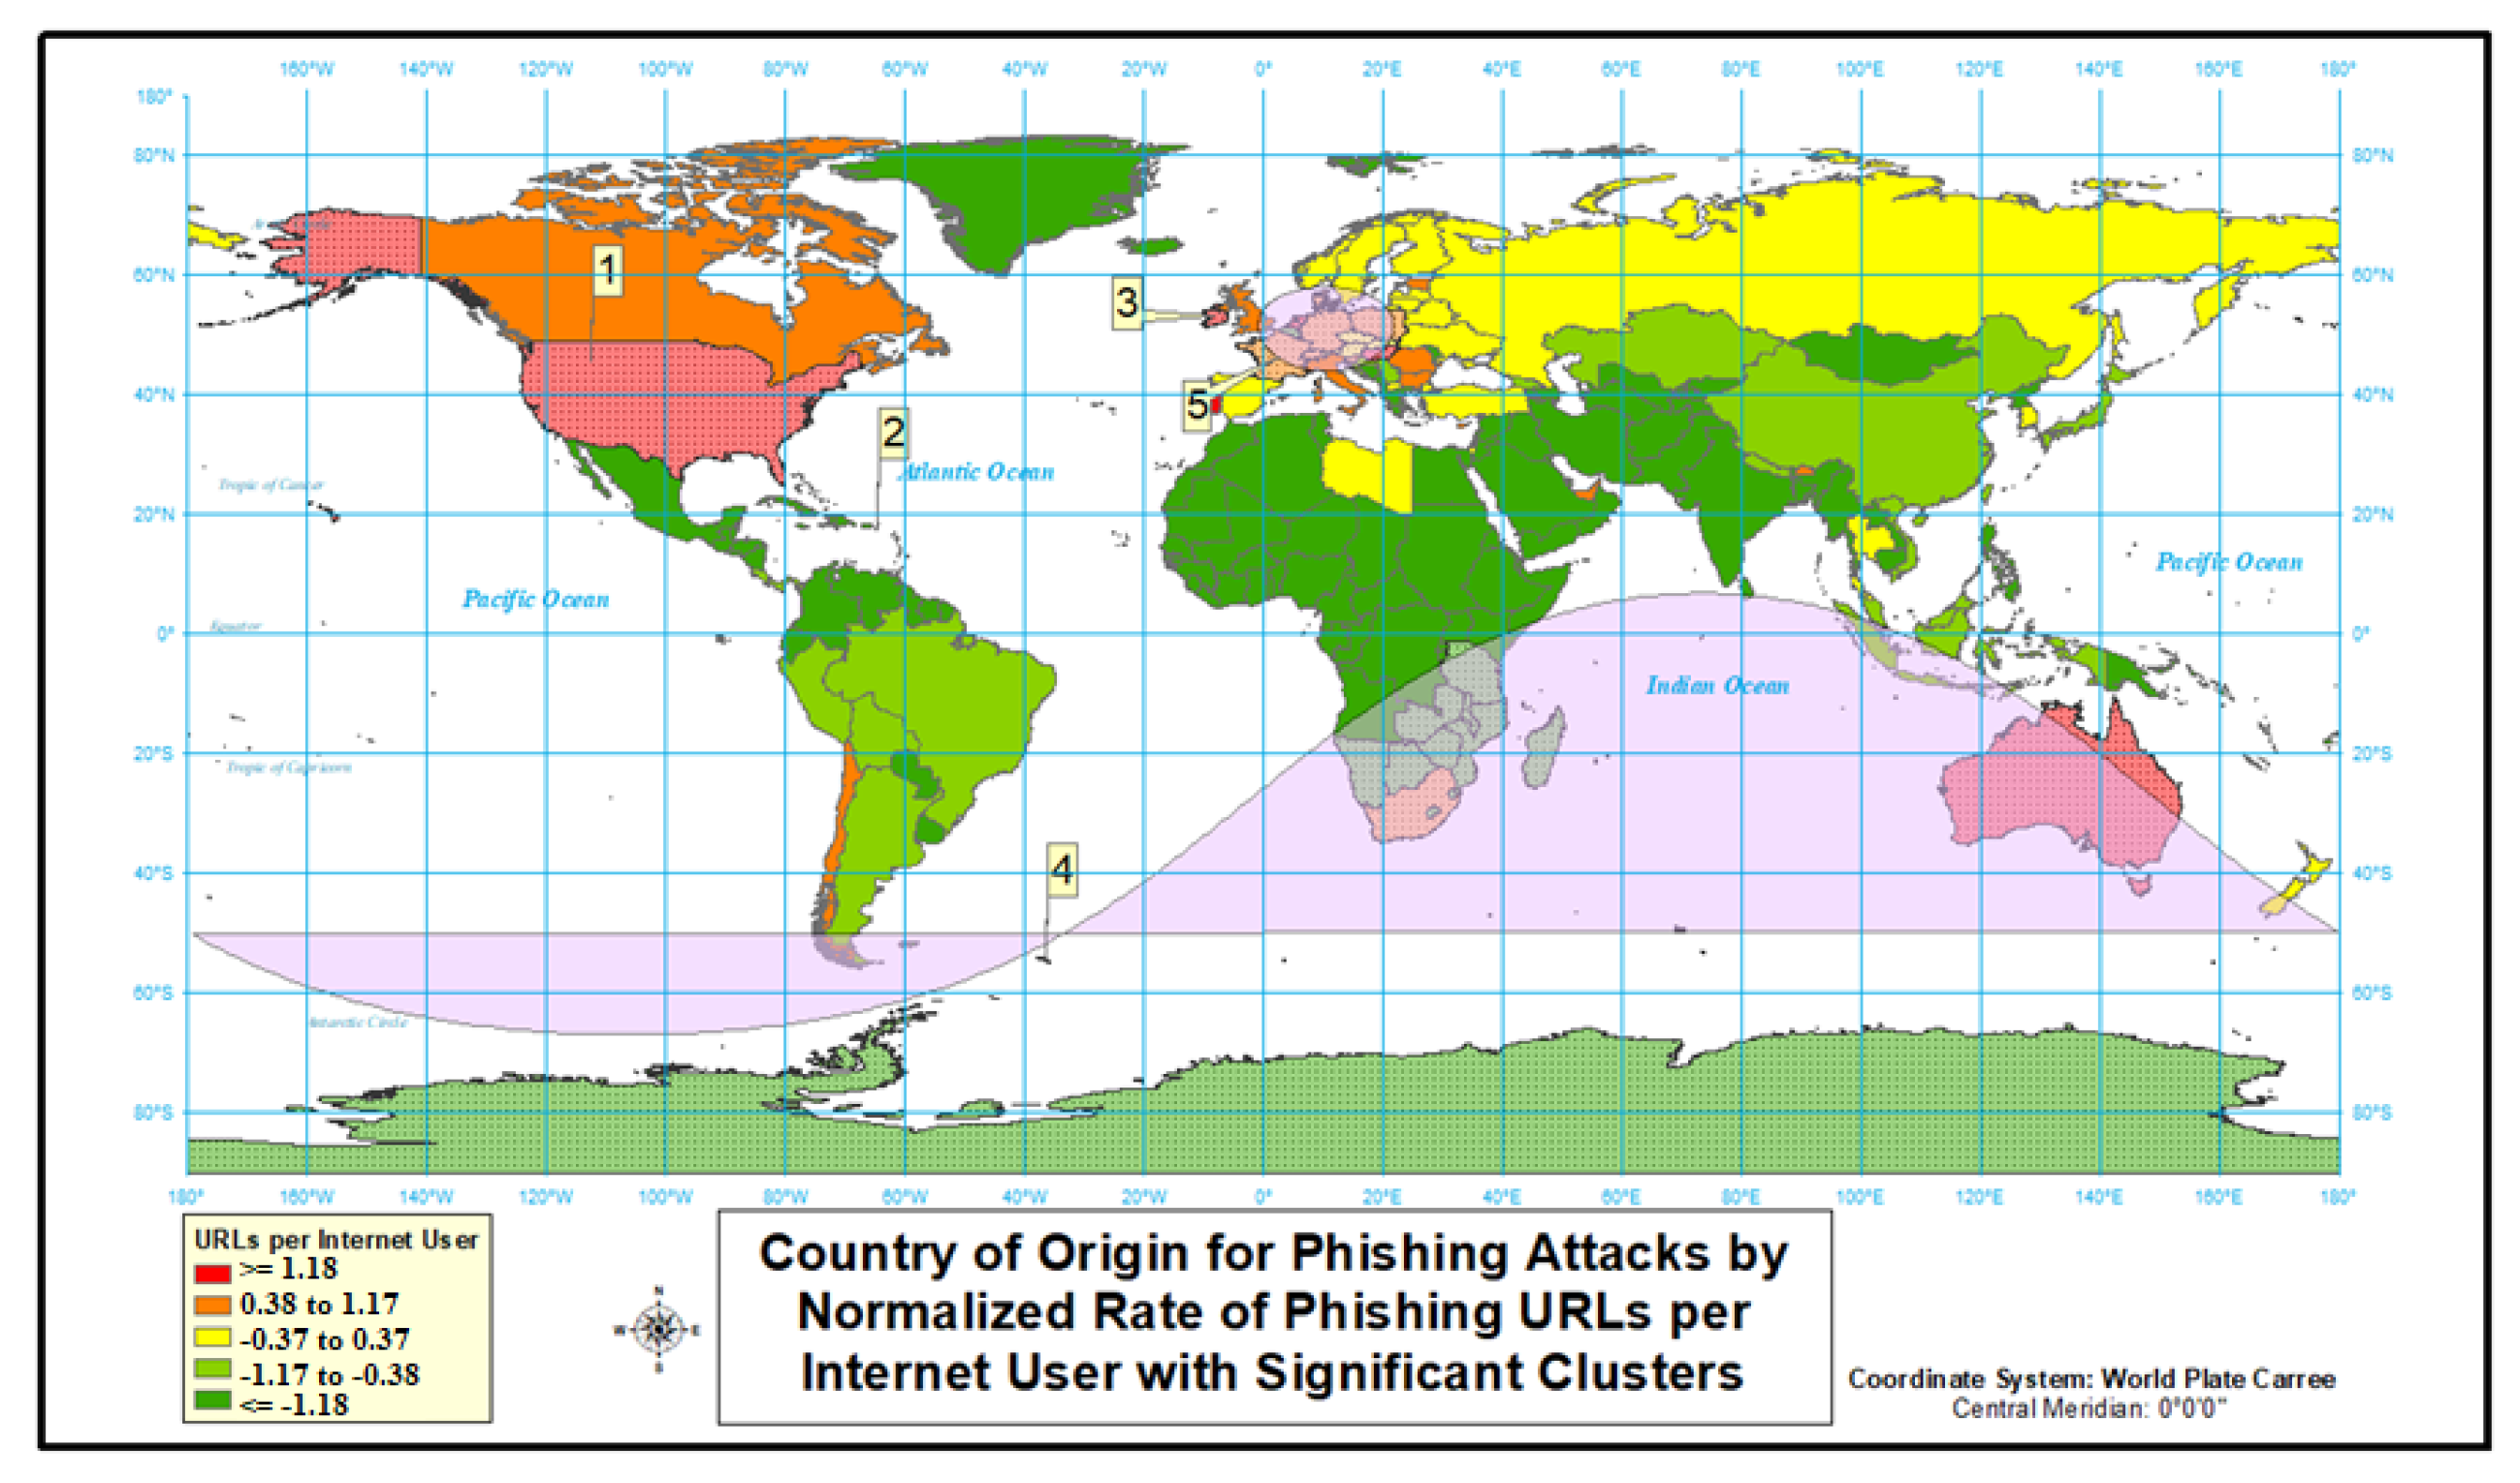
4.1.3. Phishing
4.1.4. Spam
4.2. Cyber Attacks by Relative Risk with Clusters
4.2.1. Defacement
4.2.2. Malware
4.2.3. Phishing
4.2.4. Spam
4.2.5. Total
5. Conclusions and Future Directions
- provide the feasibility of visual analytics as a cybersecurity tool;
- enable the realization that cybersecurity data analysis could be approached using multiple perspectives;
- provide the base framework for more advanced and enhanced spatial cluster analytics tools; and
- provide the recognition of the need for reliable data that can be used for analytics.
- (1)
- introduce the technical capacity of a country as an independent variable;
- (2)
- investigate the propensity of a country to defend and/or offensively react to a cyber attack;
- (3)
- perform a longitudinal study on the same data with the objective unraveling trends in risk, cyber defense, and cyber attacks; and
- (4)
- develop a formal model of the cyber attacks similar to the established epidemiology models.
Author Contributions
Funding
Conflicts of Interest
References
- Darling, M.; Heileman, G.; Gressel, G.; Ashok, A.; Poornachandran, P. A lexical approach for classifying malicious URLs. In Proceedings of the IEEE 2015 International Conference on High Performance Computing & Simulation (HPCS), Amsterdam, The Netherlands, 20–24 July 2015; pp. 195–202. [Google Scholar]
- Lallie, H.S.; Shepherd, L.A.; Nurse, J.R.; Erola, A.; Epiphaniou, G.; Maple, C.; Bellekens, X. Cyber security in the age of COVID-19: A timeline and analysis of cyber-crime and cyber-attacks during the pandemic. arXiv 2020, arXiv:2006.11929. [Google Scholar]
- Abdalrahman, G.A.; Varol, H. Defending Against Cyber-Attacks on the Internet of Things. In Proceedings of the IEEE 2019 7th International Symposium on Digital Forensics and Security (ISDFS), Barcelos, Portugal, 10–12 June 2019; pp. 1–6. [Google Scholar]
- Pivarníková, M.; Sokol, P.; Bajtoš, T. Early-Stage Detection of Cyber Attacks. Information 2020, 11, 560. [Google Scholar] [CrossRef]
- Hu, C.; Yan, J.; Wang, C. Advanced cyber-physical attack classification with extreme gradient boosting for smart transmission grids. In Proceedings of the 2019 IEEE Power & Energy Society General Meeting (PESGM), Atlanta, GA, USA, 4–8 August 2019; pp. 1–5. [Google Scholar]
- Doynikova, E.; Novikova, E.; Kotenko, I. Attacker Behaviour Forecasting Using Methods of Intelligent Data Analysis: A Comparative Review and Prospects. Information 2020, 11, 168. [Google Scholar] [CrossRef]
- Yao, Y.; Su, L.; Lu, Z.; Liu, B. STDeepGraph: Spatial-Temporal Deep Learning on Communication Graphs for Long-Term Network Attack Detection. In Proceedings of the 2019 18th IEEE International Conference On Trust, Security and Privacy in Computing And Communications/13th IEEE International Conference On Big Data Science And Engineering (TrustCom/BigDataSE), Rotorua, New Zealand, 5–8 August 2019; pp. 120–127. [Google Scholar]
- Mamun, M.S.I.; Rathore, M.A.; Lashkari, A.H.; Stakhanova, N.; Ghorbani, A.A. Detecting malicious urls using lexical analysis. In International Conference on Network and System Security; Springer: Berlin, Germany, 2016; pp. 467–482. [Google Scholar]
- Bloedorn, E.; Christiansen, A.D.; Hill, W.; Skorupka, C.; Talbot, L.M.; Tivel, J. Data Mining for Network Intrusion Detection: How to Get Started. Technical Report. Citeseer, 2001. Available online: https://www.mitre.org/sites/default/files/pdf/bloedorn_datamining.pdf (accessed on 21 December 2020).
- Kim, D.W.; Yan, P.; Zhang, J. Detecting fake anti-virus software distribution webpages. Comput. Secur. 2015, 49, 95–106. [Google Scholar] [CrossRef]
- Burmester, M.; Magkos, E.; Chrissikopoulos, V. Modeling security in cyber–physical systems. Int. J. Crit. Infrastruct. Prot. 2012, 5, 118–126. [Google Scholar] [CrossRef]
- Xie, P.; Li, J.H.; Ou, X.; Liu, P.; Levy, R. Using Bayesian networks for cyber security analysis. In Proceedings of the 2010 IEEE/IFIP International Conference on Dependable Systems & Networks (DSN), Chicago, IL, USA, 28 June–1 July 2010; pp. 211–220. [Google Scholar]
- Bou-Harb, E.; Debbabi, M.; Assi, C. A systematic approach for detecting and clustering distributed cyber scanning. Comput. Netw. 2013, 57, 3826–3839. [Google Scholar] [CrossRef]
- Michael, J.B.; Wingfield, T.C.; Wijesekera, D. Measured responses to cyber attacks using Schmitt analysis: A case study of attack scenarios for a software-intensive system. In Proceedings of the 27th Annual International Computer Software and Applications Conference, Dallas, TX, USA, 3–6 November 2003; pp. 622–626. [Google Scholar]
- Dasgupta, D. Immuno-inspired autonomic system for cyber defense. Inf. Secur. Tech. Rep. 2007, 12, 235–241. [Google Scholar] [CrossRef]
- Staniford, S.; Hoagland, J.A.; McAlerney, J.M. Practical automated detection of stealthy portscans. J. Comput. Secur. 2002, 10, 105–136. [Google Scholar] [CrossRef]
- Neri, F. Mining TCP/IP traffic for network intrusion detection by using a distributed genetic algorithm. In European Conference on Machine Learning; Springer: Berlin, Germany, 2000; pp. 313–322. [Google Scholar]
- Ahmad, S.; Baig, Z. Fuzzy-based optimization for effective detection of smart grid cyber-attacks. Int. J. Smart Grid Clean Energy 2012, 1, 15–21. [Google Scholar] [CrossRef]
- Bapiyev, I.M.; Aitchanov, B.H.; Tereikovskyi, I.A.; Tereikovska, L.A.; Korchenko, A.A. Deep neural networks in cyber attack detection systems. Int. J. Civ. Eng. Technol. (IJCIET) 2017, 8, 1086–1092. [Google Scholar]
- Karimipour, H.; Dehghantanha, A.; Parizi, R.M.; Choo, K.K.R.; Leung, H. A deep and scalable unsupervised machine learning system for cyber-attack detection in large-scale smart grids. IEEE Access 2019, 7, 80778–80788. [Google Scholar] [CrossRef]
- Mérien, T.; Bellekens, X.; Brosset, D.; Claramunt, C. A spatio-temporal entropy-based approach for the analysis of cyber attacks (demo paper). In Proceedings of the 26th ACM SIGSPATIAL International Conference on Advances in Geographic Information Systems, Seattle, WA, USA, 6–9 November 2018; pp. 564–567. [Google Scholar]
- Chen, Y.Z.; Huang, Z.G.; Xu, S.; Lai, Y.C. Spatiotemporal patterns and predictability of cyberattacks. PLoS ONE 2015, 10, e0124472. [Google Scholar] [CrossRef] [PubMed]
- Hu, Z.; Baynard, C.W.; Hu, H.; Fazio, M. GIS mapping and spatial analysis of cybersecurity attacks on a florida university. In Proceedings of the IEEE 2015 23rd International Conference on Geoinformatics, Wuhan, China, 19–21 June 2015; pp. 1–5. [Google Scholar]
- Lin, M.S.; Chiu, C.Y.; Lee, Y.J.; Pao, H.K. Malicious URL filtering—A big data application. In Proceedings of the 2013 IEEE International Conference on Big Data, Santa Clara, CA, USA, 6–9 October 2013; pp. 589–596. [Google Scholar]
- Feroz, M.N.; Mengel, S. Phishing URL detection using URL ranking. In Proceedings of the 2015 IEEE international Congress on Big Data, Santa Clara, CA, USA, 29 October–1 November 2015; pp. 635–638. [Google Scholar]
- Du, H.; Yang, S.J. Temporal and spatial analyses for large-scale cyber attacks. In Handbook of Computational Approaches to Counterterrorism; Springer: Berlin, Germany, 2013; pp. 559–578. [Google Scholar]
- Koike, H.; Ohno, K.; Koizumi, K. Visualizing cyber attacks using IP matrix. In Proceedings of the IEEE Workshop on Visualization for Computer Security (VizSEC 05), Minneapolis, MN, USA, 26 October 2005; pp. 91–98. [Google Scholar]
- Canadian Institute for Cybersecurity. URL Dataset (ISCX-URL2016). Available online: https://www.unb.ca/cic/datasets/url-2016.html (accessed on 28 April 2020).
- Central Intelligence Agency. The World FactBook. Available online: https://www.cia.gov/library/publications/the-world-factbook/fields/204rank.html (accessed on 28 April 2020).
- Kulldorff, M. SaTScan—Software for the Spatial, Temporal, and Space-Time Scan Statistics; Harvard Medical School and Harvard PilgrimHealth Care: Boston, MA, USA, 2015. [Google Scholar]
- Altman, D.G. Practical Statistics for Medical Research; Chapman and Hall: London, UK, 1991. [Google Scholar]


| Rank | Defacement | Malware | Phishing | Spam * | Total Number of Cyber Attacks |
|---|---|---|---|---|---|
| 1 | United States (18,047) | United States (5945) | United States (3168) | United Kingdom (5898) | United States (28,742) |
| 2 | Germany (15,532) | China (2053) | China (439) | United States (1582) | Germany (15,914) |
| 3 | Netherlands (4683) | Hong Kong (406) | Germany (197) | Ireland (1249) | United Kingdom (9299) |
| 4 | Italy (3466) | South Korea (271) | France (178) | Germany (110) | Netherlands (4771) |
| 5 | United Kingdom (3280) | Canada (201) | Hong Kong (117) | France (66) | China (3746) |
| 6 | Russia (2054) | Brunei (143) | United Kingdom (113) | Netherlands (12) | Italy (3575) |
| 7 | Brazil (2003) | Russia (135) | Australia (109) | Finland (8) | Russia (2264) |
| 8 | France (1907) | Germany (75) | South Africa (103) | Italy (4) | France (2157) |
| 9 | Australia (1748) | Poland (60) | Italy (83) | Ireland (2140) | |
| 10 | Spain (1570) | Italy (22) | Ireland (81) | Brazil (2042) | |
| 11 | China (1254) | Cayman Islands (20) | Russia (75) | Australia (1860) | |
| 12 | Denmark (1026) | South Africa (18) | Poland (74) | Spain (1621) | |
| 13 | Poland (955) | Philippines (11) | Canada (67) | Hong Kong (1214) | |
| 14 | Czech Republic (862) | Taiwan (11) | Netherlands (67) | Poland (1089) | |
| 15 | Switzerland (821) | Netherlands (9) | Singapore (57) | Denmark (1041) | |
| 16 | Ireland (809) | Spain (9) | Spain (42) | Canada (953) | |
| 17 | Hong Kong (691) | United Kingdom (8) | Brazil (39) | Czech Republic (878) | |
| 18 | Canada (685) | Thailand (8) | South Korea (36) | Switzerland (841) | |
| 19 | Sweden (587) | Singapore (7) | Turkey (35) | Sweden (603) | |
| 20 | Ukraine (565) | France (6) | Thailand (34) | Portugal (582) |
| Country | Internet Users | Population | URLs | Adjusted URLs | Normalized Adjusted URLs | URLs Rank | Adjusted URLs Rank |
|---|---|---|---|---|---|---|---|
| Netherlands | 15,385,203 | 16,981.285 | 4683 | 30.43833741 | 2.279717741 | 3 | 1 |
| Germany | 72,365,643 | 82,193.77 | 15,532 | 21.46322392 | 1.88950996 | 2 | 2 |
| Slovenia | 1,493,382 | 2074.205 | 315 | 21.09306259 | 1.669478315 | 29 | 3 |
| Ireland | 4,069,432 | 4695.79 | 809 | 19.87992427 | 1.509301626 | 16 | 4 |
| Denmark | 5,424,169 | 5711.346 | 1026 | 18.91533984 | 1.380538791 | 12 | 5 |
| Lithuania | 2,122,884 | 2889.555 | 397 | 18.70097471 | 1.271305716 | 28 | 6 |
| Luxembourg | 567,698 | 579.266 | 95 | 16.73424955 | 1.17543931 | 43 | 7 |
| Switzerland | 7,312,744 | 8379.915 | 821 | 11.22697581 | 1.08930797 | 15 | 8 |
| Turkmenistan | 951,925 | 5662.371 | 102 | 10.71512987 | 1.010580622 | 40 | 9 |
| Czech Republic | 8,141,303 | 10,618.868 | 862 | 10.58798573 | 0.937665596 | 14 | 10 |
| Country | Internet Users | Population | URLs | Adjusted URLs | Normalized Adjusted URLs | URLs Rank | Adjusted URLs Rank |
|---|---|---|---|---|---|---|---|
| Cayman Islands | 45,242 | 62.564 | 20 | 44.20671058 | 2.146324055 | 10 | 1 |
| Brunei | 410800 | 419.791 | 143 | 34.81012658 | 1.734651522 | 5 | 2 |
| British Virgin Islands | 14,600 | 29.355 | 3 | 20.54794521 | 1.499446023 | 29 | 3 |
| United States | 246,809,221 | 323,015.992 | 5945 | 2.408743067 | 1.326381463 | 1 | 4 |
| Canada | 31,770,034 | 36,382.942 | 201 | 0.632671655 | 1.185882285 | 4 | 5 |
| South Korea | 44,153,000 | 50,983.446 | 271 | 0.613774828 | 1.06555643 | 3 | 6 |
| Iceland | 329,967 | 332.209 | 2 | 0.606121218 | 0.958958568 | 34 | 7 |
| Latvia | 1570374 | 1974.265 | 6 | 0.382074589 | 0.862277135 | 22 | 8 |
| China | 736,789,960 | 1,421,292.894 | 2053 | 0.278641148 | 0.773053962 | 2 | 9 |
| Poland | 28,237,820 | 37,989.218 | 60 | 0.212480992 | 0.689599853 | 8 | 10 |
| Country | Internet Users | Population | URLs | Adjusted URLs | Normalized Adjusted URLs | URLs Rank | Adjusted URLs Rank |
|---|---|---|---|---|---|---|---|
| British Virgin Islands | 14,600 | 29.355 | 37 | 253.4246575 | 2.385307593 | 17 | 1 |
| Seychelles | 52,664 | 95.711 | 3 | 5.696490962 | 2.010591708 | 52 | 2 |
| Ireland | 4,069,432 | 4695.79 | 81 | 1.990449773 | 1.8011937 | 9 | 3 |
| United States | 246,809,221 | 323,015.992 | 3168 | 1.283582513 | 1.64983783 | 1 | 4 |
| Singapore | 4,683,200 | 5653.625 | 57 | 1.217116502 | 1.528937803 | 14 | 5 |
| Australia | 20,288,409 | 24,262.71 | 109 | 0.537252576 | 1.426987084 | 6 | 6 |
| Netherlands | 15,385,203 | 16,981.285 | 67 | 0.435483367 | 1.338027808 | 13 | 7 |
| Hungary | 7,826,695 | 9752.97 | 31 | 0.396080338 | 1.258554954 | 21 | 8 |
| Portugal | 7,629,560 | 10,325.54 | 27 | 0.353886725 | 1.186322712 | 23 | 9 |
| South Africa | 29,322,380 | 56,207.649 | 103 | 0.35126753 | 1.119800855 | 7 | 10 |
| Country | Internet Users | Population | URLs | Adjusted URLs | Normalized Adjusted URLs | URLs Rank | Adjusted URLs Rank |
|---|---|---|---|---|---|---|---|
| Ireland | 4,069,432 | 4695.79 | 1249 | 30.69224403 | 1.43420016 | 3 | 1 |
| United Kingdom | 61,064,454 | 66,297.944 | 5898 | 9.658646911 | 0.852495034 | 1 | 2 |
| United States | 246,809,221 | 323,015.992 | 1582 | 0.640980914 | 0.472789121 | 2 | 3 |
| Finland | 4,822,132 | 5497.714 | 8 | 0.165901722 | 0.152505974 | 7 | 4 |
| Germany | 72,365,643 | 82,193.77 | 110 | 0.152005835 | −0.15250597 | 4 | 5 |
| France | 57,226,585 | 64,667.59 | 66 | 0.115331013 | −0.47278912 | 5 | 6 |
| Netherlands | 15,385,203 | 16,981.285 | 12 | 0.077997021 | −0.85249503 | 6 | 7 |
| Italy | 38,025,661 | 60,663.068 | 4 | 0.010519212 | −1.43420016 | 8 | 8 |
| Cluster | Location(s) | Observed Cases/Expected Cases | Cluster Relative Risk | Cluster’s p-Value | Cluster’s Internet Users |
|---|---|---|---|---|---|
| 1 | Andorra; Austria; Belgium; Channel Islands; Croatia; Czech Republic; Denmark; Estonia; Faroe Islands; Finland; France; Germany; Hungary; Iceland; Ireland; Italy; Latvia; Liechtenstein; Lithuania; Luxembourg; Isle of Man; Monaco; Netherlands; Norway; Poland; Portugal; San Marino; Slovakia; Slovenia; Spain; Sweden; Switzerland; United Kingdom | 5.58 | 11.21 | 1 × 10 | 398,355,738 |
| 2 | United States | 4.27 | 5.40 | 1 × 10 | 243,004,928 |
| 3 | Australia | 4.79 | 4.89 | 1 × 10 | 20,996,948 |
| 4 | Hong Kong | 6.14 | 6.19 | 1 × 10 | 6,477,174 |
| 5 | Turkmenistan | 4.88 | 4.88 | 1 × 10 | 1,203,254 |
| 6 | Singapore | 2.42 | 2.43 | 1 × 10 | 4,774,486 |
| 7 | Russia | 1.07 | 1.07 | 0.426 | 110,423,808 |
| 8 | Oman | 1.28 | 1.28 | 0.999 | 3,591,884 |
| Country | Internet Users | Defacement Relative Risk |
|---|---|---|
| Netherlands | 15,826,558 | 18.17 |
| Germany | 69,371,542 | 16.26 |
| Ireland | 3,968,882 | 11.85 |
| Slovenia | 1,636,340 | 11.12 |
| Denmark | 5,545,717 | 10.79 |
| Lithuania | 2,242,873 | 10.24 |
| Luxembourg | 566,696 | 9.66 |
| Hong Kong | 6,477,174 | 6.19 |
| Switzerland | 7,852,818 | 6.07 |
| Czech Republic | 8,359,173 | 5.99 |
| Cluster | Location(s) | Observed Cases/ Expected Cases | Cluster Relative Risk | Cluster’s p-Value | Cluster’s Internet Users |
|---|---|---|---|---|---|
| 1 | United States | 10.42 | 26.277 | 1 × 10 | 243,004,928 |
| 2 | Hong Kong | 26.71 | 27.86 | 1 × 10 | 6,477,174 |
| 3 | Brunei | 152.99 | 155.32 | 1 × 10 | 398,256 |
| 4 | South Korea | 2.38 | 2.42 | 1 × 10 | 48,485,256 |
| Country | Internet Users | Malware Counts | Malware Relative Risk |
|---|---|---|---|
| Cayman Islands | 50,721 | 20 | 168.36 |
| Brunei | 398,256 | 143 | 155.32 |
| Hong Kong | 6,477,174 | 406 | 27.86 |
| United States | 243,004,931 | 5945 | 26.28 |
| Iceland | 326,429 | 2 | 2.61 |
| Canada | 33,726,987 | 201 | 2.57 |
| South Korea | 48,485,257 | 271 | 2.42 |
| Latvia | 1,605,472 | 6 | 1.59 |
| China | 831,461,020 | 2053 | 1.07 |
| Poland | 28,868,007 | 60 | 0.88 |
| Cluster | Location(s) | Observed Cases/ Expected Cases | Cluster Relative Risk | Cluster’s p-Value | Cluster’s Internet Users |
|---|---|---|---|---|---|
| 1 | United States | 9.52 | 20.94 | 1 × 10 | 243,004,928 |
| 2 | Andorra; Austria; Belgium; Channel Islands; Croatia; Czech Republic; Denmark; France; Germany; Hungary; Ireland; Italy; Liechtenstein; Luxembourg; Isle of Man; Monaco; Netherlands; Poland; San Marino; Slovakia; Slovenia; Switzerland; United Kingdom | 2.01 | 2.20 | 1 × 10 | 326,542,990 |
| 3 | Hong Kong | 13.19 | 13.45 | 1 × 10 | 6,477,174 |
| 4 | Singapore | 8.72 | 8.80 | 1 × 10 | 4,774,486 |
| 5 | Australia | 3.79 | 3.85 | 1 × 10 | 20,996,948 |
| 6 | South Africa | 2.38 | 2.41 | 1.03 × 10 | 31,571,836 |
| 7 | Seychelles | 38.95 | 38.97 | 0.015 | 56,249 |
| Country | Internet Users | Phishing Count | Phishing Relative Risk |
|---|---|---|---|
| Seychelles | 56,249 | 3 | 38.97 |
| United States | 243,004,931 | 3168 | 20.94 |
| Ireland | 3,968,882 | 81 | 15.11 |
| Hong Kong | 6,477,174 | 117 | 13.45 |
| Singapore | 4,774,486 | 57 | 8.80 |
| Australia | 20,996,949 | 109 | 3.85 |
| Netherlands | 15,826,558 | 67 | 3.12 |
| Hungary | 7,485,404 | 31 | 3.04 |
| Portugal | 7,619,216 | 27 | 2.60 |
| France | 52,057,410 | 178 | 2.55 |
| Cluster | Location(s) | Observed Cases/ Expected Cases | Cluster Relative Risk | Cluster’s p-Value | Cluster’s Internet Users |
|---|---|---|---|---|---|
| 1 | Ireland; Isle of Man; United Kingdom | 48.5 | 238.85 | 1 × 10 | 66,699,998 |
| 2 | United States | 2.9 | 3.36 | 1 × 10 | 243,004,928 |
| Country | Internet Users | Spam Count | Spam Relative Risk |
|---|---|---|---|
| Ireland | 3,968,882 | 1249 | 165.34 |
| United Kingdom | 62,731,115 | 5898 | 123.34 |
| United States | 243,004,931 | 1582 | 3.36 |
| Finland | 4,808,850 | 8 | 0.75 |
| Germany | 69,371,542 | 110 | 0.71 |
| France | 52,057,410 | 66 | 0.57 |
| Netherlands | 15,826,558 | 12 | 0.34 |
| Italy | 37,186,461 | 4 | 0.05 |
| Cluster | Location(s) | Observed Cases/ Expected Cases | Cluster Relative Risk | Cluster’s p-Value | Cluster’s Internet Users |
|---|---|---|---|---|---|
| 1 | Andorra; Austria; Belgium; Channel Islands; Croatia; Czech Republic; Denmark; Estonia; Faroe Islands; Finland; France; Germany; Hungary; Iceland; Ireland; Italy; Latvia; Liechtenstein; Lithuania; Luxembourg; Isle of Man; Monaco; Netherlands; Norway; Poland; Portugal; San Marino; Slovakia; Slovenia; Spain; Sweden; Switzerland; United Kingdom | 5.09 | 9.2 | 1 × 10 | 398,355,738 |
| 2 | United States | 5.07 | 6.86 | 1 × 10 | 243,004,928 |
| 3 | Hong Kong | 8.04 | 8.13 | 1 × 10 | 6,477,174 |
| 4 | Australia | 3.8 | 3.86 | 1 × 10 | 20,996,948 |
| 5 | Brunei | 15.4 | 15.43 | 1 × 10 | 398,256 |
| 6 | Singapore | 2.38 | 2.39 | 1 × 10 | 4,774,486 |
| 7 | Turkmenistan | 3.64 | 3.64 | 1 × 10 | 1,203,254 |
| Country | Internet Users | Total Attack Count | Total Attack Relative Risk |
|---|---|---|---|
| Ireland | 3,968,882 | 2140 | 23.65 |
| Cayman Islands | 50,721 | 20 | 16.92 |
| Brunei | 398,256 | 143 | 15.43 |
| Netherlands | 15,826,558 | 4771 | 13.57 |
| Germany | 69,371,542 | 15,914 | 11.64 |
| Slovenia | 1,636,340 | 320 | 8.41 |
| Hong Kong | 6,477,174 | 1214 | 8.13 |
| Denmark | 5,545,717 | 1041 | 8.13 |
| Lithuania | 2,242,873 | 402 | 7.72 |
| Luxembourg | 566,696 | 96 | 7.27 |
Publisher’s Note: MDPI stays neutral with regard to jurisdictional claims in published maps and institutional affiliations. |
© 2020 by the authors. Licensee MDPI, Basel, Switzerland. This article is an open access article distributed under the terms and conditions of the Creative Commons Attribution (CC BY) license (http://creativecommons.org/licenses/by/4.0/).
Share and Cite
Amin, R.W.; Sevil, H.E.; Kocak, S.; Francia, G., III; Hoover, P. The Spatial Analysis of the Malicious Uniform Resource Locators (URLs): 2016 Dataset Case Study. Information 2021, 12, 2. https://doi.org/10.3390/info12010002
Amin RW, Sevil HE, Kocak S, Francia G III, Hoover P. The Spatial Analysis of the Malicious Uniform Resource Locators (URLs): 2016 Dataset Case Study. Information. 2021; 12(1):2. https://doi.org/10.3390/info12010002
Chicago/Turabian StyleAmin, Raid W., Hakki Erhan Sevil, Salih Kocak, Guillermo Francia, III, and Philip Hoover. 2021. "The Spatial Analysis of the Malicious Uniform Resource Locators (URLs): 2016 Dataset Case Study" Information 12, no. 1: 2. https://doi.org/10.3390/info12010002
APA StyleAmin, R. W., Sevil, H. E., Kocak, S., Francia, G., III, & Hoover, P. (2021). The Spatial Analysis of the Malicious Uniform Resource Locators (URLs): 2016 Dataset Case Study. Information, 12(1), 2. https://doi.org/10.3390/info12010002