Methodological Approach towards Evaluating the Effects of Non-Driving Related Tasks during Partially Automated Driving


 ,
,  ,
, 
Abstract
1. Introduction
1.1. Theoretical Background
1.2. Examining the Effects of NDRTs during PAD
1.3. Developing a Standardized Methodology to Evaluate NDRT Execution during PAD
1.4. Objectives of the Present Research Project
- The first two studies took place in a driving simulator to determine the potential for a new test protocol to assess the effects of NDRT execution during PAD.
- In the second simulator study, the new test protocol was also extended to other relevant aspects, such as (in-vehicle) display locations.
- The third study was conducted in a partially automated vehicle to validate the test protocol in a real vehicle on a closed test track. The main goal was to determine whether the test protocol was applicable to a real driving environment.
- Research question 1 (RQ1): Can the test protocol sensitively detect differences, as they are expected based on the literature, in the drivers’ supervisory and take-over capabilities during PAD depending on various influencing factors?
- ○
- Research question 1a (RQ1a): Is the new test protocol sensitive to the effects of visual-manual NDRTs with varying distractive potentials on the drivers’ supervisory and take-over capabilities during PAD?
- ○
- Research question 1b (RQ1b): Is the new test protocol sensitive to the effects of (in-vehicle) display locations with varying proximity to the driving scene on the drivers’ supervisory and take-over capabilities during PAD?
- Research question 2 (RQ2): What parameters are minimally necessary and sufficient to sensitively capture and evaluate the take-over and supervisory capabilities of the drivers in light of these aspects?
2. Test Protocol Development
2.1. Driving Scenario and Take-Over Situations
2.1.1. Driving Simulator Implementation
2.1.2. Test Track Implementation
2.2. Independent Variables
2.2.1. Non-Driving Related Tasks
2.2.2. Display Locations
2.2.3. Driving Simulator Implementation
2.2.4. Test Track Implementation
2.3. Dependent Variables
- the mean gaze duration towards the NDRT
- the total gaze duration towards the NDRT
- the maximum gaze duration towards the NDRT
- the number of gazes towards the NDRT
- the number of transitions between the driving scene and NDRT AOIs
- Reaction time—The time between the beginning of a take-over situation until the participants’ initial reaction (braking or steering).
- Number of crashes—The number of collisions with guardrails (lateral) and the lead vehicle (longitudinal).
- Minimal distance to the lead vehicle at initial reaction—The distance between the two vehicles when participants initially reacted (braking). Applies only to the lead vehicle deceleration take-over situation.
- Maximal brake pressure—The highest administered brake pressure during the initial braking interval. Applies only to lead vehicle deceleration.
- Maximal steering angle—The greatest administered steering angle during the initial steering interval. Applies only to ego-vehicle drifting.
2.3.1. Driving Simulator and Test Track Implementation
2.4. Equipment and Materials
2.4.1. Driving Simulator Implementation
2.4.2. Test Track Implementation
2.5. Experimental Design and Procedure
2.5.1. Driving Simulator Implementation
2.5.2. Test Track Implementation
2.6. Data Preparation and Analysis
- Driving scene—Gazes through the windshield, directed towards the driving scene
- NDRT—Gazes inside the vehicle, towards where NDRTs were executed (i.e., towards the head unit in the first and third study or to different locations in the second study)
- Instrument cluster + steering wheel—Gazes inside the vehicle, towards the instrument cluster and steering wheel
- Vehicle interior—Gazes inside the vehicle that were not directed to the NDRT or other relevant locations (e.g., gazes to the researcher in the passengers’ seat during the third study)
2.6.1. Driving Simulator Implementation
2.6.2. Test Track Implementation
2.7. Participants
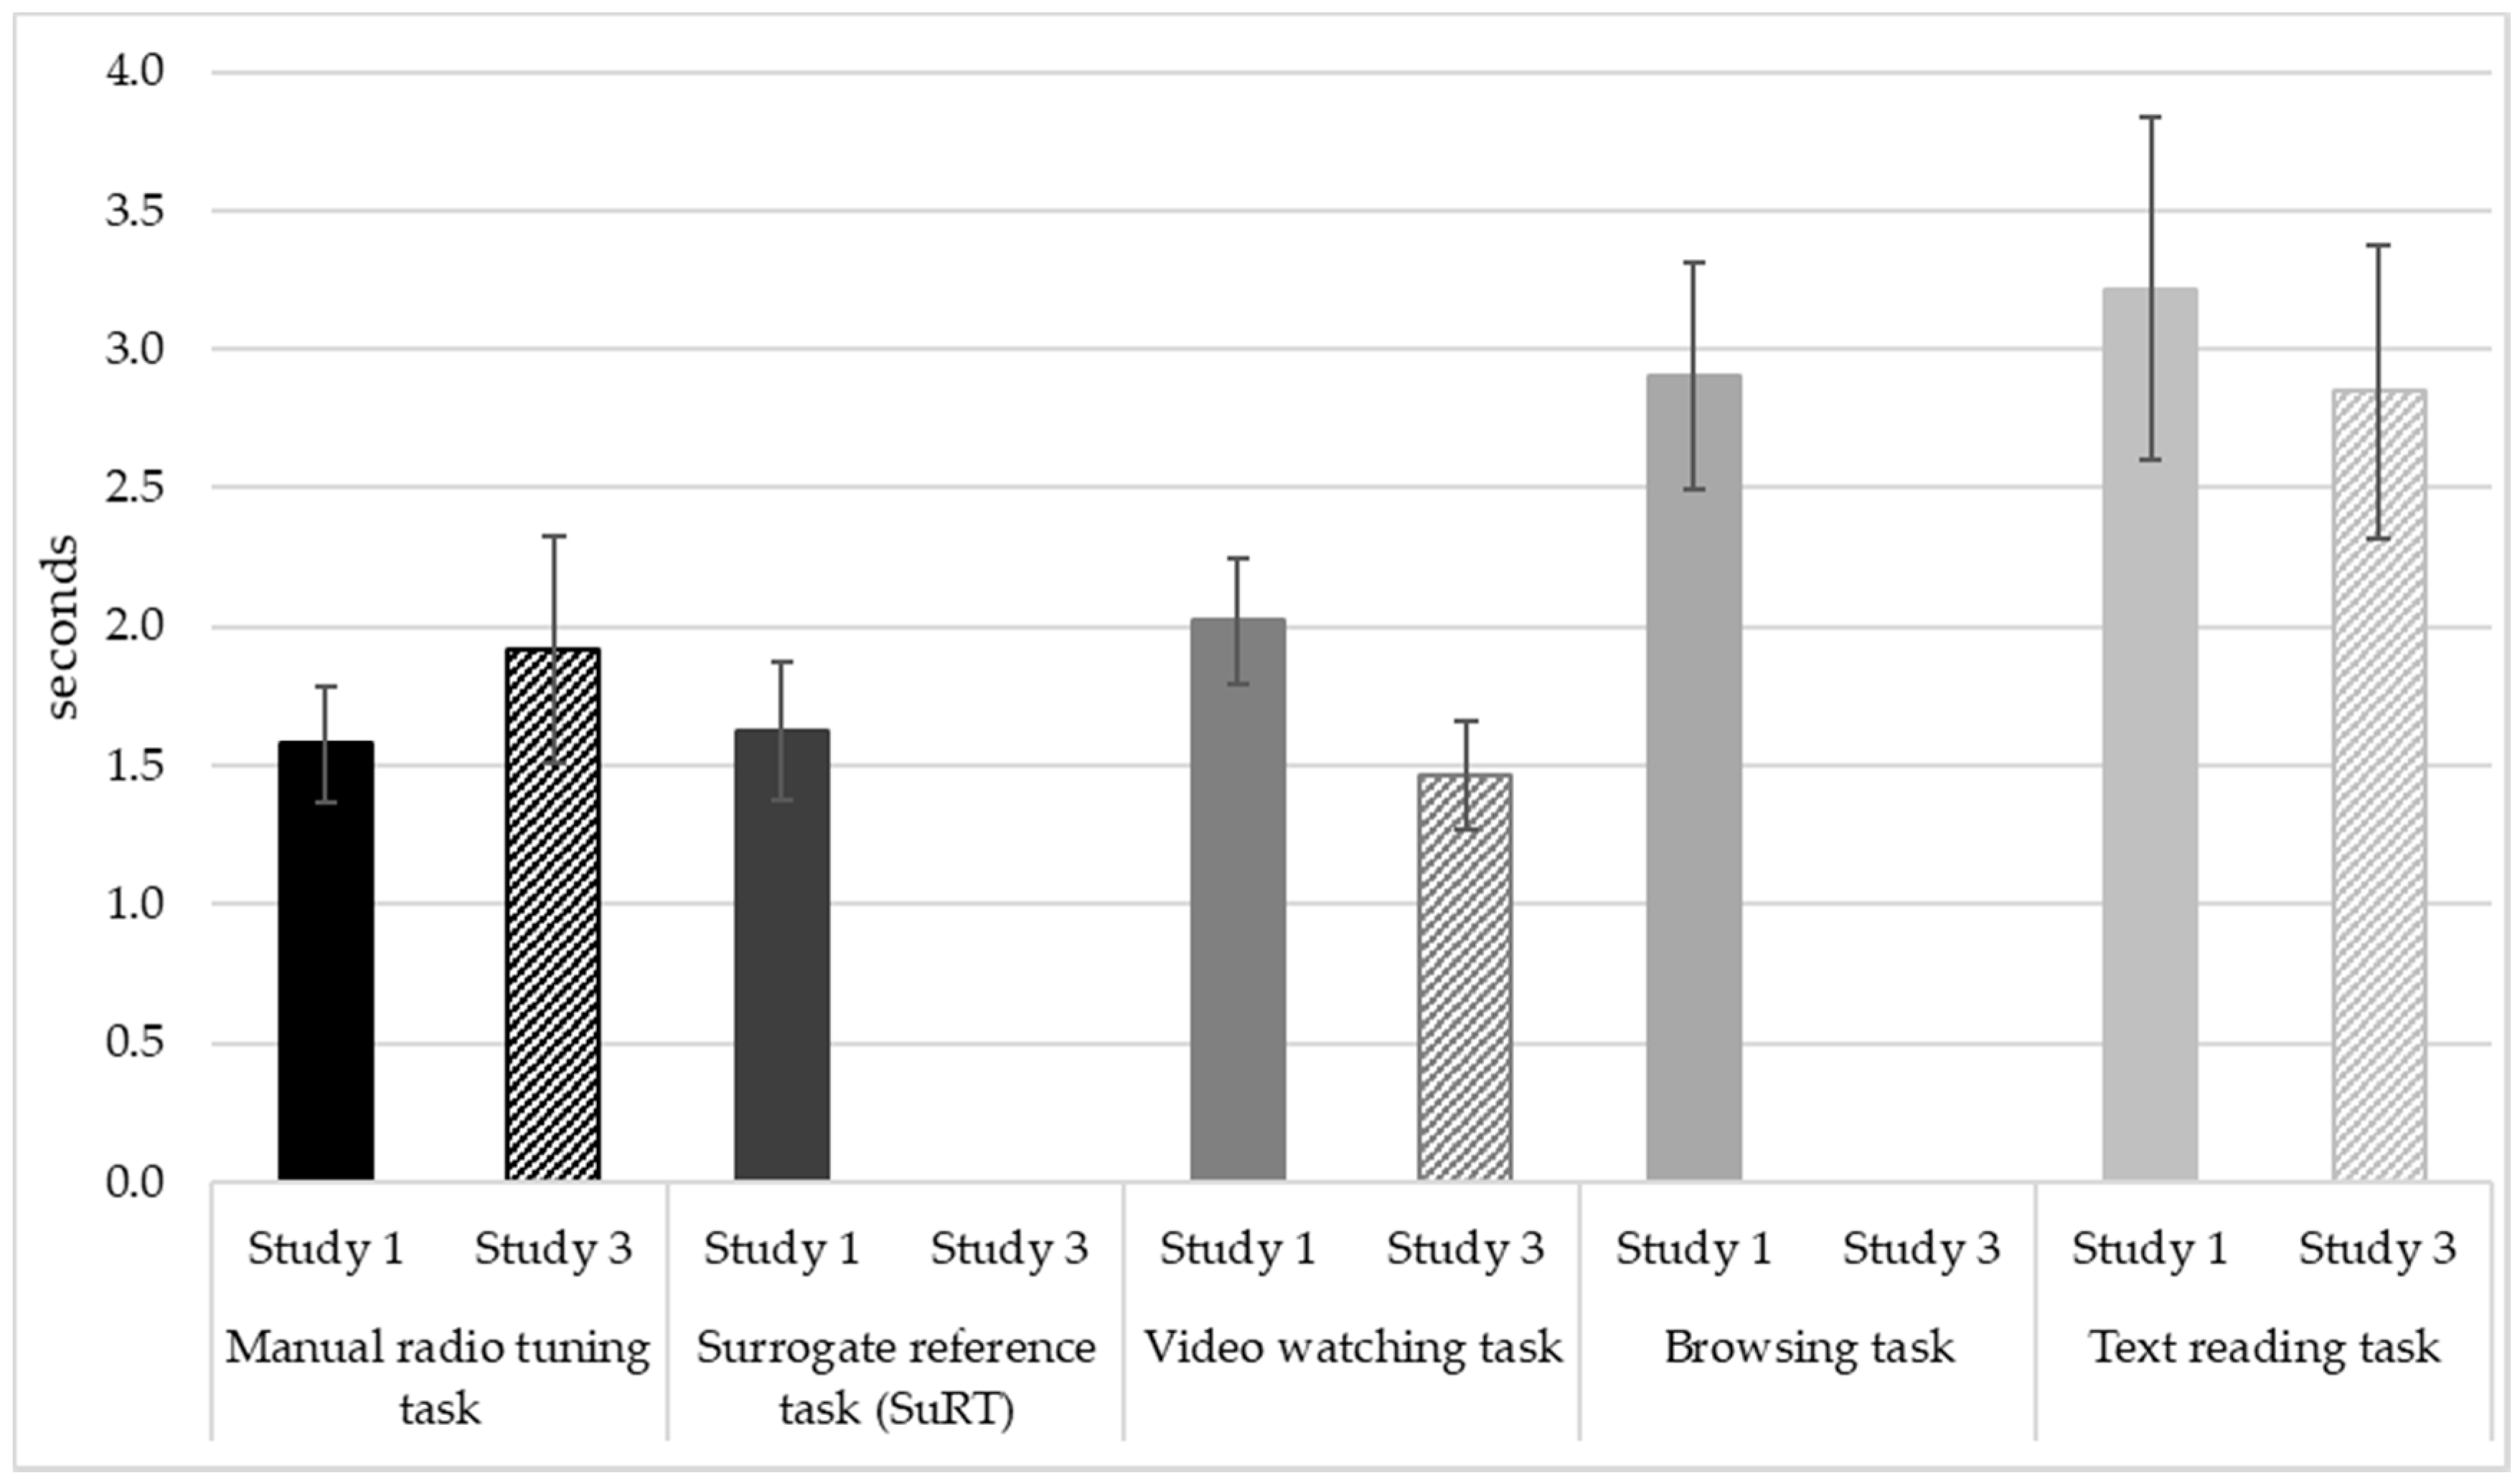
3. Results
4. Discussion
4.1. Future Research
4.2. Recommendations Regarding Test Protocol Implementation
4.2.1. Driving Scenario and Take-Over Situations
4.2.2. Independent Variables
4.2.3. Analyzed Variables
4.2.4. Equipment and Materials
Driving Simulator and Test Vehicles
Human–Machine Interface
Eye Tracking
Questionnaires
Instructions
4.2.5. Experimental Design and Procedure
Experimental Design
Procedure
4.2.6. Data Preparation and Analyses
4.2.7. Participants
5. Conclusions
Author Contributions
Funding
Acknowledgments
Conflicts of Interest
References
- Flemisch, F.; Kelsch, J.; Löper, C.; Schieben, A.; Schindler, J. Automation spectrum, inner/outer compatibility and other potentially useful human factors concepts for assistance and automation. In Human Factors for Assistance and Automation; de Waard, D., Oberheid, F.O., Flemisch, B., Lorenz, H., Brookhuis, K.A., Eds.; Shaker Publishing: Maastricht, The Netherlands, 2008; pp. 1–16. [Google Scholar]
- Merat, N.; Jamson, A.H.; Lai, F.C.; Carsten, O. Highly automated driving, secondary task performance, and driver state. Hum. Factors 2012, 54, 762–771. [Google Scholar] [CrossRef] [PubMed]
- SAE International. Taxonomy and Definitions for Terms Related to Driving Automation Systems for On-Road Motor Vehicles (No. J3016); SAE International: Warrendale, PA, USA, 2016. [Google Scholar]
- Stanton, N.A.; Young, M.S. Vehicle automation and driving performance. Ergonomics 1998, 41, 1014–1028. [Google Scholar] [CrossRef]
- Van den Beukel, A.P.; van der Voort, M.C. Design considerations on user-interaction for semi-automated driving. In Proceedings of the 35th FISITA World Automotive Congress, Maastricht, The Netherlands, 2–6 June 2014; pp. 1–8. [Google Scholar]
- Körber, M.; Weißgerber, T.; Kalb, L.; Blaschke, C.; Farid, M. Prediction of take-over time in highly automated driving by two psychometric tests. DYNA 2015, 82, 195–201. [Google Scholar] [CrossRef]
- Saxby, D.J.; Matthews, G.; Warm, J.S.; Hitchcock, E.M.; Neubauer, C. Active and passive fatigue in simulated driving: Discriminating styles of workload regulation and their safety impacts. J. Exp. Psychol. Appl. 2013, 19, 287–300. [Google Scholar] [CrossRef] [PubMed]
- Coughlin, J.F.; Reimer, B.; Mehler, B. Monitoring, managing, and motivating driver safety and well-being. IEEE Pervasive Computing 2011, 10, 14–21. [Google Scholar] [CrossRef]
- Regan, M.A.; Hallett, C.; Gordon, C.P. Driver distraction and driver inattention: Definition, relationship and taxonomy. Accid. Anal. Prev. 2011, 43, 1771–1781. [Google Scholar] [CrossRef] [PubMed]
- Spence, C.; Ho, C. Crossmodal information processing in driving. In Human Factors of Visual and Cognitive Performance in Driving; Castro, C., Ed.; CRC Press: Boca Raton, FL, USA, 2009; pp. 187–200. [Google Scholar]
- Renge, K. The effects of driving experience on a driver’s visual attention. An analysis of objects looked at: Using the ‘verbal report’ method. Intern. Asso. Traffic Safety Sci. Res. 1980, 4, 95–106. [Google Scholar]
- Hughes, P.K.; Cole, B.L. What attracts attention when driving? Ergonomics 1986, 29, 377–391. [Google Scholar] [CrossRef]
- Ahlstrom, C.; Kircher, K. Changes in glance behavior when using a visual eco-driving system – A field study. Appl. Ergon. 2017, 58, 414–423. [Google Scholar] [CrossRef]
- National Highway Traffic Safety Administration. Visual-Manual NHTSA Driver Distraction Guidelines for In-Vehicle Electronic Devices; Department of Transportation: Washington, DC, USA, 2016.
- Birrel, S.A.; Fowkes, M. Glance behaviours when using an in-vehicle smart driving aid: A real-world, on-road driving study. Transp. Res. F Traffic Psychol. Behav. 2014, 22, 113–125. [Google Scholar] [CrossRef]
- Ayama, M.; Hasegawa, H.; Kawaguchi, M.; Ihata, N.; Ikegami, M.; Kasuga, M. A study to measure spare capacity of driver’s attention payable to cognitive subtask. In Proceedings of the 5th IEEE International Conference on Intelligent Transportation Systems, Singapore, 6 September 2002; pp. 279–283. [Google Scholar] [CrossRef]
- Uno, H.; Hiramatsu, K. Effects of auditory distractions on driving behavior during lane change course negotiation: Estimation of spare mental capacity as a index of attention distraction. JSAE Rev. 2000, 21, 219–224. [Google Scholar] [CrossRef]
- Jamson, A.H.; Merat, N.; Carsten, O.M.; Lai, F.C.H. Behavioural changes in drivers experiencing highly-automated vehicle control in varying traffic conditions. Transp. Res. C Emerg. Technol. 2013, 30, 116–125. [Google Scholar] [CrossRef]
- Llaneras, R.; Salinger, J.; Green, C. Human factors issues associated with limited ability autonomous driving systems: Drivers’ allocation of visual attention to the forward roadway. In Proceedings of the 7th International Driving Symposium on Human Factors in Driver Assessment, Training and Vehicle Design, New York, NY, USA, 17–20 June 2013; pp. 92–98. [Google Scholar]
- Carsten, O.; Lai, F.C.H.; Barnard, Y.; Jamson, A.H.; Merat, N. Control Task Substitution in Semiautomated Driving: Does It Matter What Aspects Are Automated? Hum. Factors 2012, 54, 747–761. [Google Scholar] [CrossRef] [PubMed]
- Hergeth, S.; Lorenz, L.; Vilimek, R.; Krems, J.F. Keep Your Scanners Peeled: Gaze Behavior as a Measure of Automation Trust During Highly Automated Driving. Hum. Factors 2016, 58, 509–519. [Google Scholar] [CrossRef] [PubMed]
- Cunningham, M.L.; Regan, M.A. Driver distraction and inattention in the realm of automated driving. IET Intell. Transp. Syst. 2017, 12, 1–7. [Google Scholar] [CrossRef]
- Martens, M.; van den Beukel, A. The road to automated driving: Dual mode and human factors considerations. In Proceedings of the 16th International IEEE Annual Conference on Intelligent Transportation Systems, The Hague, The Netherlands, 6–9 October 2013; pp. 2262–2267. [Google Scholar]
- Eriksson, A.; Stanton, N.A. Takeover time in highly automated vehicles: Noncritical transitions to and from manual control. Hum. Factors 2017, 59, 689–705. [Google Scholar] [CrossRef]
- Dogan, E.; Rahal, M.C.; Deborne, R.; Delhomme, P.; Kemeny, A.; Perrin, J. Transition of control in a partially automated vehicle: Effects of anticipation and non-driving-related task involvement. Transp. Res. F Traffic Psychol. Behav. 2017, 46, 205–215. [Google Scholar] [CrossRef]
- Lin, R.; Liu, N.; Ma, L.; Zhang, T.; Zhang, W. Exploring the self-regulation of secondary task engagement in the context of partially automated driving: A pilot study. Transp. Res. F Traffic Psychol. Behav. 2019, 64, 147–160. [Google Scholar] [CrossRef]
- Large, D.R.; Banks, V.A.; Burnett, G.E.; Baverstock, S.; Skrypchuk, L. Exploring the behaviour of distracted drivers during different levels of automation in driving. In Proceedings of the 5th international conference on driver distraction and inattention (DDI2017), Paris, France, 20–22 March 2017. [Google Scholar]
- Lee, J.; Hirano, T.; Hano, T.; Itoh, M. Conversation during partially automated driving: How attention arousal is effective on maintaining situation awareness. In Proceedings of the 2019 IEEE International Conference on Systems, Man and Cybernetics (SMC), Bari, Italy, 6–9 October 2019; pp. 3718–3723. [Google Scholar] [CrossRef]
- Louw, T.; Kuo, J.; Romano, R.; Radhakrishnan, V.; Lenné, M.G.; Merat, N. Engaging in NDRTs affects drivers’ responses and glance patterns after silent automation failures. Transp. Res. F Traffic Psychol. Behav. 2019, 62, 870–882. [Google Scholar] [CrossRef]
- Naujoks, F.; Höfling, S.; Purucker, C.; Zeeb, K. From partial and high automation to manual driving: Relationship between non-driving related tasks, drowsiness and take-over performance. Accid. Anal. Prev. 2018, 121, 28–42. [Google Scholar] [CrossRef]
- Schömig, N.; Befelein, D.; Wiedemann, K.; Neukum, A. Methodische Aspekte und aktuelle inhaltliche Schwerpunkte bei der Konzeption experimenteller Studien zum hochautomatisierten Fahren; [Methodological Aspects and Current Focus Areas Concerning the Conception of Studies for Highly Automated Driving]; FAT Forschungsvereinigung Automobiltechnik: Berlin, Germany, 2020. [Google Scholar]
- Naujoks, F.; Wiedemann, K.; Schömig, N.; Hergeth, S.; Keinath, A. Towards guidelines and verification methods for automated vehicle HMIs. Transp. Res. F Traffic Psychol. Behav. 2019, 60, 121–136. [Google Scholar] [CrossRef]
- Wiggerich, A. Development of a modular tool for safety assessments of human-machine-interaction for assisted driving functions (SAE level 2). In Proceedings of the 26th International Technical Conference on the Enhanced Safety of Vehicles (ESV), Eindhoven, The Netherlands, 10–13 June 2019. [Google Scholar]
- Alliance of Automobile Manufacturers. Statement of Principles, Criteria and Verification Procedures on Driver Interactions with Advanced In-Vehicle Information and Communication Systems Including; Alliance of Automobile Manufacturers: Washington, DC, USA, 2006. [Google Scholar]
- Lorenz, L.; Hergeth, S. Einfluss der Nebenaufgabe auf die Überwachungsleistung beim teilautomatisierten Fahren [Influence of secondary tasks on the supervisory performance during partially automated driving]. In Der Fahrer im 21. Jahrhundert; VDI, Ed.; VDI-Verlag: Düsseldorf, Germany, 2015; Volume 8, pp. 159–172. [Google Scholar]
- Green, D.M.; Swets, J.A. Signal Detection Theory and Psychophysics; John Wiley and Sons: New York, NY, USA, 1966. [Google Scholar]
- Wickens, C.D. Multiple resources and performance prediction. Theor. Issues Ergon. Sci. 2002, 3, 159–177. [Google Scholar] [CrossRef]
- Horrey, W.J.; Wickens, C.D. Driving and side task performance: The effects of display clutter, separation, and modality. Hum. Factors 2004, 46, 611–624. [Google Scholar] [CrossRef] [PubMed]
- Jamson, A.H.; Merat, N. Surrogate in-vehicle information systems and driver behaviour: Effects of visual and cognitive load in simulated rural driving. Transp. Res. F Traffic Psychol. Behav. 2005, 8, 79–96. [Google Scholar] [CrossRef]
- Metz, B.; Schömig, N.; Krüger, H.P. Attention during visual secondary tasks in driving: Adaptation to the demands of the driving task. Transp. Res. F Traffic Psychol. Behav. 2011, 14, 369–380. [Google Scholar] [CrossRef]
- Vollrath, M.; Krems, J. Fahren [Driving]. In Verkehrspsychologie. Ein Lehrbuch für Psychologen, Ingenieure und Informatiker; Vollrath, M., Krems, J., Eds.; Kohlhammer: Stuttgart, Germany, 2011; pp. 22–40. [Google Scholar]
- Mattes, S. The lane change task as a tool for driver distraction evaluation. In Quality of Work and Products in Enterprises of the Future; Strasser, H., Kluth, K., Rausch, H., Bubb, H., Eds.; Ergonomia: Stuttgart, Germany, 2003; pp. 57–60. [Google Scholar]
- Fry, E.B. Teaching Faster Reading: A Manual; Cambridge University Press: Cambridge, UK, 1963. [Google Scholar]
- Victor, T.W.; Harbluk, J.L.; Engström, J.A. Sensitivity of eye-movement measures to in-vehicle task difficulty. Transp. Res. F Traffic Psychol. Behav. 2005, 8, 167–190. [Google Scholar] [CrossRef]
- Ecker, R. Der verteilte Fahrerinteraktionsraum [The Distributed Driver Interaction Space]. Ph.D. Thesis, Ludwig-Maximilians-Universität (LMU) München, München, Germany, 14 June 2013. [Google Scholar]
- Vollrath, M.; Huemer, A.K.; Teller, C.; Likhacheva, A.; Fricke, J. Do German drivers use their smartphones safely?—Not really! Accid. Anal. Prev. 2016, 96, 29–38. [Google Scholar] [CrossRef]
- National Highway Traffic Safety Administration. Traffic Safety Facts Research Note: Distracted Driving 2014; Report No. DOT HS 812 260; National Highway Traffic Safety Administration: Washington, DC, USA, 2016. Available online: https://crashstats.nhtsa.dot.gov/Api/Public/ViewPublication/812260 (accessed on 5 May 2020).
- Wittmann, M.; Kiss, M.; Gugg, P.; Steffen, A.; Fink, M.; Pöppel, E.; Kamiya, H. Effects of display position of a visual in-vehicle task on simulated driving. Appl. Ergon. 2006, 37, 187–199. [Google Scholar] [CrossRef]
- Lamble, D.; Laakso, M.; Summala, H. Detection thresholds in car following situations and peripheral vision: Implications for positioning of visually demanding in-car displays. Ergonomics 1999, 42, 807–815. [Google Scholar] [CrossRef]
- Weinberg, G.; Harsham, B.; Medenica, Z. Evaluating the usability of a head-up display for selection from choice lists in cars. In Proceedings of the 3rd International Conference on Automotive User Interfaces and Interactive Vehicular Applications, Salzburg, Austria, 30 November–2 December 2011; pp. 39–46. [Google Scholar] [CrossRef]
- Krause, M.; Angerer, C.; Bengler, K. Evaluation of a Radio Tuning Task on Android while Driving. Procedia Manuf. 2015, 3, 2642–2649. [Google Scholar] [CrossRef]
- Brillenstudie 2014 [Glasses Study 2014]. Available online: https://www.zva.de/brillenstudie (accessed on 20 March 2020).
- Tobii Pro Glasses 2 [Apparatus and software]; Tobii AB: Stockholm, Sweden, 2016.
- ISO 15007-1. Road Vehicles––Measurement of Driver Visual Behaviour with Respect to Transport Information and Control Systems Part 1: Definitions and Parameters; ISO: Geneva, Switzerland, 2014. [Google Scholar]
- Sedlmeier, P.; Renkewitz, F. Forschungsmethoden und Statistik: Ein Lehrbuch für Psychologen und Sozialwissenschaftler [Research Methods and Statistics: A Textbook for Psychologists and Social Scientists], 2nd ed.; Pearson: München, Germany, 2013. [Google Scholar]
- Hensch, A.-C.; Rauh, N.; Schmidt, C.; Hergeth, S.; Naujoks, F.; Krems, J.F.; Keinath, A. Effects of secondary tasks and display position on glance behavior during partially automated driving. Transp. Res. F Traffic Psychol. Behav. 2020, 68, 23–32. [Google Scholar] [CrossRef]
- Cohen, J. Statistical Power Analysis for the Behavioral Sciences, 2nd ed.; Laurence Erlbaum Associates: Hillsdale, NJ, USA, 1988. [Google Scholar]


| Simulator | Test Track | Relevant Differences | |
|---|---|---|---|
| Study Environment | Simulator | Test track | Yes, since the experienced risk and situation criticality likely differ between the two study environments. For instance, they are likely higher in a real vehicle (on a test track) than in a simulator, where collisions pose no risk to the participants’ safety. |
| Driving Scenario | |||
| Car-following scenario | Yes | Yes | / |
| Duration | Approx. 8–9 min | Approx. 12 min | No, since the difference is only minor and therefore unlikely to elicit different levels of monotony or fatigue. |
| Route | Straight highway | Test track on parking lot with many curves | Yes, because a test track with several curves potentially results in different supervisory behavior (e.g., enhanced supervision of the street) compared to a straight test track. Hence, the supervisory behavior on the simulated straight highway might be underestimated compared to the more realistic curved test track. |
| Surrounding | Without landmarks | With many landmarks | No, since the landmarks (i.e., trees) possessed low levels of visual attraction and were static. Hence, they were less distractive than, for example, dynamic landmarks. |
| Take-over Situations | |||
| Types | Lead vehicle deceleration and Ego vehicle drifting | Lead vehicle deceleration and Ego vehicle drifting | / |
| Number of situations per trial | 4 | 4 | / |
| Collision risk | Yes | No | No, since participants were aware that the theoretical consequence of failing to react in a real vehicle would be a collision, a certain level of situation criticality still existed. |
| Duration (e.g., time to collision) | 7 s | Not precisely realizable | No, since the time to collision of the take-over situations was comparably short in all studies (i.e., only several seconds) and participants needed to react as soon as they noted the take-over situations. The differences in distance and speed would likely result in a reduced comparability of the studies’ results (see below). |
| Occurrence | Defined in simulation | Predefined by test circuit, same track segment | Yes, since it enhances the predictability of the take-over situation (locally). |
| Predictability (locally) | Low | High | Yes, since it potentially influences participants’ (supervisory) behavior during the particular segment (e.g., more gazes towards the street and therefore faster reactions to the take-over situations.) |
| Predictability (time-wise) | Low | Low | / |
| Ego vehicle | |||
| Speed | 80 km/h | Max. 27 km/h | Yes, both the lower speeds driven and smaller distance to the lead vehicle during the test track study potentially influenced the experienced situation criticality (e.g., reduced criticality through reduced speed; however, partially counteracted through decreased distance between the vehicles). This might have reduced the comparability between the studies’ results (e.g., longer gazes towards the NDRTs on the test track due to reduced speeds). |
| Distance to lead vehicle | 70 m | Ego vehicle speed/2 + 7 m | |
| Longitudinal control | Automated | Automated | / |
| Lateral control | Automated | Wizard-of-Oz | No, the Wizard-of-Oz execution itself should not influence the results or the comparability of the studies’ results, provided participants did not notice the researcher executing lateral control (which was not the case). |
| Lead Vehicle | |||
| Speed | 80 km/h | Max. 25 km/h, | No, the lead vehicle’s speed generally is not a separate factor influencing the comparability of the studies’ results. It is due to the reduced speeds driven on the test track. Hence, its influence is incorporated into the impact of the ego vehicle’s speed and the distance to the lead vehicle. |
| Vehicle control | Simulator (preprogrammed) | Manually driven (with cruise control and motor deceleration/acceleration) | Yes, it reduces the standardization, comparability and reproducibility of the scenario and the take-over situations. Moreover, it influences the driving data (e.g., distance when the take-over situations were triggered). However, the participants’ supervising behavior should not be affected. |
| Study 1—Simulator | Study 2—Simulator | Study 3—Test Track | ||
|---|---|---|---|---|
| Independent variables | Non-driving related tasks |
|
|
|
| (In-vehicle) Display locations |
|
|
| |
| Dependent variables | Supervisory capabilities |
|
|
|
| Take-over capabilities |
|
|
|
| Studies | N (Total) | N (Analyzed) 1 | Age Groups | Gender Distribution | |||
|---|---|---|---|---|---|---|---|
| 18–24 | 25–39 | 40–54 | Older than 55 | ||||
| Study 1—Simulator | 57 | 47 | 12 | 15 | 12 | 8 | 27 male, 20 female |
| Study 2—Simulator | 58 | 50 | 15 | 11 | 13 | 11 | 27 male, 23 female |
| Study 3—Test track | 39 | 36 | 8 | 11 | 9 | 8 | 20 male, 16 female |
| Study 1—Simulator | Study 2—Simulator | Study 3—Test Track | ||
|---|---|---|---|---|
| Non-Driving Related Tasks (NDRTs) | NDRTs | Display Locations | NDRTs | |
| Mean Gaze Duration | Strong effect 1 | Medium effect | Strong effect | Strong effect |
| Total Gaze Duration | Strong effect | Strong effect | Strong effect | Strong effect |
| Maximum Gaze Duration | Strong effect | / | / | / |
| Number of Gazes | Strong effect | / | / | / |
| Number of Transitions | Strong effect | Strong effect | Strong effect | Strong effect |
| Study 1—Simulator | Study 2—Simulator | Study 3—Test Track | ||
|---|---|---|---|---|
| NDRTs | NDRTs | Display Locations | NDRTs | |
| Reaction time | Strong effect 1 | Weak—strong effect | Medium effect | Weak effect |
| Minimal distance to the lead vehicle at initial reaction | Strong effect | / | / | Weak effect |
| Maximal brake pressure | Strong effect | / | / | / |
| Maximal steering angle | Weak effect | / | / | / |
| Number of crashes | Only descriptive analyses. | / | ||
| Recommendations | |
|---|---|
| Driving scenario |
|
| |
| Take-over situations |
|
| Non-driving related tasks (NDRTs) |
|
| Analyzed variables |
|
| Equipment |
|
| Design and procedure |
|
| Procedure |
|
| Data preparation and analysis |
|
| Participants |
|
© 2020 by the authors. Licensee MDPI, Basel, Switzerland. This article is an open access article distributed under the terms and conditions of the Creative Commons Attribution (CC BY) license (http://creativecommons.org/licenses/by/4.0/).
Share and Cite
Hollander, C.; Rauh, N.; Naujoks, F.; Hergeth, S.; Krems, J.F.; Keinath, A. Methodological Approach towards Evaluating the Effects of Non-Driving Related Tasks during Partially Automated Driving. Information 2020, 11, 340. https://doi.org/10.3390/info11070340
Hollander C, Rauh N, Naujoks F, Hergeth S, Krems JF, Keinath A. Methodological Approach towards Evaluating the Effects of Non-Driving Related Tasks during Partially Automated Driving. Information. 2020; 11(7):340. https://doi.org/10.3390/info11070340
Chicago/Turabian StyleHollander, Cornelia, Nadine Rauh, Frederik Naujoks, Sebastian Hergeth, Josef F. Krems, and Andreas Keinath. 2020. "Methodological Approach towards Evaluating the Effects of Non-Driving Related Tasks during Partially Automated Driving" Information 11, no. 7: 340. https://doi.org/10.3390/info11070340
APA StyleHollander, C., Rauh, N., Naujoks, F., Hergeth, S., Krems, J. F., & Keinath, A. (2020). Methodological Approach towards Evaluating the Effects of Non-Driving Related Tasks during Partially Automated Driving. Information, 11(7), 340. https://doi.org/10.3390/info11070340