Article

Exploring West African Folk Narrative Texts Using Machine Learning

1
Computer Science Department, Vrije Universiteit Amsterdam, De Boelelaan 1085, 1081 HV Amsterdam, The Netherlands
2
Bolesian B.V., Hooghiemstraplein 85, 3514 AX Utrecht, The Netherlands
*
Authors to whom correspondence should be addressed.
Information 2020, 11(5), 236; https://doi.org/10.3390/info11050236
Submission received: 28 February 2020 / Revised: 22 April 2020 / Accepted: 23 April 2020 / Published: 26 April 2020
(This article belongs to the Special Issue Digital Humanities)

Abstract

:
This paper examines how machine learning (ML) and natural language processing (NLP) can be used to identify, analyze, and generate West African folk tales. Two corpora of West African and Western European folk tales are compiled and used in three experiments on cross-cultural folk tale analysis. In the text generation experiment, two types of deep learning text generators are built and trained on the West African corpus. We show that although the texts range between semantic and syntactic coherence, each of them contains West African features. The second experiment further examines the distinction between the West African and Western European folk tales by comparing the performance of an LSTM (acc. 0.79) with a BoW classifier (acc. 0.93), indicating that the two corpora can be clearly distinguished in terms of vocabulary. An interactive t-SNE visualization of a hybrid classifier (acc. 0.85) highlights the culture-specific words for both. The third experiment describes an ML analysis of narrative structures. Classifiers trained on parts of folk tales according to the three-act structure are quite capable of distinguishing these parts (acc. 0.78). Common n-grams extracted from these parts not only underline cross-cultural distinctions in narrative structures, but also show the overlap between verbal and written West African narratives.

1. Introduction

Storytelling is a powerful communicative interaction, in which narratives are shaped and shared with the aim to captivate and involve the audience [1]. A narrative is a perspective of a story, represented as an event or a sequence of events and actions, carried out by characters [2].
Storytelling has been a particularly popular type of communication in African cultures. It is used to orally pass down and retain information, knowledge, and traditions over generations. Through this oral tradition, personal experiences and emotions, and in a broader sense human behaviors, cultural beliefs and values are taught and mirrored [3]. African storytelling is an interactive oral performance, in which the audience participates actively while a respected community member narrates a story [4]. The ending encapsulates a moral lesson about everyday life which is also reflected in the deeper narrative structure [5].
Although Europe, like Africa, has a history of oral storytelling, this has changed to what we call a “written culture”, meaning that its historical narrative is recorded in printed documentations. Aesop and Aristotle are considered among the first storytellers and fabulists. In the 19th century the German brothers Grimm wrote what are now considered the most famous fairy tales of the world [6]. The differences in verbal and written traditions between West Africa and Western Europe have influenced the narrative style, themes, and meaning [7].
Throughout the years, many researchers have come up with narrative theories to study the use of narratives in literature, films, and video games. The Soviet folklorist Propp was among the first to study narrative structures of folk tales by analyzing Russian fairy tales and identifying common narrative elements and themes [8]. Although fairy tales and myths are considered similar across cultures, narratives are believed to be culture-specific [9].
With the emergence of natural language processing (NLP) techniques and deep learning (DL) in the field of computational linguistics, more advanced artificially intelligent algorithms can be applied to analyze human language. Ever more NLP tasks are being completed successfully, which is why the question arose whether it is possible to use these recent advances in an exploratory research analyzing West African and Western European folk tales. This paper specifically focuses on uncovering the cultural differences between West African and Western European folk tales by means of machine learning (ML) and NLP. The analysis is done by collecting folk tales from both continents to compile two corpora: a West African and a Western European one. The aim of this research is not to use the most state-of-the-art algorithms. Instead, by incorporating digital tools in humanistic research, this research sheds light on the role computing techniques can play in analyzing culture-specific information and knowledge captured in natural language. The main interest is to examine whether culture-specific elements will emerge when we do this automatic analysis. With this scope in mind, the main research question of this paper is therefore:
How Can Machine Learning and Natural Language Processing be Used to Identify, Analyze, and Generate West African Folk Tales?
The research question is examined on the basis of the three ML experiments, which we present in Section 4, Section 5 and Section 6. Each of these sections discusses related work. For these experiments, a corpus, was constructed, which we describe in Section 3. All three experiments should be considered as separate units providing an answer to the research question. This means that although the knowledge obtained in each experiment influenced the next one, they are not interdependent. In the next section, we present the theoretical background.

2. Theoretical Background

Narratology is the study of narrative structure, which focuses on researching similarities, differences, and generalizability of narratives. A narrative structure is the structural framework that describes the story as a sequence of events, in a specific setting and plot that is appealing to its listeners or readers [10].
Various theories exist about narrative structures and their cultural sensitivity, some of which focus specifically on folk tales. In this paper, algorithmic computational narratology processes, such as the automatic generation of stories (Section 4) and extraction of narrative structures (Section 6), are used to create and interpret folk tales.
A popular concept in narrative structure is the three-act structure, which some claim originated in Aristotle’s “Poetics” [11]. In this work, Aristotle remarked that a tragedy is only whole when it has a beginning, a middle, and an end. Yet others claim it was the screenwriter Syd Field who first introduced the three-act structure in film and with it a formula for successful films [12]. In this structure, a story has a beginning (i.e., Setup), a body (i.e., Confrontation), and an end (i.e., Resolution). In the first act, the main characters and their relationships are introduced, as well as the world in which they live. In the middle of this act, an inciting incident or catalyst takes place, which is the first turning point in the story igniting the protagonist to engage in an action. In the second act, the protagonist tries to solve the problem, which instead worsens. The worst moment of the story is during the midpoint, in the middle of the second act. In the third act, the problems are solved. The peak of the story is during the climax, when the story is most intense, and the remaining questions are answered. Finally, the protagonist solves the issue and goes back to his old life with newly acquired knowledge or skills [12].
The well-arranged layout of the three-act structure makes it a frequently used structure both in computational narratology research and in narratives used in novels, films, and video games. This is why in Section 6 we use the three-act structure as a basis for our classification and information extraction task.

2.1. European Narrative Theories

A famous theory on narrative structure that had great impact on storytelling, writing, and moviemaking came from Joseph Campbell. In his book “The hero with a thousand faces” Campbell identified a common theme or archetypal motif that underlies every story, which he named the myth of the hero, or “monomyth”, where the story consists of three stages: Separation—Initiation—Return [13]. Christopher Vogler’s “The Writer’s Journey” [14] presents a variant of the monomyth, which is more in line with the three-act structure. Vogler proposes a more linear structure consisting of twelve stages.
This structure involves a Hero overcoming challenging events. These events are interwoven in the three-act structure and are often used to shape storytelling in games and movies. Its flexibility is suitable for a wide range of stories about adventures requiring problem solving from fantasy to reality [15].
A narrative theory popular for its focus on folk tales is described by folklorist Vladimir Propp in his book “Morphology of the Folk tale”. In his study, Propp systematically analyzed 100 Russian folk tales and identified common themes and character functions among them, as well as cultural characteristics. This was done by dividing the stories into morphemes and identifying narrative units, which he called “functions of Dramatis Personae” [8].
Propp concluded that there are only 31 identifiable and generic functions in the Russian folk tale. He furthermore argued that the sequence of the functions in these tales is similar and that they can all be fitted into one single structure [16]. Propp’s narrative theory has often been used as a basis in computational studies to annotate, analyze, and generate folk tales [17,18,19]. Section 6.2 mentions some studies that used Propp’s work in their computational analysis, but contrary to our corpora, most of these were annotated.

2.2. African Narrative Theories

In contrast to the wide variety of narrative theories that exist in the West, less information can be found on West African narrative structures. Instead, a considerable part of the literature focuses on the oral storytelling tradition, which heavily influenced written literature. African storytellers have the important task to memorize genealogies and events, which they then recite to chiefs, kings, and other important figures in an engaging way. Good storytellers have great sense of timing, use suitable voices, and are great in creating suspense and interacting with the audience [20]. Typical West African literary elements are said to have relatively loose narrative structure, idea of time, and a lack of character delineation [21]. Contrary to European literature, African written literature has matured much later. The emergence of written literature (in English) in Anglophone West Africa goes hand in hand with colonization.
As Roland Barthes points out [22], political, social, and cultural beliefs and habits are reflected in the way language is used. Since English is a second language in Anglophone West Africa and their authors have a different mother tongue, the distance between these two is said to have left its mark on the narrative structure and how the works should be interpreted. Because these works have been translated or written in the language of the oppressor, a more Eurocentric point of view is utilized instead of a West African one. This could cause elements typical for West African oral literature, e.g., proverbs, imagery, lyrical language, and riddles, to get lost [23]. Furthermore, neglecting these storytelling elements when analyzing these works is to ignore what make these narratives unique, rich, and typically African [21].
Ninan et al. argue that in developing cross-cultural computational narrative models, one should be sensitive to culture-specific logic and relations. In their research on the use of narrative structures by the Youruba people, they identify and distinguish two human forms: the tangible (physical), and the intangible (spiritual). They furthermore state that, as seems to be the case for more West African narratives, they are focused on the communal instead of the individual [24]. These worldviews are quite important to keep in mind when analyzing and creating (computational) narratives.
Edward Sackey has studied a selection of African novels to examine the extent to which written literature can be traced back to traditional oral storytelling [25]. The novels Sackey analyzed have an introduction, a body, and a conclusion. Following the Akan tradition, the introduction and conclusion are connected. Audience participation is very important in African art. In the storytelling setting, the storytellers are surrounded by the audience, and both have obligations throughout the event. The storytellers take turns telling the stories, and the story starts with a specific interactive opening formula between the two parties. The Dangme people in Ghana have a clear role for both storytellers and audience during the introduction of a story. This exchange is meant to enthuse the audience and was incorporated in some African novels. At the end of the storytelling event, the storyteller ends the tale using a closing formula, and asks the next storyteller to tell a new story. The role of the audience is to interrupt throughout the tale by making remarks, correcting the storyteller, or by singing songs [20].
Folktales, and fables in particular, have often been used in ethnographic studies to examine culture-specific habits and beliefs. Fables lend themselves well to cross-cultural comparison, because they exist in every culture and indicate what everyday life looks like and societal norms and behaviors in a simple yet engaging way [26].
The studies described in this subsection identify characteristic West African narrative and literary elements, some of which find their origin in oral storytelling. Furthermore, this information enables us to better understand what to look for when we search for West African features in folk tales. This knowledge benefits all three of the experiments (i.e., Section 4, Section 5 and Section 6).

3. Corpus Construction

Both a West African and a Western European corpus have been compiled for this project. To this end, we acquired a selection of West African and Western European folk tales. These have either been scraped from the Web or were extracted from scanned books available online using optical character recognition (OCR). Since OCR can add errors to the texts, all texts have been proofread manually and by spell-check. Using these techniques, a total of 742 English narratives have been collected, 252 of which are West African, and the other 490 Western European. The West African folk tales are written by authors from Anglophone West African countries such as The Gambia, Ghana, and Nigeria. In the research, the tales from all these countries have simply been merged such that a West African and a Western European collection remained. This means that the specific countries of origin are no longer considered. Most of the texts are fables or animal tales. In some tales, humans make an appearance too. Some of the folk tales are written by West African adults as a way to preserve and read them to their children. The Western European folk tales have been written by authors from countries such as the Netherlands, Germany, France, and the UK. While all the tales in our corpora are in English, the language spoken in most of the countries of origin is not. Many of the tales have thus been translated before being used in this research. Part of the folk tales come from the collection of folk tales published online by the University of Pittsburgh (https://www.pitt.edu/~dash/folktexts.html). These tales were translated by a professional folklorist writer and translator.
These corpora contain folk tales collected from various online sources. The corpora can be found in the “data” folder in our GitHub repository (https://GitHub.com/GossaLo/afr-neural-folktales/).
In the experiments, we make a distinction between two types of corpora, A and B.
-
Type A corpora: 0.5 MB West African, 0.5 MB Western European
-
Type B corpora: 1.1 MB West African, 1.1 MB Western European
Both of these types contain a West African and Western European variant. However, the corpora of type A both are approximately half the size of the corpora of type B (i.e., 1.1 MB each). The reason for this difference is that we decided to train and evaluate a text generating RNN model by means of a survey at the start of the project as a baseline (see Section 4.4). At this time, the corpora were still relatively small. Later, when more folk tales had been collected, the other experiments were performed on the larger sized corpora of type B. This means that all experiments except for the survey conducted in Section 4.4 use the corpora of (2 * 1.1) 2.2 MB of type B.
As can be seen in Table 1, the number of folk tales in the West African corpus differs from those in the Western European corpus, while the file sizes and total number of words and characters are almost the same. This is due to the fact that a significant part of the Western European folk tales is shorter than the West African folk tales. This is reflected in the lower average word count of the Western European folk tales i.e., 421 words, compared to the West African ones (i.e., 804 words).
To prepare the data for training, the folk tales are preprocessed. This is done by cleaning, tokenizing, and vectorizing the texts, the specific steps which depend on the model being trained. Keras is used to train the models, which is an open-source neural network library for building DL neural networks in Python. Neural network layers are stacked on top of each other, allowing to analyze the individual layers by using several data analysis and visualization packages in Python. Additionally, a ML software library for Python called Scikit-learn is used for the ML models. Training the models depends on the experiment at hand and is explained in the associated Section 4, Section 5 and Section 6.

4. Experiment 1: Text Generation

4.1. Introduction

Natural language generation (NLG) is an NLP task that uses large amounts of text to compose new texts. The aim of AI researchers is to get NLG-technologies to the point that they generate texts that seem to be written by humans. One of the challenges is that even though generated texts may appear correct at first glance, they are often semantically and syntactically incorrect.
In this section, we train deep neural networks using both corpora of type B. The main goal is to analyze generated texts to examine whether they contain West African features and what they look like. The generated narratives are evaluated on their level of semantic and syntactic coherence.
First, the corpus of West African folk tales is fed to two neural networks, which are trained to generate new narratives in West African style. The assumption is that more explicit West African features such as culture-specific protagonists, other characters or objects will appear in the generated texts. Identifying a West African narrative structure, however, is arguably more difficult as this is more implicit and hidden in the tale. Finally, we conduct a qualitative human evaluation to examine whether participants are able to identify culture-specific features and how they would assess the semantic and syntactic coherence of the generated texts.
NLG is a sequence generation task, which is currently solved best by neural networks that work through sequence-to-sequence (Seq2Seq) learning. In Seq2Seq learning, models that contain an encoder-decoder architecture are trained to convert sentences from one domain to another, as in the case of machine translation. The reason why this is a suitable option for text generation is that input and output sequences are not required to have a similar, fixed size [27]. Since in human written texts each sentence has a different amount of words, this requires a more advanced setup than a fixed-sized network [28].
The most frequently used type of Seq2Seq neural networks for NTG are recurrent neural networks (RNN). These are dynamic models that are able to generate sequences in multiple domains such as machine translation, image/video captioning, and music [29,30].

4.2. Experimental Setup

The literature did not indicate whether a character-level or a word-level RNN would perform better. Instead, this depends on the goal of the research and the data at hand. Therefore, both a character-level and a word-level RNN have been built for this experiment. Through trial-and-error, the settings that led to the most syntactical and semantic output were selected for both. The set-ups were kept as similar as possible (e.g., epochs, sequence length). Comparing the models is not the goal of this experiment, partly because the two set-ups differ. Instead, our aim is to investigate their ability of generating West African features. This was done by feeding both models seed sentences and comparing the words they generate to complete them. The building, training, and results of the models are explained on the basis of the West African corpus only. This is done to investigate the presence of West African features in the generated texts. In Section 4.4, which describes our human evaluation, the corpora of type A are used, which means a decrease by more than a half in training data size compared to when the corpora of type B were used (see Section 3). The corpora of both geographical backgrounds are used to find initial distinctions between them.

4.2.1. Data Preprocessing

The character-level model did not require much data preparation. The corpora are stored in two separate files, with each folk tale separated from the other by a blank line (see the GitHub repository (https://github.com/GossaLo/afr-neural-folktales/tree/master/data)). Feature selection was conducted by removing the blank lines, such that one long sequence of characters separated by spaces remains. These were then split into input-output sequences of length seven times the average word length (X), which are needed to predict the next character (y). The sequences have length 7 * avg(word_length) because the aim was to keep both setups as similar as possible. This meant that by choosing a sequence length of seven for words (* word_length), we had to find a value for the character-based model that is as similar.
The word-level model required more elaborate data preparation, even though the steps are similar. Since we now had to deal with words instead of characters, the part in which the sequences were created differs. After splitting the file into tokens, these were converted to lowercase and punctuation was removed. The input-output sequence lengths were, similar to the character-level model, seven words (X) to predict the next one (y).
The final step before training the model was encoding the sequences by mapping the characters or words to integers using the Keras Tokenizer. While the encoded vocabulary of characters contained only 93 unique characters, the word-level vocabulary had 8027 tokens and was thus significantly larger. The target token y in the word-level model was one-hot encoded to rule out any similarity between words and to allow the model to better predict the next word.

4.2.2. Training the Model

Figure 1 (left) illustrates the network architecture of the word-level RNN model. The input sequence is first fed to the Embedded layer, where each word has 50 dimensions. The next two layers are bidirectional LSTMs, each containing 200 memory cells. Through trial and error, we found that these values improved the models’ ability to store long-term. This allowed for a better overall control and maintenance of long-term dependencies. Each parameter value that was tried for training is shown in Table 2 below.
In a bidirectional LSTM, two independent RNNs are merged, allowing the network to receive both forward and backward information at every time step. This may result in a higher accuracy compared to when a single LSTM is used. The Dropout layer prevents overfitting on the training data. This is followed by a Hidden layer and the final predictions are made using a Softmax activation function.
The values belonging to the layers and the architecture of the model have been chosen through trial and error. By tweaking the values each time new results came in, the generated texts became more coherent and fluent, while overfitting was prevented. The structure of the network was deliberately kept simple, since we are working with a limited amount of data. The loss function chosen is the categorical cross-entropy, which, like Softmax, is used in multi-classification tasks. The optimization algorithm is Adam, since it requires little memory and is computationally efficient.
Figure 1 (right) shows the network architecture of the character-level RNN model. Since this model does not use word embeddings, the embedded layer is not part of the architecture. Furthermore, only one of the LSTM layers is bidirectional. We aimed to keep the rest of the architecture as similar to the word-level one as possible. These settings yielded the best results from those we tried. Apart from these differences, the architectures are the same. Both models were set to train for 150 epochs, where each epoch equals to the dataset getting passed both forward and backward through the network once.

4.3. Results

In this section we compare the outcomes of the two models. For each, we use two seed sequences derived from Manu’s “Six Ananse Stories” book as input [31]. The models both predicted the next words to continue the narrative based on the input seed (in bold). The output is generated by means of a sliding window. Based on the input of the seed sentence, the character or word with the highest probability is generated. Subsequently, the window cuts off the first character or word, and adds the predicted one, after which the next token is predicted and the process repeats.
The following examples (as shown in Box 1) have been generated by the character-level model:
Box 1. Text generated by the character-level LSTM.
Pig was thinking of Ananse’s welfare while Ananse was planning Pig’s death. The tortoise was the stone and said, “I will the soader to the soader and the stone and the soader the stone was a stone and the soader the soader was a stone.
and:
Long ago, there lived two very close friends, Ananse and Pig. They did everything together. They went to the soader and the soader and the soader, the stone and the soader. The soader was a stone and went to the soader and went to the soader.
The character-level model does not look too impressive. Both the first and second example generate repetitions of looped phrases, such as “and the soader” and “the stone”. This makes both examples impossible to interpret. The model does not capture long-term dependencies at all. The verb conjugations are done correctly, and so is the use of past tense. Although the model is capable of generating words and sentences, they do not contain words or sequences that are considered typically West African. The texts are of too low quality to be considered relevant.
The following examples (as shown in Box 2) have been generated by the word-level model:
Box 2. Text generated by the word-level LSTM.
Pig was thinking of Ananse’s welfare while Ananse was planning Pig’s death. To go up and fetch a little potion, and Gurikhoisip said and the jackal raised a hole in the discussion. He liked the custom quench their thirst in the middle. Of course they were very angry and determined to go to the river bank and eat.
and:
Long ago, there lived two very close friends, Ananse and Pig. They did everything together. They began to cry and then the Jackal said to the Jackal: “I shall go to the king and get the flesh. I say the owner Eja relieved then”. The hyena has supposed fixed up and others crept over and beat him to the hyenas head, and called out to her.
This model creates sentences that are quite correct and more syntactically coherent. Both examples are well supplemented and there are no spelling errors. Although the sentences are semantically difficult to follow, they perform quite well in capturing long-term dependencies. An example of this is shown in the recurrence of the hyena in the second text. The order of the words in the sequences make are more fluent than in the previous character-based example. If we pay attention to characteristic West African features, we highlight the occurrence of the words corn, the animals mentioned, and the character Gurikhoisip and Eja.
We can see that word-level texts are much more readable, have fewer spelling errors and score better on semantic and syntactic coherence than the character-level ones. However, in both types of models the semantic coherence is quite low. Some West African features emerge in the word-level texts, which are mentions of food, animals, and character types and names.

4.4. Human Evaluation

A human evaluation in the form of a survey was conducted on an experiment with data trained on roughly half the corpus (i.e., type A, see Section 3). In this survey, participants were asked to classify them according to geographical background. The only requirement for people to participate was that they had to be able to read and understand English. A total of 14 participants completed the classification task. The texts were generated by a character-level model similar to the one previously described. The difference in network structure, however, is that this model uses only one LSTM layer.

4.4.1. Survey Setup

Every participant saw ten texts were selected, half of which are West African, the other half which are Western European. Eight texts are RNN-generated with different temperatures, i.e., 0.5 or 1.0, which indicate the freedom of creativity. Higher temperature texts use less of the input corpus and are therefore more creative, but also more syntactically error-prone. The remaining two texts were original texts extracted from the corpora. By dividing the texts in terms of temperature, geographical background, and whether or not they were generated, we could measure the perceived differences between these groups. In this task participants were asked to categorize each text either as West-African, Western European, or Unclear. Additionally, participants were asked to leave behind a comment explaining each choice.

4.4.2. Survey Results

For each classification, we consider the class with the majority of the votes. Using this method, seven out of ten texts were correctly classified. In the other three cases, the majority chose “Unclear”, followed by the correct option.
The comment section below each classification clarified that in most cases a choice was made based on names of main characters, animals, and objects mentioned. For instance, panthers do not live in Western Europe, and so a story about a panther was classified as West African. “Reynard”, on the other hand, was recognized by all participants as being the main character in Western European folklore, and a text containing this character was thus classified as such. In yet other cases the texts were classified based on their resemblance with instances from Greek Mythology, Snow White, and Shakespeare. “Once upon a time”, for instance, was identified as Western European, because of its frequent occurrence in European fairy tales.
In the texts where Unclear received the majority of the votes, the texts were deemed unreadable and participants found it difficult to extract any relevant cues about a geographical or cultural base. Another reason why this option was chosen was in cases where animals or objects occurred in texts that exist on both continents, e.g., sheep, and oracles.

4.5. Discussion

The RNNs with an LSTM layer proved capable of generating new words and sentences. Increasing the size of the dataset would most likely improve the semantic and syntactic coherence of the output.
Although we tried to keep both models as similar as possible, there are some differences in set up. This makes comparison of performance difficult. The texts generated by the word-level model outperformed those generated by the character-level one in syntactic and semantic coherence, capture of long-term dependencies, and overall readability. In the word-level texts, characteristic West African features emerged, which were either African character names or types, animals or types of food. Participants in the human evaluation classified a majority of the texts correctly according to their geographical background.
Most narratives contain long-term dependencies and consistency in use of subjects and objects between sentences. Unfortunately, most neural networks that generate text have a hard time reproducing these, which make them difficult to interpret. Using part of the original data to generate new narratives improved the perceived syntactic and semantic coherence of the narratives.

5. Experiment 2: Text Classification

5.1. Introduction

The feedback obtained in the human evaluation of the previous section suggested that distinctions between geographical backgrounds can be made in use of vocabulary. Words that are deemed West African were classified as such, as were Western European ones. This motivated us to look into machine-identifiable differences between the two corpora.
Text classification is the task of assigning documents of texts formed in natural language to one or more predefined categories. This can be done either manually or automatically (algorithmically), for instance by arranging books in a library or classifying recipes based on meal type. Since we identify only two classes in this project, i.e., West African and Western European, the supervised task at hand is binary classification.
In this section, the performance of a DL classifier, namely LSTM [32], is compared to that of a non-neural Bag-of-Words (BoW) model, both trained on the corpora of type B (see Section 3). The BoW model is relatively simple and fast to train [33] compared to the LSTM classifier. The main difference between the two models is that while the LSTM model focuses on word order in sequences, this order is completely absent in the BoW model.

5.2. Related Work

Contrary to traditional models such as BoW, RNN classifiers take word order and semantics into account. With the simple example “man bites dog ! = dog bites man”, the difference between the two types quickly becomes clear. Since BoW captures neither the meaning of text, nor the word order, the representations in this example would be considered identical.
RNN classifiers analyze a sentence word by word, and store past information in a hidden layer. This both ensures that the models capture contextual information, and it makes them suitable for sentence classification tasks. Although they are more time-complex than more traditional classifiers, this is not too bad if the dataset is kept small. The main drawback of RNN classifiers, however, is that they are biased in assigning greater importance to words appearing later in the text than those appearing earlier. This is problematic when the semantics of the entire text is considered instead of just the end [34].
In the experiment described by Nguyen et al. Dutch folk narrative genres such as legend, fairy tale, and riddle [35] were classified using an SVM classifier. The goal was to test distinctiveness of genres and improve accessibility of folk tales. Their corpus contains approximately 15,000 manually annotated Dutch narratives written over a time span between the 16th and 21st century. Some features they used were unigrams, character n-grams (i.e., n-grams of length 2–5), punctuation and PoS patterns, the most effective which were the character n-grams. Even though the achieved results are not bad, the fact that a significant amount of narratives were classified under multiple genres proves that it is a difficult task.
The second paper by Trieschnigg et al. used the Dutch Folk tale Database to do a language identification task on Dutch folk tales [36]. Over 39,000 documents from the database were used written in 16 Dutch dialects. Trieschnigg et al. compared a number of classifiers, e.g., nearest neighbor and nearest prototype, with an n-gram baseline. Their results indicate that their input corpus made language identification difficult, at least partly because of the fact that it was annotated by over 50 annotators and it remains unclear whether each of them had used the same annotation method.
Our assumption is that in this project, particular words occur more frequently in West African folk tales than in Western European ones. This is why we build a classifier using BoW feature engineering. On the other hand, examining the effect that semantics and word order have on identifying the geographical background is interesting too. Because of this, and since we would like to know whether our model improves if we use a neural network, the BoW model is compared with an LSTM classifier.

5.3. Experimental Setup

First, some data exploration is done to compare the corpora on a basic level. Table 3 gives more insight into word use of both corpora by showing the top 10 most frequently occurring words and their term frequencies. What stands out at first glance is that both lists include animals that are associated with their geographical background, e.g., lions and tortoises in West Africa, and foxes and wolves in Western Europe. This adds to our motivation to compare the LSTM classifier with the simpler, unigram-based BoW model. The fact that the model types are quite different make that their architectural setup and requirements are different as well. By using similar data preprocessing steps for both models, the input is kept equal.

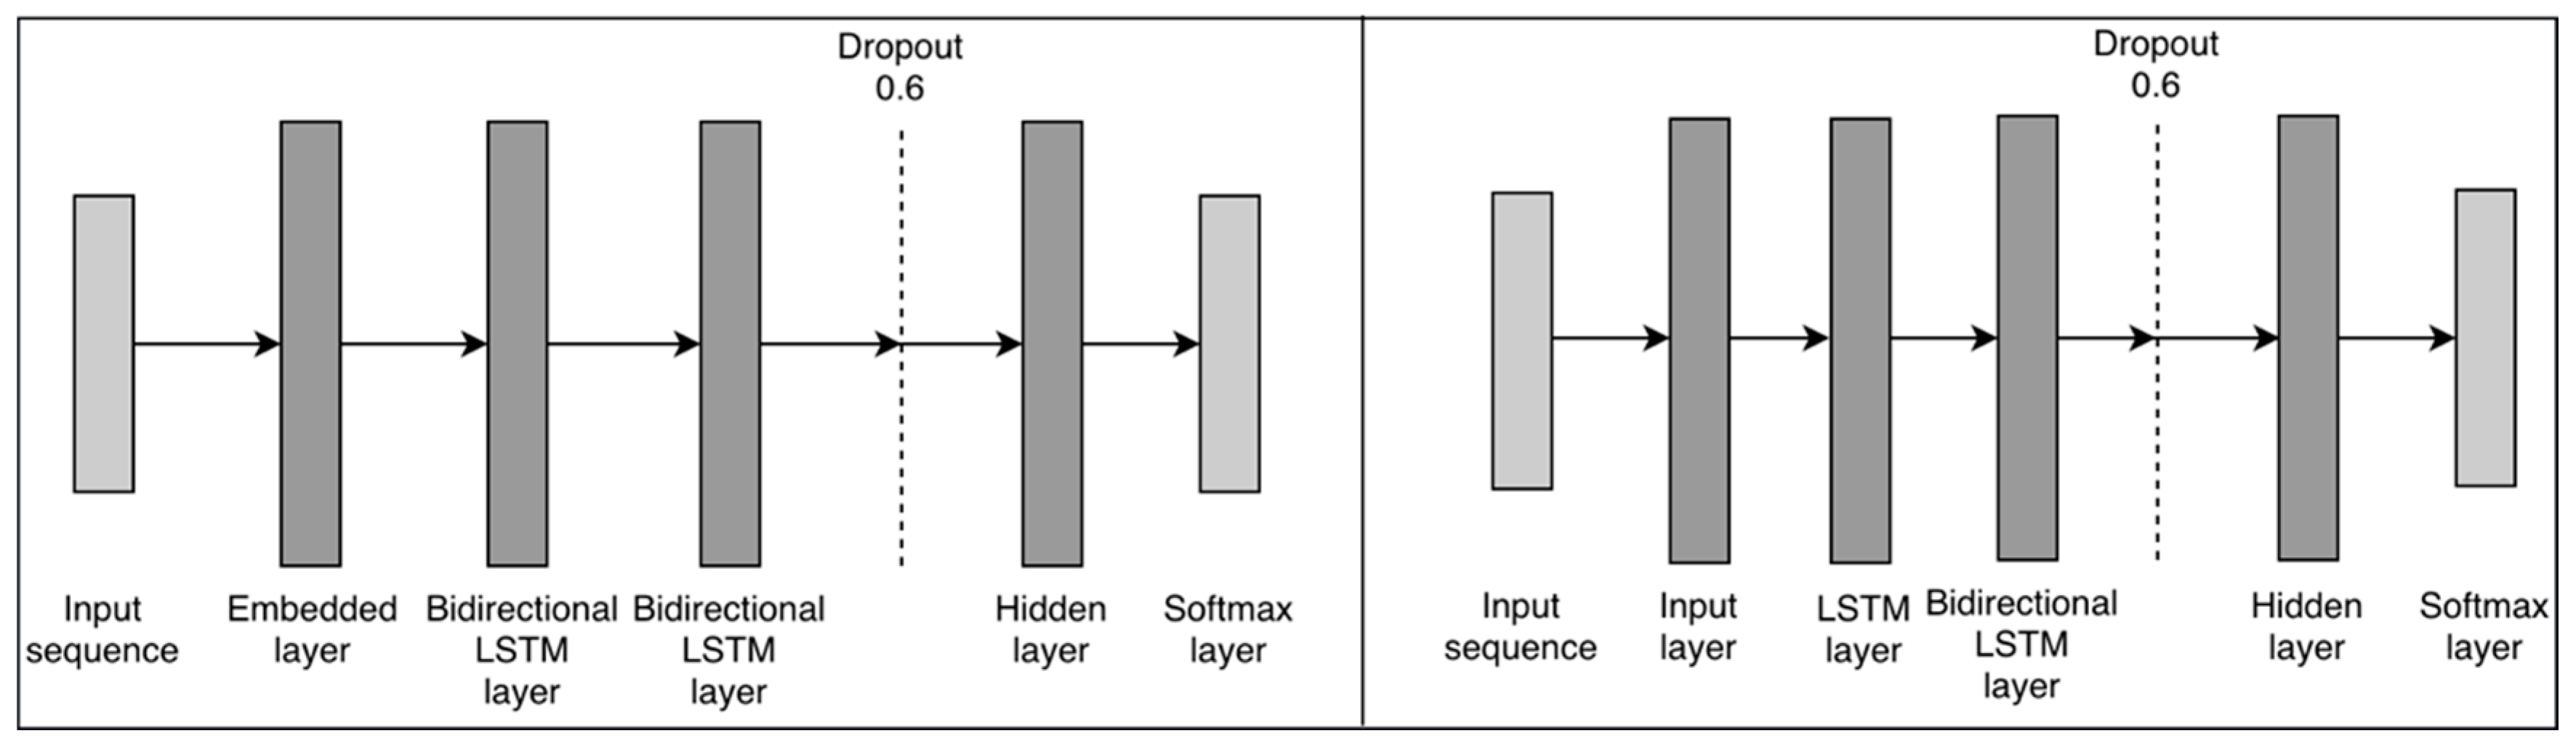
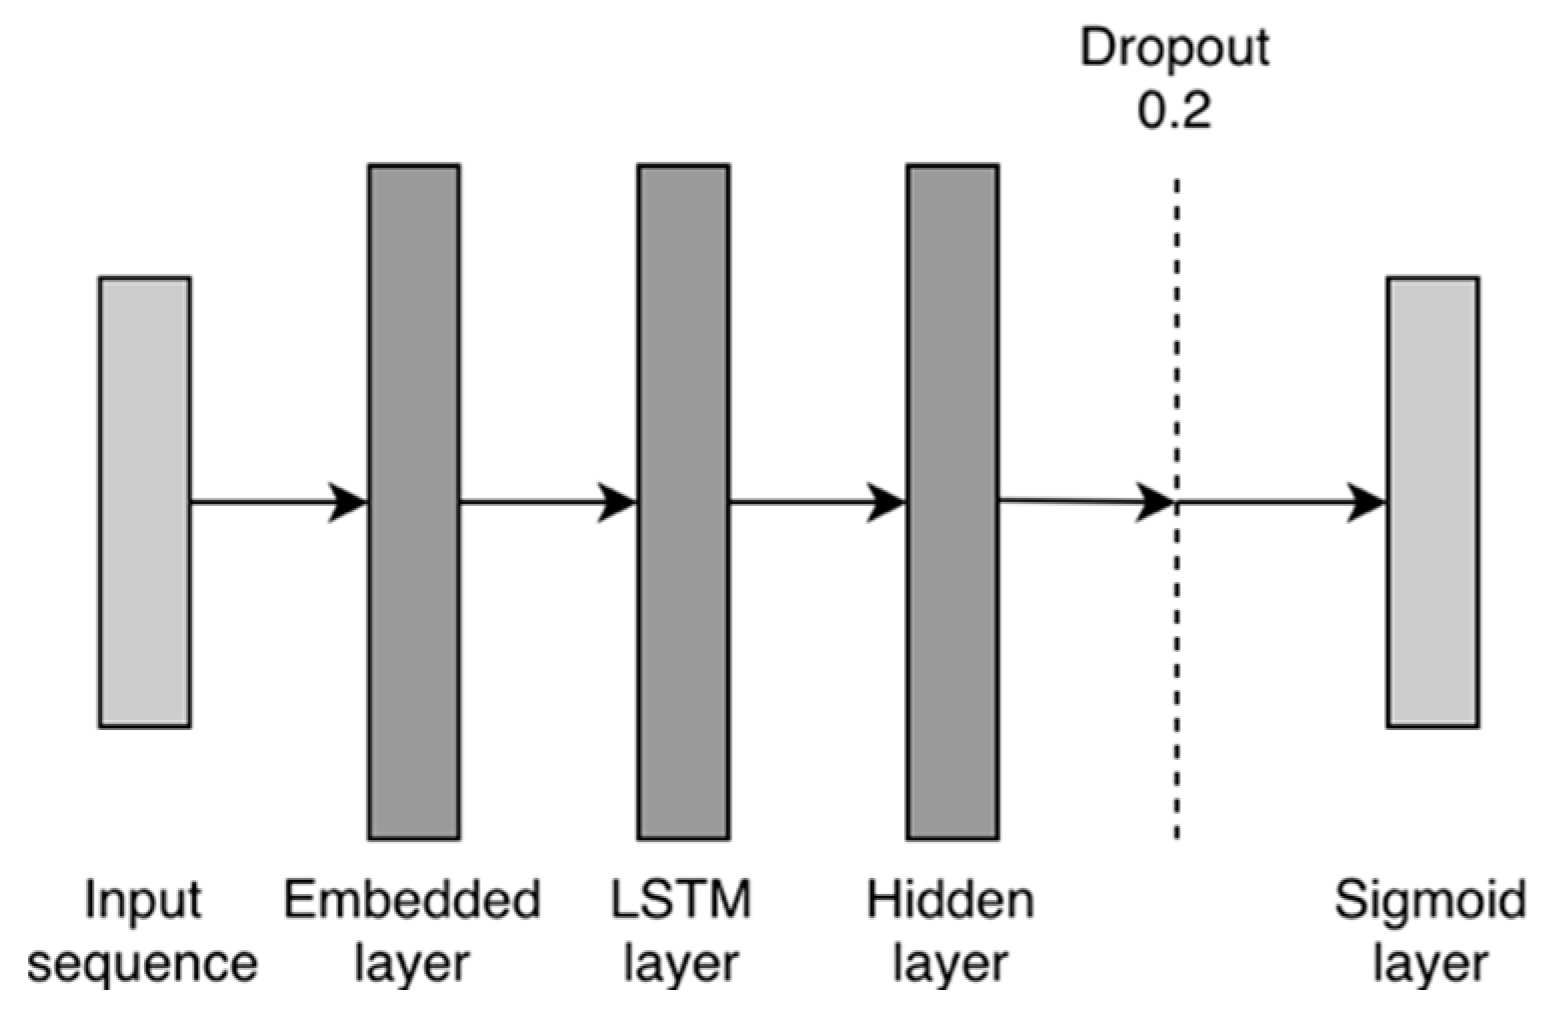
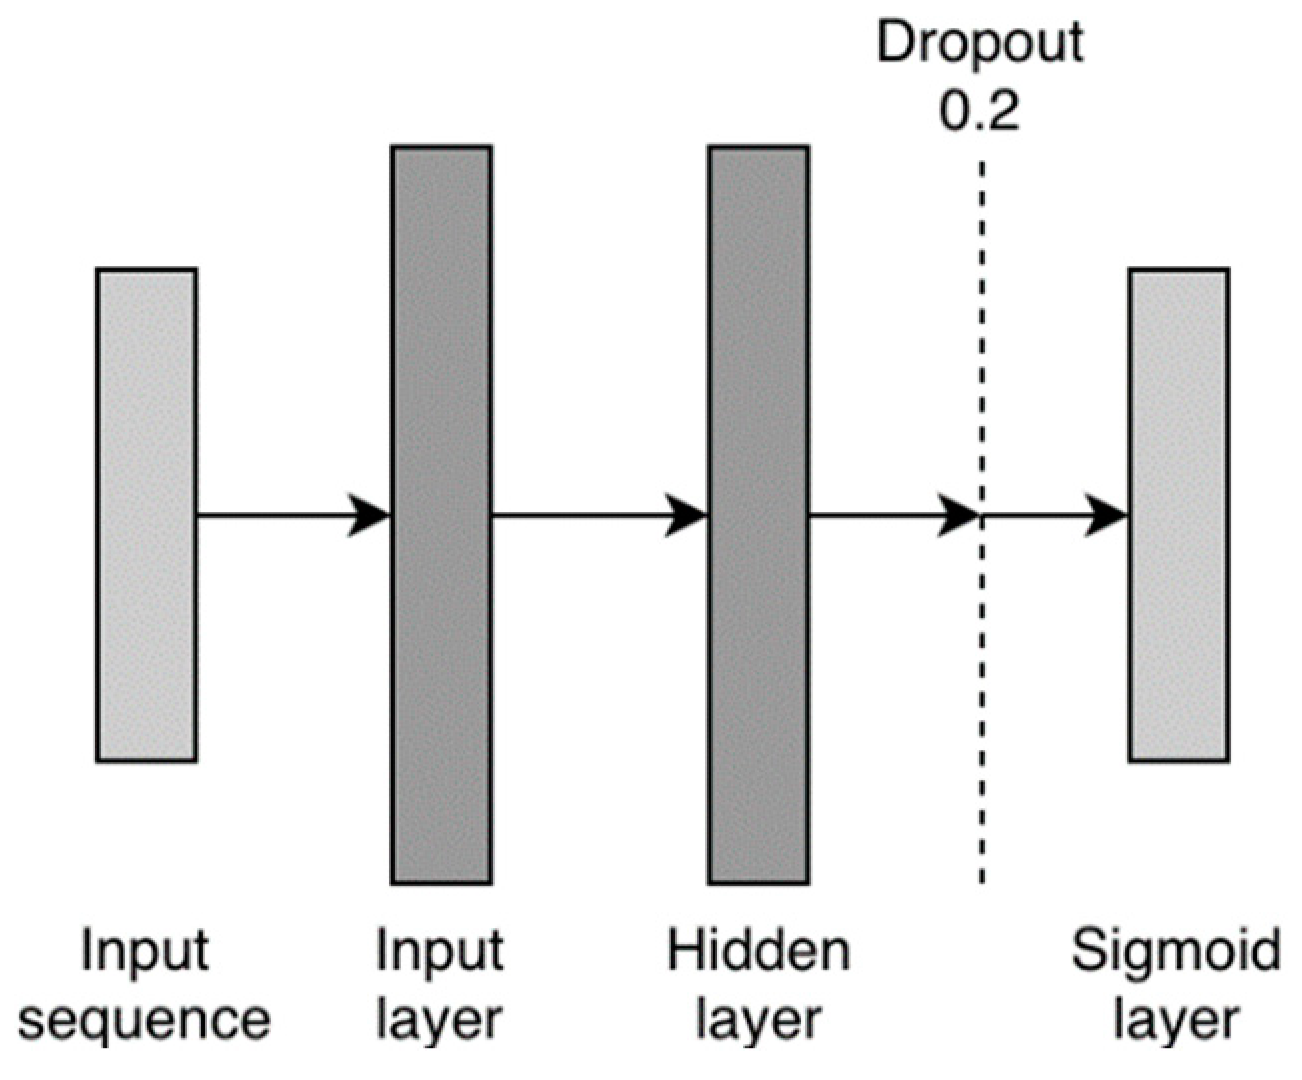
5.3.1. LSTM Classifier

Using the LSTM to do the classification task is not too different from using it to do text generation. Each folk tale in the corpus can be seen as a sequence of words. In this task, the geographical background of the complete narrative is predicted, instead of the next word. This is therefore called a binary classification task, and not a multi-classification one as in the case of text generation. Table 4 lists the ranges of tested parameter values for both the BoW and LSTM text classification model. Through trial-and-error, the best parameter values were selected and were used where possible for both models to make them as similar as possible.
First, the data were preprocessed by performing feature selection, in order to prepare the data for training. This was done through cleaning the texts by removing short (n < 2), non-alphabetic, and stop words. Furthermore, the words were transformed into lowercase, and numbers and punctuation have been removed. Subsequently, the texts were vectorized using Keras Tokenizer.
Labels were then mapped to the folk tales: ones for West African and zeros for Western European folk tales. In addition, the maximum amount of words per tale was set to 500 to equalize the vectors. Folk tales that contain more than 500 words were truncated and those with less words were padded.
Once the preprocessing had been performed, 90% of the sequences were used as a training set. The remaining 10% is used as a test set. The network consists of a set of layers through which the data are passed. The first layer of the network is the Embedded layer. Word embeddings are created, where the distance equals the similarity in meaning. Each word is represented as a 32-length real-valued vector. Using word embeddings is where the LSTM differs from the BoW model. The next layer is the LSTM layer with 100 memory units. A Dropout layer was added, followed by a fully connected Hidden layer. The Sigmoid activation function was used to make a 0 or 1 prediction for both classes. Figure 2 illustrates the network architecture.
The binary cross-entropy loss function was used, as well as the Adam optimizer. The data were then trained on only five epochs. This and the fact that the network structure was kept simple was done to prevent overfitting. Finally, 10-fold cross-validation was applied to give a more robust, less biased estimate of the performance of the model on unseen data. The metric used to assess the performance is the accuracy score, which is 0.79.
Furthermore, the model was assessed by predicting the geographical background of ten new snippets of texts. Six out of ten texts were classified correctly by the model. The four misclassifications were West African tales predicted as Western European ones. The error analysis is measured by the F1-score and is 0.75.

5.3.2. Bag-of-Words Classifier

BoW is a method that extracts features from text documents, without taking interrelationships between words into account. The main drawbacks of BoW are that it ignores long-term dependencies and that it does not deal well with negation [37]. This is particularly inconvenient when doing sentiment analysis. For example [not great] is a negative sentiment, but will most likely be classified as positive, since word order is not maintained.
The words were preprocessed in the same way as for the LSTM, which resulted in two similar sets of words. After the data preparation, a vocabulary was defined containing all the words of the folk tales that occur at least twice. After preprocessing, a total of 204,533 words remained in the combined set. Subsequently, each folk tale was modeled by counting the number of times a word from the vocabulary appears in it.
The network used for training is a simple feedforward multilayer perceptron (MLP). The specific parameter values that were tested can be seen on the right side of Table 4. In setting up the architecture of the classifier, the aim was to keep it similar to that of the LSTM classifier to prevent bias in set up. This network consists of an input layer, a single hidden layer with 50 neurons and a rectified linear activation function (ReLU), and a Dropout layer (0.2). The output layer of one neuron has a Sigmoid activation function to make the 0 or 1 prediction for the two classes. Figure 3 illustrates the complete network architecture.
Similar to the LSTM classifier, the binary cross-entropy loss function was used, as well as the Adam optimizer. A training:testing ratio of 90:10 has been applied to split the data. The model was trained on only 50 epochs to avoid overfitting. Then 10-fold cross validation was applied to decrease bias and generalize the results on the complete dataset. This yielded an accuracy score of 0.93.
When testing the performance of the model on the unseen texts, 9/10 were correctly classified, and the F1-score is 0.92. This roughly corresponds to the high accuracy score acquired on the training data. The only misclassified case is a West African text classified as Western European.

5.4. Comparison of the Results

The BoW (+MLP) model (acc. 0.93, F1. 0.92) outperformed the LSTM (acc. 0.79, F1. 0.75) significantly both in terms of accuracy, error analysis (F1-score), and in predicting the origin of the unseen texts. The results obtained using the LSTM with word embeddings show that it handles sequential data well. The fact that it performed worse than the BoW model could be due to the fact that too little training data were used. If more data were available, the model would have been better capable of capturing the long-term structure. The fact that the BoW model takes word occurrences into account instead of word order or long-term dependencies resulted in its high accuracy. The previous section gave an indication of how culture-specific some words are and how this helped distinguish between geographical backgrounds of narratives. This assumption is further confirmed by the success of this model.
T-distributed stochastic neighbor embedding (t-SNE) was used to reduce and visualize high-dimensional datasets in two or three dimensions. This preserves not only the local structure but also the global structure of the high-dimensional data in the low-dimensional data. Representations of similar data points are kept close together [38].
Since neural networks are black box models in which the input and output is known, but the underlying process stays hidden, we decided to visualize this process. We applied t-SNE to a hybrid model of both classifiers previously described (i.e., BoW + LSTM). The LSTM network was chosen because of its use in the previous stage of the experiment, and the BoW because of its successful performance on our data. The t-SNE shows in a detailed way how each word or sequence was classified. This helps us determine how the classifier makes distinctions based on geographical background. First, the words were converted into numbers using a BoW model. These BoW matrices were then fed as sequences to the embedding layer of the LSTM classifier. Using this network, an accuracy score of 0.85 was achieved on the test set. Each data point was preprocessed by transforming the words into lowercase and stripping away punctuation and stop words. This resulted in a set of 1682 sequences. Figure 4 shows the t-SNE plot. Here, each data point represents a sentence, and the color shows its true geographical origin. Red equals the West African sequences, and blue the Western European ones. The small size of most of the data points indicates that they have been classified correctly, meaning that the true and predicted class align.
Larger points, as shown in Figure 4, indicate a discrepancy between the predicted and true class, which means that the sequence has thus been wrongly classified. The table in Figure 5 displays this discrepancy for one data point. The color of each of the words, matching the class color, indicates how the specific word was classified. The predicted class is based on the overall sentence, where brighter colored words indicate a higher likelihood that these words belong to that class. What is interesting about this visualization is that it clearly shows what the classifications are based on. See the Github repository for a dynamic version of the visualization (https://gossalo.github.io/tsne-visual). Examples of words that make a sentence highly likely to be West African are for instance “chief”, “kweku ananse”, and “crocodile”, whereas for Western Europe these are “Reynard”, “fox”, and “castle”. The interactive nature of the plot allows to easily hover over the data and get an idea of the differences between the two corpora on a word and sequence level.
Most misclassifications are found in the center of the figure, which includes short sequences, containing less than five words. Since in a short sequence each individual word plays a larger role in changing the overall prediction value, this makes the sequence more prone to be classified incorrectly.
Misclassified sequences with a high prediction value, e.g., when we consider the sequences with prediction value p > 0.95 for West African and p < 0.05 for Western European, are more predictable. “Ant”, “hunter”, and “lion” are presumed to be West African but belong to Western European folk tales. This is an understandable misclassification, as these would be words that one associates with West Africa rather than Western Europe. Similar cases exist the other way around, for instance when “King”, “kingdom”, and “pudding” are wrongly classified as Western European.

5.5. Discussion Experiment 2

This section compared a BoW-based and an LSTM classifier, using two corpora of folk tales from West Africa and Western Europe as input. The main interest was to research whether a machine would be capable of distinguishing between these narratives. The approaches used by the classifiers have been analyzed and compared. Furthermore, the predictions made by a deep learning classification layer have been visualized by means of a t-SNE interactive visualization.
Both classifiers proved sufficiently capable of distinguishing between the classes. The BoW-based classifier (acc. 0.93) outperformed the LSTM classifier (acc. 0.79) significantly. Although the training set is arguably too small for the LSTM to perform better, the high score obtained by the BoW model indicates that distinguishing in use of words might be all it takes. More generally speaking we could state that West African and Western European tales use quite distinctive and culture-specific vocabulary.
Creating the t-SNE visualization proved the ideal approach to demonstrate and confirm this distinction. Sentences of the folk tales were represented in a high-dimensional fashion in the hidden layer of the LSTM. The t-SNE showed that words that we would associate with West Africa or Western Europe had a high likelihood to be placed in their expected class. Misclassifications occurred with sequences containing words that occur similarly often in both corpora. It could be argued that, given more data, an LSTM which takes into account interdependency between words could have correctly classified these sentences. The results confirm the observations described in Section 4.4, in which participants of the survey made similar choices based on use of characters, animals, and objects.

6. Experiment 3: Narrative Structure Analysis

6.1. Introduction

The previous section compared the West African and Western European corpora on occurrences of words. Instead of researching differences by directly comparing the corpora, the emphasis in this section lies on identifying and further exploring the narrative structure of individual narratives and their components.
The objective in this section is to extract narrative structures from folktales and compare them. Additionally, our aim is to search for recurring patterns indicative for the existence of a distinctive narrative structure between West African and Western European in parts of folk tales.

6.2. Related Work

Some AI researchers used specific narrative theories to examine folk tales. Propp’s theory proved particularly popular and was frequently used to analyze narrative structures. Finlayson, for instance, applied ML to extract Propp’s functions from a subset of semantically annotated text, claiming it to be “the first demonstration of a computational system learning a real theory of narrative structure” and “the largest, most deeply-annotated narrative corpus assembled to date”. His objectives were to improve the understanding of the higher-level meaning of natural language, advance our ability to extract deep structure from complex texts, and to increase computational understanding of cultural cognition, influences, and differences in stories. By adapting Propp’s descriptions, he set up rules to annotate 15 folk tales from the corpus. One of the main contributions was the development of an algorithm to extract narrative structures from annotated stories, called Analogical Story Merging). He clustered semantically similar events involving specific characters, as well as the position of the events in the story. After training the model, three important function groups emerged with high accuracy scores [39].
In his work, Habel mentions the use of linguistic markers [40], such as usage of the words “despite” and “nevertheless” to express contrast in texts. This is in line with our aim to investigate the folk tales on a word level. In this experiment we will equally search for linguistic markers in folk tales that are indicative for narrative parts. Similar to Finlayson’s work, ML classifiers will be used to classify texts and NLP tools are applied to extract knowledge from the folk tales. In this experiment, however, we follow the ratio of the three-act structure as a way to divide the folk tales and define the classes. This structure is chosen because of its clarity and straightforwardness, and its frequent use across many domains. Since our tales have not been annotated, we prefer to keep the structure as simple as possible.

6.3. Experimental Setup

For this part of the research, interviews were held in Ghana with several storytelling experts. They provided information about typical West African elements, as well as the existence of a West African narrative structure in Ghanaian stories. The experts confirmed the use of animals and mystic figures in stories to symbolize human characteristics and relations. In addition, they mentioned a storytelling structure, which enwraps the body of a story in a clear and repetitive beginning and ending. These parts are characterized by the occurrence of both past and future-oriented moral messages aimed at the listener, which relate to the events partaken by the main character(s). The ending summarizes the story to repeat the teaching element of the story and to emphasize the moral message once more. An example of this is “and that is why the zebra has stripes”.
The three-act structure that is maintained in this research generally follows a 1:2:1 ratio for the begin:mid:end parts respectively. For the first part of the technical implementation, we used ML classifiers to examine whether the three-act structure is a correct way to divide the narratives.
In the second part, we examined the occurrence of specific sequences of words to evaluate whether they correspond with what was said by the interviewees about there being a clear and repetitive beginning and end to West African stories.

Classification of Narrative Structures

In this experiment we investigated whether the three-act structure was applied to the stories in our corpora, and whether certain words or word sequences are characteristic of individual narrative parts. Both corpora were used to train the classifiers. However, in contrast to the previous section, in this experiment separate models were trained for both corpora instead of a merged one. The first step in preparing the data for training was to divide each story into multiple parts according to information acquired from the literature study. Each part was then assigned a label and was prepared for training. The data were cleaned by changing the words to lowercase, removing non-alphabetic symbols and stop words.
Since many supervised text classification models exist, a number of frequently used ones were trained, and their accuracy scores were compared. The data were split in training:testing sets of ratio 80:20. To generalize the results and make optimal use of the data, 10-fold cross validation was performed to calculate the accuracy of the classifiers instead of splitting the data into train/test/validation sets. Furthermore, each 10-Fold Cross Validation was performed ten times, each time using different folds, and the mean accuracy was used as a metric to reduce variability. This was done because, despite using k-Fold Cross Validation, the results still deviated for each run.
Multiple ML classifiers were trained on the data. The reason behind this is that in text classification there is no perfect fit. The performance of each classifier is very much dependent on the size and structure of the texts and how they were preprocessed. Instead of seeking a task-specific best algorithm, they were compared to see whether the different splits would affect the algorithms similarly. It should be noted that the aim is not to select the most state-of-the-art algorithms or to find the best performing one. Instead, the goal is to investigate the performance of different classifiers on our texts, specifically to find indicative patterns of text within our body of data.
-
Naïve Bayes (NB) is the simplest classifier based on Bayes’ rule, calculating the fraction of times a word appears among all words in a set of documents. Although NB is seen as relatively old compared to newer and more complex algorithms, it still performs well in many text classification tasks.
-
Linear Support Vector Machine (SVM) is a popular algorithm of choice whenever the sample size is small. SVM is based on finding an ideal hyper-plane between two or more vectors. The features that are used to determine the final position of a document in the feature space, are words, of which the occurrences are counted. Since longer documents will have higher average count values than shorter ones, tf-idf values for each word are used as input, to place more emphasis on distinctive words.
-
Logistic Regression (LR) can be used for binary classification but is also well applicable in multi-class classification tasks. The method learns the probability of a sample belonging to a class by finding the optimal decision boundary that is best at separating the classes. It is similar to the NB classifier in that both aim to predict target y given x. The difference is that NB is a generative model, it first models the joint distribution of x and y before predicting P(y|x). LR, on the other hand, is a discriminative model, which directly predicts P(y|x) by learning the input to output mapping.
-
Word2Vec Logistic Regression (Word2Vec) is a pretrained model and uses the Gensim model available online. In Word2Vec, semantics play a role such that similar meaning words have similar word embeddings. In this case, the words are tokenized, and word vector averaging is applied to each word to find the importance of each word in a document. Then, the averages are fed to a Logistic Regression algorithm.
-
Term Frequency Logistic Regression (TF) counts the occurrence of each token and considers tokens occurring twice or more, with the exception of stop words. This is fed to a simple logistic regression classifier to perform the classification task.
Table 3 and Table 4 illustrate the difference in mean accuracy between the classifiers for both corpora. Furthermore, it shows three ways in which the folk tales were divided: “split in half”, where both parts of the folk tale (i.e., begin and end), include 50% of the sentences. This is considered a baseline, which does not follow a complex ratio. In the “split at 25%”, the beginning and end part both make up 25% of the sentences. This follows the ratio of the three-act structure that we are interested in. In the “split at 10%”, the beginning and end part both contain only 10% of the sentences. This third split was introduced after talking to the Ghanaian storytelling experts and them mentioning a clear, distinguishable beginning and end part. Since the experts did not mention the role of the mid part in the interviews, and because the literature does not mention the role of the mid part, this motivated us to test splits that left out this mid part. The second reason why the mid part was left out in some splits was to ascertain that a bias in the algorithm attributed to an imbalance in the class size. These splits were used to examine which ratio can be considered most indicative for the distinction of different parts that make a West African story. The ratios illustrated in the tables indicate the portion of the training data provided for each part.
We first consider the performance of the classifiers on the West African corpus, as shown in Table 5. One thing that stands out when comparing the split in two with the split in three is that in both cases and for each classifier, the split in two has a significantly higher mean accuracy. Furthermore, in all cases, we see that the smaller the beginning and end parts get, the more the mean accuracy increases. The highest accuracy scores are found in the 10% begin:end group. This indicates that the assumption made in the interviews about there being a clear beginning and ending in storytelling, where most of the difference is found in the first and last sentences, is also the case for the written folk tales from the West African corpus.
When we compare the classifiers, Word2Vec seems to outperform most other classifiers up until the 10% split. This makes sense, since Word2Vec requires more training data. As is, only 20% (i.e., 10% begin, 10% end) of the corpus is used, making the dataset too small for Word2Vec to perform well. NB performs worst in all circumstances, with one outlier (i.e., 43.9%) in the split in three for the “split at 10%”. Besides this, the classifiers perform quite similarly, with no major outliers. The overall highest mean accuracy was obtained by the TF algorithm and is 77.9%.
The classifiers were also trained on the Western European corpus, to compare results (Table 6). At first glance, the results seem similar. Just like in the previous case, the smaller the beginning and ending class get, the more the mean accuracy increases. Moreover, the NB algorithm is again performing worst. The overall mean accuracy is a bit higher for the Western European corpus i.e., 64.8%) compared to the West African one (i.e., 60.5%). This is mostly due to the fact that the “split in half” performs quite well both compared to the other splits and to the other corpus.

6.4. Term Frequency of N-grams

Table 7 and Table 8 show the top 15 most occurring 4-g for the beginning and end parts of the narratives, and their frequencies of occurring. When interpreting these results, one should take into account that the term frequencies are quite low in all four cases, given the fact that we have 252 West African and 490 Western European tales in total. Nonetheless, the results indicate that ML and NLP technologies are useful in getting an overview of recurring patterns in narrative structures.
Table 7 shows that there is some overlap between the word sequences used in the beginning of the narratives (i.e., 26.7%). There is no overlap between the 4-g in the ending part of the tales displayed in Table 7. Thus, similarities seem to occur more frequently in the introduction of the story, which we already concluded in the previous part. Both backgrounds include time indications referring to the past, such as “once upon a time” or “there was once a”. Table 8 (left) confirms the existence of summarizing word sequences in the West African folk tales, explaining why or how something is the way it is.
The 4-g on the left of Table 8 show that the West African folk tales most frequently end with sequences such as “from that day on”, “and that is why”, or “ever since that time”. In fact, we argue that 8 out of 15 4-g can be categorized as “summarizing”. Each of these “summarizing” 4-g have been indicated with an asterisk in Table 8. These n-grams validate the past and future-oriented beginning and endings of West African stories, as mentioned by the Ghanaian storytelling experts. When we compare this to the right side of the table, which shows the Western European 4-g for the ending of the folk tales, we see that the summarizing ending is barely present here.

6.5. Discussion Experiment 3

For the technical implementation, each folk tale was divided into three parts following the three-act structure. Several ML classifiers were applied to the data, which achieved high accuracy scores when the beginning and end parts were kept small (i.e., 10% of the data). The high performance in the classification task indicates that these parts use characteristic sequences of words. Possible bias because of an imbalance in class size, e.g., when 80% of the data are attributed to the mid part, was removed by removing the mid part from the classification using only the equally sized beginning and end parts. This only further increased the accuracy scores, leading us to believe that beginning and end class are indeed most distinctive. Furthermore, 4-g were extracted from the beginning and ending sentences, again using a division of 10% for both parts.
The results showed recurring patterns emerging for both the beginning and ending parts, where the former were more similar between the two corpora and the latter were particularly distinctive. Furthermore, the ending confirmed the presence of a summary in the West African stories. This was also emphasized by the storytelling experts when the mentioned the storytelling structure. This indicates that, even though narratives have changed throughout the years, some elements from the storytelling traditions are still visible in written West African folk tales which emerge when NLP technologies are applied.

7. Discussion

One important consideration regarding the corpus and the methods used is the fact that the West African corpus is written entirely in English. Although the countries where these folk tales originate from are Anglophone, English is mainly used as a second language instead of being the mother tongue. West Africa has a long history of oral storytelling, in which written literature emerged only more recently as an effect of colonization. One could therefore argue that the corpus used is less authentic than it would have been if it were written in the mother tongue of the authors. If we want to analyze cultural differences in written literature more deeply, we should consider using narratives written in the mother tongue or that have been translated to English in a very precise way.
Another point is that West Africa is extremely diverse both in languages and in social and cultural beliefs, habits and customs. For the sake of this project, the different countries forming West Africa are grouped together, as are those from Western Europe. This allowed us to make general observations and comparisons. However, if we want to draw more definitive and specific conclusions about the cultures, the diversity between countries should be taken into account.
A limitation of the research is the small body of data. Unfortunately, not many more folk tales, especially West African folk tales, could be found online. ML and DL applications, however, normally need more data than the 2.2 MB used in this project. Increasing the size of the corpora would probably lead to more sound results. Especially DL models, such as the RNN algorithm, need a vast amount of data to perform well and to prevent overfitting. Doubling our data in size, for instance by building a crowdsourcing platform to collect new tales, could already improve text generation performance.
The scope of this research focused on the use of ML and NLP techniques on our corpora. Although we used algorithms that are known to perform well in computation linguistics problems, the focus was not on finding the most state-of-the-art models. In future work it would be interesting to apply these models to an increased amount of our data. Examples of more state-of-the-art models that could improve our results are deep neural networks with Word2Vec embedding, and Transformer-based advances.
Another interesting focus for future work would be to provide the corpora with annotations. In related research, classifiers were trained on annotated texts in order to extract narrative structures. This could possibly improve our understanding of the data and extract more meaningful and different recurring patterns from the narrative structures. The annotations could be supplied by consulting storytelling or narratology experts, or by means of the previously mentioned crowdsourcing platform.
Finally, the use of ML and NLP to perform a cross-cultural analysis of texts can be expanded to other domains, such as the medical domain or in education. This could enhance the tailoring of texts to fit a specific culture or event.

8. Conclusions

This paper investigated the role of machine learning and natural language processing in analyzing and generating West African folk tales. The analysis shows that NLP and ML techniques can indeed contribute to automatically extract, analyze, and generate culture sensitive and informative features from West African folk tales. Furthermore, it was shown that NLP technologies can be used to do a comparative analysis between West African and Western European folk tales. The added value of using NLP compared to conducting more traditional and manually extensive narratology research is that the former allows for a faster and more precise analysis of large amounts of data, in which patterns difficult to manually identify emerge.
A main contribution of the research is the collection of two corpora of folk tales. These were used as input for the ML and NLP text generation and classification models. We furthermore presented a human evaluation conducted to assess the text generation model. This evaluation indicated that the generated texts, although lacking a clear syntactic and semantic coherence, contained several culture-specific elements.
The classification task proved successful in identifying cross-cultural differences between West African and Western European folktales. The classification models and the t-SNE interactive visualization demonstrated the weight of each word within the corpora. Words characteristic for either culture were easily identified and confirmed the relevance of context-specific characters, animals and objects in distinguishing between geographical origins of folk tales.
This research has demonstrated that ML and NLP techniques are applicable in a wide range of tasks concerning the cross-cultural exploration of folk tales. Promising results have been achieved with regard to culture-specific text generation, classification, and narrative structure extraction in West African folk tales. The results would have been difficult or simply impossible to replicate without using ML and NLP techniques. Future work should focus on expanding and annotating the corpora, to allow for a more thorough analysis.

Author Contributions

Conceptualization, G.L. and V.d.B.; methodology, G.L., V.d.B. and C.J.v.A.; software, G.L.; validation, G.L., V.d.B.; formal analysis, G.L. and V.d.B.; investigation, G.L.; resources, C.J.v.A.; data curation, G.L.; writing—original draft preparation, G.L.; writing—review and editing, G.L. and V.d.B.; visualization, G.L.; supervision, V.d.B. and C.J.v.A.; project administration, G.L. and V.d.B.; funding acquisition, G.L. and C.J.v.A. All authors have read and agreed to the published version of the manuscript.

Funding

This research was partly funded by a travel grant from the Treub-Maatschappij, the Society for the Advancement of Research in the Tropics (https://treub-maatschappij.org/).

Conflicts of Interest

The authors declare no conflict of interest.

References

  1. Lundby, K. Digital Storytelling, Mediatized Stories: Self-Representations in New Media; Peter Lang: Bern, Switzerland, 2008. [Google Scholar]
  2. Abbott, H.P. The Cambridge Introduction to Narrative; Cambridge University Press: Cambridge, UK, 2008. [Google Scholar]
  3. Edosomwan, S.; Peterson, C.M. A History of Oral and Written Storytelling in Nigeria. In Commission for International Adult Education; ERIC: New Mexico, USA, 2016. [Google Scholar]
  4. Tang, P. Masters of the Sabar: Wolof Griot Percussionists of Senegal; Temple University Press: Philadelphia, PA, USA, 2007. [Google Scholar]
  5. Tuwe, K. The African oral tradition paradigm of storytelling as a methodological framework: Employment experiences for African communities in New Zealand. In Proceedings of the 38th AFSAAP Conference: 21st Century Tensions and Transformation in Africa, Melbourne, Australia, 28–30 October 2015. [Google Scholar]
  6. Grimm, J.; Grimm, W. The Original Folk and Fairy Tales of the Brothers Grimm: The Complete First Edition; Princeton University Press: Princeton, NJ, USA, 2014. [Google Scholar]
  7. Finnegan, R.H.; Finnegan, R.; Turin, M. Oral Literature in Africa; Oxford University Press: Oxford, UK, 1970; Volume 970. [Google Scholar]
  8. Propp, V. Morphology of the Folktale; University of Texas Press: Austin, TX, United States, 2010; Volume 9. [Google Scholar]
  9. Grasbon, D.; Braun, N. A morphological approach to interactive storytelling. In Proceedings of the CAST01, Living in Mixed Realities, Conference on Artistic, Cultural and Scientific Aspects of Experimental Media Spaces, Sankt Augustin, Germany, 21–22 September 2001; pp. 337–340. [Google Scholar]
  10. Chatman, S.B. Story and Discourse: Narrative Structure in Fiction and Film; Cornell University Press: Ithaca, NY, USA, 1980. [Google Scholar]
  11. Lucas, D.W. Aristotle Poetics; University of Chicago Press: Chicago, IL, USA, 1968. [Google Scholar]
  12. Brütsch, M. The three-act structure: Myth or magical formula? J. Screenwrit. 2015, 6, 301–326. [Google Scholar] [CrossRef]
  13. Campbell, J. The Hero with a Thousand Faces; New World Library: Novato, CA, USA, 2008; Volume 17. [Google Scholar]
  14. Vogler, C. The Writer’s Journey—Mythic Structure for Writers; Michael Wiese Productions: Studio City, CA, USA, 1998. [Google Scholar]
  15. Dickey, M.D. Game design narrative for learning: Appropriating adventure game design narrative devices and techniques for the design of interactive learning environments. Educ. Technol. Res. Dev. 2006, 54, 245–263. [Google Scholar] [CrossRef]
  16. Gervás, P. Propp’s Morphology of the Folk Tale as a Grammar for Generation. In 2013 Workshop on Computational Models of Narrative; Schloss Dagstuhl-Leibniz-Zentrum für Informatik GmbH, Dagstuhl Publishing: Saarbrücken/Wadern, Germany, 2013. [Google Scholar]
  17. Finlayson, M.A. Inferring Propp’s functions from semantically annotated text. J. Am. Folk. 2016, 129, 55–77. [Google Scholar] [CrossRef]
  18. Gervás, P.; Lönneker-Rodman, B.; Meister, J.C.; Peinado, F. Narrative models: Narratology meets artificial intelligence. In Proceedings of the International Conference on Language Resources and Evaluation. Satellite Workshop: Toward Computational Models of Literary Analysis, Genoa, Italy, 22–28 May 2006; pp. 44–51. [Google Scholar]
  19. Imabuchi, S.; Ogata, T. A story generation system based on Propp theory: As a mechanism in an integrated narrative generation system. In International Conference on NLP; Springer: Berlin/Heidelberg, Germany, 2012. [Google Scholar]
  20. Berry, J.; Spears, R. West African Folktales; Northwestern University Press: Evanston, IL, USA, 1991. [Google Scholar]
  21. Iyasere, S.O. Oral tradition in the criticism of African literature. J. Mod. Afr. Stud. 1975, 13, 107–119. [Google Scholar] [CrossRef]
  22. Barthes, R. Le Degré zéro de L’écriture; Le Seuil: Paris, France, 2015. [Google Scholar]
  23. Gyasi, K.A. Writing as translation: African literature and the challenges of translation. Res. Afr. Lit. 1999, 30, 75–87. [Google Scholar] [CrossRef]
  24. Ninan, O.D.; Odéjobí, O.A. Theoretical issues in the computational modelling of Yorùbá narratives. In 2013 Workshop on Computational Models of Narrative; Schloss Dagstuhl—Leibniz-Zentrum fuer Informatik: Dagstuhl, Germany, 2013. [Google Scholar]
  25. Sackey, E. Oral tradition and the African novel. Mod. Fict. Stud. 1991, 37, 389–407. [Google Scholar] [CrossRef]
  26. Simmons, D.C. Analysis of cultural reflection in Efik folktales. J. Am. Folk. 1961, 74, 126–141. [Google Scholar] [CrossRef]
  27. Ficler, J.; Goldberg, Y. Controlling linguistic style aspects in neural language generation. arXiv 2017, arXiv:1707.02633. [Google Scholar]
  28. Sutskever, I.; Vinyals, O.; Le, Q.V. Sequence to sequence learning with neural networks. In Advances in Neural Information Processing Systems; Curran Associates Inc.: Red Hook, NY, USA, 2014. [Google Scholar]
  29. Bhardwaj, A.; Di, W.; Wei, J. Deep Learning Essentials: Your Hands-on Guide to the Fundamentals of Deep Learning and Neural Network Modeling; Packt Publishing Ltd.: Birmingham, UK, 2018. [Google Scholar]
  30. Johnson, D.D. Generating polyphonic music using tied parallel networks. In Computational Intelligence in Music, Sound, Art and Design, Proceedings of the International Conference on Evolutionary and Biologically Inspired Music and Art, Amsterdam, The Netherlands, 19–21 April 2017; Springer: Amsterdam, The Netherlands, 2017; pp. 128–143. [Google Scholar]
  31. Manu, S.Y. Six Ananse Stories; Sedco Publishing Ltd.: Accra, Ghana, 1993. [Google Scholar]
  32. Hochreiter, S.; Schmidhuber, J. Long short-term memory. Neural Comput. 1997, 9, 1735–1780. [Google Scholar] [CrossRef] [PubMed]
  33. Joulin, A.; Grave, E.; Bojanowski, P.; Mikolov, T. Bag of tricks for efficient text classification. arXiv 2016, arXiv:1607.01759. [Google Scholar]
  34. Lai, S.; Xu, L.; Liu, K.; Zhao, J. Recurrent convolutional neural networks for text classification. In Proceedings of the Twenty-ninth AAAI Conference on Artificial Intelligence, Austin, Texas, USA, 25–30 January 2015. [Google Scholar]
  35. Nguyen, D.; Trieschnigg, D.; Meder, T.; Theune, M. Automatic classification of folk narrative genres. In Proceedings of the Workshop on Language Technology for Historical Text (s) at KONVENS 2012, Vienna, Austria, 19–21 September 2012. [Google Scholar]
  36. Trieschnigg, D.; Hiemstra, D.; Theune, M.; Jong, F.; Meder, T. An Exploration of Language Identification Techniques in the Dutch Folktale Database. In Proceedings of the Workshop on Adaptation of Language Resources and Tools for Processing Cultural Heritage (LREC 2012), Istanbul, Turkey, 21–27 May 2012. [Google Scholar]
  37. Dai, A.M.; Le, Q.V. Semi-supervised sequence learning. In Advances in Neural Information Processing Systems; Curran Associates Inc.: Red Hook, NY, USA, 2015; pp. 3079–3087. [Google Scholar]
  38. Maaten, L.V.; Hinton, G. Visualizing data using t-SNE. J. Mach. Learn. Res. 2008, 9, 2579–2605. [Google Scholar]
  39. Finlayson, M.M. Learning Narrative Structure from Annotated Folktales. Ph.D. Thesis, Massachusetts Institute of Technology, Cambridge, MA, USA, 2012. [Google Scholar]
  40. Habel, C. Stories—An artificial intelligence perspective (?). Poetics 1986, 15, 111–125. [Google Scholar] [CrossRef]
Figure 1. RNN network architectural layers forming the word-level (left) and character-level (right) text generation models.
Information 11 00236 g001
Figure 2. The set of layers stacked that together form the LSTM classification architecture.
Information 11 00236 g002
Figure 3. The set of stacked layers that together form the BoW classification architecture.
Information 11 00236 g003
Figure 4. t-SNE visualization with each datapoint symbolizing a sequence of words classified by the hybrid classifier according to geographical background (i.e., West European = blue, West African = red).
Information 11 00236 g004
Figure 5. t-SNE table of a larger data point that indicates a discrepancy between the predicted class and true class. The table shows the prediction value and a color indication of the classified geographical background for each of the words according to class color.
Information 11 00236 g005
Table 1. Descriptive statistics for the two corpora of type B.
West AfricanWestern European
Total no. folk tales252490
Total word count203,537202,866
Total no. characters857,590855,097
Min. word count5334
Max. word count78783536
Avg. word count804421
Table 2. List of all of the parameters tested for the two types of LSTM text generation models.
LSTM TypeCharacter-LevelWord-Level
Number of units100, 200100, 200
Sequence length7, 7 ∗ avg(word length), 50, 1007, 50, 100
Max. training epochs25, 50, 75, 1005, 10, 25, 50
Dropout0.2, 0.60.2, 0.6
Batch size64, 12864, 128
Table 3. Top 10 most frequently occurring words per corpus (type B).
West AfricanWestern European
1Day
564
Little
585
2Time
533
Time
513
3Tortoise
526
King
466
4King
485
Day
379
5Little
482
Fox
344
6Lion
430
Wolf
309
7Told
393
Home
279
8Water
390
House
270
9People
385
Wife
256
10Jacka
l379
Reynard
241
Table 4. List of all of the parameters tested for the text classification models.
Classifier TypeLSTMBag-of-Words
Number of units100, 200, 300-
Max. training epochs25, 50, 75, 1005, 25, 50
Dropout0.2, 0.4, 0.60.2, 0.4, 0.6
Table 5. Mean accuracy of classifiers for different splits—West Africa.
Split in HalfSplit at 25%Split at 10%
begin:mid:endbegin:endbegin:mid:endbegin:endbegin:mid:endbegin:end
1:11:2:11:11:8:11:1
NB-37.0%34.1%57.4%43.9%73.2%
SVM-45.4%44.5%66.2%72.0%77.8%
LR-48.8%45.0%67.3%71.4%77.3%
Word2Vec-60.1%48.0%70.4%67.0%73.3%
TF-55.0%53.0%70.5%74.8%77.9%
Table 6. Mean accuracy of classifiers for different splits—Western Europe.
Split in HalfSplit at 25%Split at 10%
begin:mid:endbegin:endbegin:mid:endbegin:endbegin:mid:endbegin:end
1:11:2:11:11:8:11:1
NB-59.5%43.5%63.4%50.4%66.1%
SVM-65.5%51.3%75.2%66.3%77.0%
LR-64.7%50.6%73.5%67.6%79.1%
Word2Vec-64.2%52.6%69.0%69.4%75.6%
TF-65.8%53.0%74.4%66.1%75.5%
Table 7. TF-IDF 4-g beginning of 252 African (left) and 490 European folk tales (right).
4-gTerm Frequency4-gTerm Frequency
once upon a time25once upon a time27
upon a time there17upon a time there20
a time there lived10a time there was17
a long time ago9time there was a16
time there lived a9there was once a14
there was once a8once on a time12
a time there was7there was a king6
very long time ago6a long time ago5
time there was a6a donkey and a5
a very long time6a lion and a5
there was a man6and was just doing4
man and his wife5was a king who4
once there was a5was just going to4
long time ago in5caught sight of a4
want to marry her5on a time a4
Table 8. Term frequencies for 4-g ending of 252 African (left) and 490 European folk tales (right).
4-gTerm Frequency4-gTerm frequency
from that day on *8rest of their lives5
and from that day *7that he had been5
and that is why *7stop him eat him4
ever since that time *5for rest of their4
and that is how *4he said to himself4
passed a law that4and they lived happily3
that is reason why *3more than a match3
that I bought for3as soon as he3
for many years and *3fast as he could3
gazelle that i bought3her that he had3
that for future no3they lived happily together3
since that time whenever *3fox laughed and said3
what are you doing3told her that he3
for future no one3said that he was3
did not want to3that i did not3

