American Children’s Screen Time: Diminished Returns of Household Income in Black Families


Department of Family Medicine, Charles R Drew University of Medicine and Science, Los Angeles, CA 90059, USA
Information 2020, 11(11), 538; https://doi.org/10.3390/info11110538
Submission received: 17 October 2020
/
Revised: 9 November 2020
/
Accepted: 19 November 2020
/
Published: 20 November 2020
Abstract
:While increased household income is associated with overall decreased screen time for children, less is known about the effect of racial variation on this association. According to Minorities’ Diminished Returns (MDRs) theory, family income and other economic resources show weaker association with children’s developmental, behavioral, and health outcomes for racialized groups such as black families, due to the effect of racism and social stratification. In this study, we investigated the association, by race, between family income and children’s screen time, as a proxy of screen time. This longitudinal study followed 15,022 American children aged 9–11 over a 1-year period. The data came from the baseline of the Adolescent Brain Cognitive Development (ABCD) study. The independent variable was family income, and it was categorized as a three-level nominal variable. The dependent variable, screen time, was a continuous variable. Ethnicity, gender, parental education, and marital status were the covariates. The results showed that family income was inversely associated with children’s screen time. However, there was a weaker inverse association seen in black families when compared with white families. This was documented by a significant statistical interaction between race and family income on children’s screen time. Diminished association between family income and children’s screen time for black families, compared with white families, is similar to MDRs and reflects a health risk to high-income black children. In a society where race and skin color determine opportunities and treatment by society, children from middle class black families remain at risk across multiple domains. We should not assume that income similarly promotes the health of all racial and ethnic groups. Addressing health and behavioral inequalities requires interventions that go beyond equalizing socioeconomic resources for black families. Marginalization, racism, and poverty interfere with the normal family income-related development of American children.
1. Introduction
The associations between race [1], socioeconomic status (SES) [2,3,4], and health behaviors are very complex [5,6,7]. First, racial minorities (e.g., blacks) and low SES children show high-risk behaviors and poor health statuses [8,9]. Second, race and SES closely overlap [10], with most racial and ethnic minorities having lower SESs [10]. As a result, some of the black–white differences in high-risk behaviors are not an effect of race, but the existing SES gap across racial groups. That is, a low SES may partially explain why race or ethnicity is linked to behavior and health [11]. Fourth, some evidence suggests that SES effects may depend on race or ethnicity, with the effects having a tendency to be weaker for black than white families [12]. This pattern is commonly known as Minorities’ Diminished Returns (MDRs) [13,14].
According to the MDRs framework [13,14], SES indicators, such as family income, show weaker effects on the behavior and health of black [15], Hispanic [12,16], Asian American [17], Native American [18], and even marginalized white [19] families. In this view, racial and ethnic minority groups face additional difficulties; mistreatment and injustice will stay a risk despite a high SES. As a result of MDRs, we observe higher levels of anxiety [20], depression [21], and suicide [22] in high-SES black children than what is seen in high-SES white children.
While there is an extensive body of research documenting MDRs of parental education [23], family income [24,25], and marital status [26] on a wide range of developmental, health, emotional, and behavioral outcomes [21,23,24,25], we are not aware of any previous studies that test MDRs of a family’s SES on children’s screen time. We know that a high SES shows weaker effects on depression [21], anxiety [20], impulsivity [24], grade point average (GPA) [23], attention deficit hyperactivity disorder (ADHD) [27], diet [28], exercise [29], sleep [30], substance use [23], obesity [31], and chronic disease [23] for black children than white children. However, there is more to be learned about the relevance of MDRs of the SES indicators to screen time for black children.
Aims
Given the existing gap in the contribution of MDRs in explaining the black–white gap in screen time, we conducted the current study with two aims. The first was to estimate the overall link between income and screen time. The second aim was to compare racial differences in terms of income and screen time, especially between black and white families. We hypothesized a protective effect of family income on children’s screen time (Hypothesis 1). We also expected this association to be weaker (diminished) for black children than white children (Hypothesis 2).
2. Methods
2.1. Design and Settings
2.2. Participants and Sampling
The ABCD participants were 9–11-year-old children who were selected from multiple cities across various states. ABCD recruitment primarily relied on the US school system. For a detailed description of the sampling and recruitment for the ABCD study, consult [38]. The eligibility of our analysis was having valid data on all our study variables, including race, family income, and screen time. The analytical sample of this paper was 15,022.
2.3. Study Variables
The study variables included race, ethnicity, sex, family income, household income, parental education, marital status, and screen time. Race was self-identified as black, Asian, mixed or other, and white (reference category). The mixed or other race reflects Native American and individuals with mixed or other races. The sex of the child was 1 for male and 0 for female. Parental marital status was reported by the parents and was 1 for married and 0 for other. Household income, reported by the parent, was a three-level categorical measure of less than 50 K (K = 1000), 50–100 K, and 100+ K. Screen time was reported by the parents. This measure was for average weekdays and measured in hours. This variable was treated as a continuous measure, with a higher value indicating more screen time. Parents’ reports of children’s screen time were believed to be reliable and valid [39].
2.4. Data Analysis
We used the Data Exploration and Analysis Portal (DEAP) for data analysis. The DEAP uses the R package for statistical calculations. We reported the mean (standard deviation (SD)) and frequency (%) of our variables both overall and by race. We also performed the chi-square and analysis of variance (ANOVA) tests for our bivariate analysis. We used two mixed-effects regression models for multivariable modeling that allowed us to adjust to our data’s nested nature. Observations were nested to participants from families who were selected across the sites and states. We ruled out collinearity between our independent variables in our models. We also confirmed the near-to-normal distribution of error terms of our regression model. Both models were performed in the overall sample. Model 1 did not have any interaction terms between race and family income. Model 2 included interaction terms between race and family income. In both models, children’s screen time was the outcome (Table 1). The regression coefficient (b), SE, 95% CI, and p-value were reported. Statistical power was calculated based on the number of variables in the regression model, alpha, and percentage of variance explained. According to Cohen, a sample size of 15,000 will provide a power of 99% for a regression model with eight terms, which explains 0.005 of the variance (expected R square) and a p-value of 0.05 [40,41].
2.5. Ethical Aspect
The ABCD study has institutional review board (IRB) approval, and all participants have provided assent or consent, depending on their family income [37]. Given that our analysis was performed on fully de-identified data, our analysis was exempt from a full IRB review.
3. Results
3.1. Descriptives
Overall, 15,022 observations from 9–11-year-old children were analyzed. Most participants were whites, followed by blacks. From all observations, 10,249 (68.2%) were for white children, 1961 (13.1%) were for black children, 339 (2.3%) were for Asian children, and 2473 (16.5%) were for other or mixed-race children. On average, children had 3.55 hours (SD = 3.14) on average of weekday screen time.
Table 2 presents descriptive data by race. This table also compares racial groups by the study variables. As this table shows, black and mixed or other race participants had the lowest parental educations and incomes, and white and Asian children had the highest parental educations and household incomes. The average weekday screen time was highest for black (5.56 ± 3.99) children and lowest for white (3.17 ± 2.77) and Asian American (2.23 ± 2.18) children (p < 0.001).
3.2. Multivariate Models
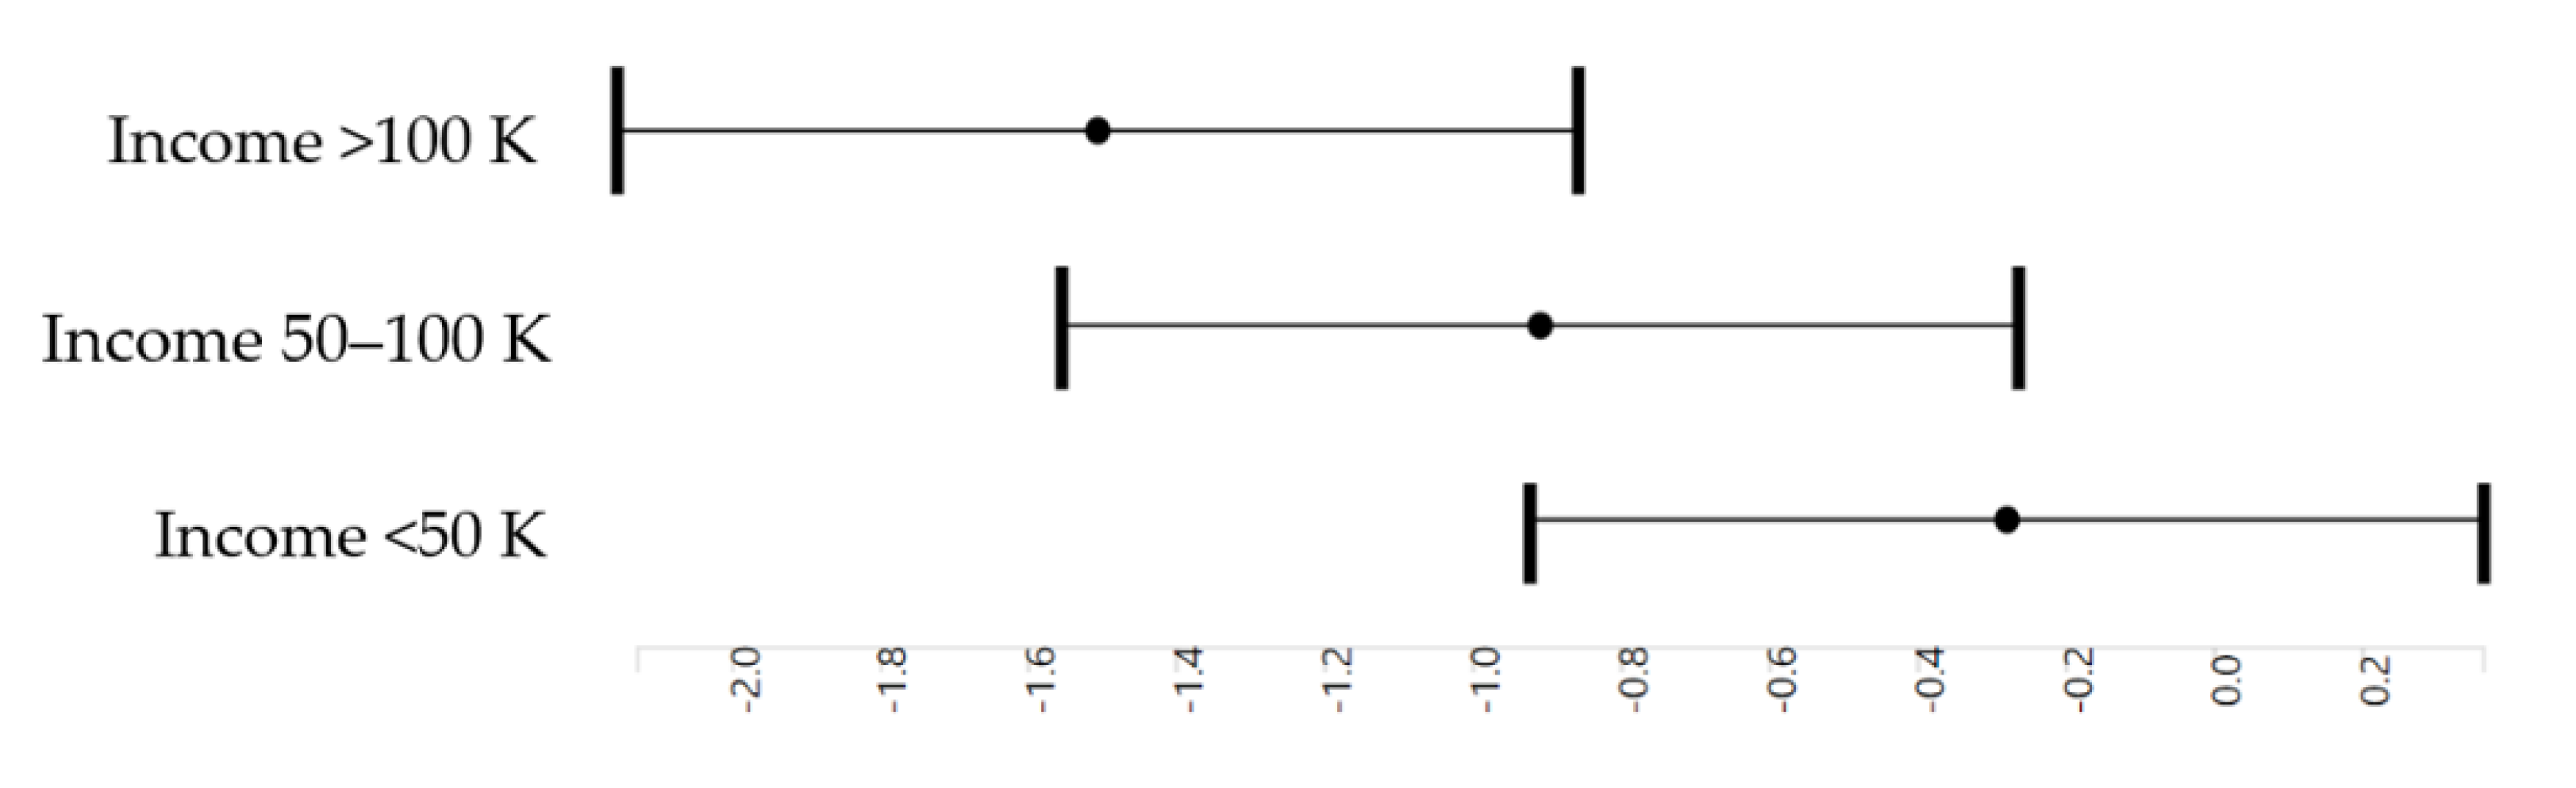
Table 3 presents the results of three mixed-effects regression models in the overall sample. Model 1 shows the association between family income and race with children’s screen time. Compared with an income less than 50 K, an income between 50 and 100 K was associated with a significant decline in children’s average weekdays’ screen times (b = −0.60, p < 0.001). Compared with an income less than 50 K, an income of more than 100 K was associated with a larger decline in children’s average weekdays’ screen times (b = −1.20, p < 0.001). The Asian American race (b = −0.52, p = 0.005) was also associated with lower average weekdays’ screen times. At the same time, black (b = 1.32, p < 0.001) and mixed or other (b = 0.18, p = 0.019) races were associated with a higher average screen time for children.
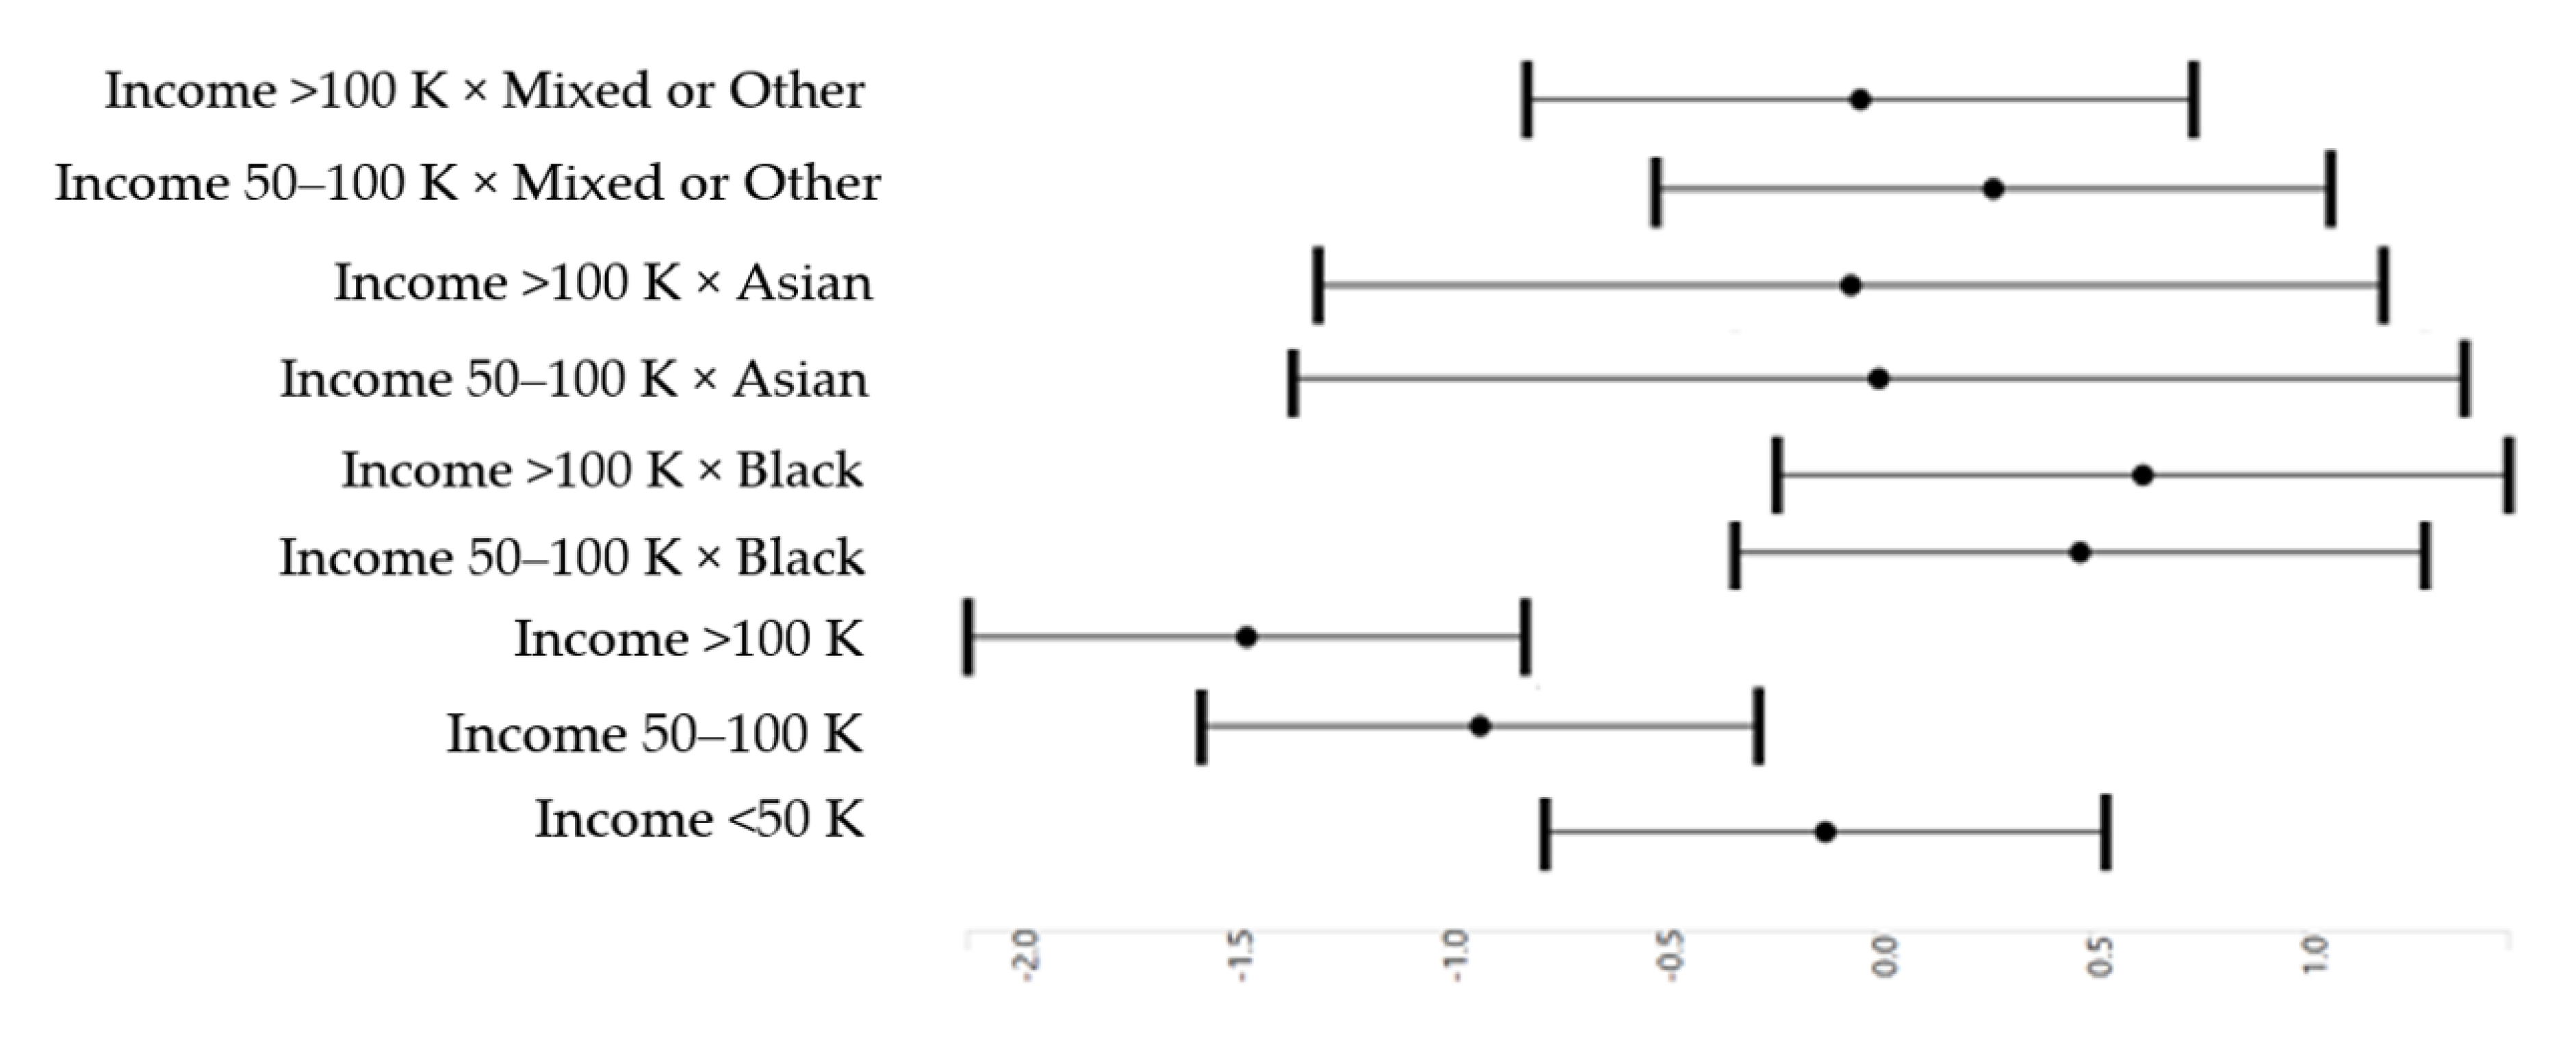
Model 2 showed an interaction between family income and race with children’s screen time. This interaction indicated that the boosting effect of family income and children’s screen time was weaker for black children than white children.
Figure 1 presents a positive association between family income and screen time in the pooled sample. Higher-income children had lower screen times.
Figure 2 shows the interaction between family income and race with children’s screen time. This interaction indicated that the boosting effect of family income on children’s screen time was weaker in black families than white families.
4. Discussion
This study showed an inverse association between family income and children’s screen time overall. However, this association was stronger for white children than black children. That is to say, while a high family income accompanied less screen time for American children, this association was weaker in black families than white families. As a result, high-income black children had high screen times, a pattern absent for high-income white children.
Our findings reflected the impact of the MDRs of family income on children’s screen time in black families. This is in line with what is already established for the effects of MDRs of many economic resources, such as family income, on impulsivity [24], reward responsiveness [42], inhibitory control [43], attention [44], and ADHD [27] for black children compared with white children. Similar MDRs were also reported for the effects of family SES indicators, such as parental education, household income, and marital status, on behavioral risks such as substance use [23], diet [28], exercise [29], anxiety [20], depression [21], and suicide [22]. These are all diminishing returns of economic resources for black youths when compared with white youths [16,45,46,47].
These MDRs are not specific to any particular domain or outcome, suggesting that they are due to society, but not culture, behavior, or biology. Thus, high-income black children do not have high screen times because they are innately different or lazy. Similarly, the diminished slope of income with screen time is not because blacks have less interest in or undervalue physical activity, since similar MDRs are shown for all marginalized groups across marginalized identities [13,14]. MDRs are not specific to blacks [25], but are also evident in Hispanics [12,16,48,49], Asian Americans [17], Native Americans [18], and even marginalized whites [19]. They are also not specific to a particular SES resource, behavioral outcome, or age group. These patterns are present for children [24,25,50], adults [46], and older adults [51]. This paper extends the previous work on the MDRs of family income and screen time in black children.
Due to sociological and structural factors such as segregation, labor market discrimination, and racism, black families live under tremendous stress regardless of their SES [52,53,54]. High-SES black families generate less income and wealth and live in worse neighborhoods than whites with similar SESs [55,56,57]. Black workers with the very same educational attainment work in worse conditions and receive worse income than whites with similar educations [55].
A wide range of economic and non-economic mechanisms can explain the MDRs of family income and economic resources and their greater effect on children’s screen time in black children than white families. Black families experience high levels of stress across all SES levels [58]. Social mobility has been more taxing for high-SES black families than white families [59]. Exposure [60,61] and vulnerability [62] to discrimination are high for high-SES black families. While low-SES black families struggle with food insecurity, poverty, and neighborhood disorders, high-SES black families experience discrimination due to their proximity to whites [60]. As discrimination reduces the chance of healthy brain development [61,62], high-SES black children may remain at risk of impulsivity [24]. As a result, family income, one of the main drivers of children’s brain development, shows weaker effects for black families than white families.
While low SESs and poor outcomes are one type of disadvantage in black communities, MDRs reflect the second type of disadvantage [13,14]. These two sources of disadvantages are qualitatively different. While the former reflects unequal outcomes and opportunities, the latter reflects the low response to the presence of individual-level resources such as family income and SES. It is due to the latter that policymakers may observe sustained inequality despite investments. To address the latter, there is a need to address the systemic causes of inequalities. As a result of the combination of these two, black families experience double jeopardy. Not only are resources such as SES scarce, their influences are also hindered and dampened due to the multitude of constraints in their environment [13,63].
Multi-level economic and environmental mechanisms reduce the marginal returns of family SES, such as income, for black families [13,63]. MDRs are attributed to social stratification, segregation, discrimination, racism, and marginalization. These processes function across multiple societal institutions [13,63]. Racial injustice, prejudice, and discrimination have historically interfered with the gain of resources and assets in black communities [64,65,66]. One of the many causes of MDRs may be childhood poverty [57]. As a result of historical and structural injustice, MDRs hinder the effects of existing resources and assets across settings and social groups.
4.1. Implications
High screen time has a negative influence on child brain development. Using ABCD data, we found that high-SES black children have high screen times regardless of their SES. Our finding is in line with other studies that have documented diminished effects of high SES on the brain development of black children, when compared to white children. In a study using ABCD data, high-SES black children remained at risk of depression and suicide, while high-SES white children were at low risk of depression and suicide [22]. In other ABCD studies, high-SES black children remained at risk of reward dependence. However, white high-SES children had low reward dependencies [42,67]. In other studies, high-SES black children remained at risk of social, emotional, and behavioral problems. However, this was not the case for white children from high-SES families [68]. In another analysis of the ABCD study, a high subjective SES was independently associated with the amygdala size in larger children. However, the boosting effect of a high SES on total amygdala volume was weaker for black children than white children. As such, high-SES black children remain at risk regarding amygdala size, regardless of their SES, which is due to the diminished return of SES on all aspects of the development of children due to racism [69].
4.2. Limitations
The current study has some methodological limitations. This study does not suggest causal inferences. However, it is more likely that poverty impacts sedentary behavior than the children’s screen time shapes the household SES. Still, the findings reported here are correlations, not causes. To establish causal evidence, we need to have repeated measurements of SES and screen time and test if changes in family income precede a change in children’s screen times. We only tested the MDRs of family income. Previous work had established MDRs of various family SES indicators, such as parental education [42,67]. Future research should test if similar MDRs also apply for other behaviors and time spent on other activities. Additionally, we only controlled for family SES, and all our confounders were family- and individual-level SES indicators. It is imperative to control for contextual and neighborhood-level indicators, as well as health. Finally, we did not study how these MDRs changed over time, how they emerged, and how family dynamics and parenting contributed to them. We also do not know how parents’ screen times and family norms, expectations, and rules shaped such MDRs. More research is needed on whether these black–white gaps narrow, maintain, or widen over time and whether any factor can undo them. Finally, it is unknown whether MDRs related to inequalities in children’s screen time contribute to the higher-than-expected risk of chronic disease [70,71,72,73] in high-SES black people.
5. Conclusions
Relative to white children, black children show weaker family income effects on screen time, meaning that screen time stays high in black children across all family income groups. We did not observe the same pattern for high-income white families. The diminishing returns of family income on lifestyle are important because screen time is a driver of obesity, depression, and several other health problems. To minimize the black–white health and behavioral gap, it is imperative to address societal and structural barriers beyond SES. These include racism, stratification, injustice, and hopelessness in black communities. Such factors may reduce the health return of family SES for black populations. There is a need to find public and social policies that minimize MDRs. Such policies may need to address the multi-level mechanism by which racism impacts the lives of black American families. Systemic, structural, and societal causes of inequalities should be discussed rather than ignored.
Funding
Shervin Assari was supported by the National Institutes of Health (NIH) grants 5S21MD000103, D084526−03, CA201415 02, DA035811-05, U54MD008149, U54MD007598, and U54CA229974. The ABCD study was supported by the National Institutes of Health and additional federal partners under award numbers U01DA041022, U01DA041028, U01DA041048, U01DA041089, U01DA041106, U01DA041117, U01DA041120, U01DA041134, U01DA041148, U01DA041156, U01DA041174, U24DA041123, U24DA041147, U01DA041093, and U01DA041025. A full list of supporters is available at https://abcdstudy.org/federal-partners.html. A listing of participating sites and a complete listing of the study investigators can be found at https://abcdstudy.org/Consortium_Members.pdf. ABCD consortium investigators designed and implemented the study or provided data, but did not necessarily participate in the analysis or writing of this report. This manuscript reflects the views of the authors and may not reflect the opinions or views of the NIH or ABCD consortium investigators. The ABCD data repository grows and changes over time. The current paper used Curated Annual Release 2.0, also defined in NDA Study 634 (doi:10.15154/1503209). DEAP is software provided by the Data Analysis and Informatics Center of ABCD located at UC San Diego, with generous support from the National Institutes of Health and the Centers for Disease Control and Prevention under award number U24DA041123. The DEAP project information and links to its source code are available under the resource identifier RRID: SCR_016158.
Acknowledgments
Assari wishes to thank Luke Sorensen for his excellent edits to the paper.
Conflicts of Interest
The author declares no conflict of interest.
References
- Link, B.G.; Phelan, J. Social conditions as fundamental causes of disease. J. Health Soc. Behav. 1995, pp. 80–94. Available online: https://www.jstor.org/stable/2626958?seq=2#metadata_info_tab_contents (accessed on 19 November 2020).
- Mirowsky, J.; Ross, C.E. Education, health, and the default American lifestyle. J. Health Soc. Behav. 2015, 56, 297–306. [Google Scholar] [CrossRef] [PubMed]
- Ross, C.E.; Mirowsky, J. The interaction of personal and parental education on health. Soc. Sci. Med. 2011, 72, 591–599. [Google Scholar] [CrossRef] [PubMed] [Green Version]
- Ross, C.E.; Mirowsky, J. Refining the association between education and health: The effects of quantity, credential, and selectivity. Demography 1999, 36, 445–460. [Google Scholar] [CrossRef] [PubMed]
- Williams, D.R.; Mohammed, S.A.; Leavell, J.; Collins, C. Race, socioeconomic status and health: Complexities, ongoing challenges and research opportunities. Ann. N. Y. Acad. Sci. 2010, 1186, 69. [Google Scholar] [CrossRef] [PubMed]
- Williams, D.R. Race, socioeconomic status, and health: The added effects of racism and discrimination. Ann. N. Y. Acad. Sci. 1999, 896, 173–188. [Google Scholar] [CrossRef]
- Chen, R.; Kessler, R.C.; Sadikova, E.; NeMoyer, A.; Sampson, N.A.; Alvarez, K.; Vilsaint, C.L.; Green, J.G.; McLaughlin, K.A.; Jackson, J.S.; et al. Racial and ethnic differences in individual-level and area-based socioeconomic status and 12-month DSM-IV mental disorders. J. Psychiatr. Res. 2019, 119, 48–59. [Google Scholar] [CrossRef]
- Braveman, P.A.; Cubbin, C.; Egerter, S.; Williams, D.R.; Pamuk, E. Socioeconomic disparities in health in the United States: What the patterns tell us. Am. J. Public Health 2010, 100, 186–196. [Google Scholar] [CrossRef]
- Williams, D.R.; Priest, N.; Anderson, N.B. Understanding associations among race, socioeconomic status, and health: Patterns and prospects. Health Psychol. 2016, 35, 407. [Google Scholar] [CrossRef]
- Kaufman, J.S.; Cooper, R.S.; McGee, D.L. Socioeconomic status and health in blacks and whites: The problem of residual confounding and the resiliency of race. Epidemiology 1997, 8, 621–628. [Google Scholar] [CrossRef]
- Assari, S. Distal, intermediate, and proximal mediators of racial disparities in renal disease mortality in the united states. J. Nephropathol. 2016, 5, 51–59. [Google Scholar] [CrossRef]
- Assari, S. Socioeconomic status and self-rated oral health; diminished return among hispanic whites. Dent. J. 2018, 6, 11. [Google Scholar] [CrossRef] [PubMed] [Green Version]
- Assari, S. Health disparities due to diminished return among black Americans: Public policy solutions. Soc. Issues Policy Rev. 2018, 12, 112–145. [Google Scholar] [CrossRef]
- Assari, S. Unequal gain of equal resources across racial groups. Int. J. Health Policy Manag. 2017, 7, 1–9. [Google Scholar] [CrossRef] [PubMed] [Green Version]
- Assari, S. Understanding america: Unequal economic returns of years of schooling in whites and blacks. World J. Educ. Res. 2020, 7, 78–92. [Google Scholar] [CrossRef]
- Assari, S.; Farokhnia, M.; Mistry, R. Education attainment and alcohol binge drinking: Diminished returns of hispanics in los angeles. Behav. Sci. 2019, 9, 9. [Google Scholar] [CrossRef] [Green Version]
- Assari, S.; Boyce, S.; Bazargan, M.; Caldwell, C.H. Mathematical performance of American youth: Diminished returns of educational attainment of asian-american parents. Educ. Sci. 2020, 10, 32. [Google Scholar] [CrossRef] [Green Version]
- Assari, S.; Bazargan, M. Protective effects of educational attainment against cigarette smoking; diminished returns of american indians and alaska natives in the national health interview survey. Int. J. Travel Med. Glob. Health 2019, 7, 105. [Google Scholar] [CrossRef]
- Assari, S.; Boyce, S.; Bazargan, M.; Caldwell, C.H.; Zimmerman, M.A. Place-based diminished returns of parental educational attainment on school performance of non-hispanic white youth. Front. Educ. 2020, 5. [Google Scholar] [CrossRef]
- Assari, S.; Caldwell, C.H.; Zimmerman, M.A. Family structure and subsequent anxiety symptoms; minorities’ diminished return. Brain Sci. 2018, 8, 97. [Google Scholar] [CrossRef] [Green Version]
- Assari, S.; Caldwell, C.H. High risk of depression in high-income African American boys. J. Racial Ethn. Health Disparities 2018, 5, 808–819. [Google Scholar] [CrossRef]
- Assari, S.; Boyce, S.; Bazargan, M.; Caldwell, C.H. African Americans’ diminished returns of parental education on adolescents’ depression and suicide in the adolescent brain cognitive development (abcd) study. Eur. J. Investig. Health Psychol. Educ. 2020, 10, 48. [Google Scholar] [CrossRef] [PubMed]
- Assari, S.; Caldwell, C.H.; Bazargan, M. Association between parental educational attainment and youth outcomes and role of race/ethnicity. JAMA Netw. Open 2019, 2, e1916018. [Google Scholar] [CrossRef] [PubMed] [Green Version]
- Assari, S.; Caldwell, C.H.; Mincy, R. Family socioeconomic status at birth and youth impulsivity at age 15; blacks’ diminished return. Children 2018, 5, 58. [Google Scholar] [CrossRef] [PubMed] [Green Version]
- Assari, S.; Thomas, A.; Caldwell, C.H.; Mincy, R.B. Blacks’ diminished health return of family structure and socioeconomic status; 15 years of follow-up of a national urban sample of youth. J. Urban. Health 2018, 95, 21–35. [Google Scholar] [CrossRef] [PubMed]
- Assari, S.; Bazargan, M. Being married increases life expectancy of white but not black americans. J. Fam. Reprod Health 2019, 13, 132–140. [Google Scholar] [CrossRef]
- Assari, S.; Caldwell, C.H. Family income at birth and risk of attention deficit hyperactivity disorder at age 15: Racial differences. Children 2019, 6, 10. [Google Scholar] [CrossRef] [Green Version]
- Assari, S.; Boyce, S.; Bazargan, M.; Caldwell, C.H.; Mincy, R. Maternal education at birth and youth breakfast consumption at age 15: Blacks’ diminished returns. J Multidiscip. Sci. J. 2020, 3, 24. [Google Scholar] [CrossRef]
- Assari, S. Educational attainment and exercise frequency in american women; blacks’ diminished returns. Women’s Health Bull. 2019, 6, e87413. [Google Scholar] [CrossRef]
- Assari, S.; Nikahd, A.; Malekahmadi, M.R.; Lankarani, M.M.; Zamanian, H. Race by gender group differences in the protective effects of socioeconomic factors against sustained health problems across five domains. J. Racial Ethn Health Disparities 2016. [Google Scholar] [CrossRef]
- Assari, S.; Boyce, S.; Bazargan, M.; Mincy, R.; Caldwell, C.H. Unequal protective effects of parental educational attainment on the body mass index of black and white youth. Int. J. Environ. Res. Public Health 2019, 16, 3641. [Google Scholar] [CrossRef] [Green Version]
- NIH’s Adolescent Brain Cognitive Development (ABCD) Study. In Alcohol Research: Current Reviews Editorial Staff; 2018; 39, p. 97. Available online: https://www.arcr.niaaa.nih.gov/arcr391/article11.htm (accessed on 20 November 2020).
- Casey, B.J.; Cannonier, T.; Conley, M.I.; Cohen, A.O.; Barch, D.M.; Heitzeg, M.M.; Soules, M.E.; Teslovich, T.; Dellarco, D.V.; Garavan, H.; et al. The adolescent brain cognitive development (abcd) study: Imaging acquisition across 21 sites. Dev. Cogn. Neurosci. 2018, 32, 43–54. [Google Scholar] [CrossRef] [PubMed]
- Karcher, N.R.; O’Brien, K.J.; Kandala, S.; Barch, D.M. Resting-state functional connectivity and psychotic-like experiences in childhood: R: Aesults from the adolescent brain cognitive development study. Biol. Psychiatry 2019, 86, 7–15. [Google Scholar] [CrossRef]
- Lisdahl, K.M.; Sher, K.J.; Conway, K.P.; Gonzalez, R.; Feldstein Ewing, S.W.; Nixon, S.J.; Tapert, S.; Bartsch, H.; Goldstein, R.Z.; Heitzeg, M. Adolescent brain cognitive development (ABCD) study: Overview of substance use assessment methods. Dev. Cogn. Neurosci. 2018, 32, 80–96. [Google Scholar] [CrossRef] [PubMed]
- Luciana, M.; Bjork, J.M.; Nagel, B.J.; Barch, D.M.; Gonzalez, R.; Nixon, S.J.; Banich, M.T. Adolescent neurocognitive development and impacts of substance use: Overview of the adolescent brain cognitive development (ABCD) baseline neurocognition battery. Dev. Cogn. Neurosci. 2018, 32, 67–79. [Google Scholar] [CrossRef] [PubMed]
- Auchter, A.M.; Hernandez Mejia, M.; Heyser, C.J.; Shilling, P.D.; Jernigan, T.L.; Brown, S.A.; Tapert, S.F.; Dowling, G.J. A description of the ABCD organizational structure and communication framework. Dev. Cogn. Neurosci. 2018, 32, 8–15. [Google Scholar] [CrossRef] [PubMed]
- Garavan, H.; Bartsch, H.; Conway, K.; Decastro, A.; Goldstein, R.Z.; Heeringa, S.; Jernigan, T.; Potter, A.; Thompson, W.; Zahs, D. Recruiting the ABCD sample: Design considerations and procedures. Dev. Cogn. Neurosci. 2018, 32, 16–22. [Google Scholar] [CrossRef]
- Huang, Y.-J.; Wong, S.H.; Salmon, J.; Hui, S.S. Reliability and validity of psychosocial and environmental correlates measures of physical activity and screen-based behaviors among Chinese children in Hong Kong. Int. J. Behav. Nutr. Phys. Act. 2011, 8, 16. [Google Scholar] [CrossRef] [Green Version]
- Cohen, J. Statistical Power Analysis for the Behavioral Sciences; Academic Press: Cambridge, MA, USA, 2013. [Google Scholar]
- Cohen, J.; Cohen, P.; West, S.G.; Aiken, L.S. Applied Multiple Regression/Correlation Analysis for the Behavioral Sciences; Routledge: Abingdon, UK, 2013. [Google Scholar]
- Assari, S.; Boyce, S.; Akhlaghipour, G.; Bazargan, M.; Caldwell, C.H. Reward responsiveness in the adolescent brain cognitive development (abcd) study: African Americans’ diminished returns of parental education. Brain Sci. 2020, 10, 391. [Google Scholar] [CrossRef]
- Assari, S. Parental education on youth inhibitory control in the adolescent brain cognitive development (abcd) study: Blacks’ diminished returns. Brain Sci. 2020, 10, 312. [Google Scholar] [CrossRef]
- Assari, S.; Boyce, S.; Bazargan, M. Subjective family socioeconomic status and adolescents’ attention: Blacks’ diminished returns. Children 2020, 7, 80. [Google Scholar] [CrossRef]
- Assari, S. Education attainment and obesitydifferential returns based on sexual orientation. Behav. Sci. 2019, 9, 16. [Google Scholar] [CrossRef] [Green Version]
- Assari, S. Blacks’ diminished return of education attainment on subjective health; mediating effect of income. Brain Sci. 2018, 8, 176. [Google Scholar] [CrossRef] [PubMed] [Green Version]
- Assari, S. Family income reduces risk of obesity for white but not black children. Children 2018, 5, 73. [Google Scholar] [CrossRef] [PubMed] [Green Version]
- Shervin, A.; Ritesh, M. Diminished return of employment on ever smoking among hispanic whites in los angeles. Health Equity 2019, 3, 138–144. [Google Scholar] [CrossRef] [Green Version]
- Assari, S. Socioeconomic determinants of systolic blood pressure; minorities’ diminished returns. J. Health Econ. Dev. 2019, 1, 1–11. [Google Scholar] [PubMed]
- Assari, S.; Caldwell, C.H.; Mincy, R.B. Maternal educational attainment at birth promotes future self-rated health of white but not black youth: A 15-year cohort of a national sample. J. Clin. Med. 2018, 7, 93. [Google Scholar] [CrossRef] [PubMed] [Green Version]
- Assari, S.; Lankarani, M.M. Education and alcohol consumption among older americans; black-white differences. Front. Public Health 2016, 4, 67. [Google Scholar] [CrossRef] [Green Version]
- Assari, S.; Bazargan, M. Unequal associations between educational attainment and occupational stress across racial and ethnic groups. Int. J. Environ. Res. Public Health 2019, 16, 3539. [Google Scholar] [CrossRef] [Green Version]
- Assari, S. Race, intergenerational social mobility and stressful life events. Behav. Sci. 2018, 8, 86. [Google Scholar] [CrossRef] [Green Version]
- Assari, S. Family socioeconomic status and exposure to childhood trauma: Racial differences. Children 2020, 7, 57. [Google Scholar] [CrossRef] [PubMed]
- Assari, S.; Preiser, B.; Kelly, M. Education and income predict future emotional well-being of whites but not blacks: A ten-year cohort. Brain Sci. 2018, 8, 122. [Google Scholar] [CrossRef] [PubMed] [Green Version]
- Akin, J.S.; Garfinkel, I. Economic Returns to Education Quality: An Empirical Analysis for Whites, Blacks, Poor Whites, and Poor Blacks; Institute for Research on Poverty Discussion: Madison, WI, USA, 1974; pp. 224–274. Available online: https://eric.ed.gov/?id=ED097412 (accessed on 19 November 2020).
- Bartik, T.J.; Hershbein, B. Degrees Of Poverty: The Relationship between Family Income Background and the Returns to Education; 2018. Available online: https://papers.ssrn.com/sol3/papers.cfm?abstract_id=3141213 (accessed on 19 November 2020).
- Bowden, M.; Bartkowski, J.; Xu, X.; Lewis, R., Jr. Parental occupation and the gender math gap: Examining the social reproduction of academic advantage among elementary and middle school students. Social Sci. 2017, 7, 6. [Google Scholar] [CrossRef] [Green Version]
- Chetty, R.; Hendren, N.; Kline, P.; Saez, E. Where is the land of opportunity? The geography of intergenerational mobility in the United States. Q. J. Econ. 2014, 129, 1553–1623. [Google Scholar] [CrossRef] [Green Version]
- Assari, S.; Gibbons, F.X.; Simons, R. Depression among black youth; interaction of class and place. Brain Sci. 2018, 8, 108. [Google Scholar] [CrossRef] [Green Version]
- Assari, S.; Lankarani, M.M.; Caldwell, C.H. Does discrimination explain high risk of depression among high-income African American men? Behav. Sci. 2018, 8, 40. [Google Scholar] [CrossRef] [Green Version]
- Assari, S.; Preiser, B.; Lankarani, M.M.; Caldwell, C.H. Subjective socioeconomic status moderates the association between discrimination and depression in African American youth. Brain Sci. 2018, 8, 71. [Google Scholar] [CrossRef] [Green Version]
- Assari, S.; Lapeyrouse, L.M.; Neighbors, H.W. Income and self-rated mental health: Diminished returns for high income black Americans. Behav. Sci. 2018, 8, 50. Available online: https://doi.org/10.3390/bs8050050 (accessed on 19 November 2020). [CrossRef] [Green Version]
- Hudson, D.L.; Bullard, K.M.; Neighbors, H.W.; Geronimus, A.T.; Yang, J.; Jackson, J.S. Are benefits conferred with greater socioeconomic position undermined by racial discrimination among African American men? J. Mens. Health 2012, 9, 127–136. [Google Scholar] [CrossRef] [Green Version]
- Hudson, D.L.; Neighbors, H.W.; Geronimus, A.T.; Jackson, J.S. The relationship between socioeconomic position and depression among a US nationally representative sample of African Americans. Soc. Psychiatry Psychiatr. Epidemiol. 2012, 47, 373–381. [Google Scholar] [CrossRef] [Green Version]
- Hudson, D.; Sacks, T.; Irani, K.; Asher, A. The price of the ticket: Health costs of upward mobility among African Americans. Int. J. Environ. Res. Public Health 2020, 17, 1179. [Google Scholar] [CrossRef] [PubMed] [Green Version]
- Assari, S.; Akhlaghipour, G.; Boyce, S.; Bazargan, M.; Caldwell, C.H. African American children’s diminished returns of subjective family socioeconomic status on fun seeking. Children 2020, 7, 75. [Google Scholar] [CrossRef] [PubMed]
- Assari, S.; Boyce, S.; Caldwell, C.H.; Bazargan, M. Minorities’ diminished returns of parental educational attainment on adolescents’ social, emotional, and behavioral problems. Children 2020, 7, 49. [Google Scholar] [CrossRef] [PubMed]
- Assari, S.; Boyce, S.; Bazargan, M. Subjective socioeconomic status and children’s amygdala volume: Minorities’ diminish returns. NeuroSci 2020, 1, 6. [Google Scholar] [CrossRef] [PubMed]
- Bell, C.N.; Sacks, T.K.; Thomas Tobin, C.S.; Thorpe, R.J., Jr. Racial non-equivalence of socioeconomic status and self-rated health among African Americans and whites. SSM Popul. Health 2020, 10, 100561. [Google Scholar] [CrossRef]
- Farmer, M.M.; Ferraro, K.F. Are racial disparities in health conditional on socioeconomic status? Soc. Sci. Med. 2005, 60, 191–204. [Google Scholar] [CrossRef]
- Sherman-Wilkins, K.J.; Thierry, A.D. Education as the great equalizer? racial and ethnic differences in the effect of education on cognitive impairment in later life. Geriatrics 2019, 4, 51. [Google Scholar] [CrossRef] [Green Version]
- Colen, C.G.; Ramey, D.M.; Cooksey, E.C.; Williams, D.R. Racial disparities in health among nonpoor African Americans and hispanics: The role of acute and chronic discrimination. Soc. Sci. Med. 2018, 199, 167–180. [Google Scholar] [CrossRef]
Figure 1.
The association between family income and children’s screen time overall.

Figure 2.
The association between family income and children’s screen time by race.


Table 1.
The model formulas.
| Model 1 |
| screentime_ss_weekday ~ household.income.bl + race.4level + sex + married.bl + age + hisp |
| Random: ~(1|abcd_site) + (1|rel_family_id) + (1|src_subject_id) |
| Model 2 |
| screentime_ss_weekday ~ household.income.bl + race.4level + sex + married.bl + age + hisp + household.income.bl x race.4level |
| Random: ~(1|abcd_site) + (1|rel_family_id) + (1|src_subject_id) |
Table 2.
Descriptive characteristics by race (n = 15,022).
| Level | All | White | Black | Asian | Other or Mixed | p | |
|---|---|---|---|---|---|---|---|
| n | 15,022 | 10,249 | 1961 | 339 | 2473 | ||
| n(%) | n(%) | n(%) | n(%) | n(%) | |||
| Household income | <50 K | 4121 (27.4) | 1851 (18.1) | 1247 (63.6) | 47 (13.9) | 976 (39.5) | <0.001 |
| ≥50 K and <100 K | 4376 (29.1) | 3153 (30.8) | 463 (23.6) | 79 (23.3) | 681 (27.5) | ||
| ≥100 K | 6525 (43.4) | 5245 (51.2) | 251 (12.8) | 213 (62.8) | 816 (33.0) | ||
| Sex | Female | 7200 (47.9) | 4825 (47.1) | 979 (49.9) | 173 (51.0) | 1223 (49.5) | 0.021 |
| Male | 7822 (52.1) | 5424 (52.9) | 982 (50.1) | 166 (49.0) | 1250 (50.5) | ||
| Married Family | No | 4420 (29.4) | 2105 (20.5) | 1334 (68.0) | 48 (14.2) | 933 (37.7) | <0.001 |
| Yes | 10,602 (70.6) | 8144 (79.5) | 627 (32.0) | 291 (85.8) | 1540 (62.3) | ||
| Hispanic | No | 12,241 (81.5) | 8562 (83.5) | 1865 (95.1) | 311 (91.7) | 1503 (60.8) | <0.001 |
| Yes | 2781 (18.5) | 1687 (16.5) | 96 (4.9) | 28 (8.3) | 970 (39.2) | ||
| Mean (SD) | Mean (SD) | Mean (SD) | Mean (SD) | Mean (SD) | |||
| Age (Months) | 122.85 (9.58) | 123.20 (9.68) | 121.67 (8.92) | 123.56 (9.93) | 122.25 (9.53) | <0.001 | |
| Screen Time Weekday Mean (Hours) | 3.55 (3.14) | 3.17 (2.77) | 5.56 (3.99) | 2.23 (2.18) | 3.72 (3.26) | <0.001 |
Table 3.
Mixed-effects regressions overall (n = 15,022).
| b | SE | p | b | SE | p | |
|---|---|---|---|---|---|---|
| Model 1 | Model 2 | |||||
| Income (≥50 K and <100 K) | −0.60 *** | 0.08 | <0.001 | −0.80 *** | 0.10 | <0.001 |
| Income (>100 K) | −1.20 *** | 0.08 | <0.001 | −1.35 *** | 0.10 | <0.001 |
| Race (Black) | 1.32 *** | 0.09 | <0.001 | 1.01 *** | 0.13 | <0.001 |
| Race (Asian) | −0.52 ** | 0.19 | 0.005 | −0.59 | 0.47 | 0.212 |
| Race (Mixed or Other) | 0.18 * | 0.08 | 0.019 | 0.02 | 0.13 | 0.852 |
| Income (≥50 K and <100 K) × Race (Black) | - | - | - | 0.59 ** | 0.21 | 0.004 |
| Income (>100 K) × Race (Black) | - | - | - | 0.74 ** | 0.25 | 0.003 |
| Income (≥50 K and <100 K) × Race (Asian) | - | - | - | 0.12 | 0.60 | 0.835 |
| Income (>100 K) × Race (Asian) | - | - | - | 0.06 | 0.52 | 0.910 |
| Income (≥50 K and <100 K) × Race (Other or Mixed) | - | - | - | 0.39 * | 0.19 | 0.041 |
| Income (>100 K) × Race (Other or Mixed) | - | - | - | 0.08 | 0.18 | 0.654 |
K = 1000. * p < 0.05. ** p < 0.01. *** p < 0.001.
Publisher’s Note: MDPI stays neutral with regard to jurisdictional claims in published maps and institutional affiliations. |
© 2020 by the author. Licensee MDPI, Basel, Switzerland. This article is an open access article distributed under the terms and conditions of the Creative Commons Attribution (CC BY) license (http://creativecommons.org/licenses/by/4.0/).
Share and Cite
MDPI and ACS Style
Assari, S. American Children’s Screen Time: Diminished Returns of Household Income in Black Families. Information 2020, 11, 538. https://doi.org/10.3390/info11110538
AMA Style
Assari S. American Children’s Screen Time: Diminished Returns of Household Income in Black Families. Information. 2020; 11(11):538. https://doi.org/10.3390/info11110538
Chicago/Turabian StyleAssari, Shervin. 2020. "American Children’s Screen Time: Diminished Returns of Household Income in Black Families" Information 11, no. 11: 538. https://doi.org/10.3390/info11110538
Note that from the first issue of 2016, this journal uses article numbers instead of page numbers. See further details here.