1. Introduction
Over the last decade, the number of alerts issued for Industrial Control Systems by the United States Department of Homeland Security (DHS) [
1] has been steadily increasing. This increase is especially significant and relevant for companies that provide products and services for critical infrastructures. According to an estimation by the DHS, about 90% of the reported security incidents result from exploits against defects in the design or code of software [
2]. Adding to this, a recent large-scale study by Patel et al. [
3] showed that more than 50% of software developers cannot spot vulnerabilities in source code [
4]. The combination of these facts is a serious problem.
IT security standards such as ISO 27k [
5], IEC 62443 [
6], PCI/DSS [
7], and the German BSI Grundschutz Kompendium [
8] mandate the implementation of secure software development practices in the software development life-cycle. Compliance with these standards is often the aim of audits, especially in the critical infrastructure industry. To address customers’ concerns and prove commitment to cybersecurity, the Charter of Trust (CoT) initiative was created to establish industry-wide principles in software and product development. The signing parties to the CoT commit to fulfilling these established principles. One of the CoT principles is the commitment to cybersecurity awareness and education of industrial software developers. In addition to the CoT, several companies together have formed the SAFECode [
9] alliance, which specializes in promoting secure coding best practices in the industry. This initiative is a rich source of information on the topic of industrial secure coding best practices.
One possible method to address secure coding and software quality issues and reduce the number of software vulnerabilities is through Static Application Security Testing tools (SAST). Several vendors have presented their proposed solutions to reduce software vulnerabilities. However, these have actually been shown not to perform well in detecting security vulnerabilities in source code [
10]. One factor that makes the usage of such automated tools complicated is the excessive amount of false positives and false negatives [
11,
12] that these tools produce. The additional work, which must inevitably be done by a human, can be considerably high to understand SAST tools’ reports and filter the false positives from the true positives. Furthermore, the presence of false negatives is a clear indicator that these tools are not perfect and that additional measures are required to ensure a good quality software [
13].
In our work, we concentrate on awareness training of software developers, i.e., on the human factor. The motivation to focus on the software developer is that he or she is ultimately responsible for writing the software and interpreting the output of SAST tools. Based on the first author’s industrial experience, we conclude that one possible way to improve software quality starts with raising awareness of software developers’ secure coding through education. Kapp [
14] provided a meta-analysis of game-based learning and concluded that using games as an educational method is an effective way of learning.
1.1. Cybersecurity Awareness through Cybersecurity Challenges
Capture-The-Flag (CTF) events are games that were introduced in the pentesting community as a means to exercise and improve system penetration skills and to simulate cybersecurity breach scenarios [
15]. The participants in this kind of event are typically pentesters, cybersecurity experts, hobbyists, and academic students. For an overview of existing CTF games, see Kucek et al. [
16]. CTF games pose complicated security puzzles to the participants, and often, these games take days [
17]. It is not unusual that only a few of the participants manage to solve all the challenges, which have no fixed solution or no a priori solution (i.e., might even be impossible). This inability to solve challenges often leads to high frustration levels and eventually to players giving up on the CTF event itself. The reason for this is that challenges in CTF events generally have no clear solution, can go beyond typical (realistic) IT security topics, and are not coached events—i.e., each participant is left alone to learn IT security by himself or herself. In practice, the participants in CTF games increase their knowledge on attacking and defending IT systems by working together in groups, by searching for information on the Internet, or by asking friends.
CyberSecurity Challenges (CSCs) are serious games that refine the popular CTF format and adapt it to the industry. CSCs were introduced in [
18] by Gasiba et al. to raise the secure coding awareness of software developers in the industry. Similar to CTF, a CSC event consists of a collection of challenges. However, these challenges are designed to consider secure coding guidelines and coverage of business-relevant topics. The challenges also contain at least one pre-defined solution. Furthermore, the CSC event is coached. This means that one or more persons supervise the event and help participants in solving the exercises. The goal of the coaches is twofold: to ensure that participants do not get stuck when solving exercises and to lower the frustration of the participants while increasing the overall happiness and learning effect. By solving CSCs, the participants focus on secure coding issues and enter a flow [
19] state, which is characterized by increased concentration, attention, involvement, and enjoyment. Previous studies [
20,
21] indicated that these events result in the increased awareness [
22] of the participants (industrial software developers) on the topic of secure coding. Furthermore, the CSC coaches ensure that participants are not frustrated during the event and help the participants remain in the flow state.
In contrast to CTF, an essential requirement for designing CSC games in an industrial context is to correctly plan the duration of a CSC event. This requirement exists because the time a software developer spends playing an awareness game is counted as unproductive hours and, if not planned properly, can introduce severe delays in ongoing projects [
18]. Furthermore, not only can one software developer participate in such events, but also a whole team of software developers (e.g., up to 30 participants per event); this makes it even more urgent to perform a proper planning of the duration of the CSC event. Another critical factor to consider in the design of these games is the desired learning effect. This goal can be achieved by carefully planning the amount of exercises allocated for each different topic [
23]. To achieve both these requirements, the whole event’s duration needs to be planned carefully before the event. To do this, the duration of each challenge individually and its timing characteristics need to be known or estimated a priori to plan the event.
Good measurements of the time that players require to solve a given challenge must be based on data acquired from past events, i.e., from real-world data. Several methods can be used to measure this time, including simply looking at the clock and registering the data on paper. The precision of the measurement depends heavily on the technique used to measure. Note that different players with different backgrounds will solve the challenges in different amounts of time. In the present work, however, all the participants in the event have an industry background, and the challenges are related to their work environment. Therefore, the variance of the measurement is expected to not be as critical as if the background of the participants were much more diverse. In this work, we use a method to measure the challenge solve time based on collected timestamps, which are generated by standard tools (e.g., AJAX scripts). This is possible because the players in the CSC game always need to interact with a server component. Using the recorded data from previous events helps CSC designers estimate the challenge solve time and to further improve, refine, and inform future CSVevents. Based on this scenario, this work intends to address the following research questions:
- RQ1:
How doe we measure the time it takes to solve a cybersecurity challenge?
- RQ2:
What are the limitations of to measuring the time it takes to solve a cybersecurity challenge?
- RQ3:
Which factors can be used to inform CSC coaches during gameplay?
While we address the first two research questions quantitatively, the latter research question is addressed qualitatively, based on the experience gathered in the field. The present work introduces two methods to measure the challenge solve time and provides a first analysis of the data from cybersecurity challenges to aid CSC game designers in planning CSC events. The objective is to understand the interaction in cybersecurity challenges, identify implications for the game design, and optimize the gaming experience of participants. Furthermore, the present work aims at improving scientific knowledge on methods and limitations that can be used to measure the challenge solve time for CSC games. This study bases its conclusions on the data collected from 12 CSC events, with a total of 190 participants from the industry, which took place between 2017 and 2020. Furthermore, we identify player profiles based on player interactions with the infrastructure, which enable CSC coaches to direct their help towards individual players or teams while lowering their frustration, maintaining the flow state, and increasing overall happiness.
The rest of the paper is structured as follows. The next sub-section introduces the related work.
Section 1.3 gives an overview of cybersecurity challenges in the industrial context.
Section 1.4 introduces the two main proposals to measure the challenge solve time to address RQ1 and also briefly presents the data collection and research method. In
Section 3, the results of the analysis of the collected data are presented. This section gives practitioners practical indications of challenge solve times and CSV event planning. Furthermore, this section addresses RQ2 and RQ3 by comparing the obtained results through the two different computation methods, and several factors are identified that aid CSC coaches in their activities during a CSC event. The last section concludes with an outlook on the work presented and briefly discusses future work.
1.2. Related Work
Awareness training on information security was addressed in McIlwraith [
24], who looked at employee behavior and provided a systematic methodology and a baseline for implementing awareness training. In their work, Stewart et al. [
25] argued that communicators, e.g., trainers, must understand the audiences’ constraints and supporting beliefs in order to provide an effective awareness program. A serious game was defined as “a game designed with a primary goal other than pure entertainment”, by Dörner et al. [
26,
27]. Kapp [
14] defined serious games as an experience designed using game mechanics and game thinking to educate individuals in a specific content domain. Furthermore, he defined gamification as a careful and considered application of game thinking to solving problems and encouraging learning using all the elements of games that are appropriate. Cybersecurity challenges are serious games, according to the definition by Dörner et al. [
18,
20,
28]. Using games as a means to raise IT security awareness has recently gained much attention in the research community to raise information security awareness [
18,
29,
30]. The design of serious games’ design, in a general form, along with the discussion on several aspects can be found in Alexis et al. [
31]. In [
32], Pesantez et al. performed a systematic literature review to understand serious game design methodologies, frameworks, and models. Lameras et al. [
33] summarized in their study how design features can be planned, developed, and implemented. Their work focused on the learning outcomes, teacher roles, pedagogic value, and game attributes.
Capture-The-Flag (CTF) is a serious game genre in the domain of cybersecurity. Such serious games’ common goals include skill improvement and training purposes, identifying the “best students”, and assessing new employee skills, e.g., potential pentesters. In a CTF, a series of challenges needs to be solved by single players or teams of players. Various authors have identified that CTF games are fun activities with a high potential educational value [
15,
34]. Game activities are known to lead to increased experience in concentration, interest, and enjoyment resulting from increased levels of affective, behavioral, and cognitive involvement with the task at hand [
19,
35,
36,
37].
In [
38], Mirkovic and Peterson investigated an adapted CTF method that they proposed to enhance students’ cybersecurity education. While their work included both attack and defend exercises, they focused on fostering adversarial thinking. After the CTF takes place, the tutor explains possible solutions to the exercises. Additionally, an in-class post-mortem analysis of the event helps students identify their mistakes and further improve their skills.
While many of these publications mostly take for granted the suitability of CTF games as a tool to enhance cybersecurity awareness, this has been put into question [
39,
40,
41,
42]. In [
43], Chung and Cohen evaluated several possible obstacles to effective learning through CTF. The major conclusions that they arrived at were that the challenges need to be adapted to the participants; the difficulty level should be adequate for the participants; and that the challenges should undergo a well-defined design process. These conclusions further emphasize the need to properly determine the time it takes for challenges to be solved, in order to plan the whole event. The duration of similar training events ranges from several days [
38] (less common) to a single day [
44] (more common). The first CTF is done in academia, while the latter is done by a commercial provider. Events that last several weeks have a severe financial impact and possible delay ongoing projects [
18] and therefore typically do not find high levels of approval by management. Therefore, such a long duration is not adequate for the industry.
In [
45], Rademacher gave some hints about the differences between academia and industry. Although their work did not focus on secure coding, we believe that their conclusions also extend to this area. The consequences of their work corroborate the need to address industry-specific requirements in the design of cybersecurity challenges. Gasiba et al. [
18] discussed the requirements needed to address software developers in the industry as the primary target group. One requirement pertains to the design and planning of the challenges themselves, especially in terms of the time it takes to solve them individually (challenge solve time). The rationale is that the challenges presented to the participants should be solved in the amount of time that the event is designed to last, and the design should consider the desired and designed learning effect.
The evaluation of participant performance in a serious game is a vital part of assessing the game itself [
46]. It is critical to understand how to refine and improve the game and know how effective a particular game is to raise secure coding awareness among its participants. Mäses et al. [
47] proposed additional metrics to measure and track participants’ progress. In their work, they mostly looked at weighted scoring and the time required to solve challenges. These metrics can be used by game designers to increase the effectiveness and efficiency of the learning experience. Recent work by Andreolini [
48] proposed a scoring algorithm based on modeling of trainee activities during cyber range games. A comparison of both trainee scores and the desired activities path was the basis for the scoring algorithm. Path activities modeled as directed graphs were analyzed to identify player profiles.
Furthermore, in their work, Graziotin et al. [
49] argued that happy developers are better coders. They showed that developers that are happy at work tend to be more focused, adhering to software development processes and following software development best practices. This result leads to the conclusion that happy developers can produce higher quality [
13] and more secure code than unhappy developers. One important task for CSC coaches during gameplay is to ensure that the participants are happy.
In [
22], Hänsch et al. introduced the concept of IT security awareness. They concluded that there are three components to awareness: (1) perception, or knowing threats, (2) protection, or knowing existing mechanisms, and (3) behavior, or correctly acting according to the circumstance. Cybersecurity challenges aim to increase software developers’ awareness of these three dimensions as introduced by Hänsch et al. Both the CSC games and the CSC coaches address these three dimensions, ensuring that the participants at CSC events are exposed to and exercise these three awareness components.
The open-source CSC challenges are based on existing projects, which are left unmodified, and do not provide a mechanism that can be used to measure the challenge solve time. Since a decision was made not to modify these challenges, in order to reduce implementation and maintenance effort and costs, an alternative source of information was used. This alternative source was the logging data, which were stored in a SQLite [
50] database, as generated by the CTFd [
51]. As will be briefly introduced, later refinements of the CSC game used an in-house developed Sifu platform. Since this platform was developed by the authors, a mechanism using standard AJAX [
52] requests was implemented. The AJAX requests were stored in a log file in the back-end and served as the second source of information. Note that both methods use logging information. In [
53], Westera et al. also looked at log files to derive learning analytics for their serious game and concluded that log files contain a “hidden treasure” of information for further analysis.
CSC events are also coached events. The participants in the game are assisted during gameplay by one or more coaches, who act as supervisors of the event and serve as a guarantee that the frustration level of the participants is lowered and that the learning goals are achieved. Bird et al. [
54] provided a good framework that can be adopted by CSC coaches to reach these objectives.
1.3. Cybersecurity Challenges and the Sifu Platform
A cybersecurity challenge event [
18] is a one day serious game [
26] event in which 10 to 30 software developers from the industry participate. During the event, the participants form teams (a maximum of four players each) and compete against each other by solving secure coding challenges. Although teams consisting of singular participants are allowed in this game, we have observed that in practice, the participants have always created or joined an existing team. The game’s goal is to raise the awareness on secure coding, secure coding guidelines, and secure coding best practices of software developers working in the industry. For a thorough description and review of CSC events, we refer the reader to a forthcoming publication [
21].
The CSC game was designed, based on internal demand for training, for the following software developers’ backgrounds: web application, C/C++, and mixed. The choice of programming languages (C/C++) for the challenges was also driven by company internal demand for training. Note that these programming languages are widely used in the industry [
55]. Additionally, software implemented in C/C++ is considered the most vulnerable, according to a study by WhiteSource [
56]. Due to its generic nature, the web application challenges are not based on a particular technology, but follow the OWASP [
57] approach of generalizing the different existing web vulnerabilities. Both challenge types (web and C/C++) address many different cybersecurity topics, all of which are related to secure coding and focus on secure coding guidelines (company internal guidelines, OWASP [
57], SEI-CERT [
58], MISRA [
59], and AUTOSAR [
60]).
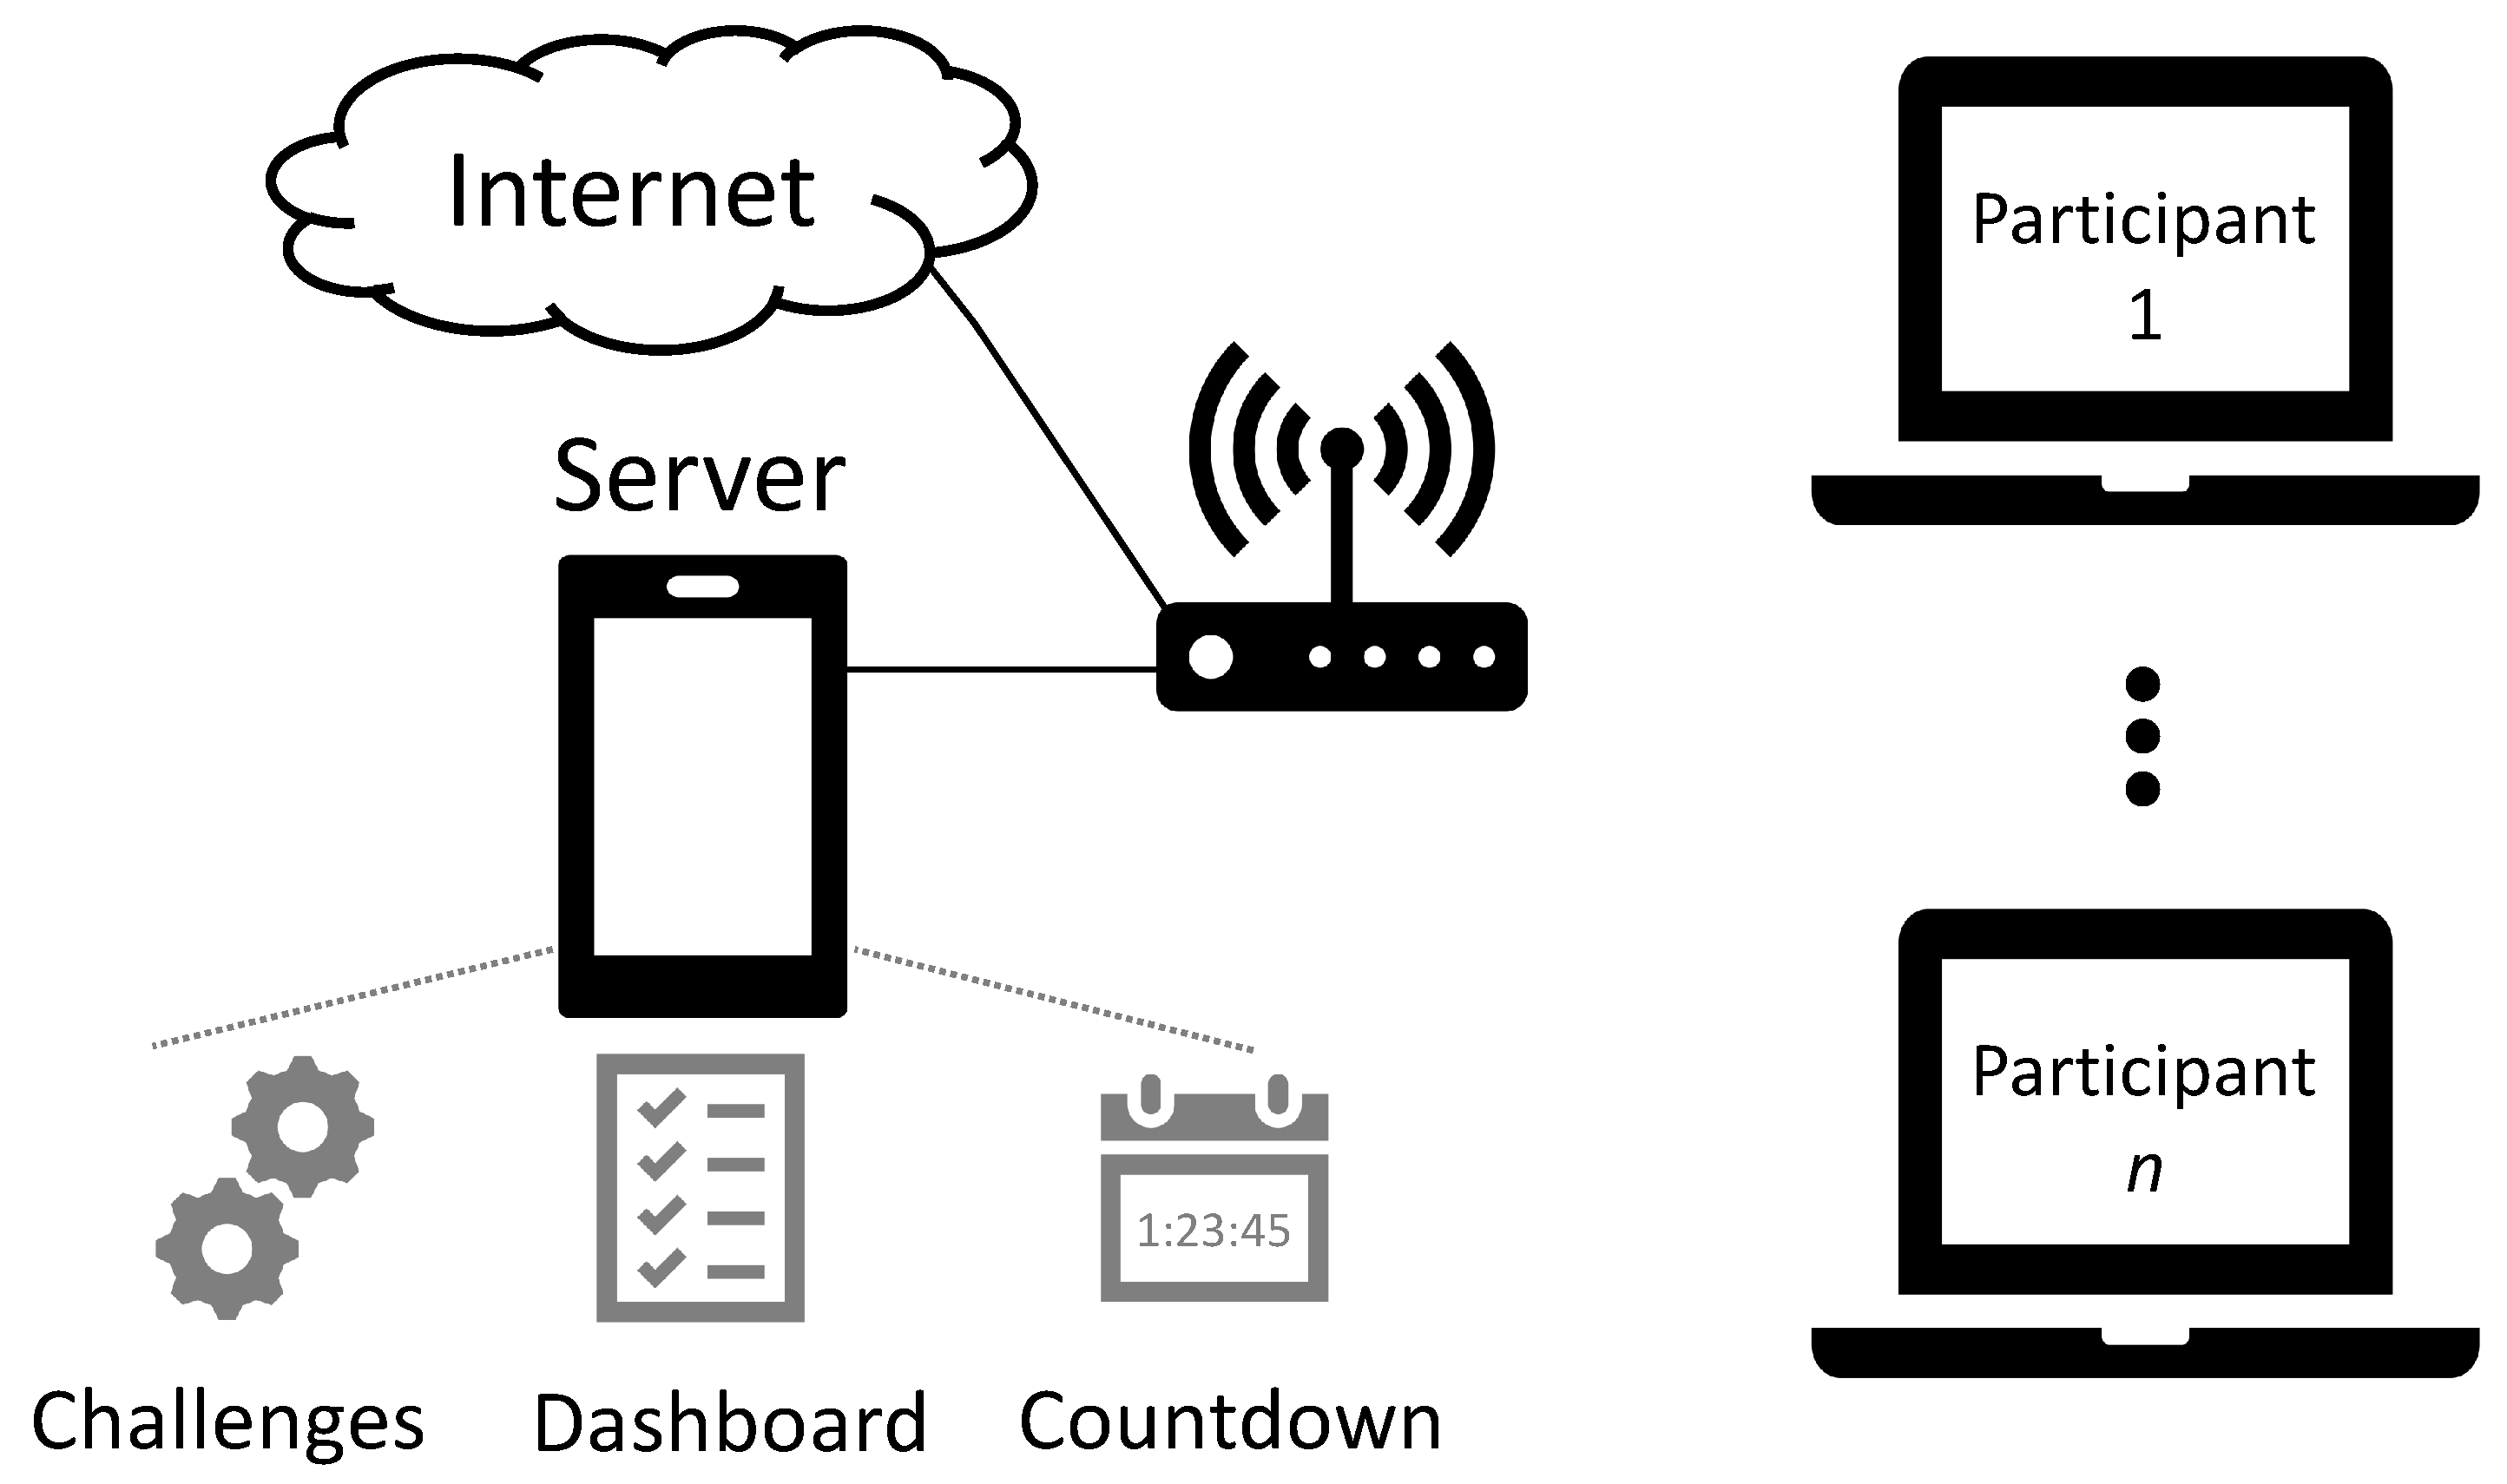
The main components of the CSC game are challenges, dashboard, and countdown. The challenges are the exercises that need to be solved by the individual teams. The dashboard is based on the CTFd [
51] and contains the list of the challenges to be solved by the participants, along with their categories and points. It is used by teams and players to choose challenges to work on, ask for hints, collect points, and track the game (in the form of a dashboard). A countdown timer is shown to the participants during the event. This countdown serves as an incentive for the participants to continue solving the challenges, and it also serves as a guide for coaches to steer their efforts in helping individual teams.
Figure 1 shows the overall architecture of a CSC game, along with its main components. Note that the elements present in this figure are general and not unique to CSC games. While this architecture is not unique to serious games, its usage is in the context of a serious game. The development of the CSC architecture and platform was done to facilitate integration into internal in-house components and to follow internal training methodologies.
The CSC event starts with a one hour welcome to the participants, a briefing on how to play the game, team formation, and live examples on how to solve one challenge in each category. The main event lasts for six hours, including a lunch break. During this time, the individual players in each team collaborate together in solving the challenges. Two coaches (IT security experts) monitor the game while being played and assist with players’ and teams’ individual problems. The coaches’ important task is to ensure that participants do not lose interest in the game and are kept motivated throughout the day—i.e., that the players achieve a flow [
19] state. At the end of the main event, the winning team is announced, the participants are asked to fill out a small survey about the game (the participation of which is not mandatory), and finally, the coaches, in an open discussion with all the players, show the solutions of some challenges live. This last part of the CSC event (from team announcement until challenge solution) lasts one hour.
Each CSC challenge is developed to target one secure software weakness, which corresponds to one or more secure coding guidelines. The challenge consists of three phases [
61]: Phase 1—introduction, Phase 2—challenge, and Phase 3—conclusion. In Phase 1, an optional phase, the challenge, environment, and scenario are introduced. Furthermore, references to the secure coding guideline(s) which the challenge is about are discussed. In Phase 2, the player is presented with the challenge itself, described in Phase 1. In Phase 3, the player is given a debriefing on the challenge; this includes background information on previous real-world exploits and a short discussion of the possible consequences of exploiting the vulnerability.
Upon solving one challenge, a flag is awarded—i.e., a random-like code is given to the participants. This code can be submitted to the dashboard and be redeemed for points. During the workshop, the players accumulate points by solving challenges. At the end of the event, the team with the most points wins the CSC game. Further challenges can be unlocked upon solving a given challenge. The unlocked challenges can consist of follow-up questions (e.g., to test the understanding of the information given in Phase 3), or a more difficult challenge can be unlocked. Player interactions with the dashboard are kept in the dashboard’s internal database. Although the team with the most amount of points is declared the winner of the CSC event, the game intends that every participant profits from the game and that by concentrating on solving the challenges [
19], the awareness about secure coding, secure coding guidelines, and secure coding best practices is exercised.
2. Results
This section presents the results of the twelve CSC games played in an industrial setting. From 2017 to 2020, the authors collected data from 12 different CSC events (which took place online and in four different countries), whereby 190 software developers, pentesters, and test engineers with ages ranging from 25 to 60 and with an industrial background participated.
Table 2 summarizes the 12 game events in chronological order with the number of participants and the focus domain of the CSC event. Furthermore, it shows how data were collected: either using CTFd or CTFd together with the Sifu platform. The results were computed from the dashboard data contained in the SQLi database and from the Sifu platform logs. Data were pre-processed using Python scripts and then analyzed using R-Studio Version 1.2.5001 [
83].
Event 1 validated the core CSC design and tested the gaming infrastructure. The participants to this event were cybersecurity experts. The participants in Events 2 and 3 were professional software developers. Participants in Event 4 were software developers, but it also included pentesters and quality engineers. The participants’ distribution was as follows:
were non-software developers, and
were professional software developers. The comic challenges were used in Events 2 and 3 and were not part of any further CSC event (see [
62]). Except for Event 10, participants of the remaining events were exclusively professional software developers. Participants in Event 10 included 7 computer science students, 7 professional software developers, and 1 assistant professor.
During a CSC event, participants gave their consent on the data collection in anonymized form. The participants also consented to be used for scientific research purposes. Since all the collected data were anonymized, tracing back to each person was not possible. This restriction applies in an industrial setting, where personal data are not allowed to be collected.
The data collected, as shown in
Table 2, were comprised of dashboard data (for Events 1 through 9) and dashboard data and Sifu platform data (for Events 10 through 12). In the last three events, the Sifu platform was used in conjunction with the dashboard, as described in the Introduction. Note that the data collected through both means were related to the same CSC challenges and the same teams. The data collected in these events thus allowed us to compare the results obtained using both challenge solve time computational methods, as discussed previously.
In the following, we structure the presentation of the results in the following way. First, we explore the results obtained for challenge solve time using the dashboard (Events 1–9). Next, we present the results for challenge solve time based on the data collected from the Sifu platform, during Events 10 to 12. In the following section, we compare the challenge solve time as computed using both dashboard data and Sifu platform data for Events 10 to 12. Following this, we discuss the team profiles, as obtained through player interaction with the dashboard. Next, we compare the player profiles with the final ranking in terms of points, obtained by the individual teams. Finally, we present the results related to the challenge playing graphs.
2.3. Comparison of Time to Solve Challenge Computation Methods
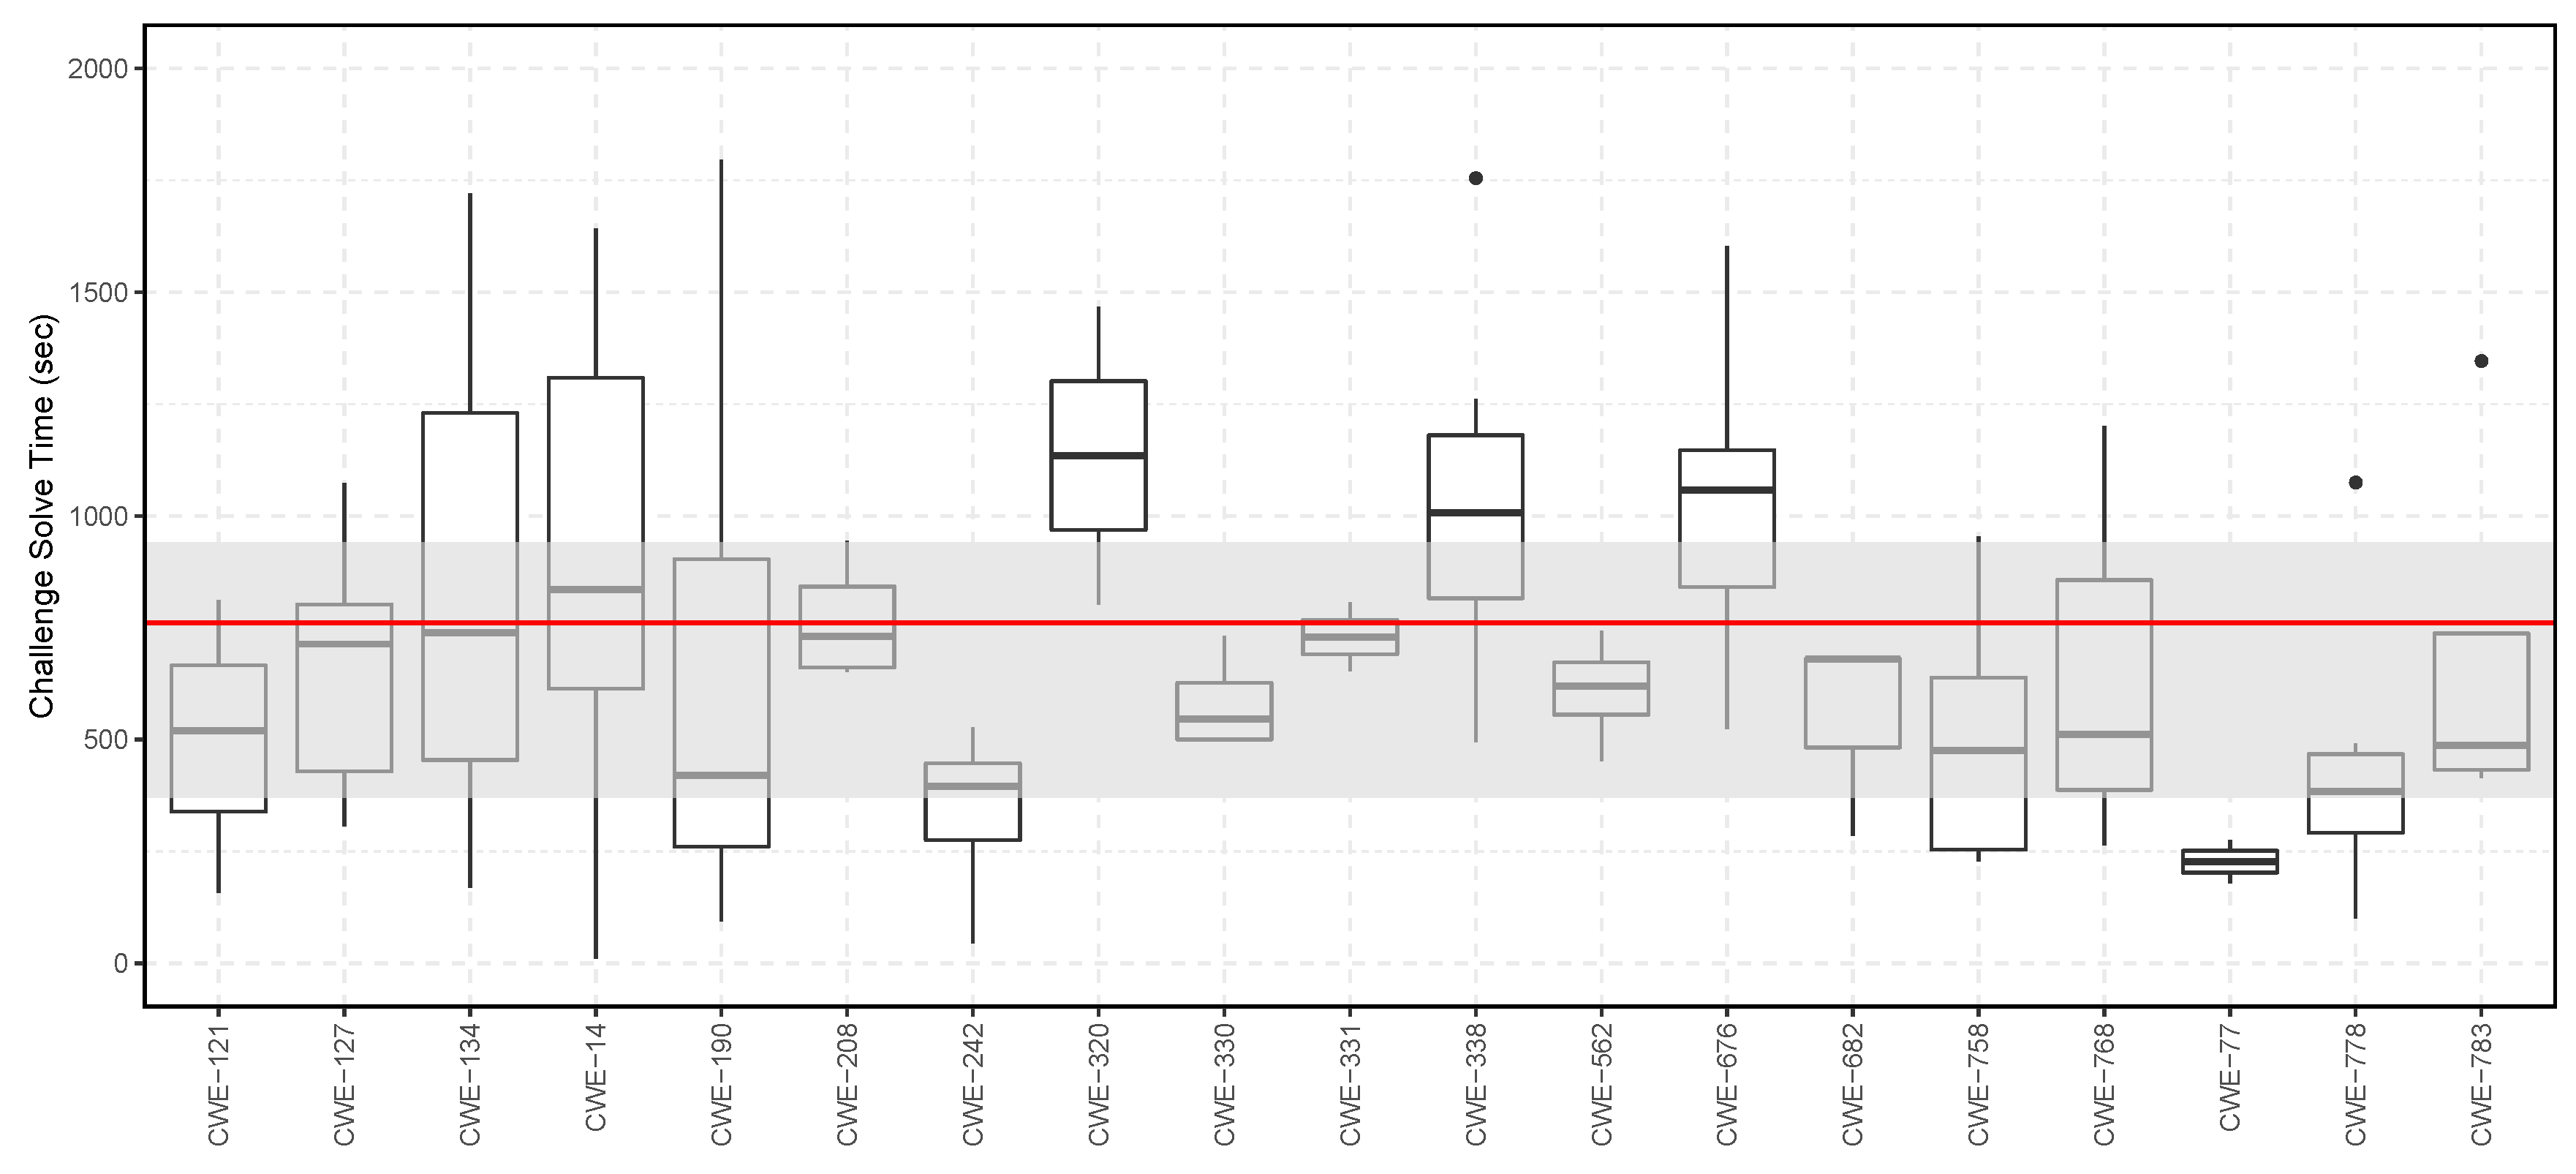
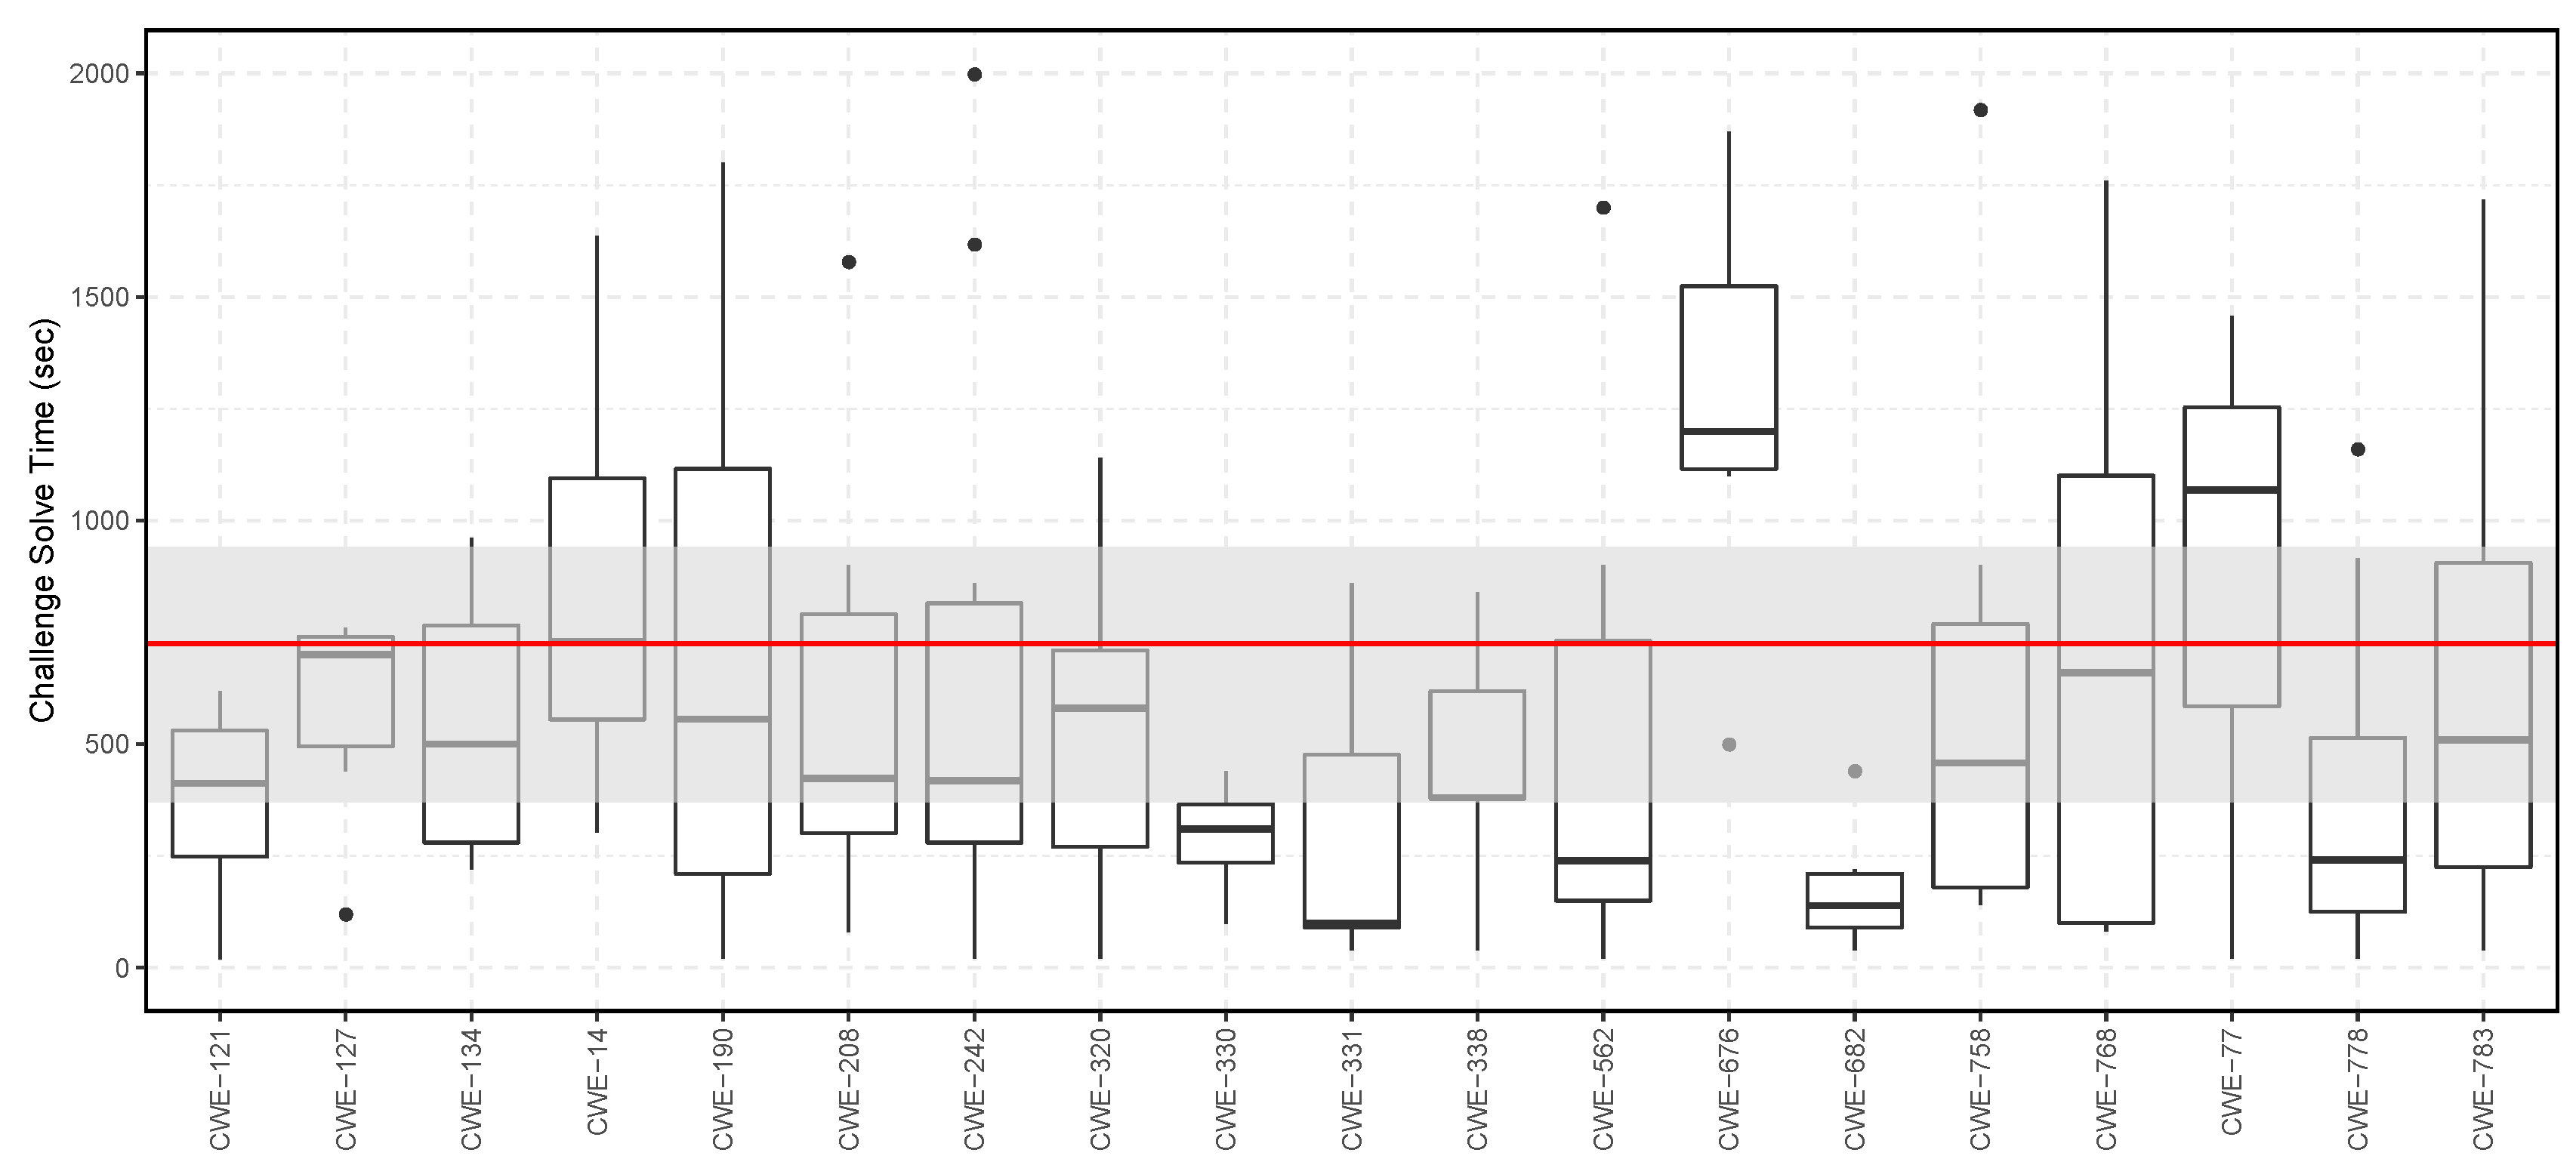
Events 10, 11, and 12 were used to compare the two different challenge solve time computation methods previously introduced. For this, the challenge solve time was computed using dashboard data and, independently, computed using data from the Sifu platform.
Figure 6 shows the computed challenge solve time, which is based on the dashboard data, and
Figure 7 shows the computed challenge solve time, which is based on data collected from the Sifu platform.
In these graphs, the upper limit of the gray bar represents the 75% quartile, while the lower limit of the gray bar represents the 25% quartile, both based on combining all the results for all the challenges. The red line represents the average challenge solve time of the combined results for all the challenges.
This analysis shows that for challenges CWE-14, CWE-121, CWE-127, CWE-242, CWE-758, and CWE-783, both computation methods show approximately the same result. For the remaining challenges, the differences in computation are that either the average time is higher for results collected from the dashboard or that the average time is higher for results collected from the Sifu platform’s challenge heartbeat.
The discrepancies between these two results were observed in practice by the first author during the three events. This difference occurs because of the two observed phenomena: (1) some teams did not immediately submit the flag to the dashboard upon solving it in the Sifu platform, and (2) some teams did not close the web browser window containing the Sifu challenge after submitting the flag to the dashboard. These two phenomena can either result in an overestimation or an underestimation of the challenge solve time using data from the dashboard or Sifu platform.
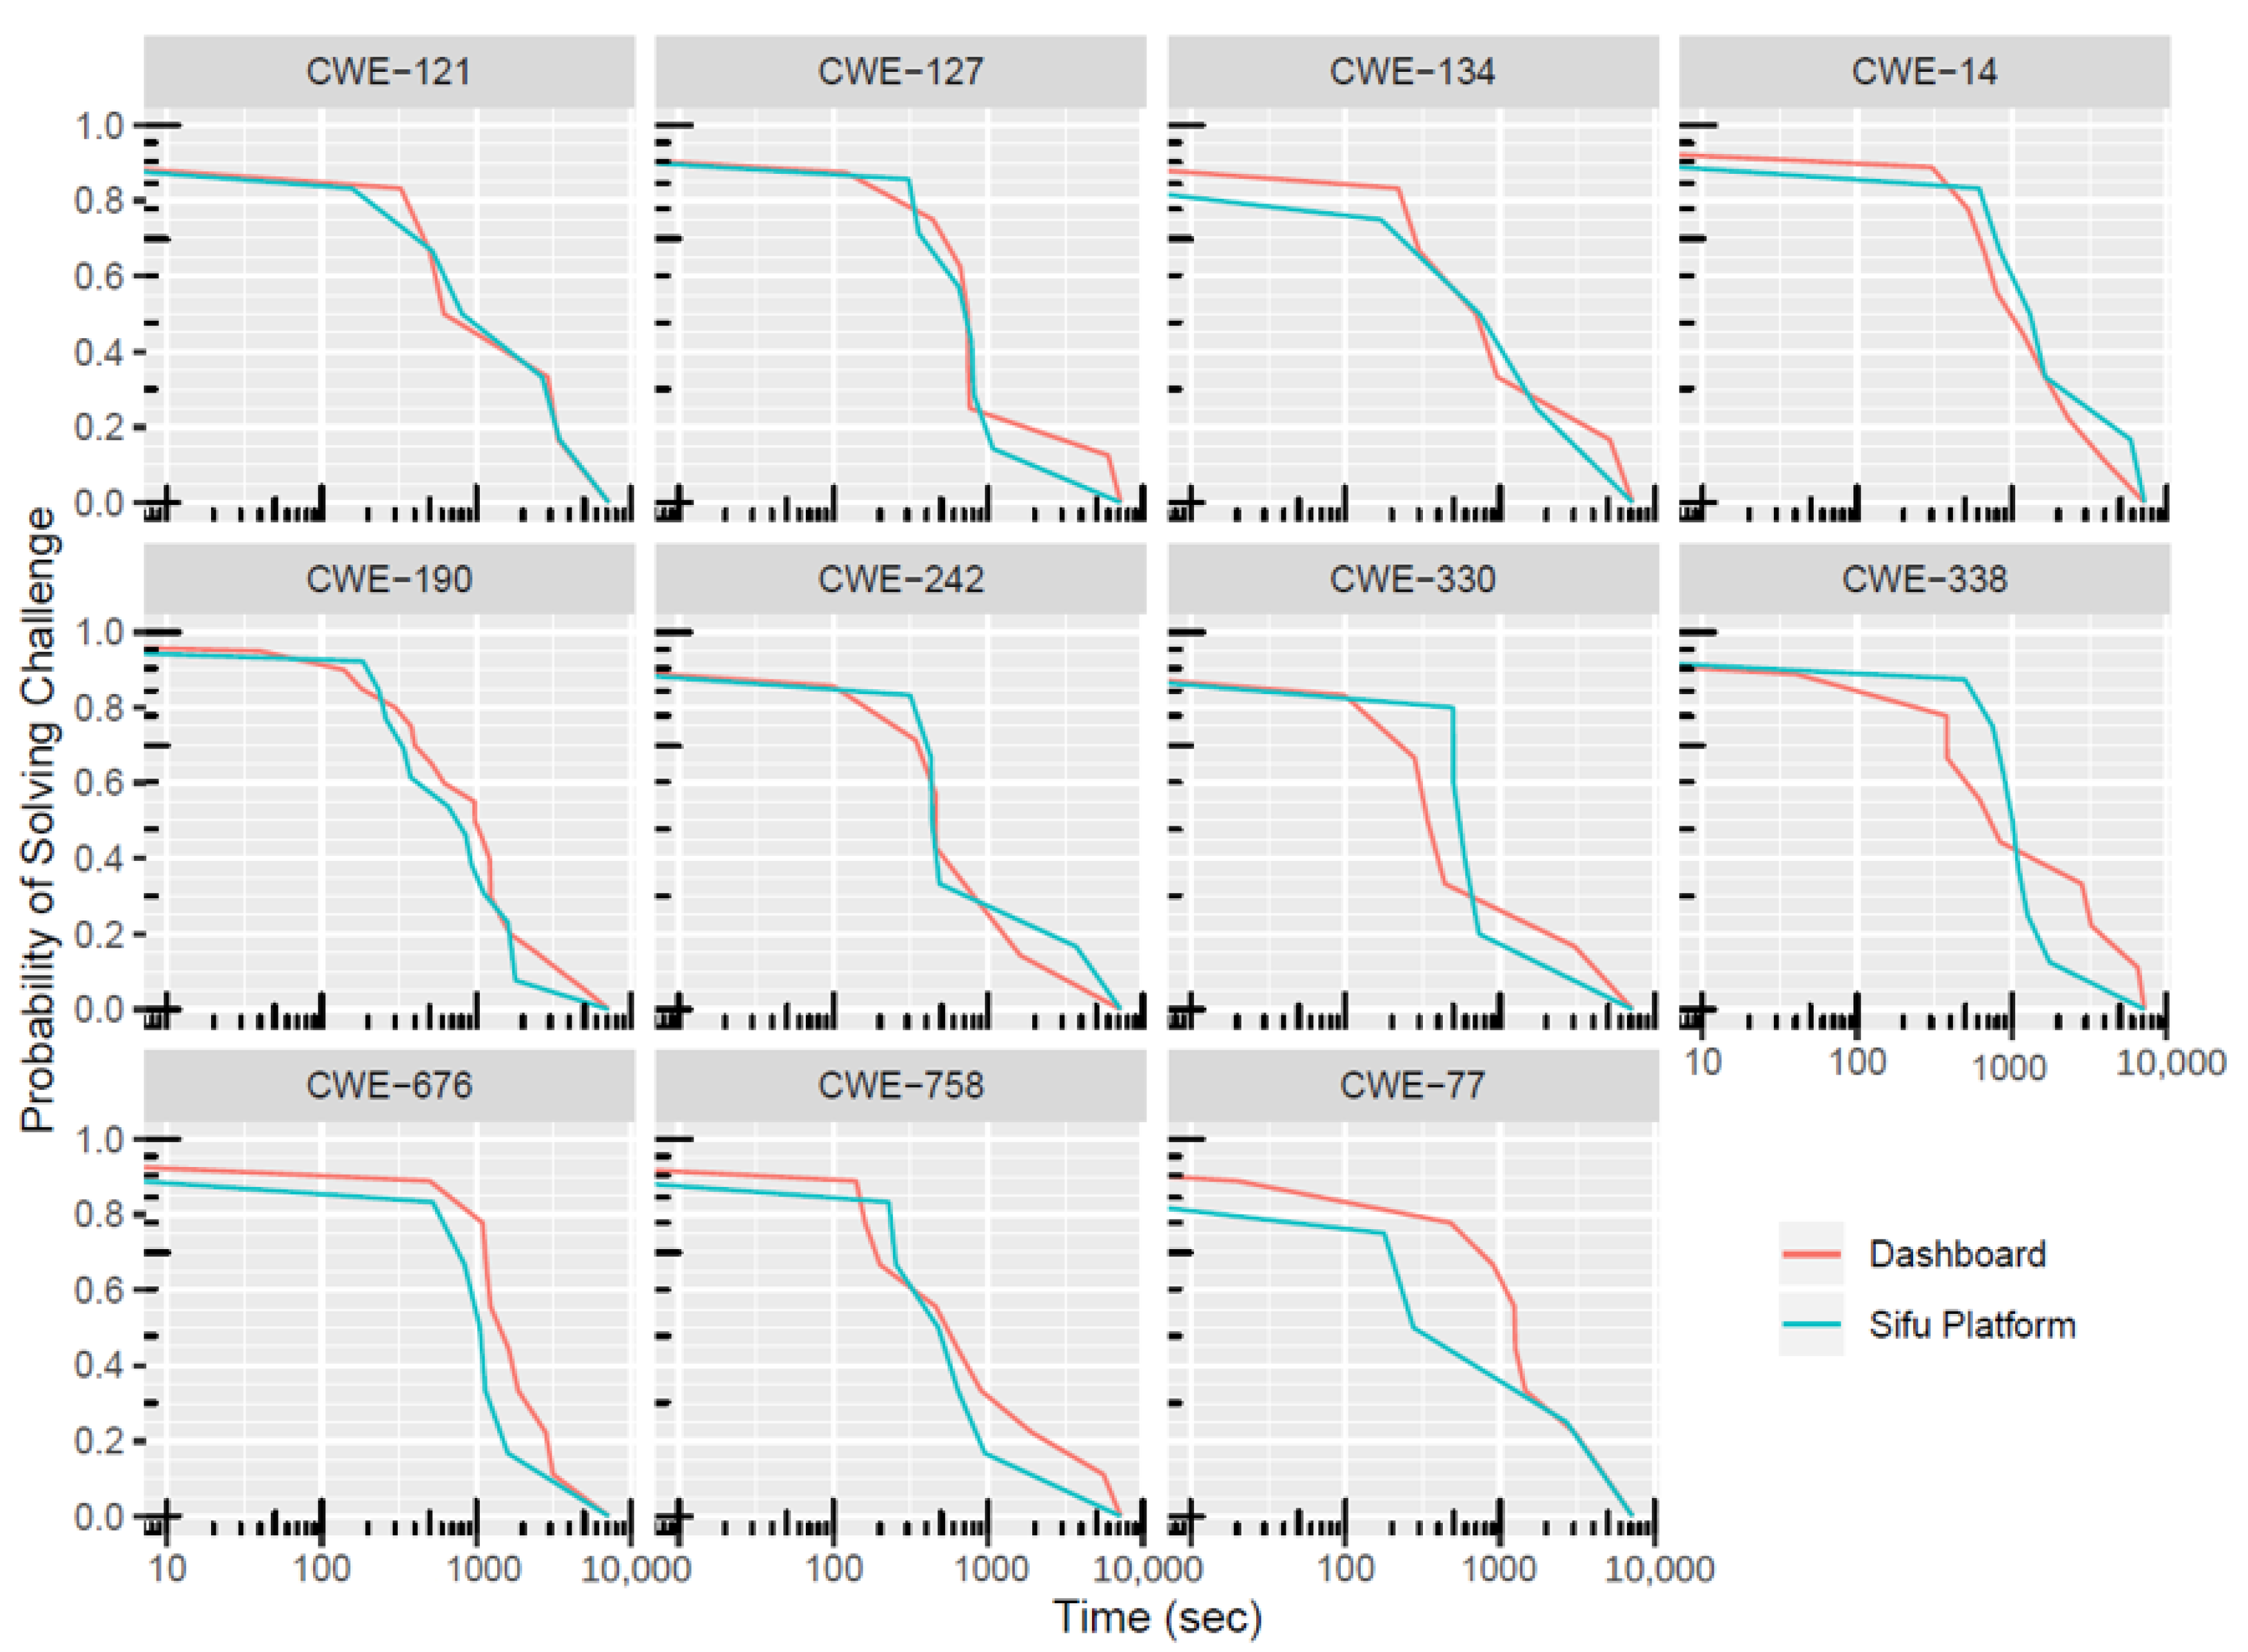
To better understand the overall estimation between the two methods, the challenge fail probability, as previously defined, was computed for the consolidated data of all the challenges both for the dashboard and for the Sifu platform. This analysis is possible since all challenges are of the same category. The analysis is, therefore, valid for a typical C/C++ challenge in the Sifu platform.
Figure 8 shows the computed probability of challenge solve versus time. The results show that this probability is high (close to
) for small time values and becomes very low (close to
) for large values of time. This result is expected as the participants need time to solve the challenges, i.e., initially, the failure rate is high; however, with time, the different challenges start being solved, and the probability that challenges are not solved starts decreasing with increasing time.
As expected, according to results shown in previous subsections, there are differences between the computed challenge solve time using the dashboard data and the challenge solve time computed using the challenge heartbeat from the Sifu platform. We can observe from the figure that both curves have a similar behavior and are close together, showing similar results. A practitioner can use these curves to understand the margin of error incurred by using either measurement technique. It can also be used for the planning of CSC events.
One insightful aspect of the graph is that the dashboard curve has a higher slope and that both curves cross each other at about 50% probability. The reason for this is currently unknown and is a topic that requires further investigation. The authors suspect that this difference might be related to the two different observed phenomena as detailed above.
Finally,
Figure 9 shows the same curve, but for the eleven individual challenges. The plots show a general agreement between both measurements and exemplify the individual margin of errors for both measurement techniques.
Another interesting conclusion for a practitioner is the fact that, by computing these probability curves, not only can a practitioner find better estimates for individual challenges, but also combining the curves into a consolidated view (as in
Figure 8) leads to a better overall estimation of the challenge solve time for a complete CSC event. The more data a practitioner collects, the better the computed curves and estimates are, and therefore, the better the overall estimation for a complete CSC event is.
Concerning RQ3, obtaining these curves is also essential for a good coaching strategy. The individual curves are plotted in a graph that has a logarithmic x-scale. This fact means that the time increases exponentially when moving towards the right-hand side of the graph. We observe that, after about 20% of the challenge failure rate (i.e., at approximately Minute 15), moving more to the right increases the time considerably; however, both curves’ slope is more flattened than in the transition zone at about 50%. This observation means that it takes a considerably higher amount of time (exponentially increasing) to solve a challenge after a team has spent about 15 min on its solution. Note that the 15 min mark is well in agreement with the average challenge solve time presented in the previous section for this type of challenge.
At this time (15 min), the authors recommend that the CSC coaches ask if the teams need assistance in solving the current challenge. With this, the highest effort (80%) was already performed by the team members, and the coach can intervene to help finish the challenge. This help from the CSC coaches can be done by providing additional hints and indications towards the solution. According to experience in the field, the participants report that the coaches have helped reduce frustration during gameplay and increase overall happiness with playing the game. One possible way to keep track of this is to implement a panel in the Sifu platform for CSC coaches; when the challenge solve time of a given team exceeds a certain threshold, the coaches can intervene and help the team.
2.4. Team Profiles
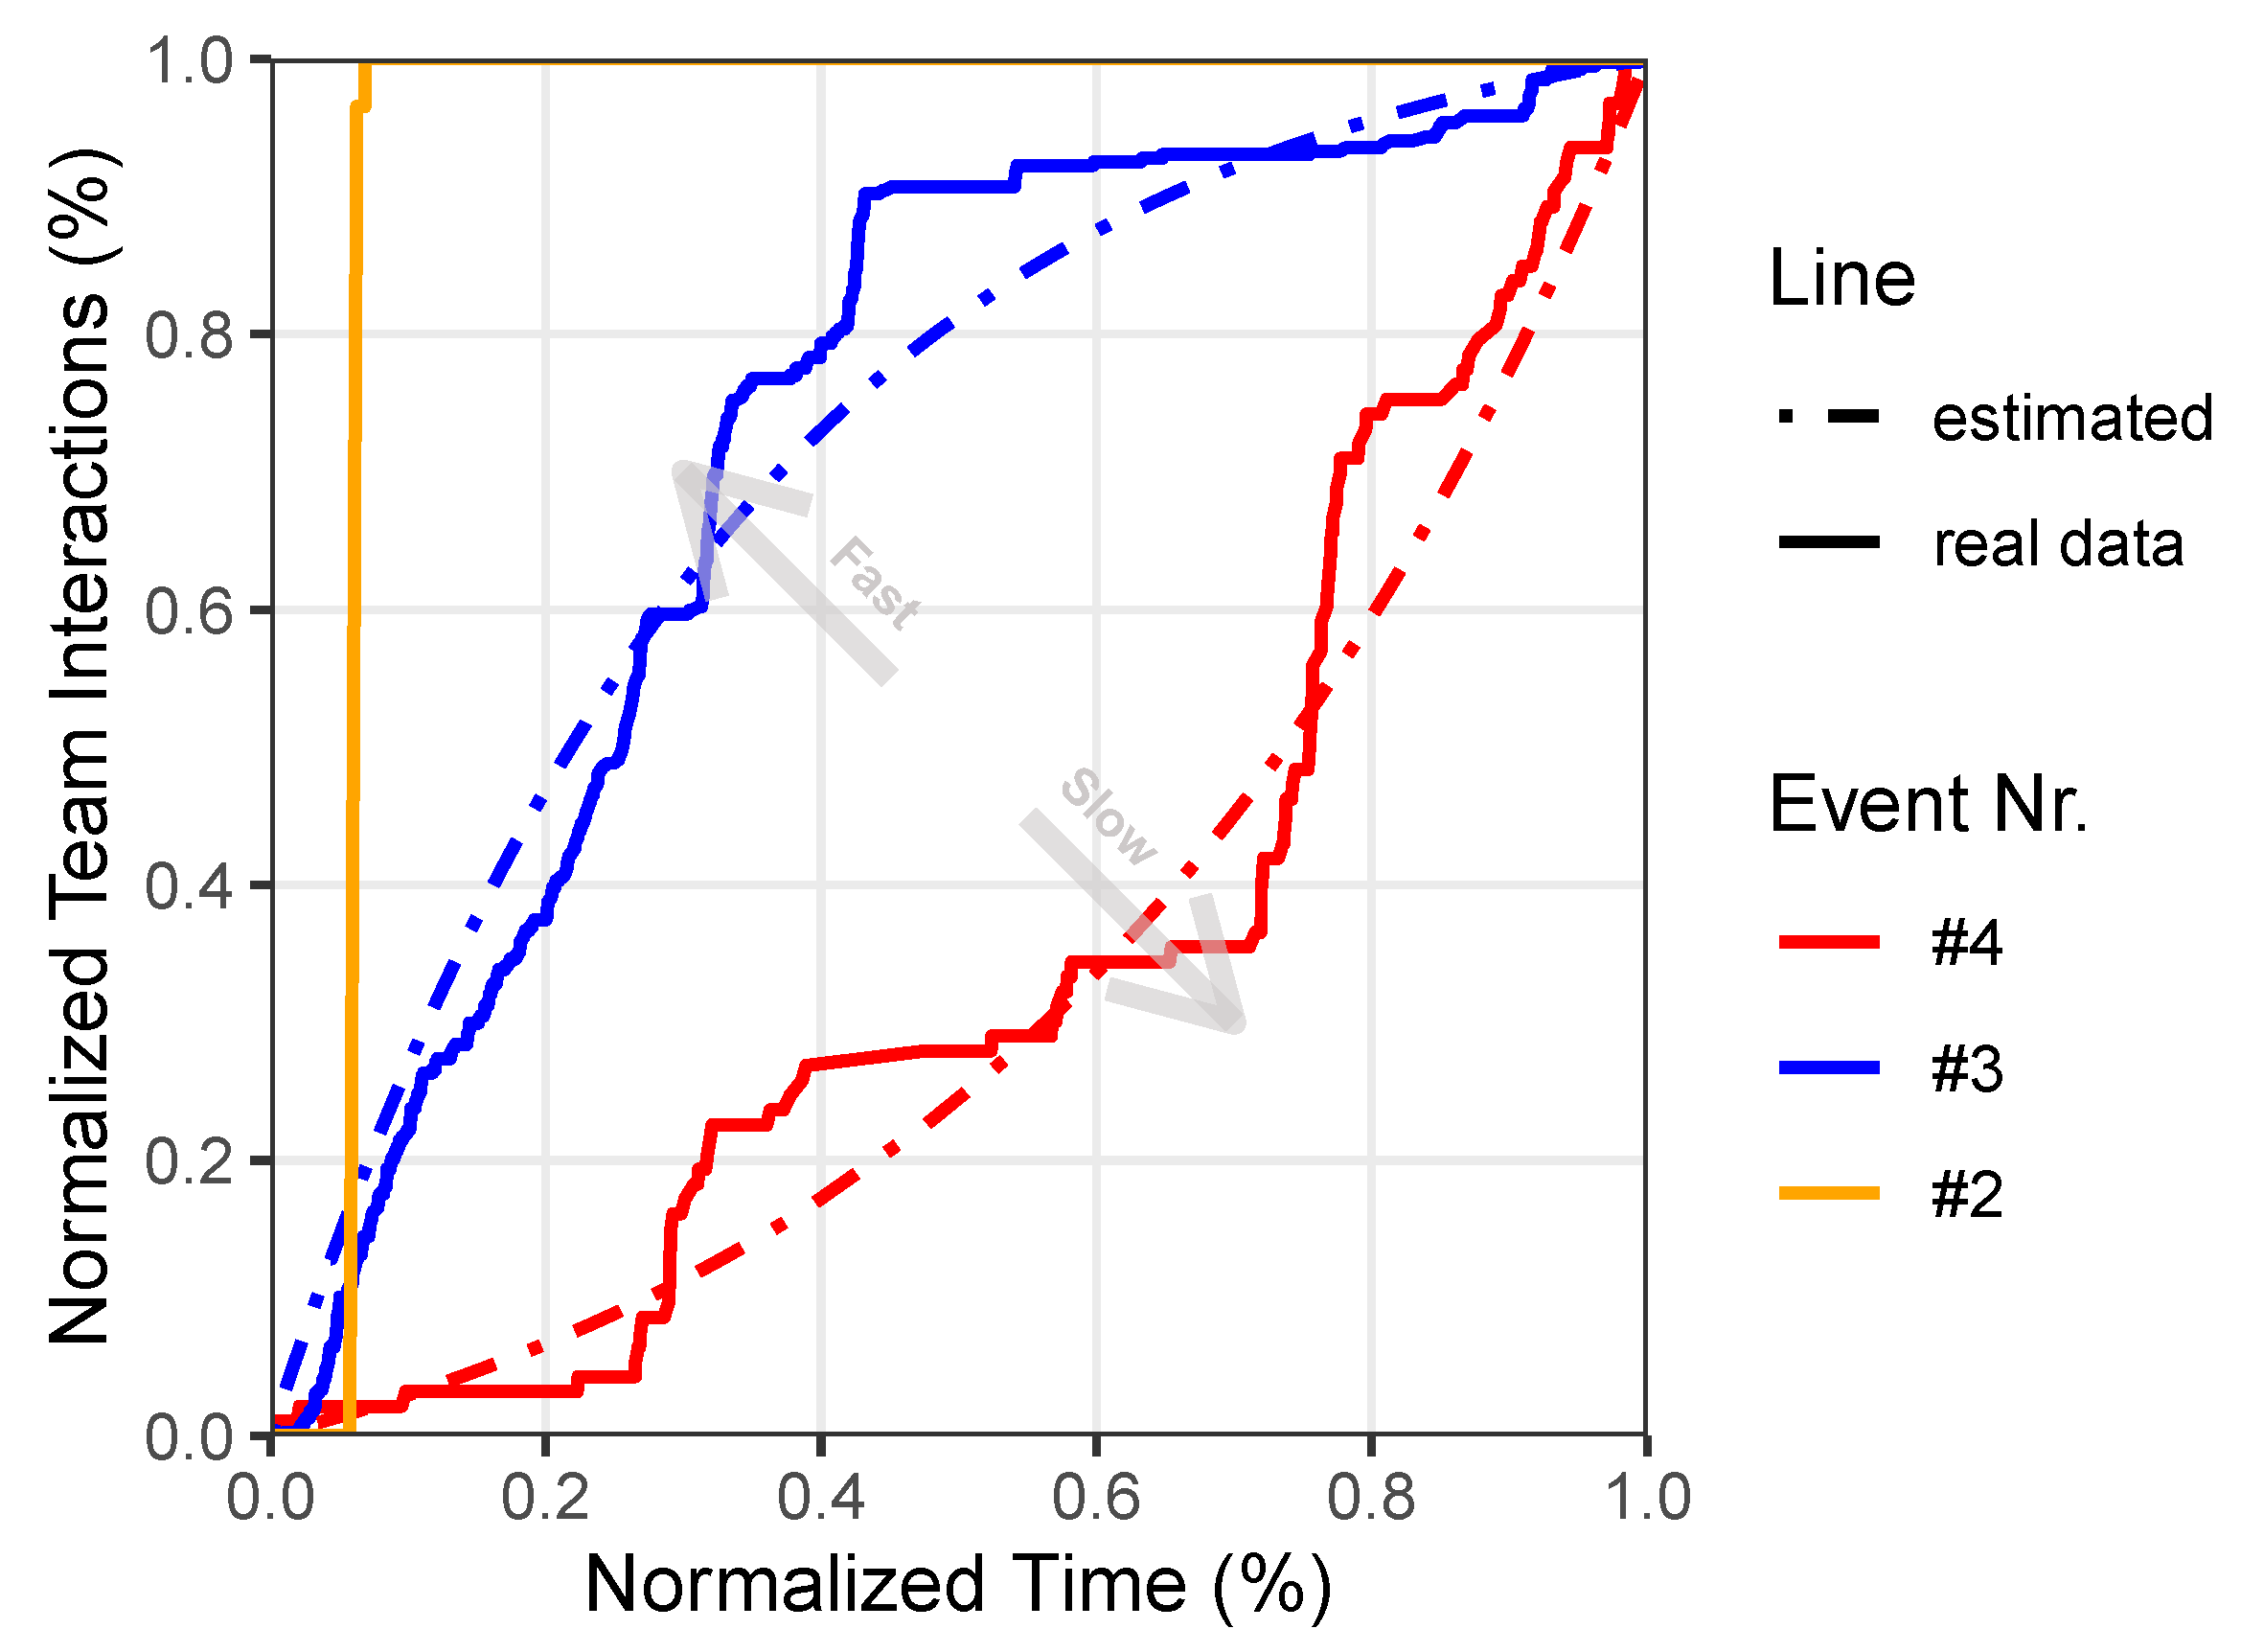
Team profiles represent the overall gaming playing mode that a team has experienced when solving the individual challenges. Here, the authors looked at the curves resulting from the normalized cumulative interactions of teams with the dashboard versus the normalized CSC event time (typically 6 h). Analysis of the team interactions with the dashboard resulted in three team profiles: fast, slow, and automated. The automated profile was rejected in our study since it resulted from pentesters (during Event No. 2) attacking the dashboard using automated scripts. This profile was later confirmed by asking the team members directly about the phenomenon observed in the data.
Although rejected in further analysis, this profile is a clear indicator of non-human interaction with the dashboard; this can be used by coaches to determine possible foul play during a CSC game. However, for all the remaining CSC events, the first author has not seen this scenario occur in practice anymore. This behavior further illustrates the difference between the typical CTF mentality and target group and the target group of players to CSC events.
After discarding the automated profile, the two remaining profiles from human interaction and gameplay are considered:
Fast: the interaction takes place mostly at the beginning, but wears out as gameplay advances,
Slow: most of the interactions happen towards the end of the gameplay, with fewer interactions at the beginning.
By looking at the resulting curves, the authors determined that the shape of the curves resembles the following formula:
Note that represents the normalized time (i.e., represents the start of the CSC event and the end of the CSC event). The parameter a changes the shape of the curve: for , this curve results in a slow profile, and for , the formula results in a fast profile.
Analysis of the CSC Events 1 through 9 shows that the resulting minimum average error has a value of
and is similar for both fast and slow profiles. Although a theoretical explanation for the curve shape formula is not available, it has been shown to produce relatively good results by curve-fitting using a minimum-squared-error algorithm from all the collected data from the first nine events. Furthermore, this value indicates a sound fit between the model given by Equation (
10) and the collected data from the real CSC events.
Figure 10 shows two examples of best-fitting curves, for fast and slow profiles, using minimum-squared-error criteria for Events 4 and 3. Note that, for completeness, we included the automated profile curve, which was observed in CSC Event No. 2.
Plotting the normalized team interactions with the dashboard over normalized time (see
Figure 10) depicts the two expected team profiles: slow and fast.
Implications for practitioners and CSC coaches include facilitating the management of the gaming experience of the participants. Both curves indicate that time management needs attention for both profile types: a coach should understand which profile a team is showing and advise and guide participants accordingly. Field experience has shown that teams that start with a fast profile (i.e., solving too many challenges in the beginning) tend to become more frustrated towards the second half of the game, while teams with a slow profile tend to be frustrated at the beginning. The authors perspective is that a coach should try to help the teams follow a more linear profile—i.e., solving challenges regularly over time. In this way, a coach manages the team expectation during gameplay and helps the team members experience the flow [
19] state.
Management of expectations during gameplay and strategies to ensure that players experience the flow state are topics that require further investigation. However, practitioners can use the simple model presented as a first approach to expectation management. An additional consequence is that, with careful game planning, the total number of challenges can be pre-determined before the event starts. Therefore, it is possible to compute the player profile’s approximation during the CSC event by normalizing the current interactions with the dashboard by the possible interactions through dashboard pre-configuration.
3. Discussion
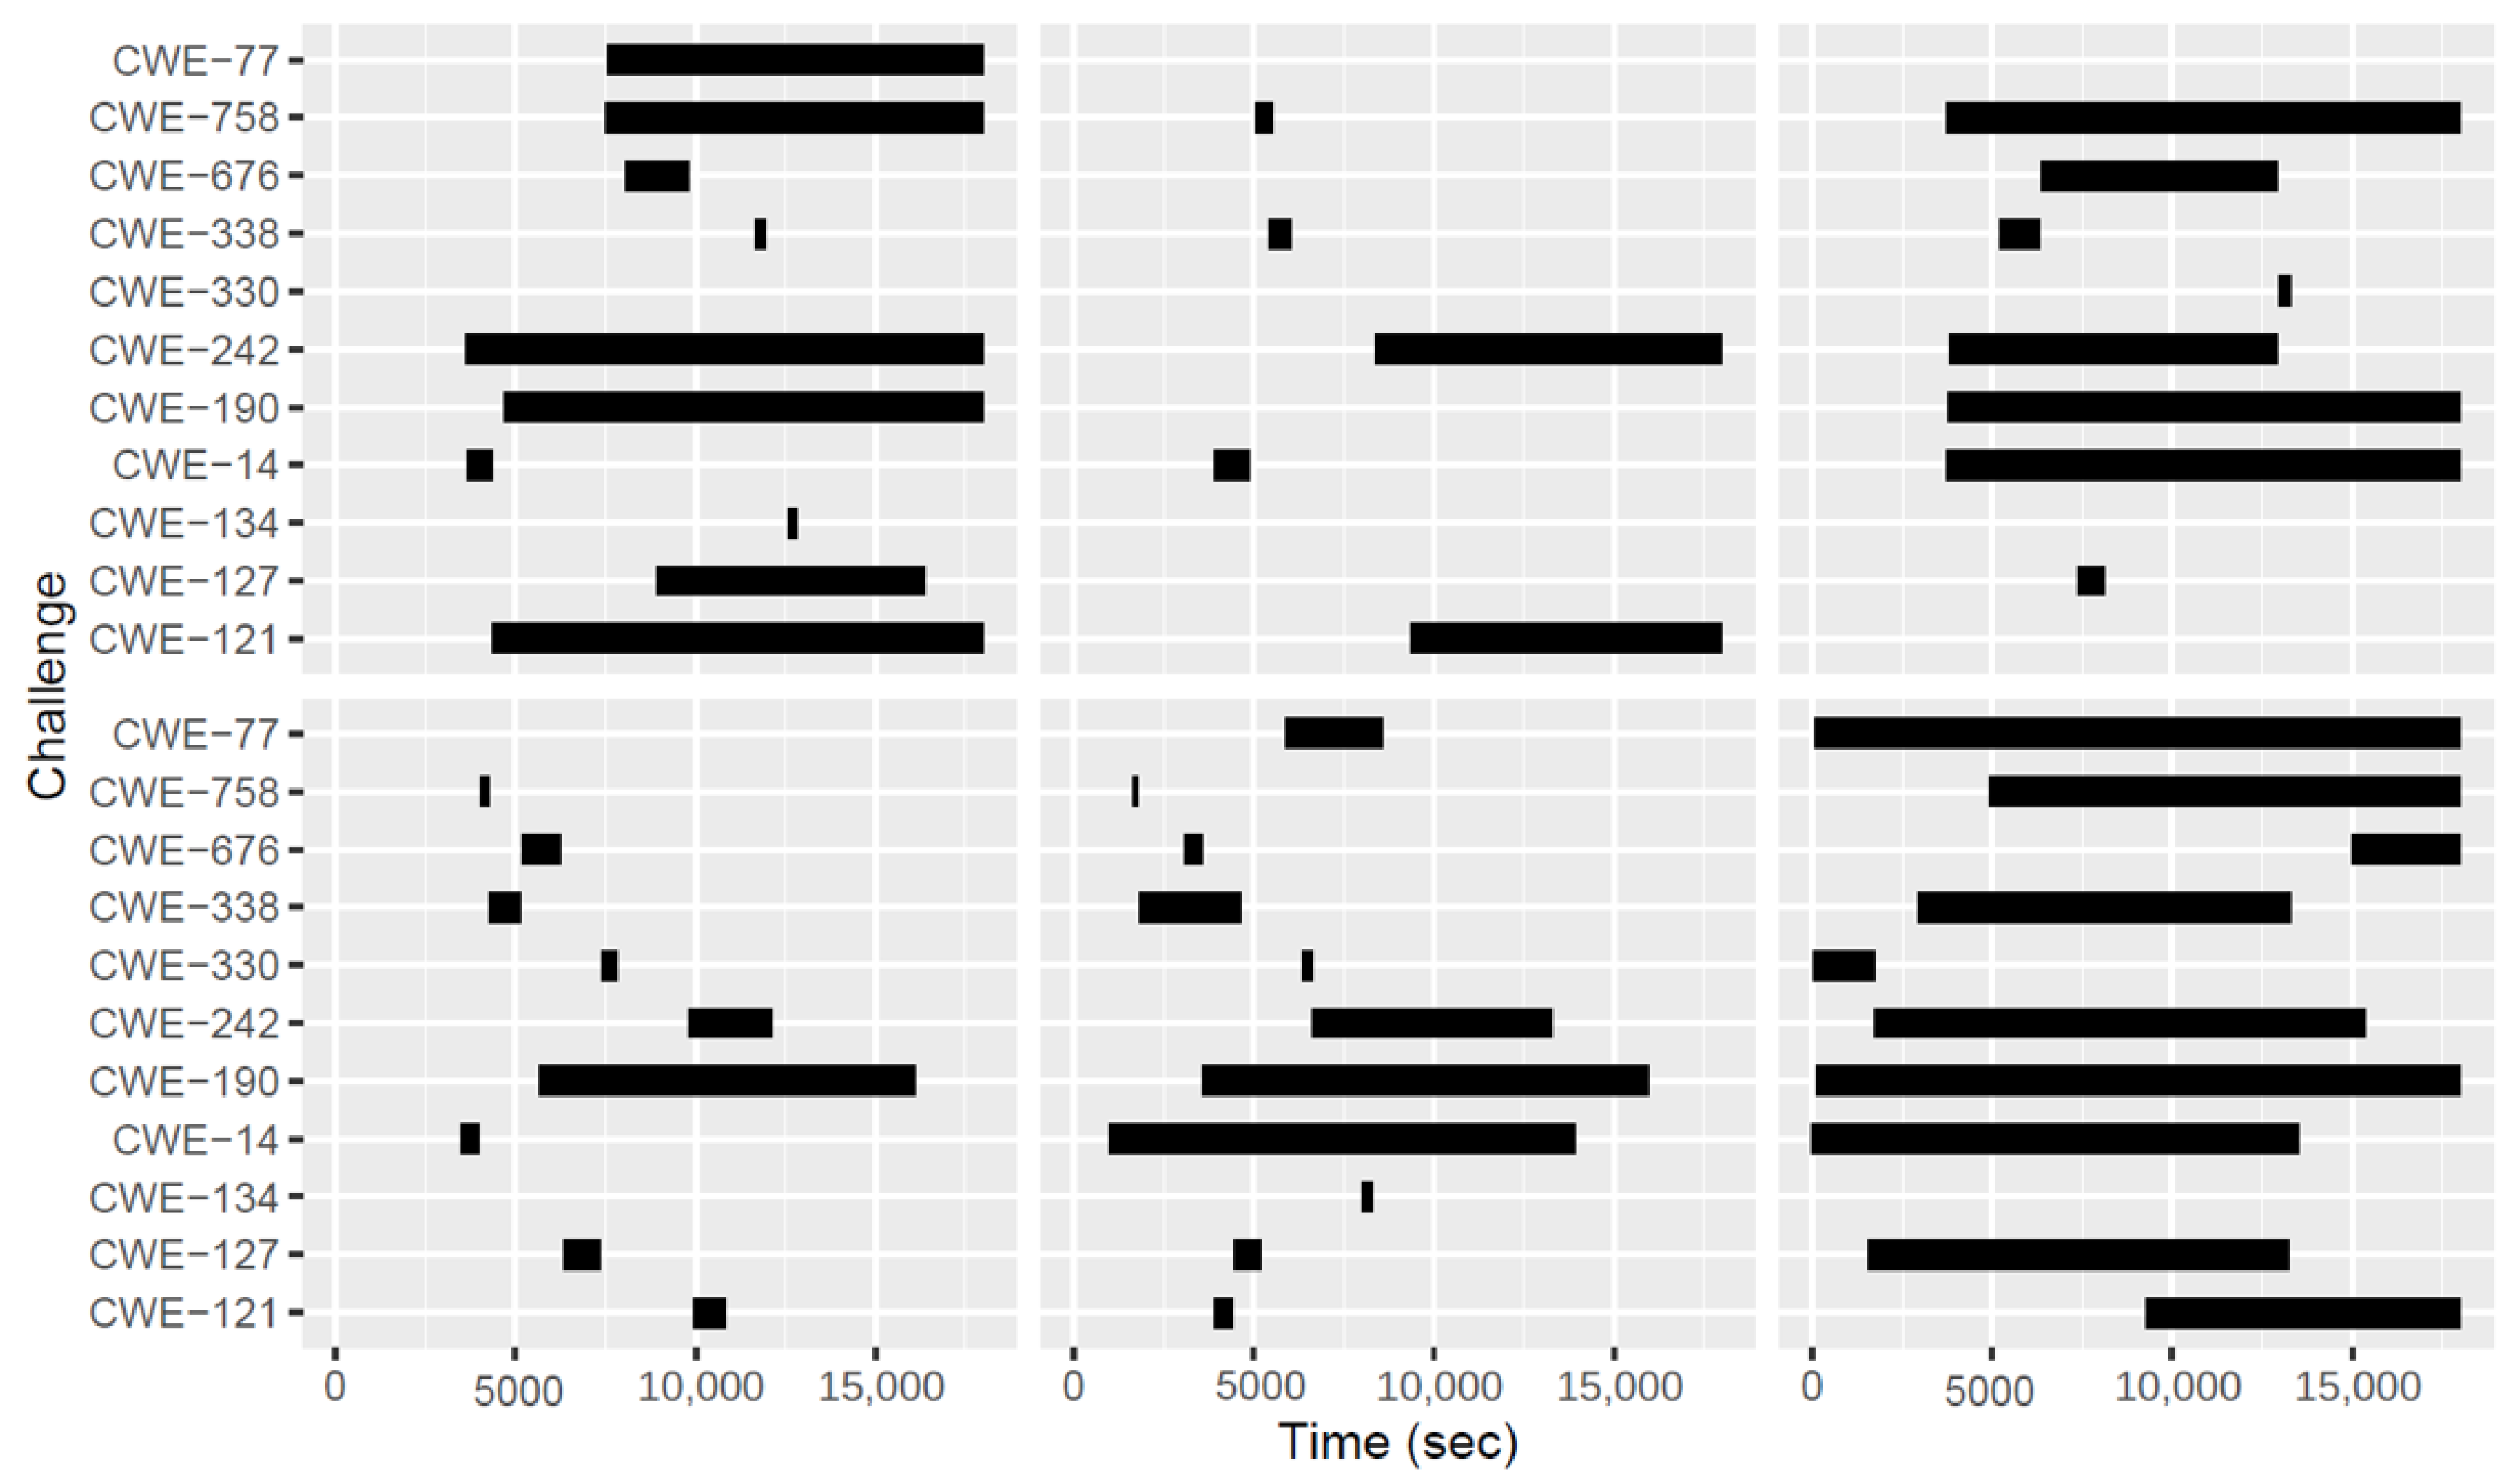
In this work, we presented two methods to compute the time it takes to solve a challenge in the cybersecurity challenge platform. The challenges in this platform are either based on open-source components or an in-house developed platform called the Sifu platform. Computation of the challenge solve time is based on post-processing the timestamps that are either recorded in the CSC dashboard or through a heartbeat mechanism that is implemented in the Sifu platform. The recording of the timestamps uses standard and widely established methods, such as AJAX. We also discuss how to use the player interactions with the dashboard to derive an interaction profile, which we call the team profile. Furthermore, we use the timestamps to compute a curve that represents the probability of not solving a challenge as a function of time. Finally, we use the heartbeat events to plot a challenge playing graph. This graph represents when players are trying to solve CSC challenges. We conclude that, from all the rich set of information that we are able to derive from the back-end logs, these logs constitute a treasure trove containing information ready to be analyzed [
53]. The following provides a brief list of the results we presented. This list serves both as a short reference to the previous sections that deal with each specific topic, but also as a source of ideas for practitioners designing a similar game and who wish to better understand the mechanics of their own artifact.
Method to measure the challenge solve time, based on dashboard data;
Method to measure the challenge solve time, based on the implementation of a heartbeat function;
Analysis of the team profile based on player interaction with the dashboard;
Timing characteristics of the challenge solve time in the form of the probability of solving a challenge as a function of time;
Challenge playing graphs to determine player paths.
Knowing good estimates of the challenge solve time is a pre-requisite for practitioners who wish to design or refine the cybersecurity game. The results hereby presented can also be extended to other serious games, in particular those that use a dashboard, implemented in software, and that captures interactions and timestamps, to track the progress of individual teams. Our results show, as expected, that both methods to compute the challenge solve time produce similar results. Therefore, we can conclude that, for the cybersecurity challenges using open-source components, changing these components to add additional mechanisms to determine the challenge solve time is not really necessary. This can lead to lowering the costs for the maintenance and update of these components.
Our results show the different challenge solve times for the different categories of challenges existing in the CSC platform.
Table 3 shows a summary of our results for the base CSC challenges, while
Table 4 shows the results for the Sifu platform. These tables also indicate that the average challenge solve time is lower for the comics, questions, and forensic challenges (i.e., lower than 560 s), while being higher for the C/C++, Python, and web challenges (more than 1000 s). Furthermore, the C/C++ challenges take on average about double the time it takes to solve web challenges. The kurtosis for the challenges forensics and questions is much larger than
, indicating a leptokurtic curve, i.e., a very sharp curve, while the kurtosis for C/C++ is about three for both the dashboard results and for the Sifu platform results. This indicates that the distribution of the challenge solve time for the C/C++ challenges follows a normal distribution.
Both
Table 3 and
Table 4 show the values for the 25%, 50%, 75%, and 99% quartiles. These values can be used by a designer who wishes to control the level of difficulty of solving a game. The advantage of these tables is that they can be easily consulted. A more detailed analysis of the characteristics of the challenge solve time is shown in
Figure 8. This figure shows the average probability that a team has to fail the solution of a challenge as a function of time. We expect that practitioners that use this method will in time be able to gather more and more statistics, thus reducing computational errors. While this curve allows a more granular tuning and design of a CSC event, practical results might vary due to inherent human factors.
Based on the experience of the first author, considering the player profile results with the challenge playing graph, the following advice can be drawn for designers of CSC events. Since players in teams with a fast profile tend to become more frustrated towards later stages of the game, a better balance can be found; to keep the team profile more constant (i.e., linear), we suggest to make challenges available to participants in “waves”. This means that, instead of releasing all the challenges immediately at the beginning, a CSC designer can program the dashboard to initially hide some challenges, which will be slowly released during gameplay. Although further research is needed at this point, our experience shows that this further helps the players lower their frustration during gameplay and also helps them to remain in a continuous state of flow [
19].
Coaches who have a good understanding of the characteristics of the challenge solve time can also use this to decide on the best time when to approach teams to give advice. This point is especially relevant when the game is played in different countries where the participants have different backgrounds. Our experience has shown that in certain countries, players have a more active role when participating in the CSC event, e.g., by actively asking questions of coaches, while in other countries and cultures, the opposite is true. Therefore, knowledge of this curve can potentially improve the situation (lower frustration and increase learning effect) for the latter case. Additionally, the same methodology can be extended to the Sifu platform, where automatic hints can be given to players dependent on the characteristics of this timing curve. Furthermore, an automatic hint system based on artificial intelligence, such as the one in the Sifu platform, can adjust the hint level based on the timing profile, i.e., more vague hints in the beginning and more directed and solution-oriented towards the end.
Based on the experience of the first author, field experience gathered over the twelve CSC events, together with the presented results, we further propose that the following factors be considered by coaches to decide which team to aid:
Consider long times to submit solutions, which can also indicate a team with a slow profile. In order to lower frustration, a CSC coach should understand to which teams to provide additional hints,
Teams that have several challenges started at the same time (information available through the challenge heartbeat) should be considered candidates for coaching, together with
Coaching should also be considered for teams that have consumed all or most of the available hints for a given challenge.
The following shows a small list of key factors to CSC’s success that coaches should foster, which are based on field experience, feedback from participants, and the results presented in this work.
Open discussions: the teams that worked together in solving challenges reported on the effectiveness of the discussions with their colleagues as a positive experience during the CSC event;
Do not give up on the exercise: teams that did not immediately switch to a different exercise and were persistent towards a solution reported increased understanding of the challenge and takeaways for their own self-improvement; CSC coaches can also foster this behavior;
Ask for help from coaches: teams that actively asked for help from coaches when needed reported to have increased fun and understanding of the challenges; although they were also able to finish the challenges faster, they also reported on the positive learning effect as expected; it is therefore recommended to announce and encourage the players at the beginning of the CSC event to ask for help from coaches when necessary proactively;
Mixed experienced players: teams that mixed junior and senior players also reported on the benefits of the information exchange; we also observed that more experienced players took an active role as coaches themselves towards other players, increasing the learning effect.
Together, we conclude on the importance of properly designing the duration of the CSC event and the duration of individual challenges. We also conclude on the importance of the presented methods to improve the quality of coaching during a CSC event. The authors think that the information collected can be automatically processed and displayed to a panel that coaches can use during a CSC event to improve its effectiveness further.
Furthermore, the authors believe that the proposed methods and results can also be used as an indicator of the competence and skill level of CSC participants: e.g., if the player takes less time than the computed challenge solve time average, this indicates a highly skilled participant, and a higher challenge solve time than average indicates the opportunity for coaching.
3.2. Limitations and Threats to Validity
This study presents an analysis of data from 12 CSC events between 2017 and 2020, with 190 players. These games have been played both on-site and remotely in different organizations in industrial software engineering. The number of events and the number of total players are reasonable for research work in the industry.
The CSC events were a part of different projects (including remuneration) for software development training. Although the participants took part in the mandatory training, participation in the current study, including data collection, was previously agreed upon. According to this scenario, it can be assumed that the players did their best at solving the challenges, and it can also be assumed that data collection and the analysis results have a high validity. Limitations on the focus of games, the number of participants per event, and variations in the participants’ background and experience are inherent to this kind of industrial setting and research. These variations are challenging to control in industrial settings. However, these variations represent the existing reality in the industry. In a different scenario, e.g., with students or voluntary participants acquired through social media, the results would have probably been different. However, we argue that these results’ validity would be lower, especially for an industrial setting.
Further research is needed to clarify the measurements due to the high standard errors in the data. The presence of high errors is likely related to the previously discussed limitations on data collection (e.g., the inability to precisely determine the beginning and end times for solving challenges). However, the authors argue that the guiding principles presented are more critical than the absolute values obtained. However, the methods presented are useful in practical examples in the industry. Furthermore, given the limitations in how CSC challenges are mostly created (i.e., based on open-source projects), a considerable effort would need to be made to improve the data measurement. The hereby proposed data collection method and analysis are lightweight, respect the privacy of participants, monitor the games in real and deferred time, and aid in determining the learning outcomes.
The formula for the shape of the interaction curve (
Figure 10), i.e., player profile, also needs a more in-depth analysis and an understanding of the theoretical foundation. Although the empirical model presented does fit the observed results well, further analysis is necessary to understand the theoretical basis.
In the present analysis, questions have been considered as one challenge category. However, further investigation is needed to separate generic questions and questions specific to previous challenges (i.e., that are unlocked by solving some challenge).
Finally, since in every game, individual players were part of a team, the authors analyzed the influence on ranking in terms of team performance and not individual performance. More research is needed to validate the data on individual performance.
5. Conclusions
In this work, cybersecurity challenges are presented as serious games that raises awareness about secure coding and are used to train industrial software developers in secure coding techniques. Due to industry requirements, the design of these events needs to take into consideration the total event duration and the time it takes to solve individual challenges—the challenge solve time. Furthermore, the careful design of the desired learning goals and effects needs to be taken into consideration.
The current work proposes two different methods to measure the challenge solve time, which is based on timestamps generated and collected using standard existing mechanisms. We also introduce a new tool that can be used both by CSC designers and also by CSC coaches: the challenge failure probability. This tool is a graph that gives an indication of the probability that a given CSC challenge has been solved by a player, depending on the amount of time that has passed since the player has started to solve the challenge. This tool is not only useful to understand the challenge solve time duration, but it can also be used as a tool by CSC coaches to plan their intervention points for different team members. This is especially important to guarantee that the participants are kept actively interested in the game and do not lose concentration due to frustration. Furthermore, we introduce team profiles based on player interaction with the CSC dashboard and discuss practical implications for CSC coaches. Finally, we discuss the usefulness of challenge playing graphs in informing future CSC events.
To address practitioners, the challenge solve times are measured for different challenge types. The presented results provide a good guideline for CSC designers to plan a CSC event. These are based on the analysis of twelve events from CSC games that were played from 2017 to 2020 by more than 190 professional software developers from the industry. Our proposed measurement methods use only data from the game dashboard and from the Sifu platform and allow for an automated computation and estimation of the challenge solve time. The presented results from the analysis of the data are shown to have both implications for game design and for the individualization of cybersecurity challenges.
In the last three events, we collect data from two different sources, using two different challenge solve time computation methods. Using these data, we compare both results against each other and discus the advantages and limitations of each method. Our results show a good agreement between both measurement methods, and our field experience validates our results.
Furthermore, the authors identify, based on the analysis of the challenge solve time, the following profiles: automated, slow, and fast profiles. Our results indicate that the slow profile, with few interactions in the beginning, has advantages over the fast strategy.
The measurement methods hereby presented to analyze the games are pragmatic in nature: it takes only data from the dashboard, no personal data and no linkage to individual persons and to the learning outcome, as per the requirement in the industry. Using the collected data, the authors provide a method that allows for the planning of a CSC event together with the ratio of learning materials. In a provided computed example, which is comprised of an 8 h CSC event (where 6 h belong to active challenge solving), we show that 7 C/C++ challenges and 21 questions can be accommodated. This value has also been verified in practice and matches our experience in the field.
Furthermore, our analysis is useful for the game coaches: monitoring the dashboard allows coaches to provide targeted guidance with the goal to optimize the gaming experience and the learning outcome. Furthermore, we devise factors and recommendations that CSC coaches can take into consideration, so as to determine when to intervene and perform individual coaching of team members.
In further research, the authors plan to further improve the measurement time using the Sifu platform, addressing some of the limitations that have been observed in practice (e.g., that players have not closed their browser window or that flags have not been submitted in a timely manner to the dashboard). The authors would also like to explore the failure probability graph as a means to improve the hint system in the Sifu platform.


