Article

Importance Analysis of Components of a Multi-Operational-State Power System Using Fault Tree Models

Department of Machine Construction and Materials, Faculty of Marine Engineering, Maritime University of Szczecin, ul. Willowa 2, 71-650 Szczecin, Poland
Information 2020, 11(1), 29; https://doi.org/10.3390/info11010029
Submission received: 23 November 2019 / Revised: 1 January 2020 / Accepted: 1 January 2020 / Published: 5 January 2020

Abstract

:
This article describes a case study using a fault tree analysis for a multi-operational-state system (system with several operational states) model with many different technical solutions for the power system of a fishing vessel. We describe the essence of system dependability metamodeling. A vector of external events was used to construct a detailed metamodel, depending on the operational status being modeled. In a fault tree, individual external events modify the structure of a system. The analysis includes the following operational states: sea voyages of a vessel, hauling in and paying out nets, trawling, staying in a port, and heaving to. For each operational state and assumed system configurations, the importance of system components was determined by calculating the Vesely–Fussell measures. The most important components for each operational state of a system were determined, and the critical system components, that is, those that are important in every operational state and system configuration, were identified.

1. Introduction

System structures often significantly change under different operating conditions. These conditions are associated with switching certain system components on or off, depending on the demand for functions of these components in a given operational state [1,2,3]. There are different ways to model time-variant reliability structures, for example, using graphs, tables, reliability block diagrams, fault trees, and so forth [4,5,6,7]. Moreover, there are a number of calculation methods used in reliability engineering, for example, Bayesian methods [8,9,10,11], Monte Carlo [12,13,14,15], Markov processes [16,17,18], fuzzy logic [19,20,21,22], and so forth.
Many complex technical systems are composed of similar or identical (analogous) basic components. Examples of such systems are ship’s power systems [23,24,25]. The paper analyses the power system, understood as the whole system composed of the subsystems of electric energy production, ship propulsion, and the technological process. Depending on the size of ship, its intended use, and the specific construction, these systems may vary considerably [26].
The application of general models is suitable for both the analysis of different operational states of a vessel and for comparing structural solutions in different vessels. This enables the application of general models to various configurations of the studied system. Such models enable a faster analysis of dependability measures of systems composed of similar components [27,28].
One method for modeling the system reliability structure is the fault tree analysis. The structure of time-variant systems can be modeled using dynamic fault trees and suitable additional functional blocks (gates) that describe complex logical and time-related relationships in the analyzed system [29,30,31]. Often, however, due to the need to simplify the model, it is necessary to use static fault trees, that is, trees using basic static logical gates to describe the relationship between events in a system [32,33,34,35].
An event is defined as any change in either the structure or the functioning of the system being operated. Therefore, events may include failures in system components, human errors, adverse environmental impacts, or software flaws.
In classical (static) fault trees, external events are used to change relationships between events, and make it possible to define selected system indicators in different operational states [36]. In addition to the general characteristics of the whole system, it is very often necessary to determine which events are most important for the system in question. In the literature, this issue is referred to as importance analysis, significance analysis, or sensitivity analysis [27].
In general, from a specific point of view, an important event is one that has an adequate set of characteristics with values adopted a priori within an acceptable variability range. Maciej Woropay defined significance as the possibility for the “vertical impact” from a subsystem failure to reduce, from a specific level of decomposition, the ability of higher-level (parent) systems to accomplish a task. Vertical impacts involve relationships between subsystems and supersystems [37]. Therefore, the significance of a component I is, therefore, a function that reflects to what extent a component I meets the criteria k 1 ,   k 2 ,   ,   k n k :
I = f ( k 1 , k 2 , k q , k n k )
Let Φ(f) be a functional of the system state, which assigns a number to each function f from the function space. Then, the condition for verifying whether the value Φ(f) falls within the range of acceptable variability [a, b] is considered to be the significance evaluation criterion [37]:
a Φ ( f ) b
The significance of events during the formation of a disaster depends on [27] the probability of an event occurring in the structure in which it is located and the consequences of the event occurring. Given complete information about events, it is possible to determine their significance using quantitative significance measures, including Birnbaum, Vesely–Fussell, Natvig, Bergman, Lambert, and Barlow–Proshan measures, risk reduction worth, improvement potential, and risk achievement worth [3,27,38,39].
During system operation, the reliability and functional structures of complex technical systems can change due to individual subsystems switching on and off, depending on the tasks they perform. A variable system structure makes an analysis difficult because it is necessary to develop a separate model for each operational state, which significantly prolongs the analysis of the whole system. This problem may be solved using general models covering different configurations of systems belonging to a given set, which results from changing the operational state and the operational requirements of the system.
A previous report proposed the use of a general model, which is transformed into a detailed model with an external event vector, which models the change in the operational state [35]. The proposed model-based approach implemented in fault trees is shown in Figure 1.
This methodology was developed previously to address the possible use of a general model to estimate the detailed reliability indicators of a complex technical system [27]. This article will present the importance analysis of a fishing vessel’s power system components for selected operational states.

2. Materials and Methods

2.1. Object of Analysis

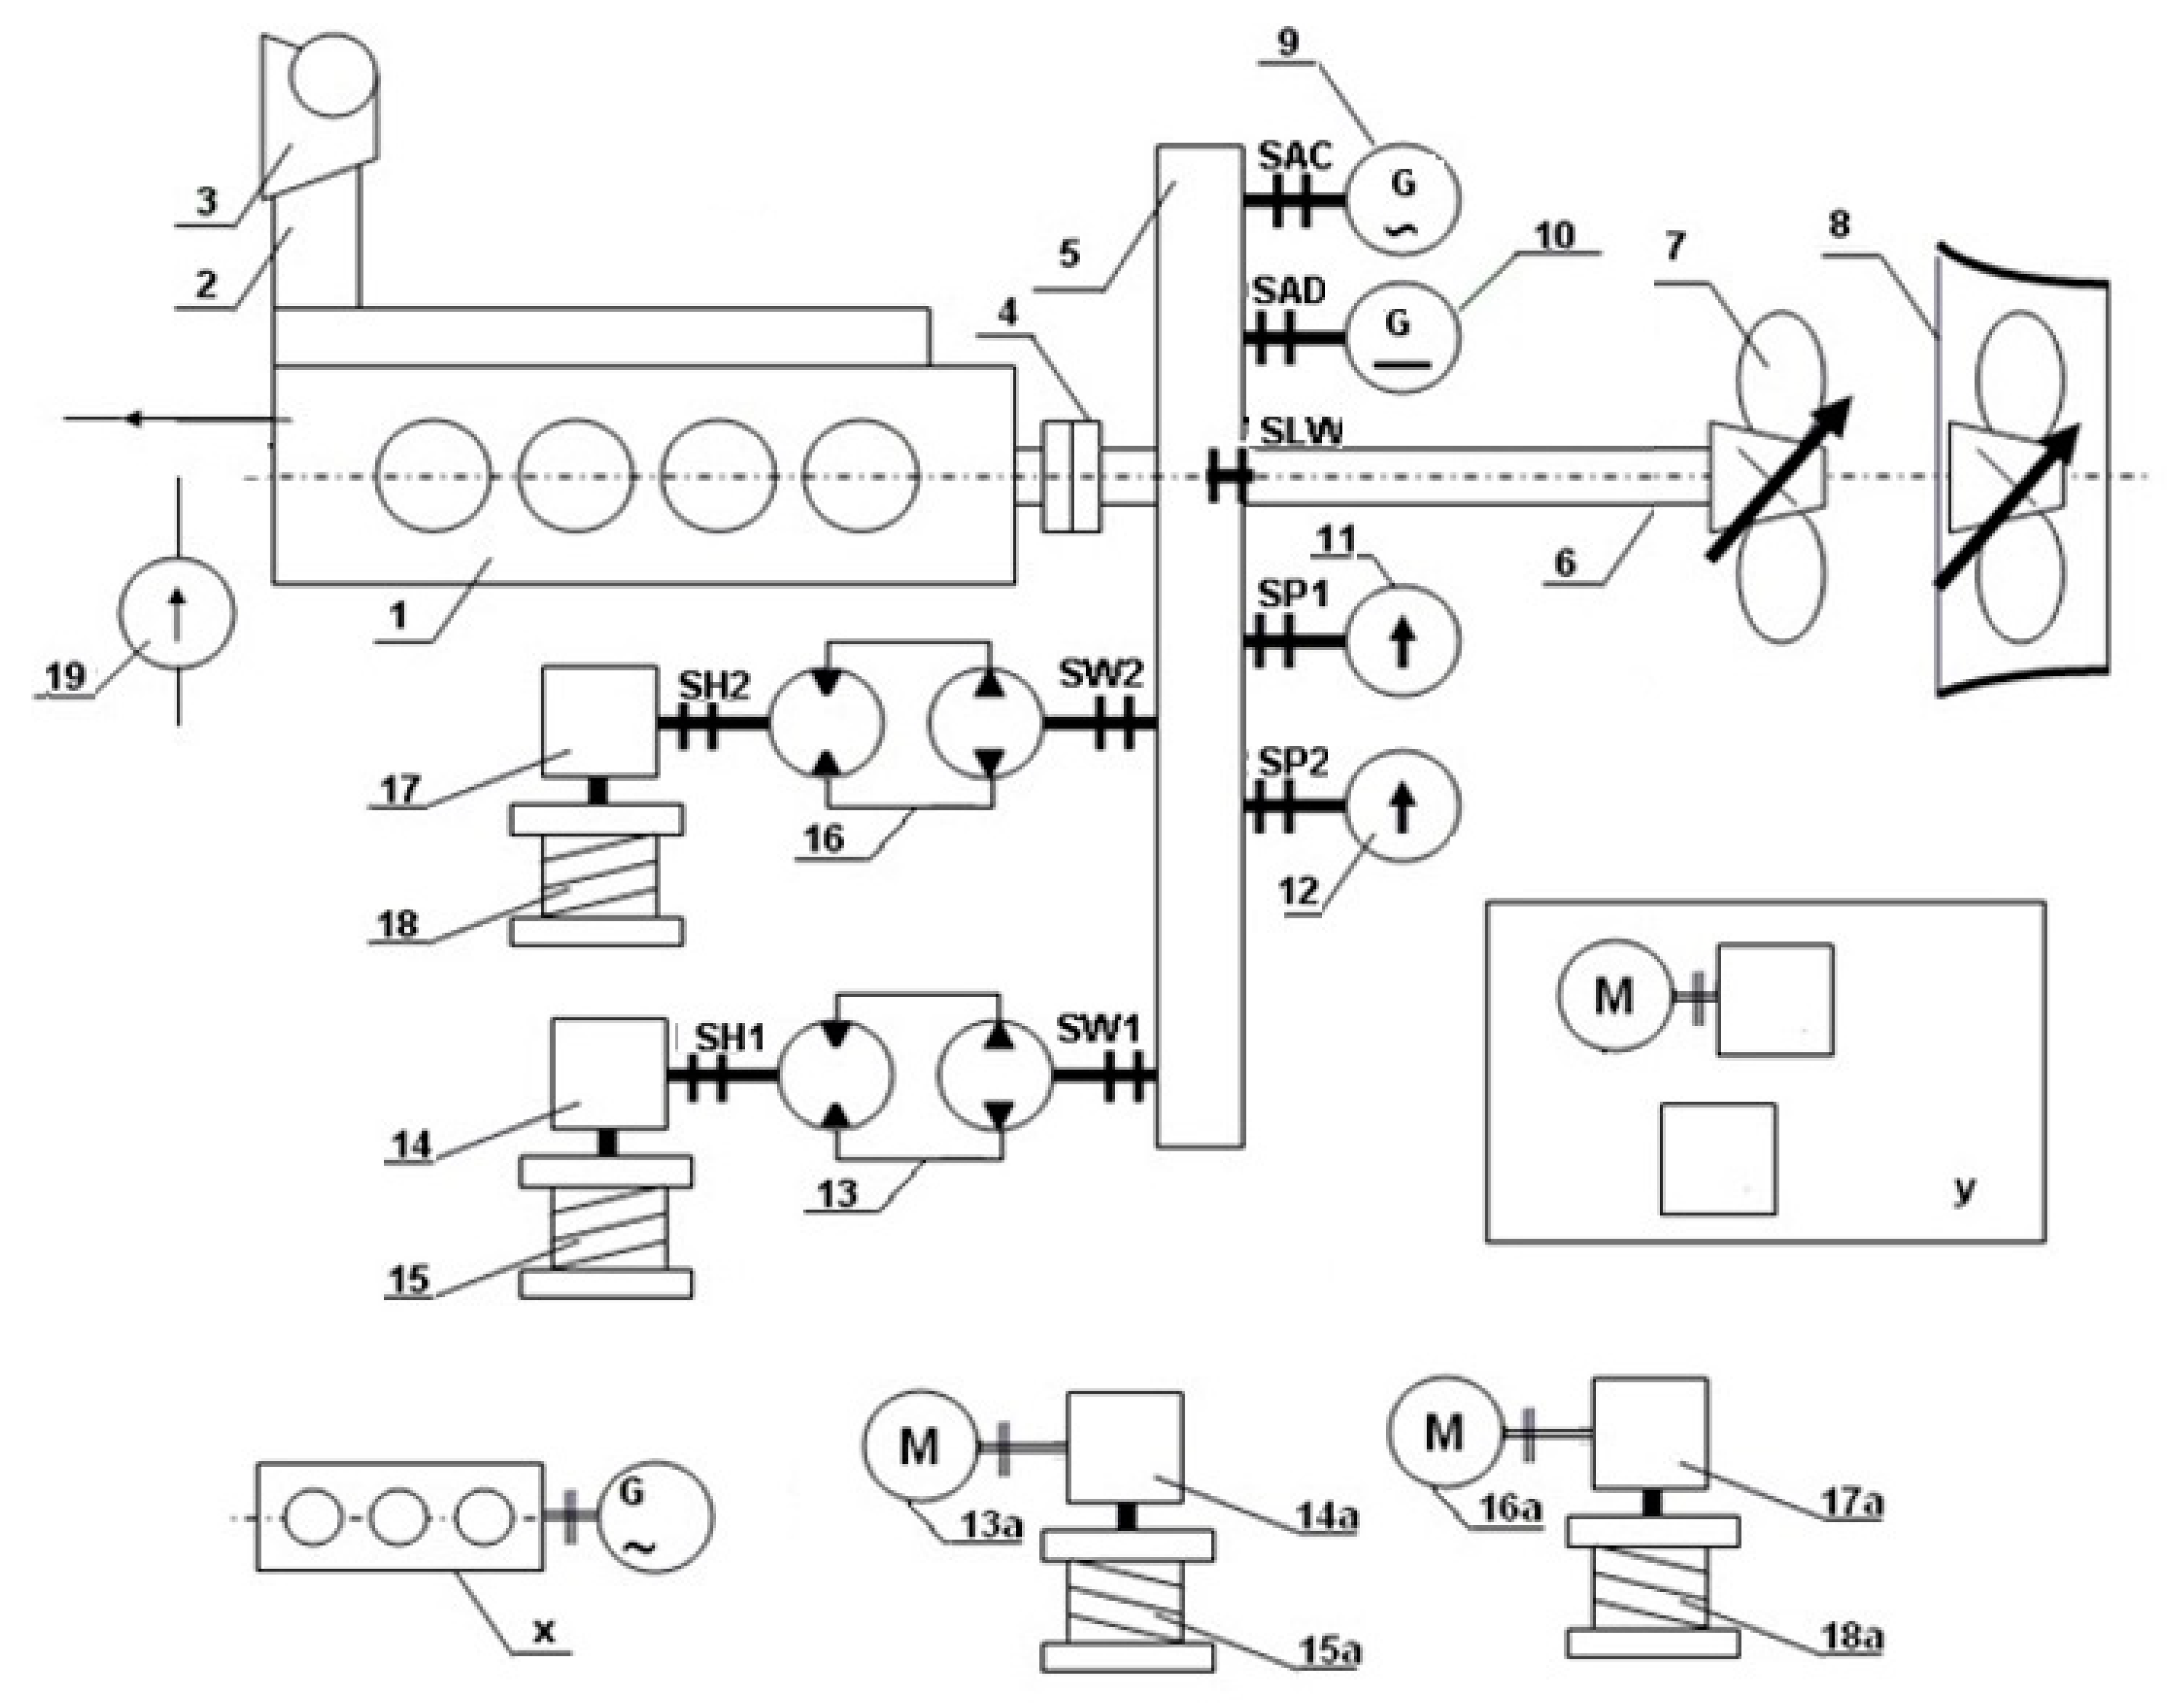
The analysis covers the fishing vessel’s propulsion system, as shown in Figure 2. Individual system components can be engaged and disengaged depending on the operational state of a ship [18]. Particular components of the system are as follows: 1—main propulsion engine with auxiliary systems supporting its operation (SG); 2—main propulsion engine’s exhaust manifold; 3—charge exchange system (air filter, air cooler, turbocharger); 4—countershaft coupling and its motor; 5—transmission; 6—line shafting (countershaft and propeller shaft, stern bush bearing and seal); 7—adjustable or fixed propeller; 8—Kort nozzle of the screw propeller; 9—alternating current (AC) shaft generator; 10—direct-current (DC) shaft generator; 11—pump no. 1 driven by the main propulsion engine through the transmission; 12—pump no. 2 driven by the main propulsion engine through the transmission; 13—hydraulic drive system (pump—motor) of trawl winches driven by the main propulsion engine; 14—trawl winch transmission gear driven by the system 13; 15—head of the trawl winch driven by system 13; 16—hydraulic drive system (pump—engine) of a net winch, driven by the main propulsion engine through the transmission; 17—net winch transmission gear driven by the system 16; 18—head of the net winch driven by the system 16; 13a—electric motor of the trawl winch; 14a—transmission gear of the trawl winch driven by the motor 13a; 15a—head of the trawl winch driven by the motor 13a; 16a—trawl winch electric motor; 17a—transmission gear of the trawl winch driven by the motor 16a; 18a—head of the trawl winch driven by the motor 16a; 19—pump (pumps) of the seawater (cooling of fresh water in the power plant’s cooling system and handling of technological systems); SAC—shaft alternating current generator disengaging coupling; SDC—shaft direct-current generator disengaging coupling; SP1—disengaging coupling of the pump no. 1; SP2—disengaging coupling of the pump no. 2; SW1—disengaging coupling of the pump of the winch hydraulic drive system 15; SW2—disengaging coupling of the pump of the winch hydraulic power transmission system 18; SH1—disengaging coupling of the engine of the hydraulic drive system of the winch 15; SH2—disengaging coupling of the engine of the hydraulic drive system of the winch 18; SWL—disengaging coupling of the drive shaft; x—electrical and power unit(s) driven by a combustion engine; y—other current-using equipment.
Denotations of individual system components and their unavailability values are summarized in Table 1.
Based on this general system structure, as well as the reliability indicators of the components, models were built to determine the importance of the components depending on the system structure.

2.2. Modeling Operational State Changes in a System

If X ( t ) = [ X 1 ( t ) , X 2 ( t ) , X n ( t ) ] is a binary component state vector that describes the reliability state of all components, such that Xi(t) takes the value 1, when the i-th component is operable and takes the value 0, when the i-th component is faulty at the time point t, and S is the set of all component state vectors, then the structural function can be expressed as the map:
φ [ X ( t ) ] = φ [ X 1 ( t ) , X 2 ( t ) , X n ( t ) ] : S { 0 , 1 }
In the literature, the function (3) is called the system structure function [42,43]. In general, the values of this function are normalized to the range [0, 1]. If the function φ ( x ) is bivalent, φ(x) = (0 ∪ 1), then in terms of reliability, the object is bistate (up-state, down-state). The number of all possible structures corresponding to the number of possible logical functions of a bistate system built of n bistate components is equal to 2 2 n .
The system structure can be presented as a negative structural function of the system φ ¯ (system-failure-oriented analysis). This function specifies the state of the system depending on the state of its components and takes the value 0 when the system is operable and the value 1 when the system is faulty [42]. If X ¯ ( t ) = [ X ¯ 1 ( t ) , X ¯ 2 ( t ) , , X ¯ n ( t ) ] is a negative binary component state vector describing the reliability state of all components, such that X ¯ i ( t ) takes the value 0 when the i-th components is operable and the value 1 when the i-th component is faulty at the moment t, and S ¯ is the set of all component state vectors, then the structural function can be expressed as [1,27]
φ ¯ [ X ¯ ( t ) ] = φ ¯ [ X ¯ 1 ( t ) , X ¯ 2 ( t ) , X ¯ n ( t ) ] : S ¯ { 0 , 1 }
For the vessel’s power system shown, the binary state vector can be represented as
X = [ X 1 , X 2 , X 3 , X 4 , X 5 , X 6 , X 7 , X 8 , X 9 , X 10 , X 11 , X 12 , X 13 , X 14 , X 15 , X 16 , X 17 , X 13 a , X 14 a , X 15 a , X 16 a , X 17 a , X 18 a , X 19 , X S A C , X S D C , X S P 1 , X S P 2 , X S W 1 , X S W 2 , X S H 1 , X S H 2 , X S W L , X x , X y ]
The structural function (4) for such a system can be represented by [40]
ϕ = ϕ ( X 1 , X 2 , X 3 , X 4 , X 5 , X 6 , X 7 , X 8 , X 9 , X 10 , X 11 , X 12 , X 13 , X 14 , X 15 , X 16 , X S W 2 , X S H 1 , X S H 2 , X S W L , X x , X y ) X S W 2 , X S H 1 , X S H 2 , X S W L , X x , X y )
Depending on the value of individual external events (elements of the external events vector), individual system components may or may not be part of the system being analyzed.
The model is intended to represent various configurations of the components of the power system. Therefore, the model has been expanded to include a number of conditions to allow system configurations to be modeled by adding or removing model parts corresponding to these components. The conditions were fulfilled using external events, and the model includes the following conditions [27]:
  • Condition w1—Does the propeller have a Kort nozzle?
  • Condition w2a—Can the shaft be decoupled?
  • Condition w2bIs the shaft coupled with the engine?
  • Condition w3aIs an AC shaft generator installed?
  • Condition w3b—Is the AC generator coupled?
  • Condition w4aIs the DC shaft generator installed?
  • Condition w4bIs the DC generator coupled?
  • Condition w5aIs the shaft pump no. 1 installed?
  • Condition w5bIs the pump no. 1 coupled?
  • Condition w6aIs the shaft pump no. 2 installed?
  • Condition w6bIs the pump no. 2 coupled?
  • Condition w7aIs the trawl winch driven by the main engine installed?
  • Condition w7bIs the trawl winch hydraulic pump coupled?
  • Condition w7cIs the trawl winch hydraulic motor coupled?
  • Condition w8aIs the net winch driven by SG installed?
  • Condition w8bIs the net winch hydraulic pump coupled?
  • Condition w8cIs the net winch hydraulic motor coupled?
  • Condition w9—Is the electrical trawl winch installed?
  • Condition w10—Is the electrical net winch installed?
System structure changes are modeled using a binary vector of external events [35]:
w = [ w 1 , w 2 a , w 2 b , w 3 a , w 3 b , w 4 a , w 4 b , w 5 a , w 5 b , w 6 a , w 6 b , w 7 a , w 7 b , w 7 c , w 8 a , w 8 b , w 8 c , w 9 , w 10 ]
The structure function (positive notation) of a particular system ϕS depends on the binary state vector of a general system X and the binary external event vector w that models the particular system [27]:
ϕ S = ψ ( ϕ , w ) = f ( X , w )
Therefore, the presented system is characterized by a reliability structure, in which relevant segments can be either included (wi = 1) or excluded (wi = 0) from the structure depending on the technical solution that is applied to the vessel and its operational state.

2.3. Analysis of the Importance of Components

To demonstrate the use of the general system model to analyze the importance of components during the operation of a system in particular operational states, the Vesely–Fussell measure was estimated [29,44]. It specifies the conditional probability that all components of at least one minimal fault tree cut-set Cij(t), containing the i-th element, will fail at time t, assuming that the system fails at time t. For a system with the structure ϕ [ X ¯ ( t ) ] , the Vesely–Fussell measure is expressed by the following formula [27]:
I i V F ( t ) = Pr { D i ( t ) | ϕ [ X ( t ) ] = 0 } = Pr { D i ( t ) ϕ [ X ( t ) ] = 0 } Pr { ϕ [ X ( t ) ] = 0 }
where D i ( t ) = C i 1 ( t ) C i 2 ( t ) C i m i ( t ) is a set containing at least one minimal cut-set Cij(t) and mi is the number of minimal cut-sets that contain the i-th component.
For a system with n-component parallel structure (primary events connected to the AND gate that directly generates peak events), all components take part in the occurrence of a peak event, thus
D 1 ( t ) = D 2 ( t ) = = D n ( t ) = { ϕ [ X ¯ ( t ) ] = 0 } I V F [ ( i = 1 ) | t ] = I V F [ ( i = 2 ) | t ] = I V F [ ( i = n ) | t ] = 1
In fault tree analyses, the approximate formula is often used in practice to determine the Vesely–Fussell measure of importance for complex technical systems [27]:
I i V F ( t ) j = 1 m i Q ˘ j ( t ) Q 0 ( t )
where Q ˘ j ( t ) is the unavailability of the j-th minimal cut-set containing the i-th component and Q0(t) is the unavailability of the system.

3. Results and Discussion

3.1. System Reliability Structure

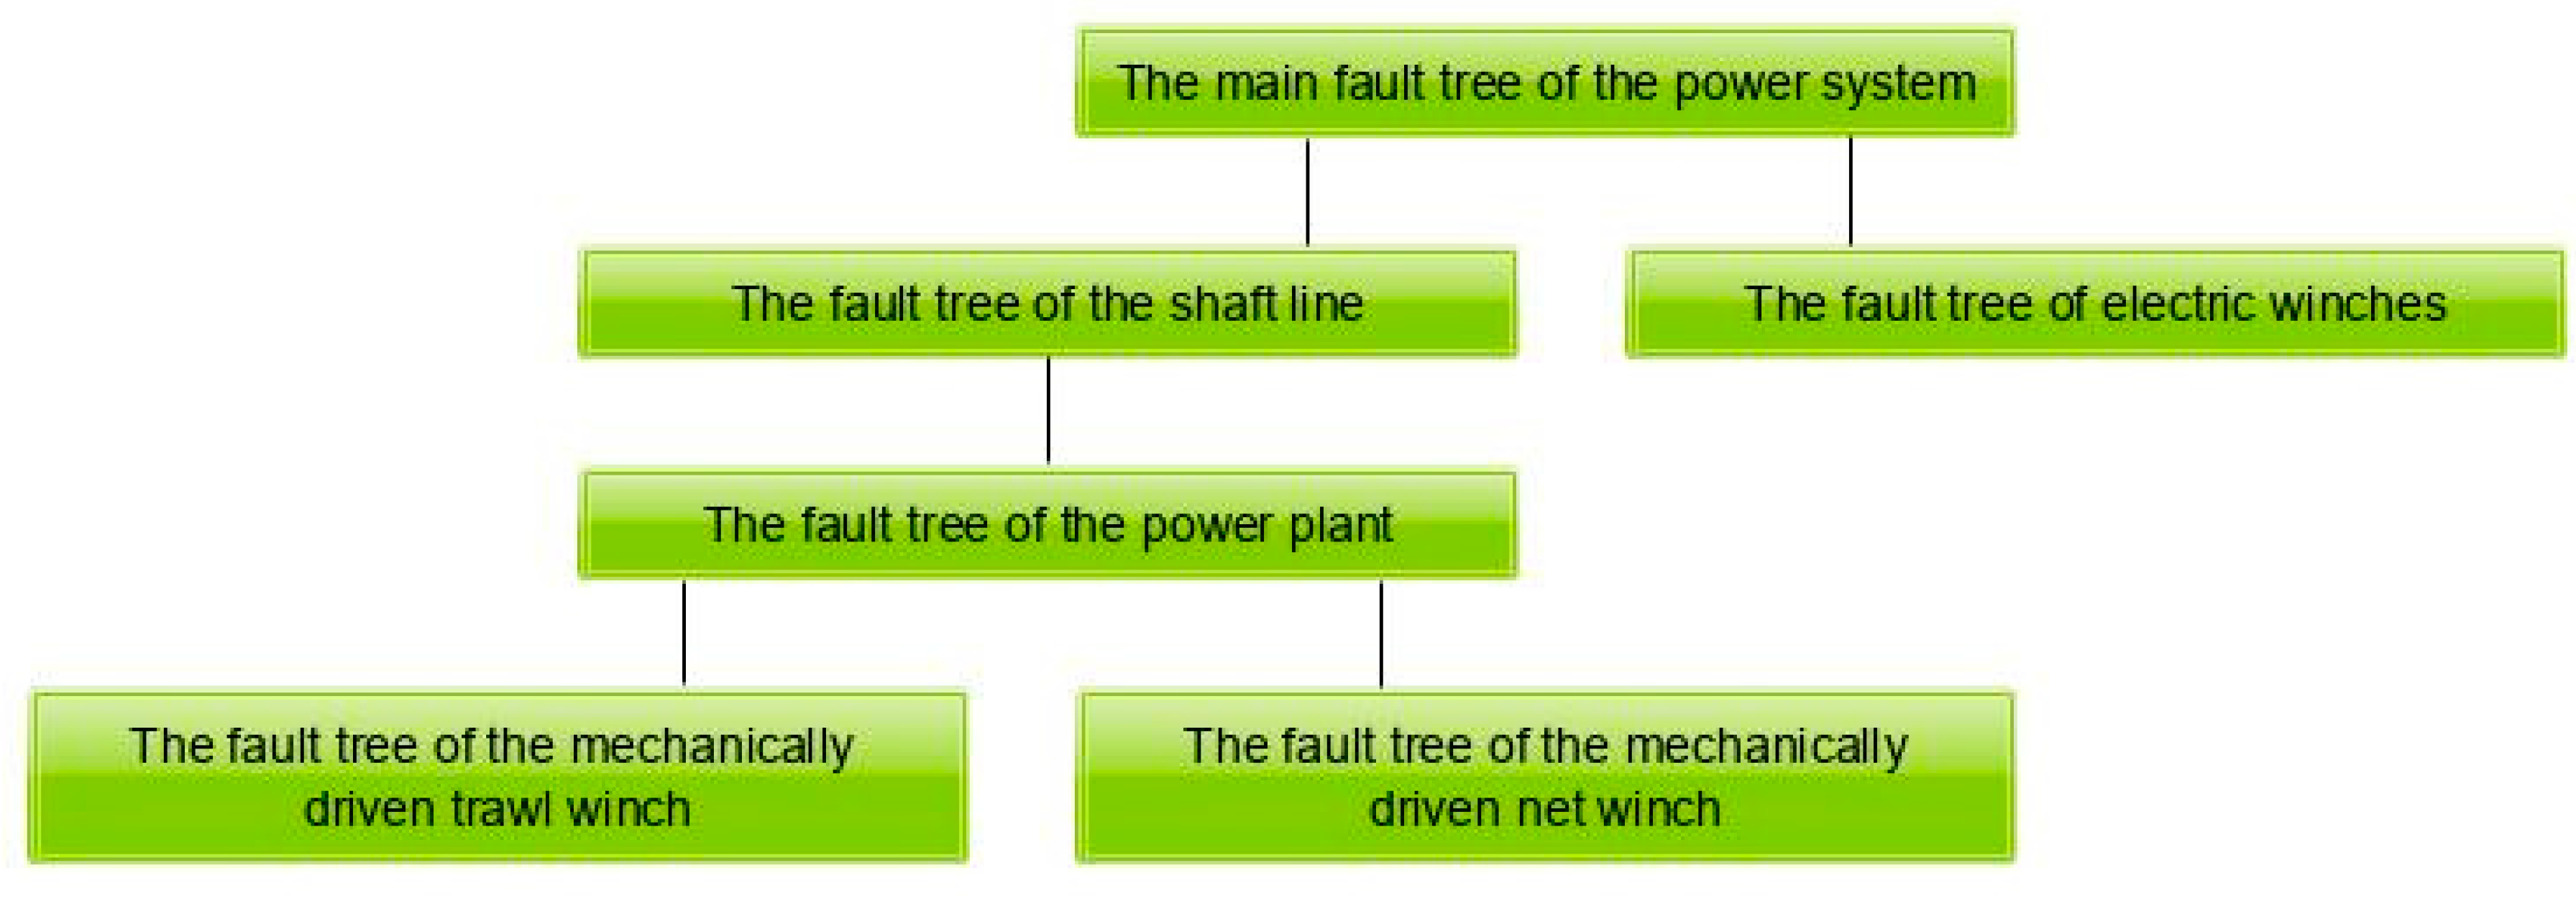
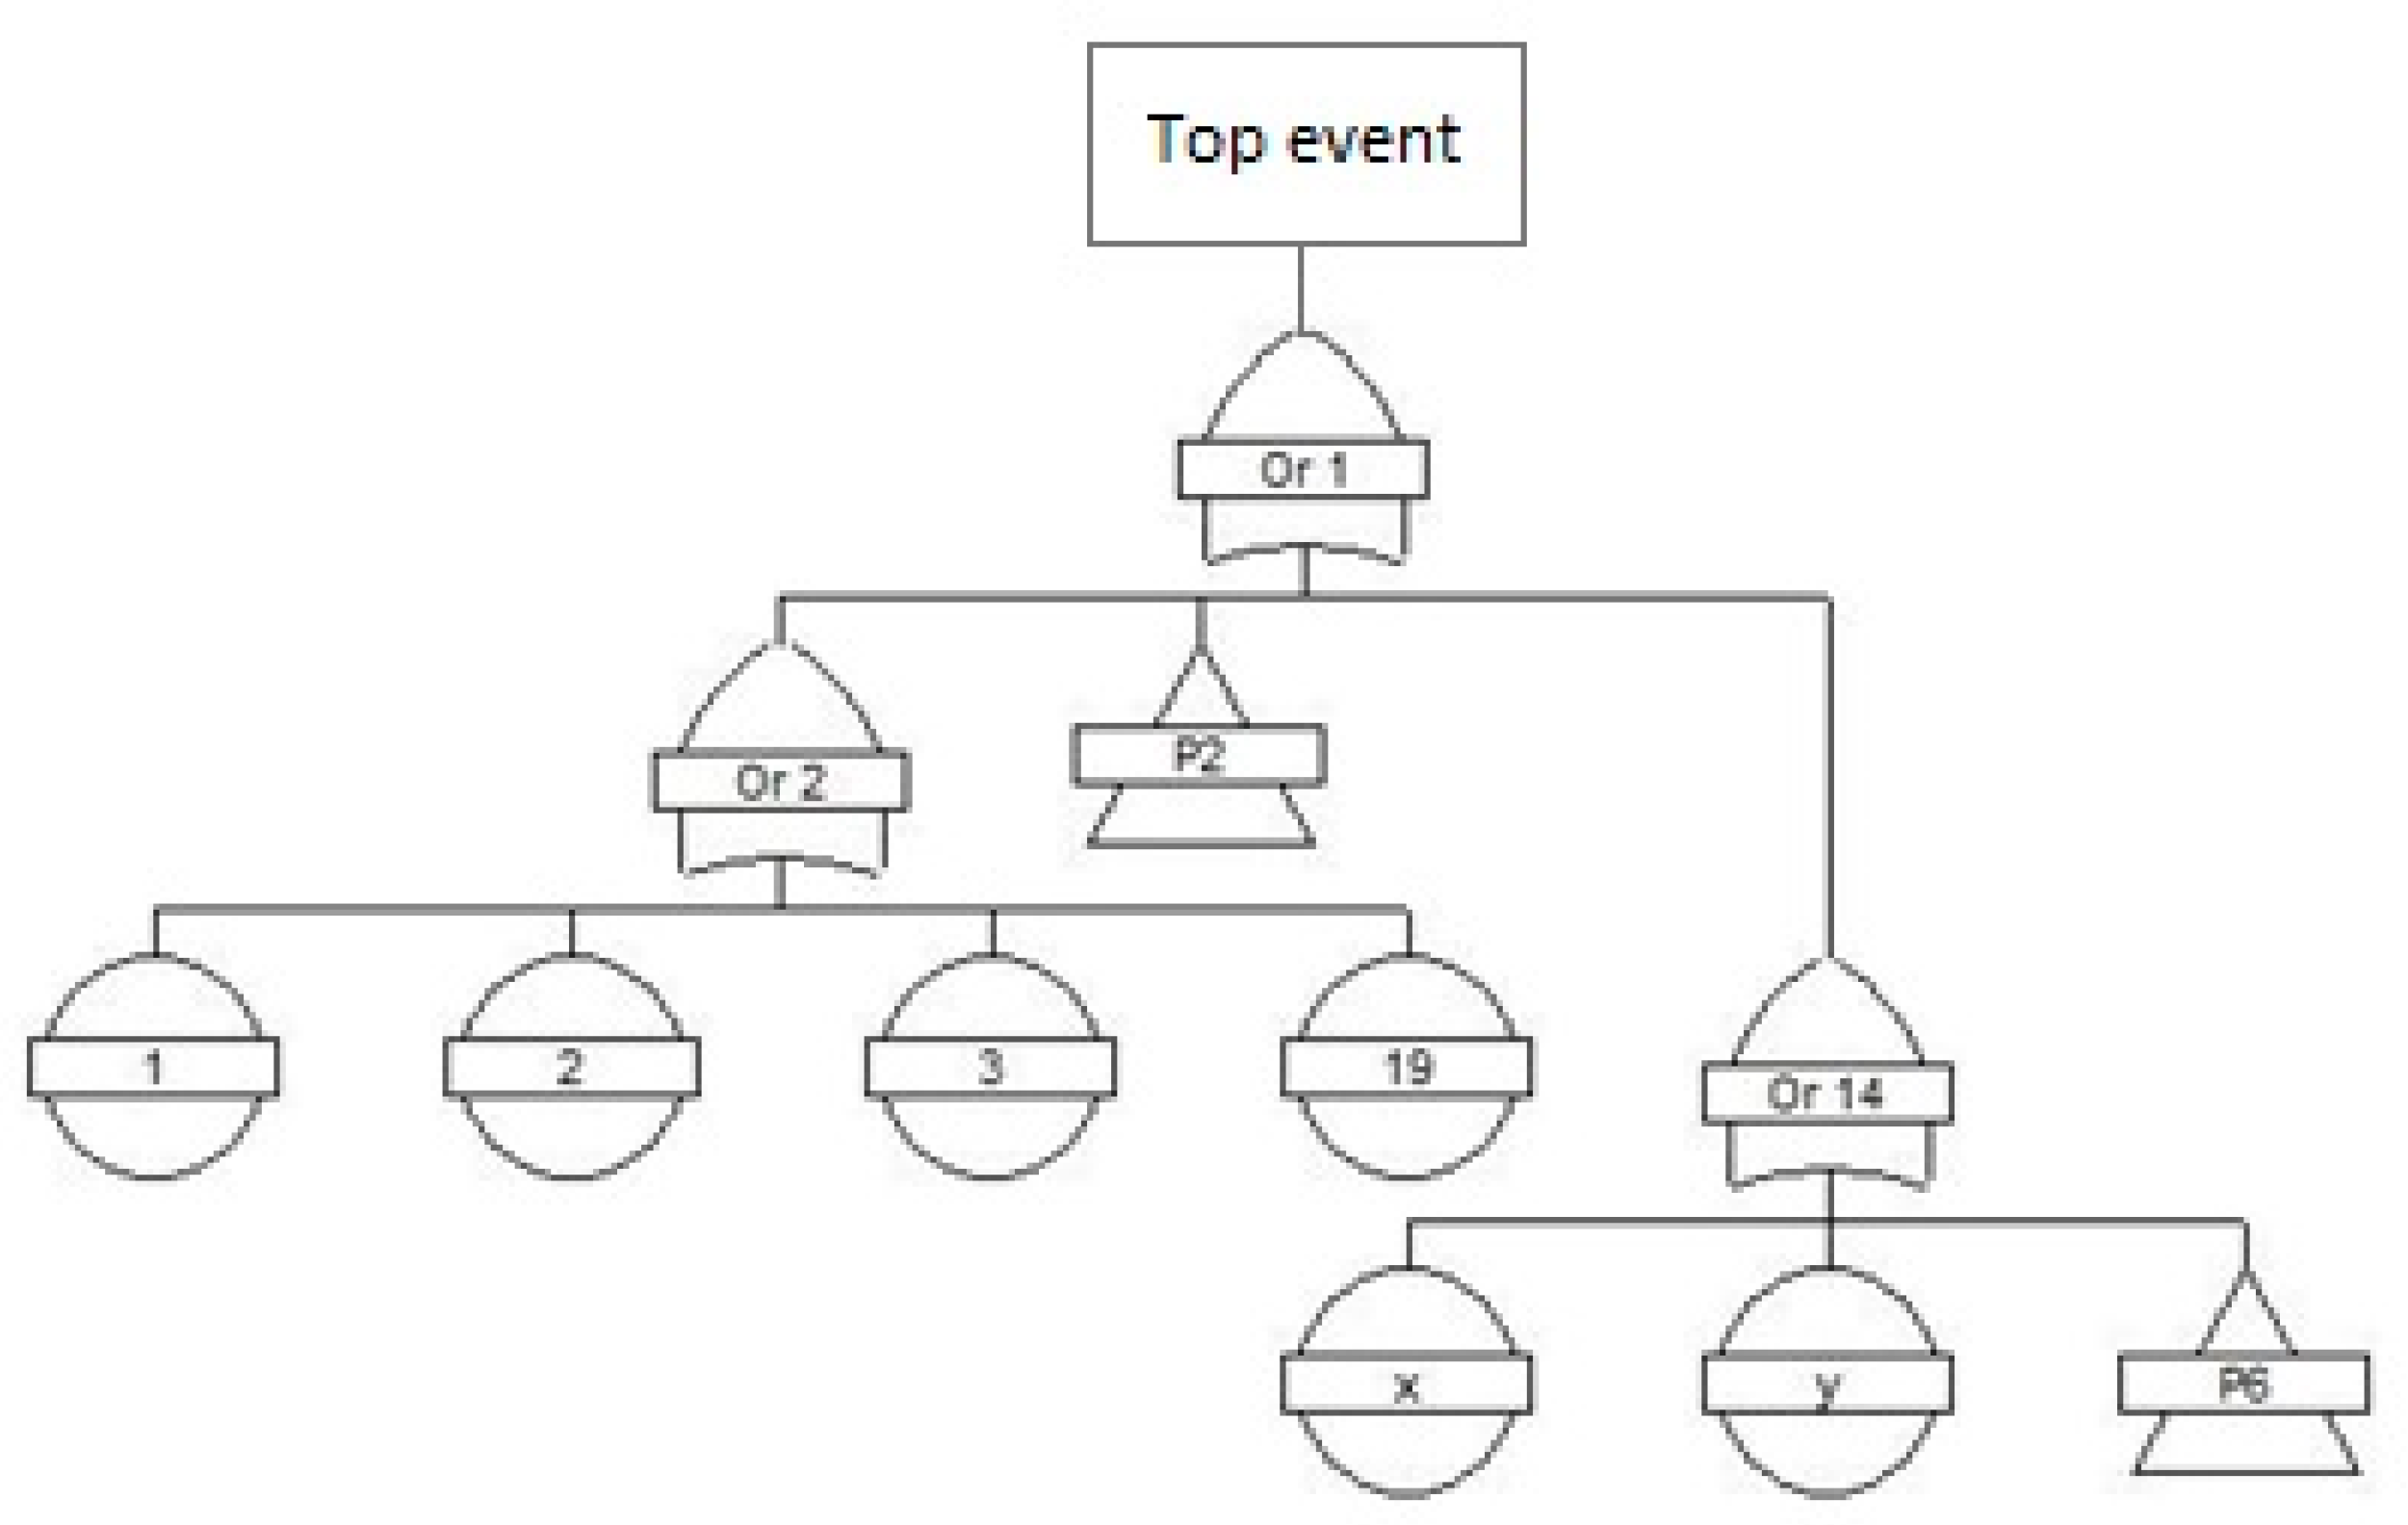
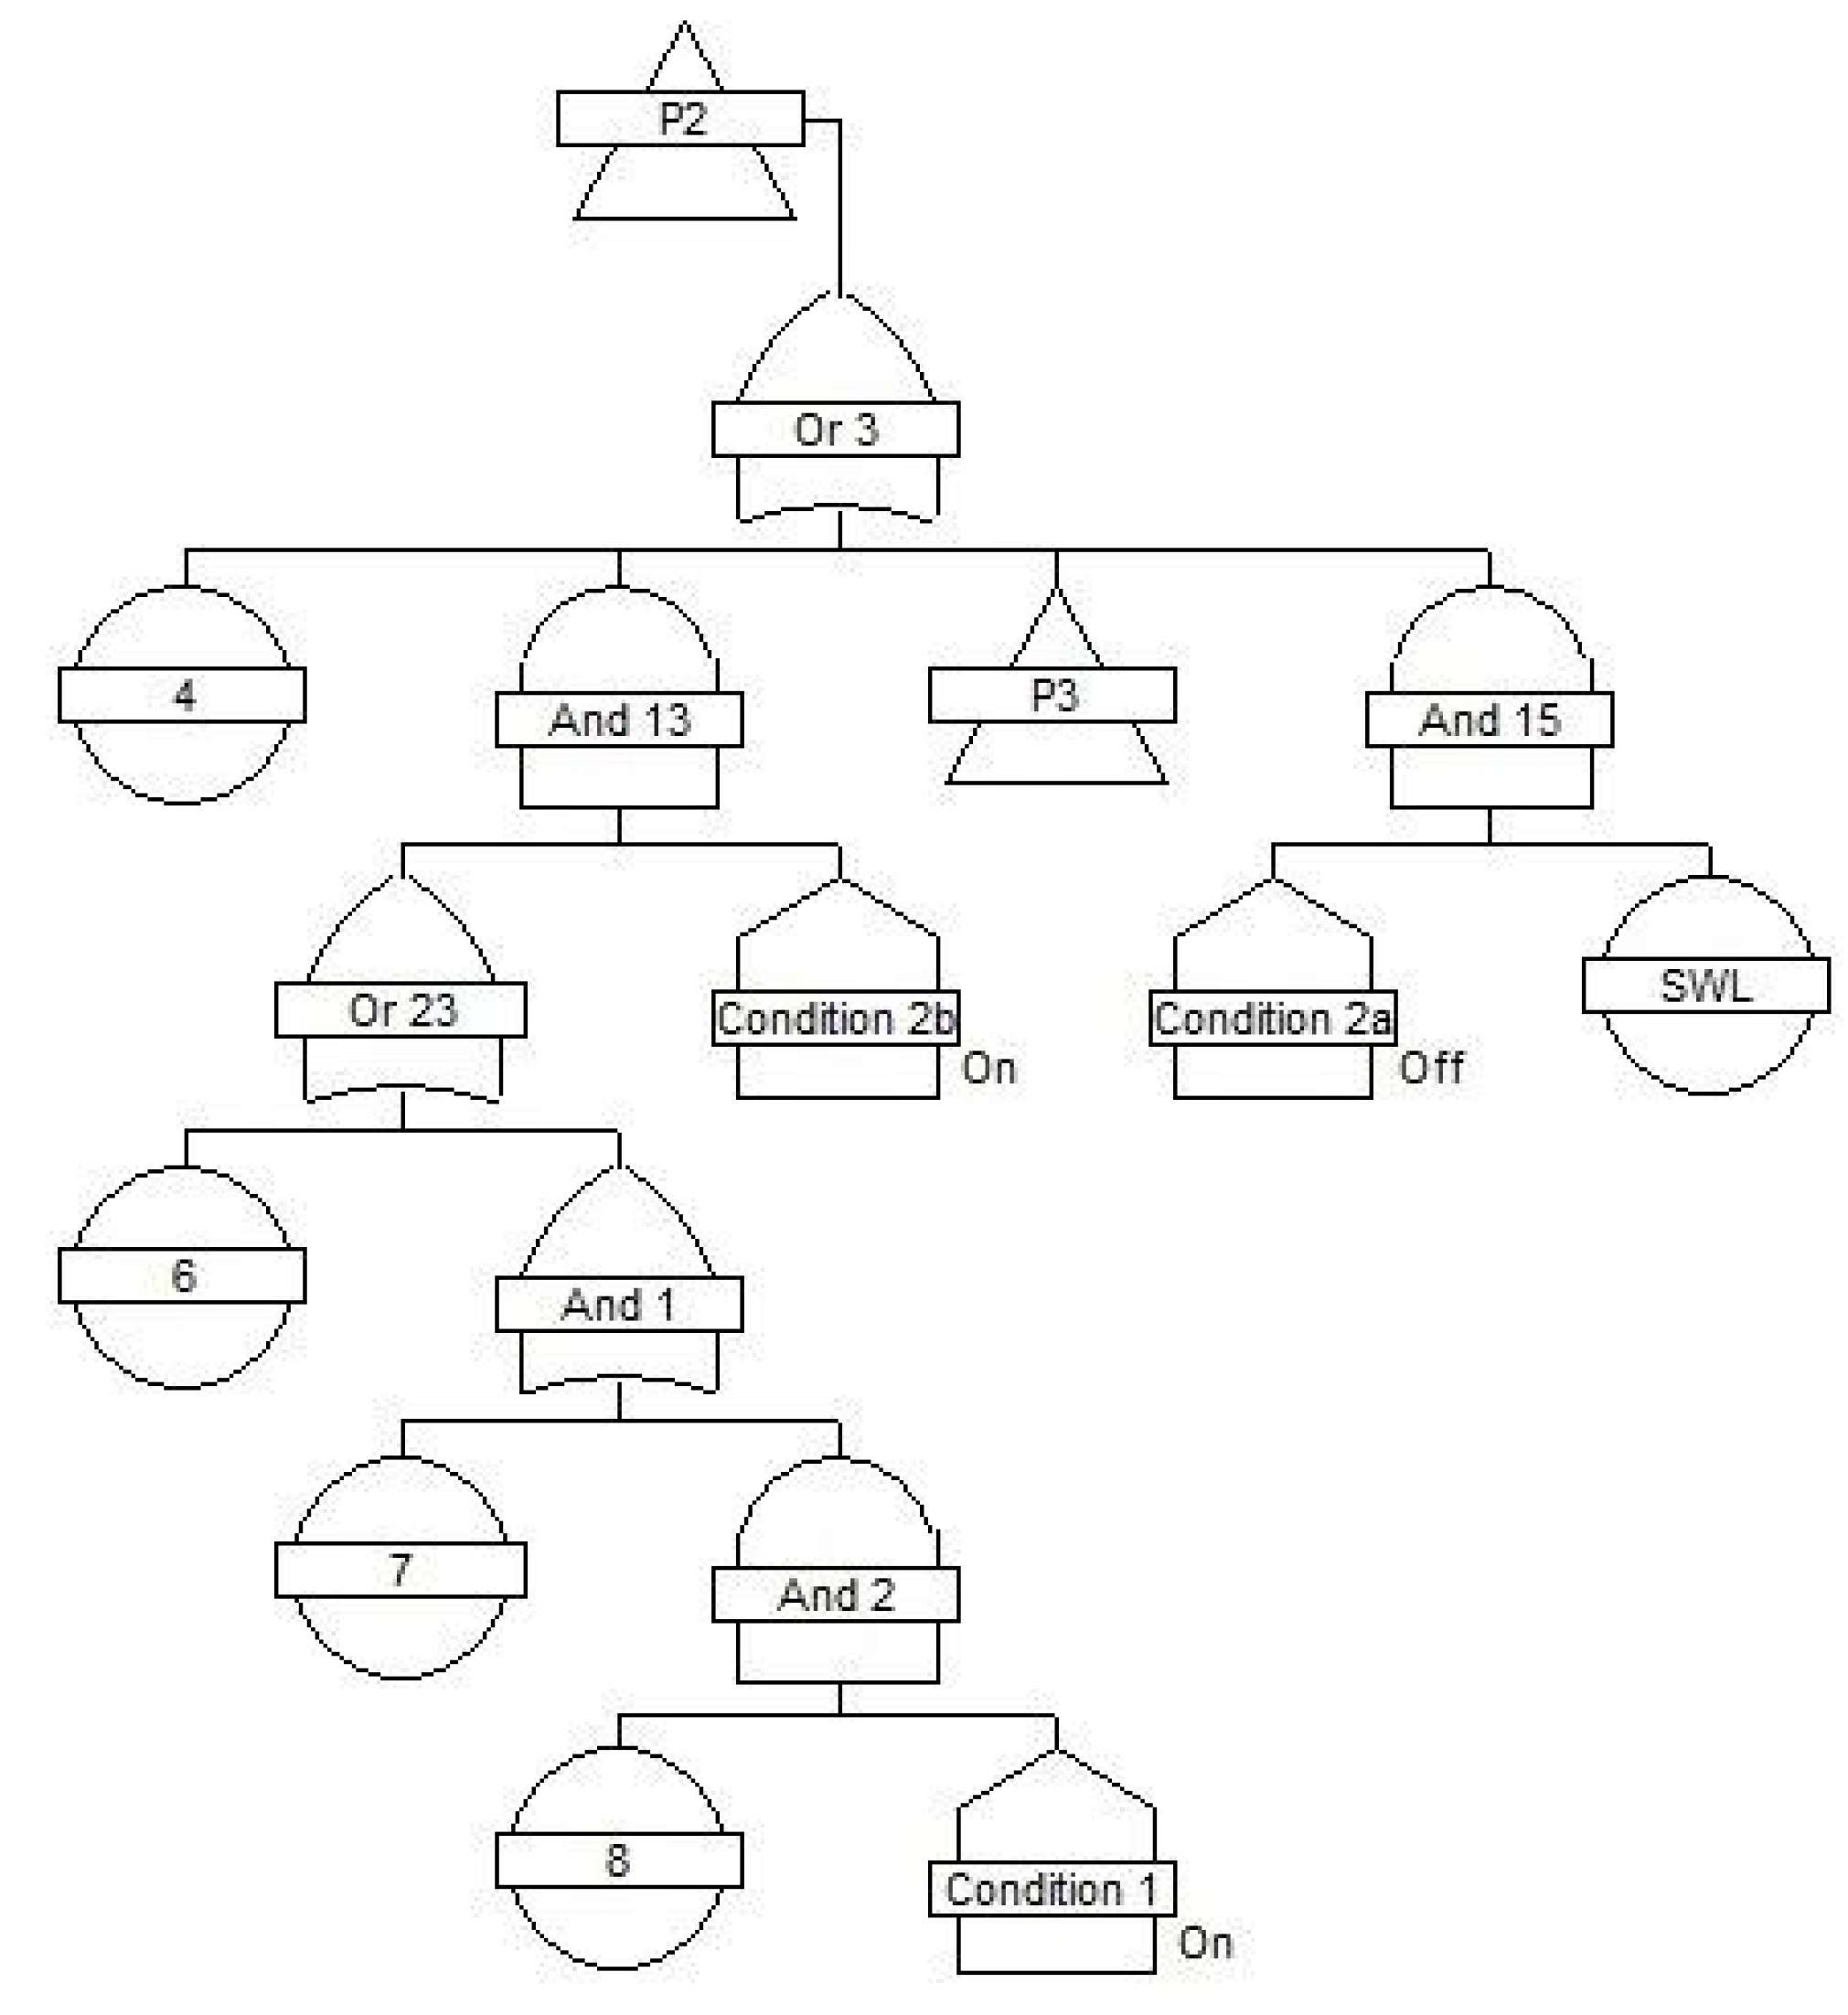
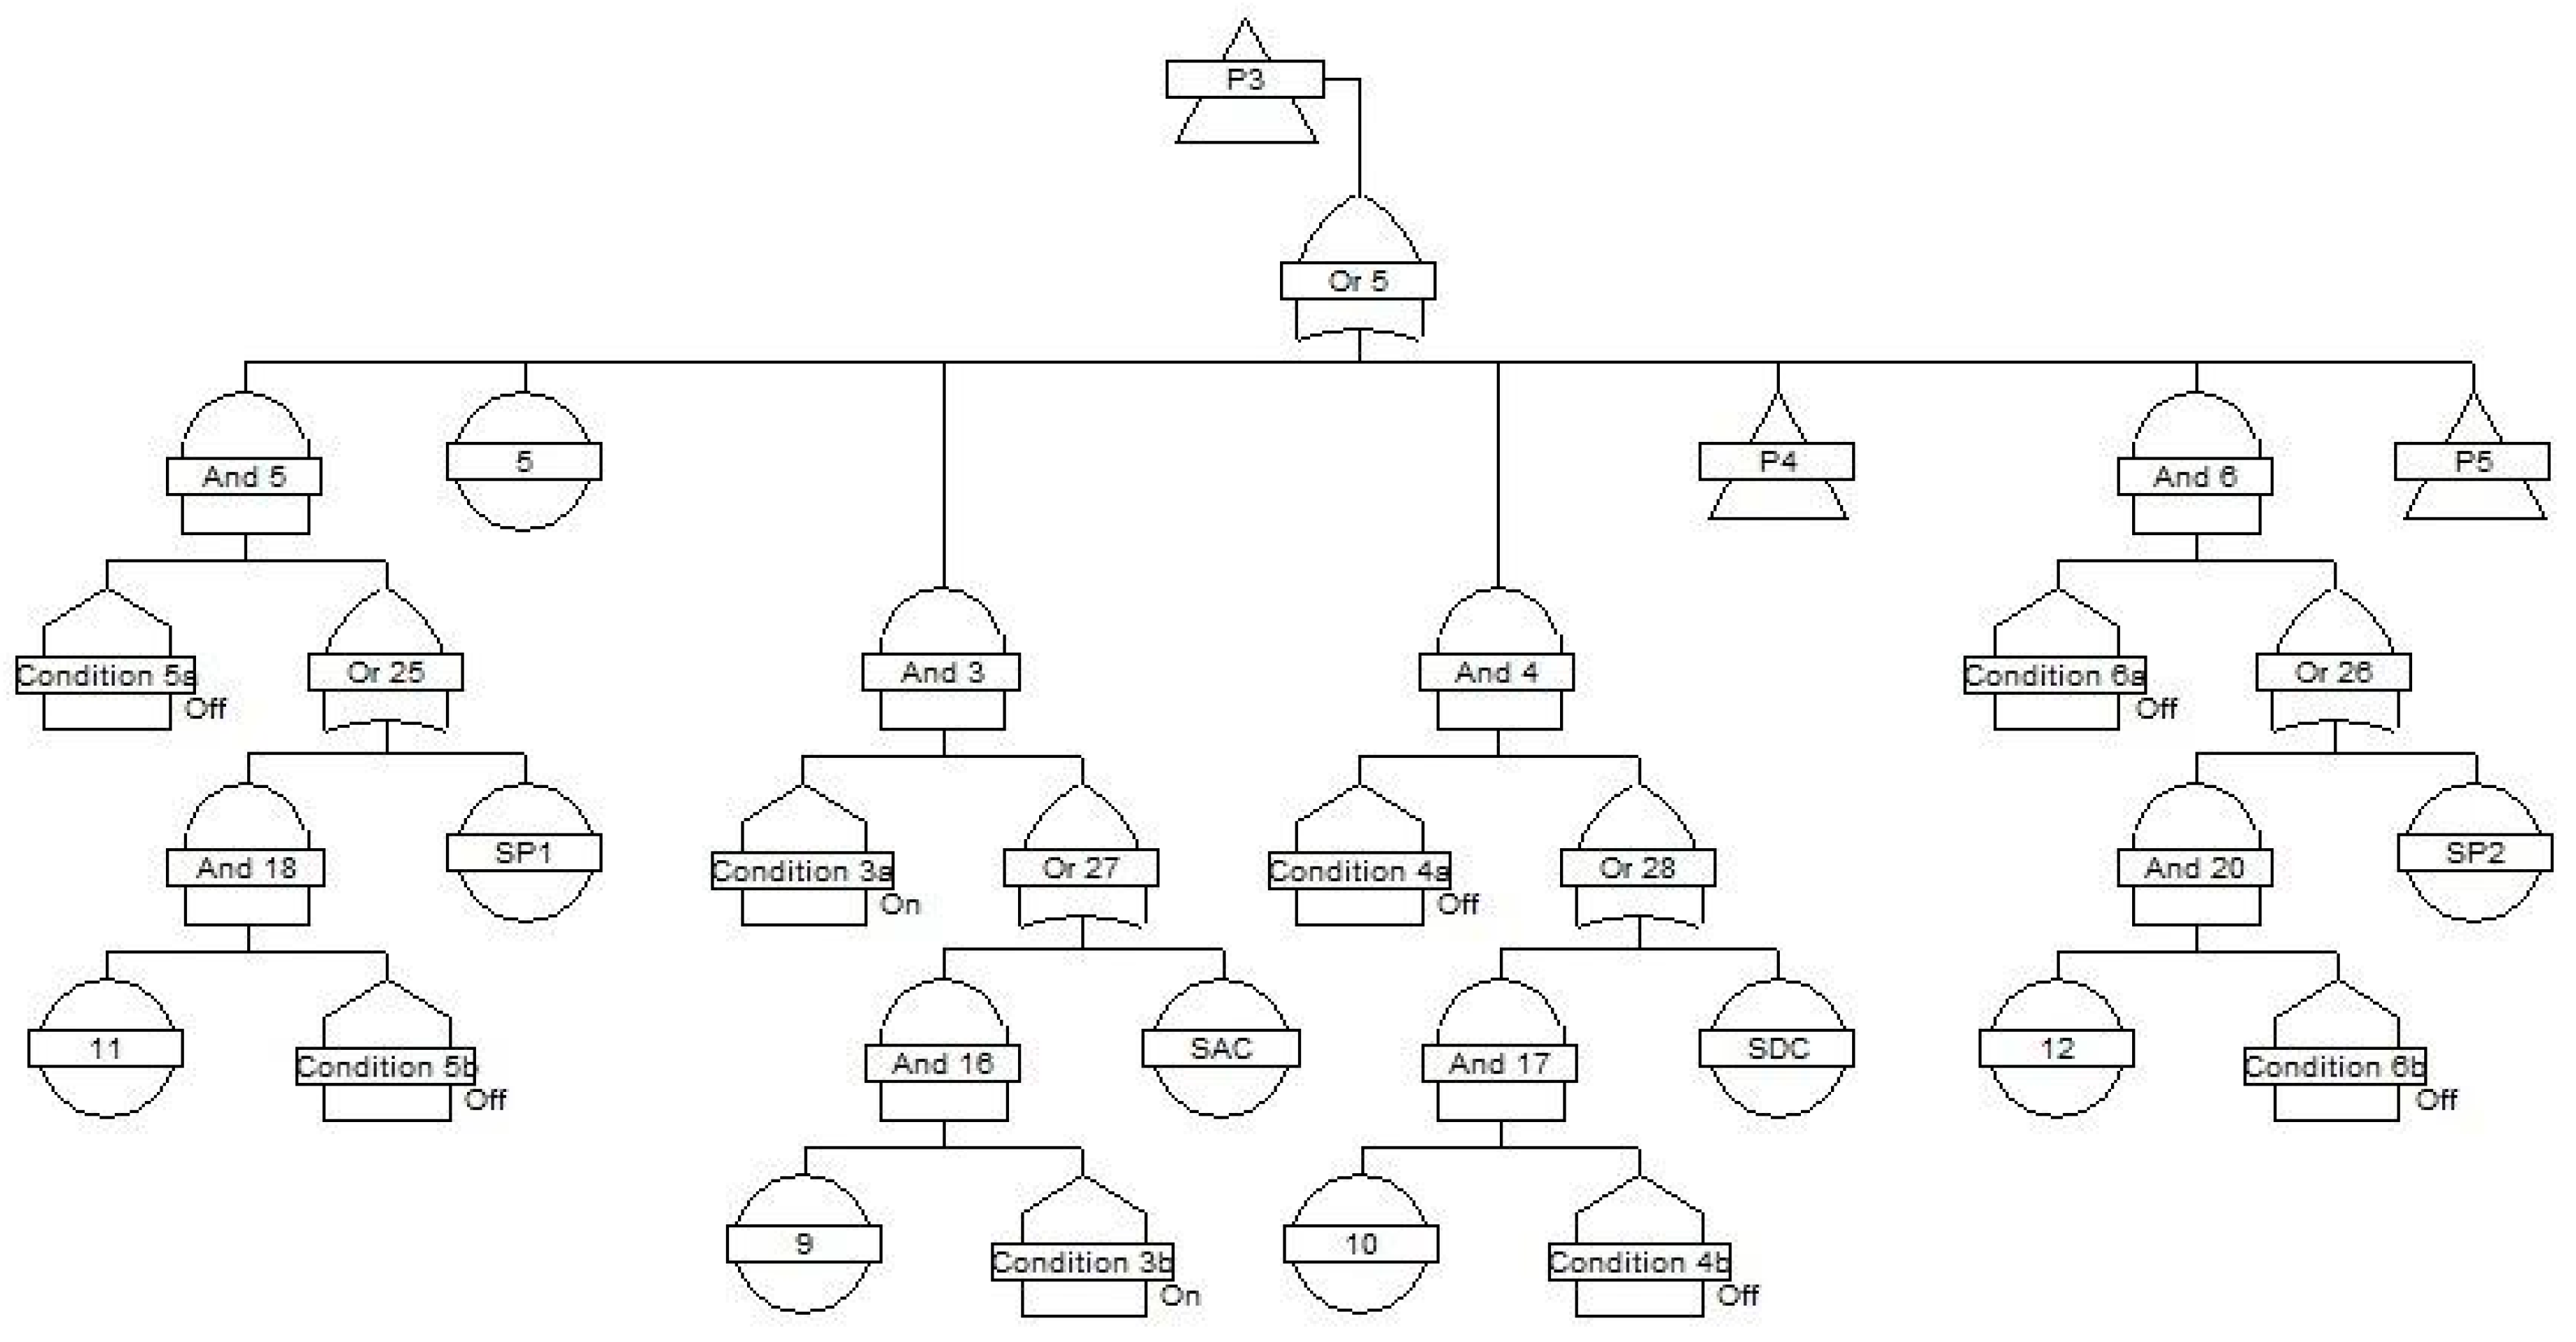
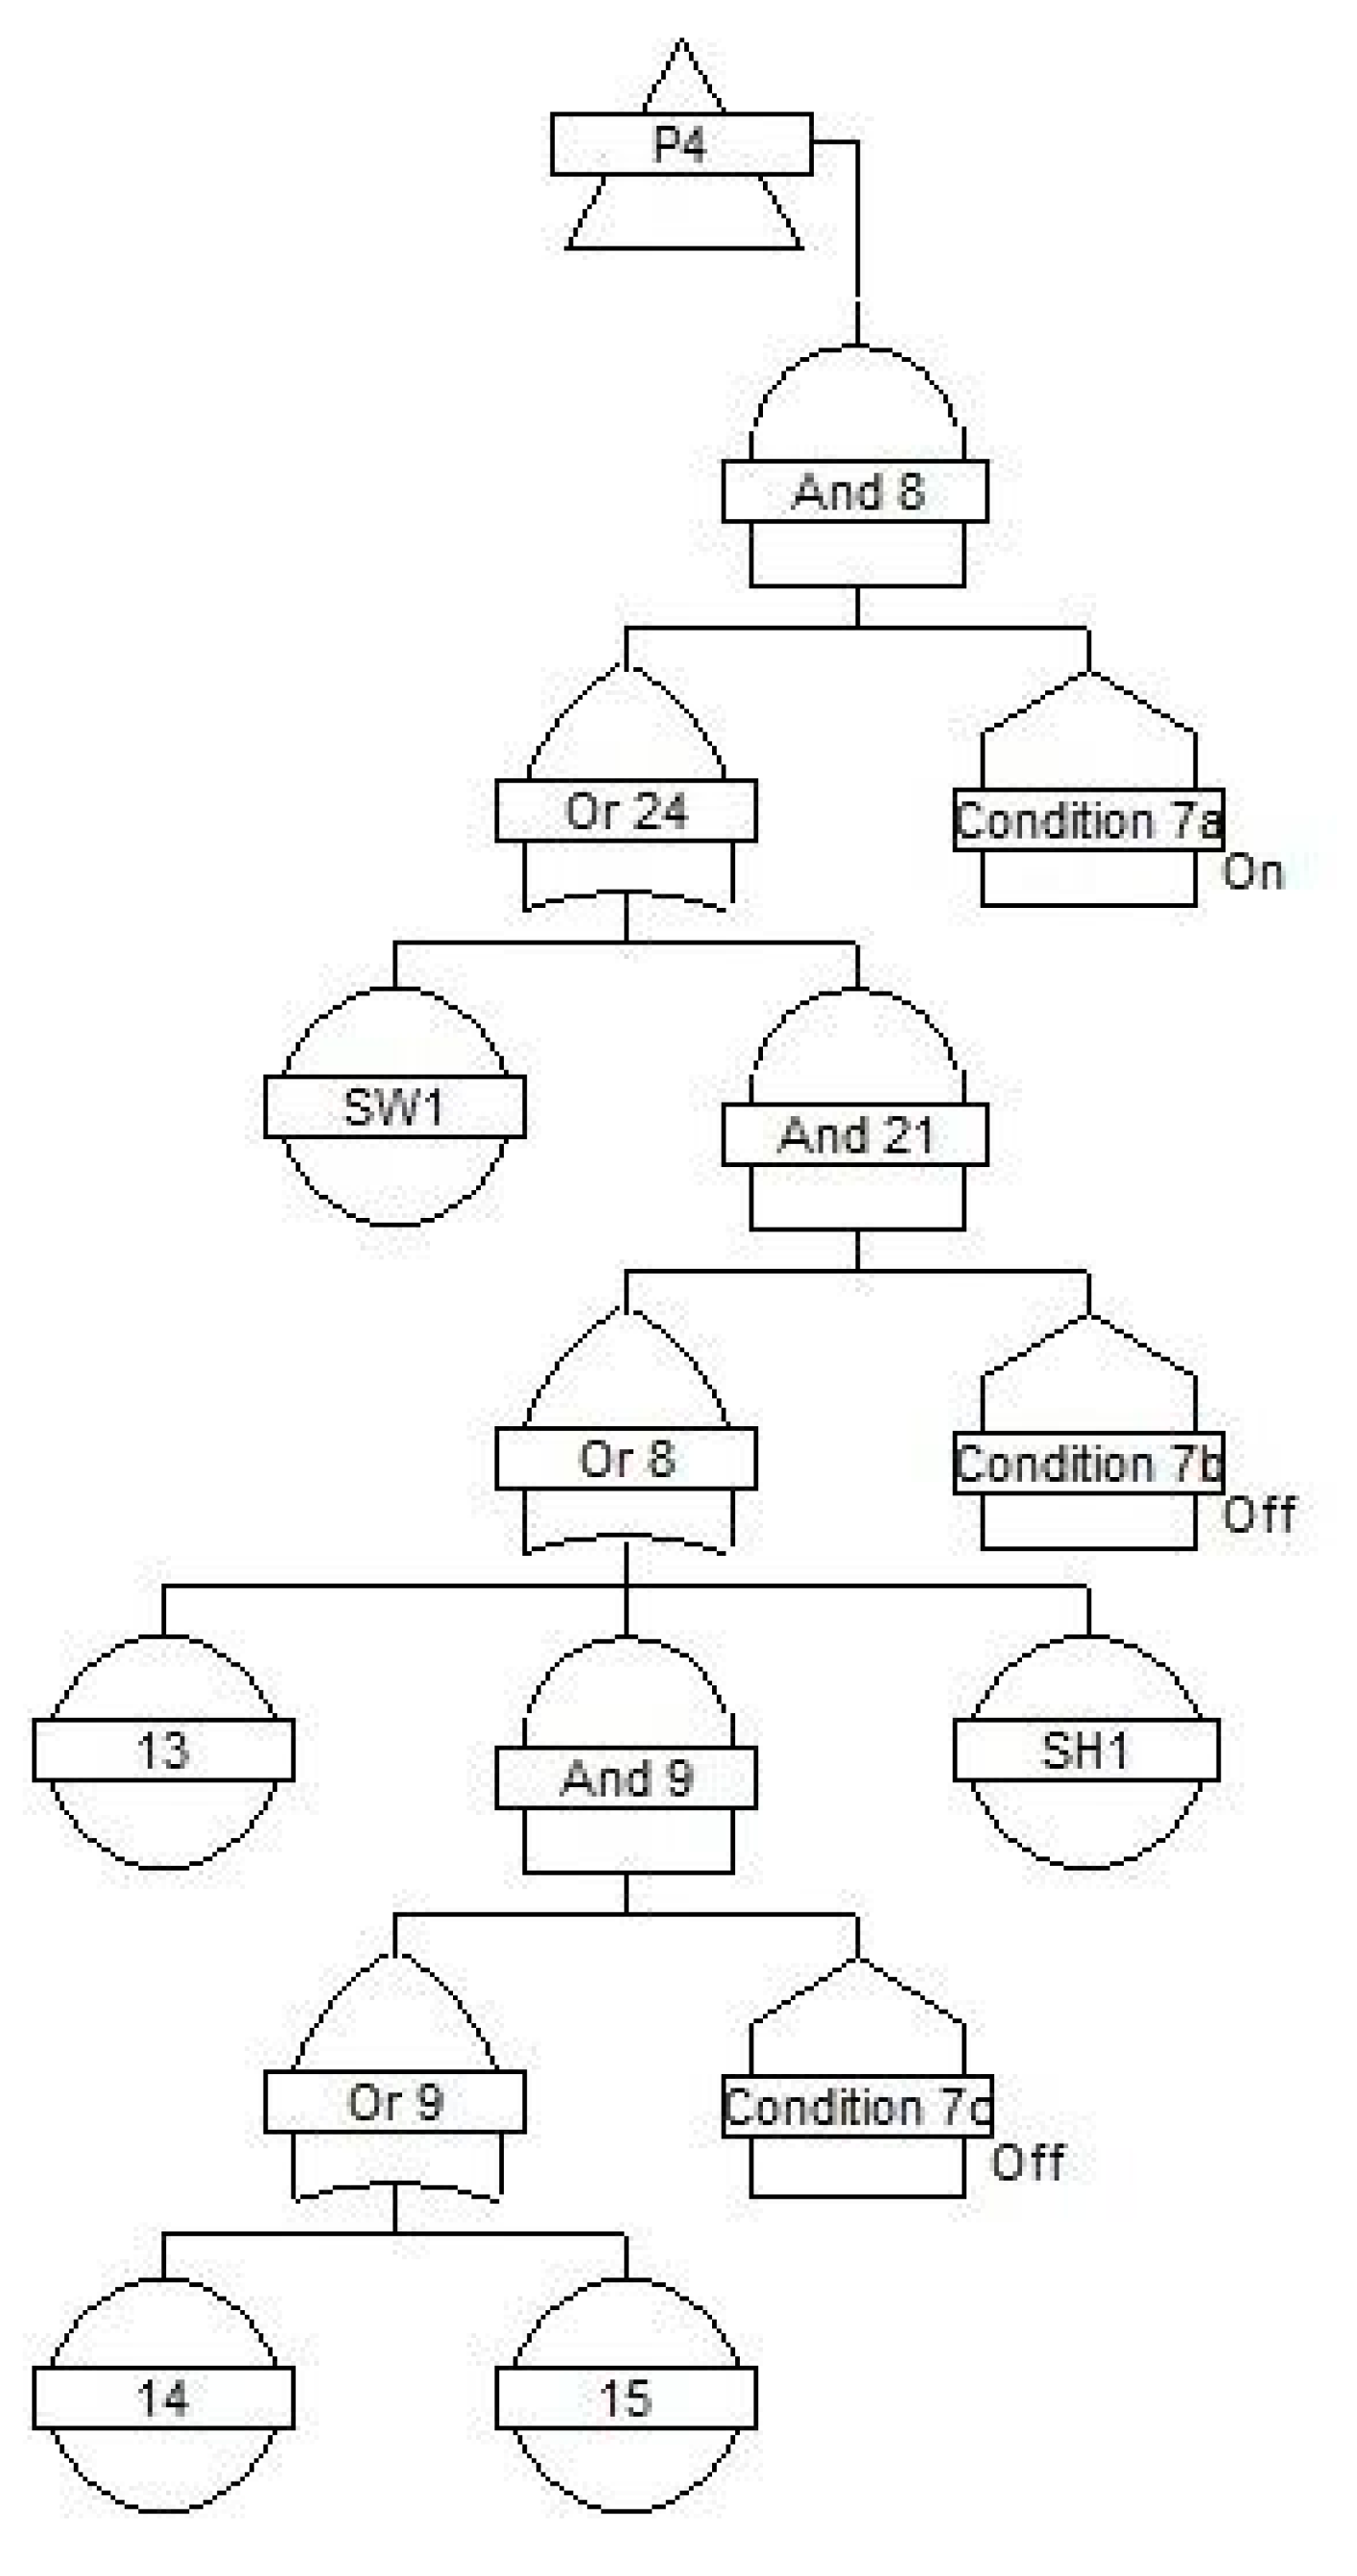
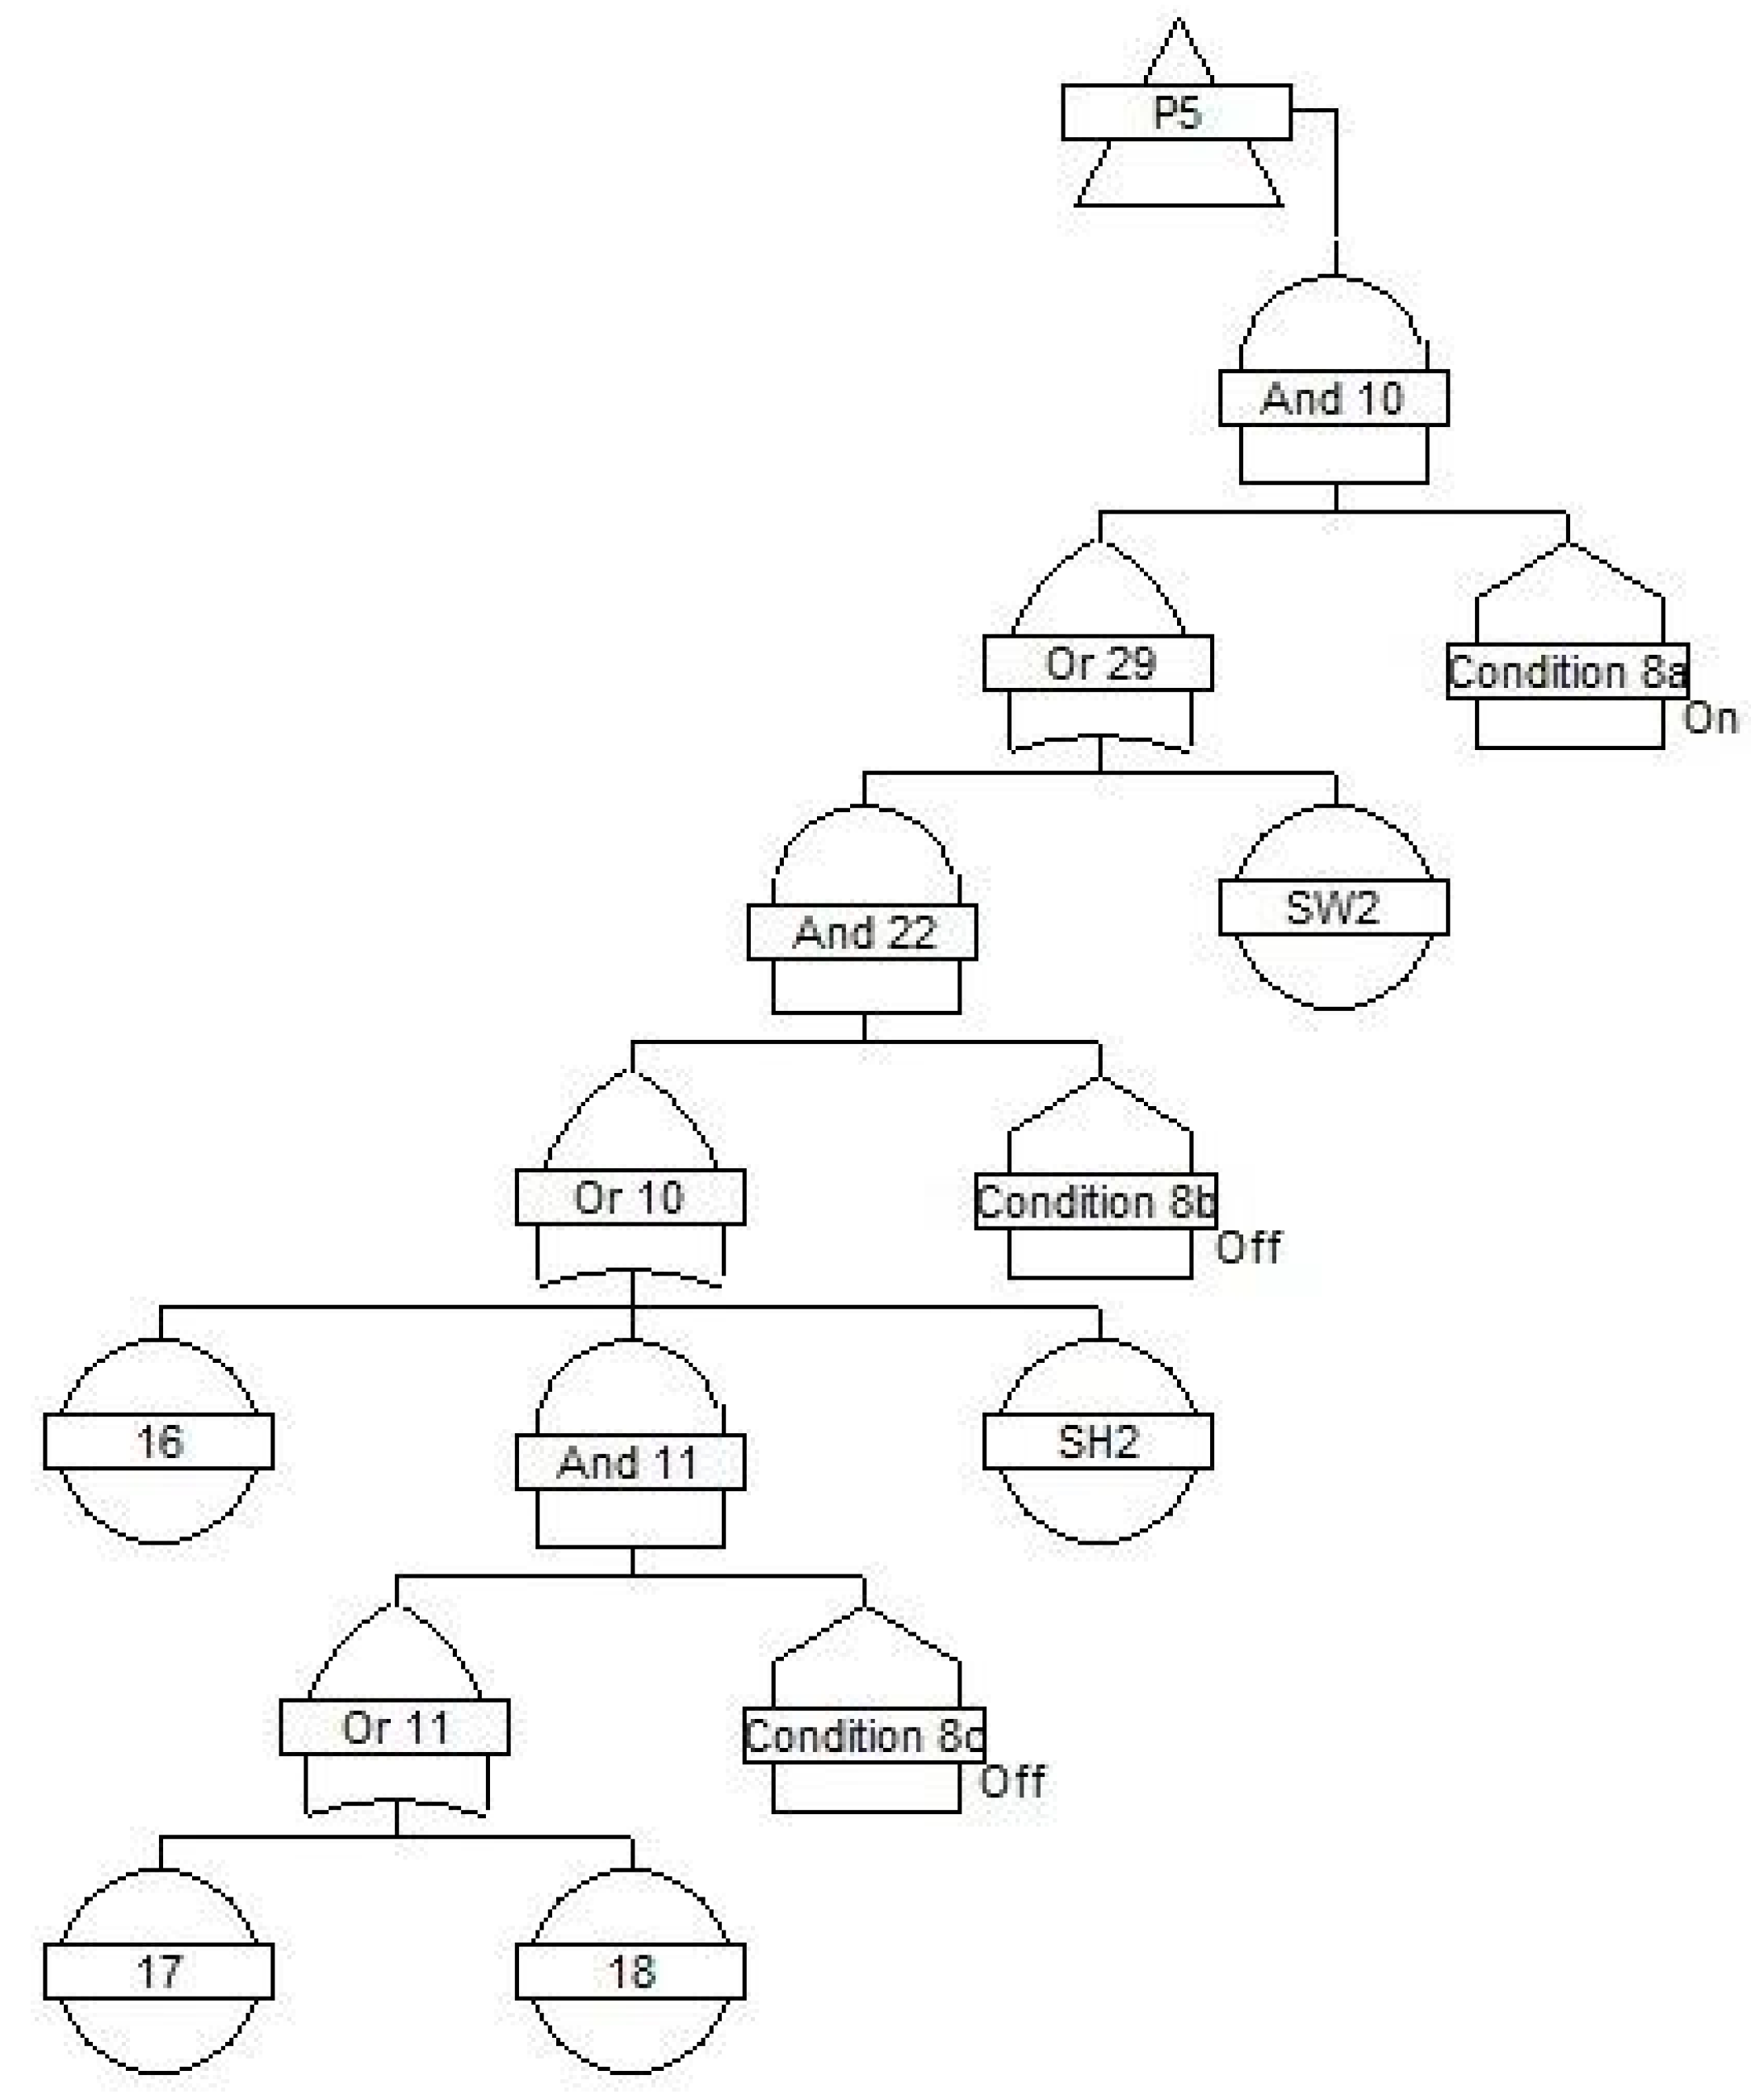
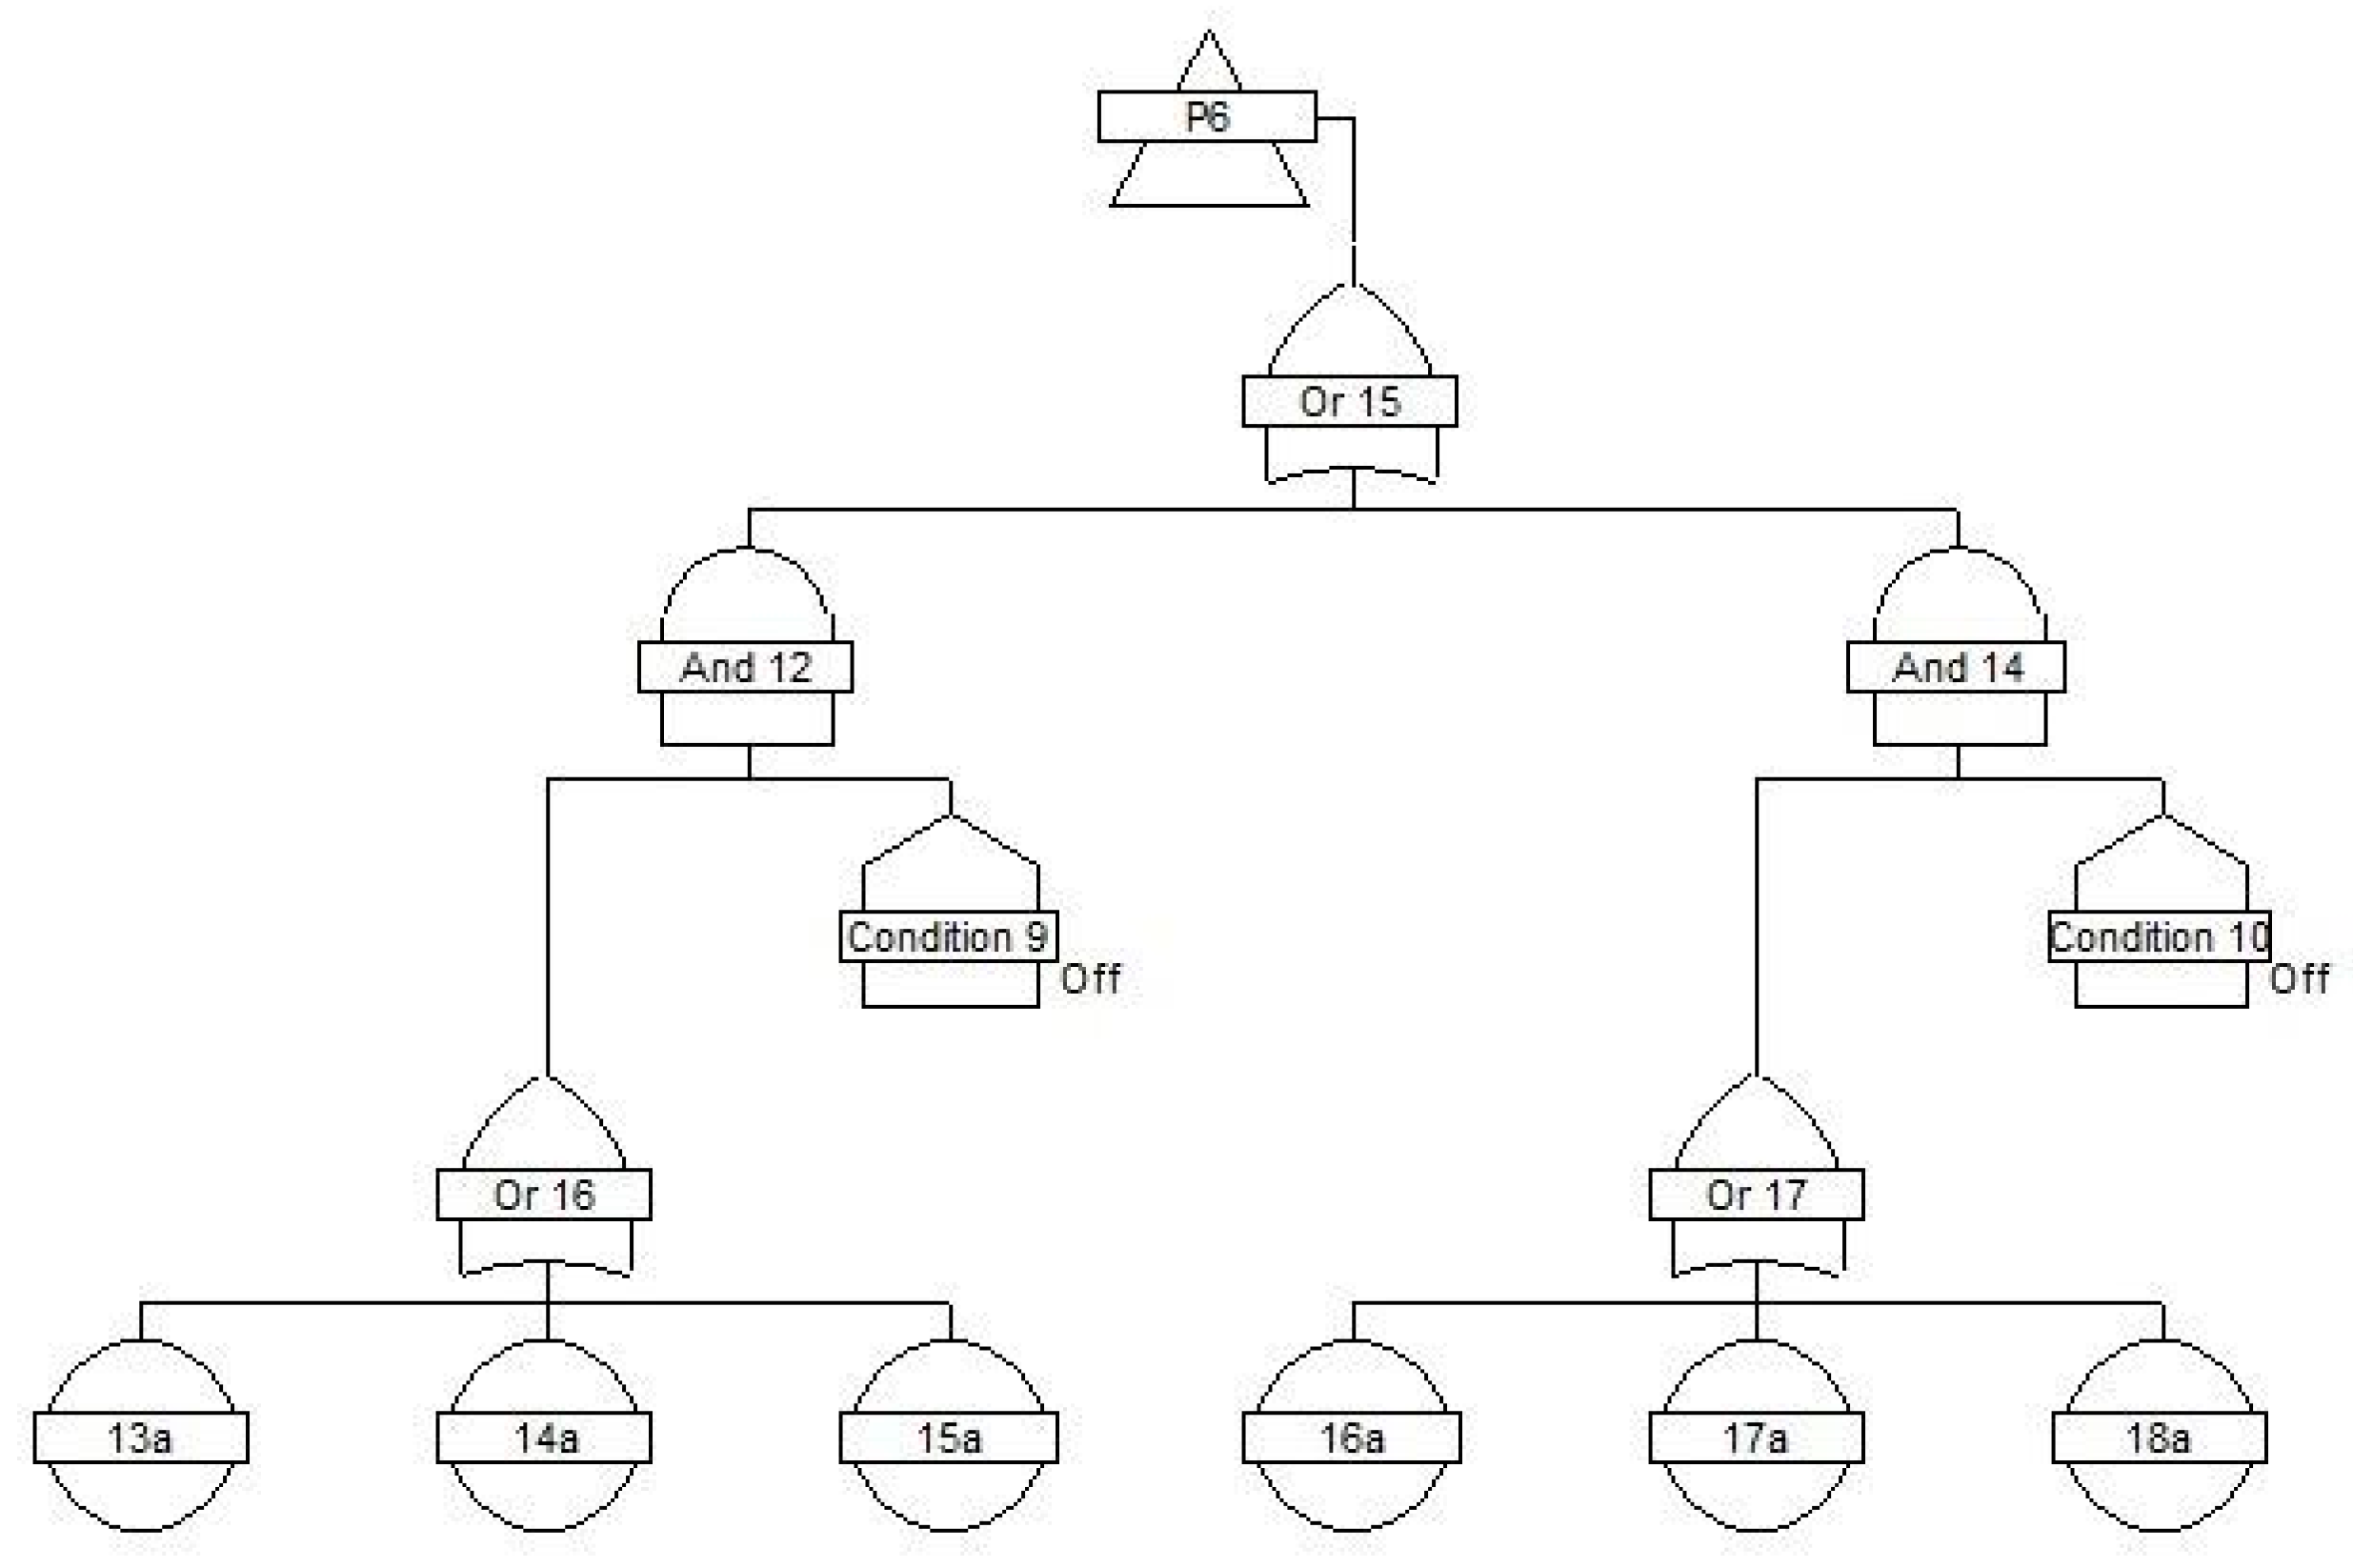
The reliability structure of these systems has been modeled in the form of fault trees. Interconnections between models are presented in Figure 3. The individual subtrees of the main fault tree are shown in Figure 4, Figure 5, Figure 6, Figure 7, Figure 8 and Figure 9. Conditional events (Condition XX) describe the state of the system (value of given condition in the external event vector (7)).
The operational state of an object is described by a set of values of operational features which indicates the probability that this object will operate as intended. Depending on the operational state of each seagoing vessel, the power system changes its structure by including or excluding certain components of its serial reliability structure. For example, for the fishing vessels presented with the power system, the basic operational states are sea voyage, paying out nets, hauling in nets, trawl fishing, heaving to, and staying in a port. Each operational state corresponds to a serial reliability structure of the system composed of other components. Individual reliability structures have been modeled with external event vectors w [35].
For each operational state, importance analysis of reliability was carried out, aimed at identifying the components that are most likely to contribute to a system fault (down state).

3.2. System Components Importance during Sea Voyage

During a sea voyage, when the vessel moves between fisheries or ports, all system components except for the trawl and net winches are in operation. The fault state of these winches does not limit the functionality of the vessel. For a sea voyage, depending on the number of installed trawls and net winches, the structure may vary slightly due to the possibility or impossibility of couplings being faulty.
For a running main engine that drives, through a transmission, a nondisengaging propeller drive shaft, a fixed- or adjustable-pitch propeller with a Kort nozzle, an AC shaft generator in a coupled position, decoupled shaft pumps and shaft winches in the system, and noninstalled or switched-off electrical winches, the vector w of conditional events takes the form [40]:
w = [ w 1 , 0 , w 2 b , w 3 a , w 3 b , 0 , 0 , 0 , 0 , 0 , 0 , w 7 a , 0 , 0 , w 8 a , 0 , 0 , 0 , 0 ] = [ 1 , 0 , 1 , 1 , 1 , 0 , 0 , 0 , 0 , 0 , 0 , 1 , 0 , 0 , 1 , 0 , 0 , 0 , 0 ]
In the above case, for a power system without a Kort nozzle, the vector will take the following form [41]:
w = [ 0 , 0 , w 2 b , w 3 a , w 3 b , 0 , 0 , 0 , 0 , 0 , 0 , w 7 a , 0 , 0 , w 8 a , 0 , 0 , 0 , 0 ] = [ 0 , 0 , 1 , 1 , 1 , 0 , 0 , 0 , 0 , 0 , 0 , 1 , 0 , 0 , 1 , 0 , 0 , 0 , 0 ]
In the case of the drive shaft capable of being decoupled from its driving unit, that is, the main propulsion engine, the vectors (12) and (13) take their respective forms [27]:
w = [ w 1 , w 2 a , w 2 b , w 3 a , w 3 b , 0 , 0 , 0 , 0 , 0 , 0 , w 7 a , 0 , 0 , w 8 a , 0 , 0 , 0 , 0 ] = [ 1 , 1 , 1 , 1 , 1 , 0 , 0 , 0 , 0 , 0 , 0 , 1 , 0 , 0 , 1 , 0 , 0 , 0 , 0 ]
w = [ 0 , w 2 a , w 2 b , w 3 a , w 3 b , 0 , 0 , 0 , 0 , 0 , 0 , w 7 a , 0 , 0 , w 8 a , 0 , 0 , 0 , 0 ] = [ 0 , 1 , 1 , 1 , 1 , 0 , 0 , 0 , 0 , 0 , 0 , 1 , 0 , 0 , 1 , 0 , 0 , 0 , 0 ]
The screw propeller type (fixed or variable pitch) does not affect the structure change. Only appropriate measures describing the availability or reliability of a propeller are changed as they show different values.
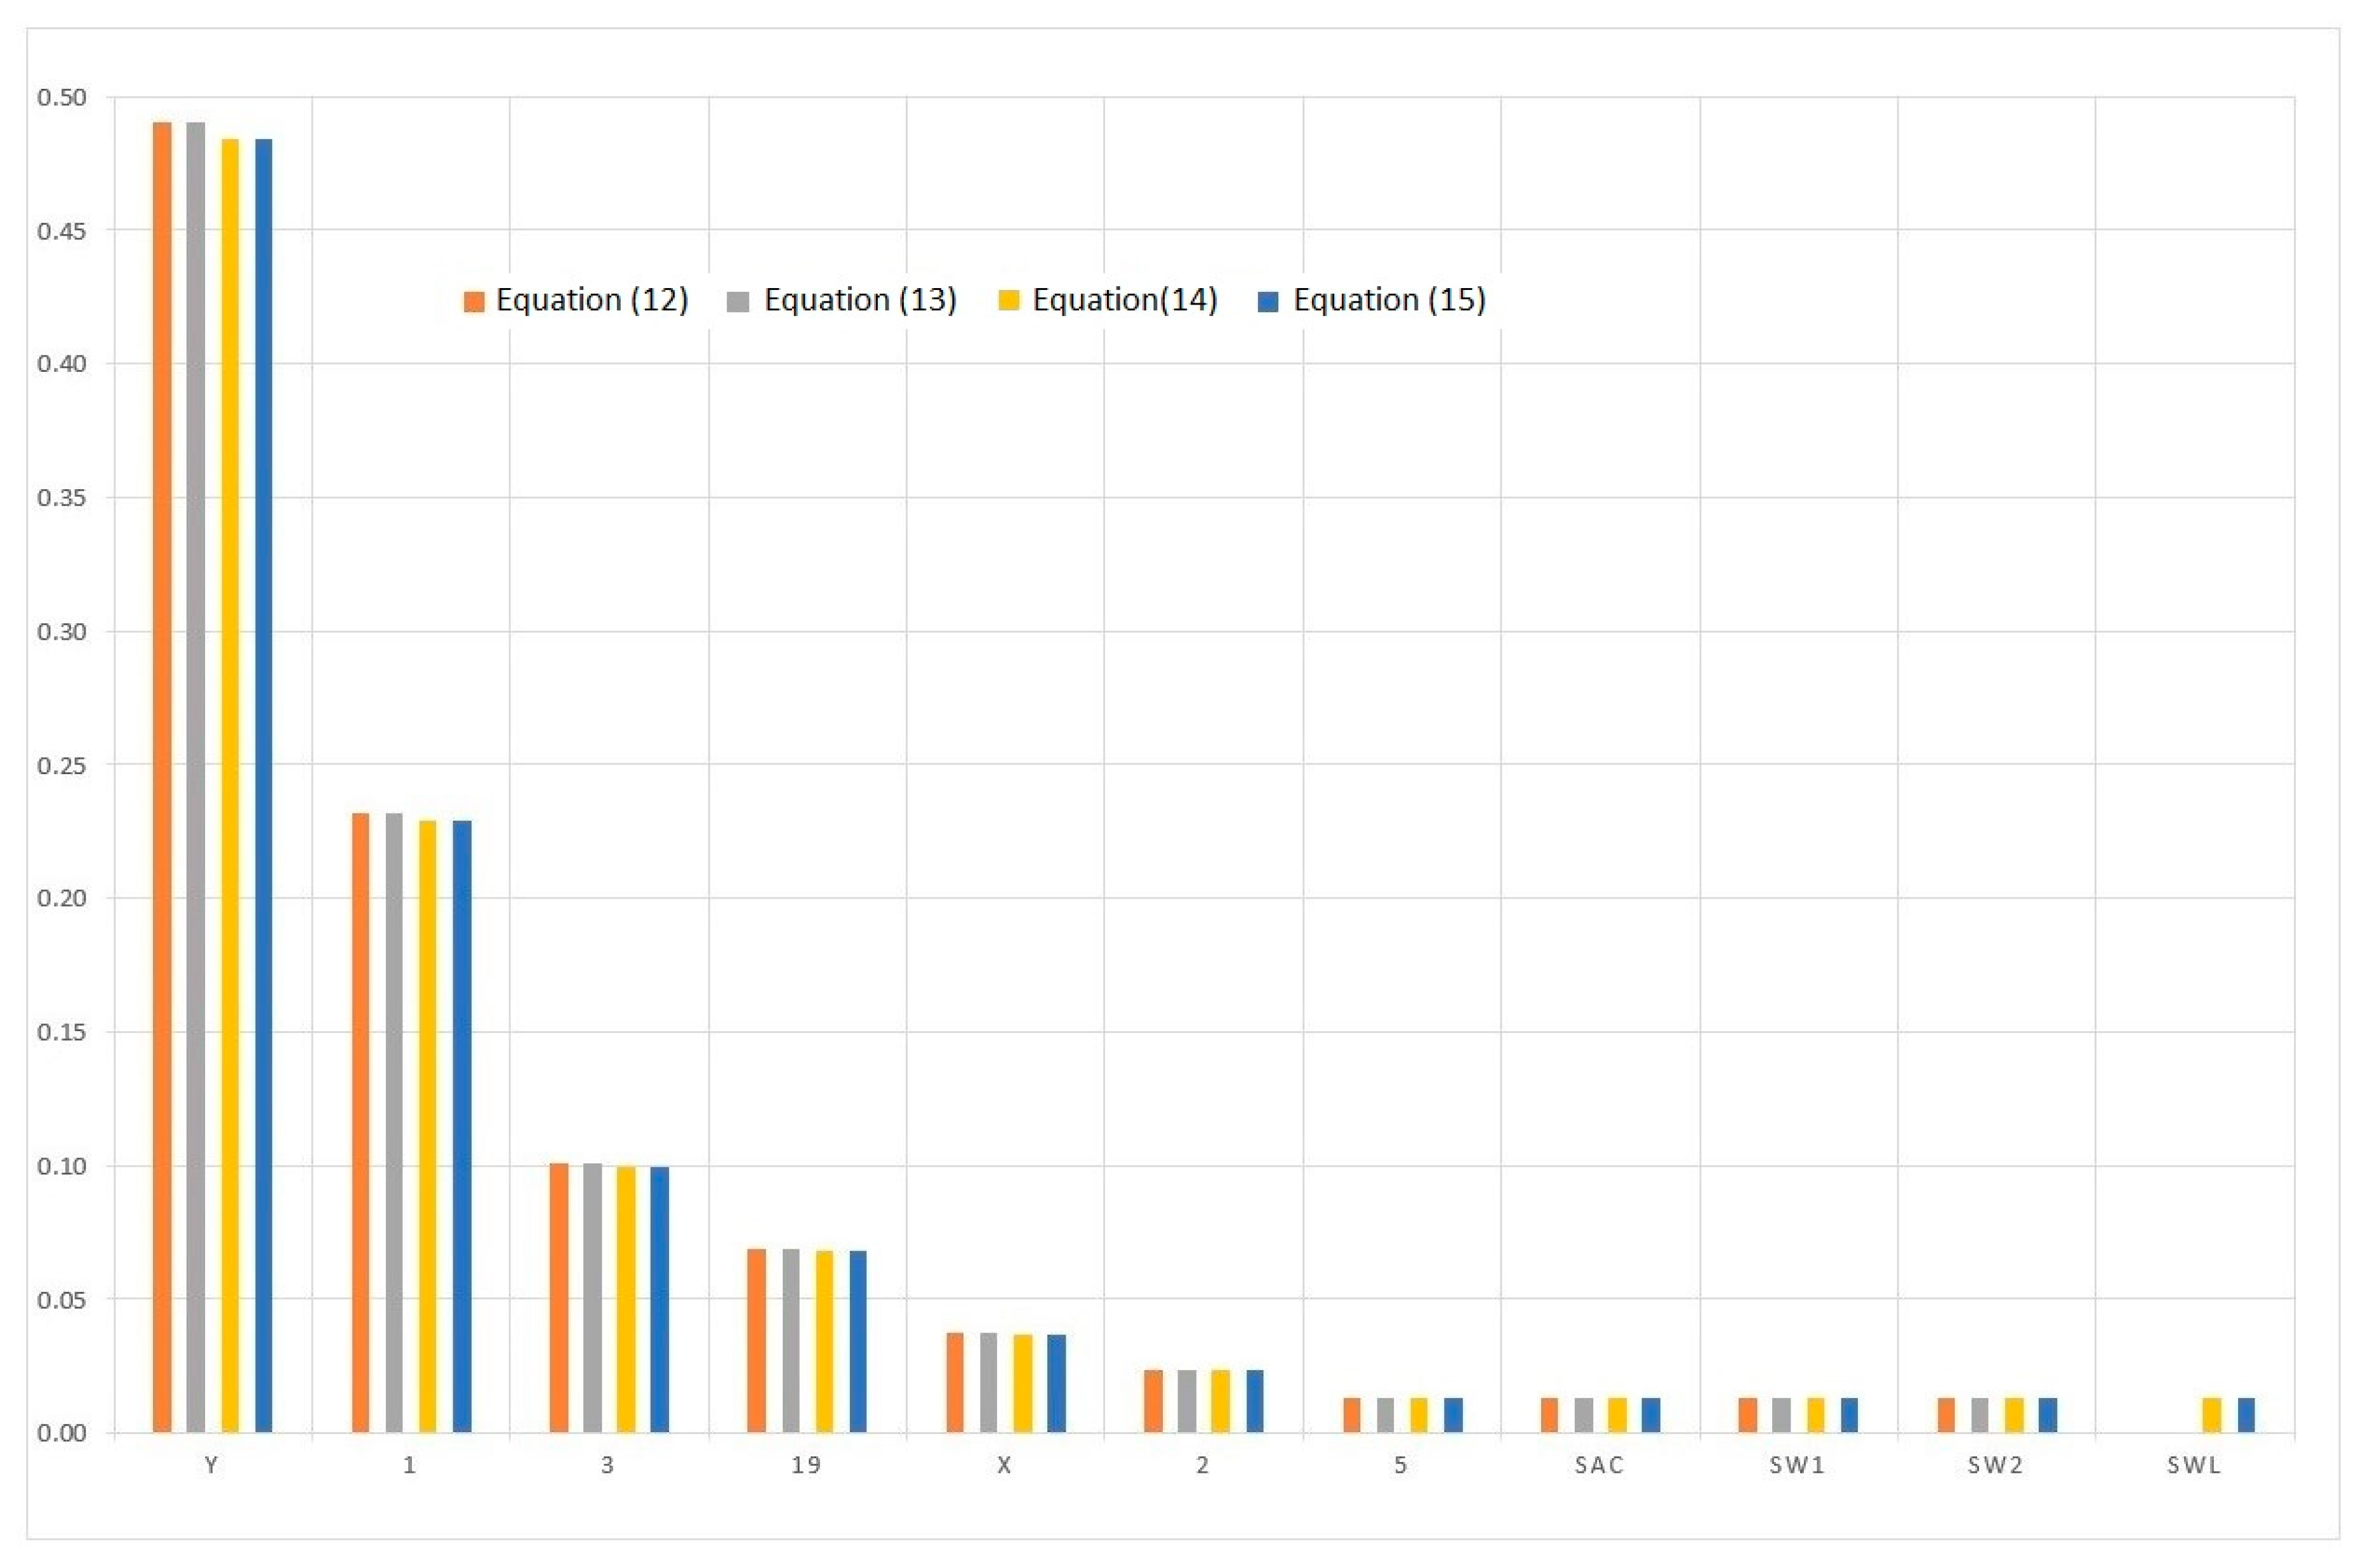
The estimation of the Vesely–Fussell measure (9) for the analyzed system during a sea voyage is shown in Figure 10.
The most important components during a sea voyage are other current-using equipment, the main engine of the ship with ancillary plants, the ancillary electrical and power units, and couplings in the power system.

3.3. System Components Importance during Paying out and Hauling in Nets

When paying out and hauling in the nets, all components of power system are in operation. For this operational state, the structure may differ slightly from the number of installed trawl and net winches due to the possibility or the impossibility of a greater or smaller number of components being faulty (in a down state).
For a running main engine that drives, through a transmission, a nondisengaging propeller drive shaft, a fixed- or adjustable-pitch propeller with a Kort nozzle, an AC shaft generator in a coupled position, coupled shaft pumps and shaft winches installed in the system, or noninstalled electrical winches, the vector w of conditional events takes the following form [40]:
w = [ w 1 , 0 , w 2 b , w 3 a , w 3 b , 0 , 0 , w 5 a , w 5 b , w 6 a , w 6 b , w 7 a , w 7 b , w 7 c , w 8 a , w 8 b , w 8 c , 0 , 0 ] = [ 1 , 0 , 1 , 1 , 1 , 0 , 0 , 1 , 1 , 1 , 1 , 1 , 1 , 1 , 1 , 1 , 1 , 0 , 0 ]
In the case of a system without a Kort nozzle, this vector will take the form of [40]
w = [ 0 , 0 , w 2 b , w 3 a , w 3 b , 0 , 0 , w 5 a , w 5 b , w 6 a , w 6 b , w 7 a , w 7 b , w 7 c , w 8 a , w 8 b , w 8 c , 0 , 0 ] = [ 0 , 0 , 1 , 1 , 1 , 0 , 0 , 1 , 1 , 1 , 1 , 1 , 1 , 1 , 1 , 1 , 1 , 0 , 0 ]
For a technological subsystem equipped only with electrically driven winches, the vectors (16) and (17) will take their respective forms [27]:
w = [ w 1 , 0 , w 2 b , w 3 a , w 3 b , 0 , 0 , w 5 a , w 5 b , w 6 a , w 6 b , 0 , 0 , 0 , 0 , 0 , 0 , w 9 , w 10 ] = [ 1 , 0 , 1 , 1 , 1 , 0 , 0 , 1 , 1 , 1 , 1 , 0 , 0 , 0 , 0 , 0 , 0 , 1 , 1 ]
w = [ 0 , 0 , w 2 b , w 3 a , w 3 b , 0 , 0 , w 5 a , w 5 b , w 6 a , w 6 b , 0 , 0 , 0 , 0 , 0 , 0 , w 9 , w 10 ] = [ 0 , 0 , 1 , 1 , 1 , 100 , 1 , 1 , 1 , 1 , 0 , 0 , 0 , 0 , 0 , 0 , 1 , 1 ]
If a vessel is equipped with electrically driven and main propulsion engine-driven trawl and net winches, the vectors (16) and (17) will take their respective forms [27]:
w = [ w 1 , 0 , w 2 b , w 3 a , w 3 b , 0 , 0 , w 5 a , w 5 b , w 6 a , w 6 b , w 7 a , w 7 b , w 7 c , w 8 a , w 8 b , w 8 c , w 9 , w 10 ] = [ 1 , 0 , 1 , 1 , 1 , 0 , 0 , 1 , 1 , 1 , 1 , 1 , 1 , 1 , 1 , 1 , 1 , 1 , 1 ]
w = [ 0 , 0 , w 2 b , w 3 a , w 3 b , 0 , 0 , w 5 a , w 5 b , w 6 a , w 6 b , w 7 a , w 7 b , w 7 c , w 8 a , w 8 b , w 8 c , w 9 , w 10 ] = [ 0 , 0 , 1 , 1 , 1 , 0 , 0 , 1 , 1 , 1 , 1 , 1 , 1 , 1 , 1 , 1 , 1 , 1 , 1 ]
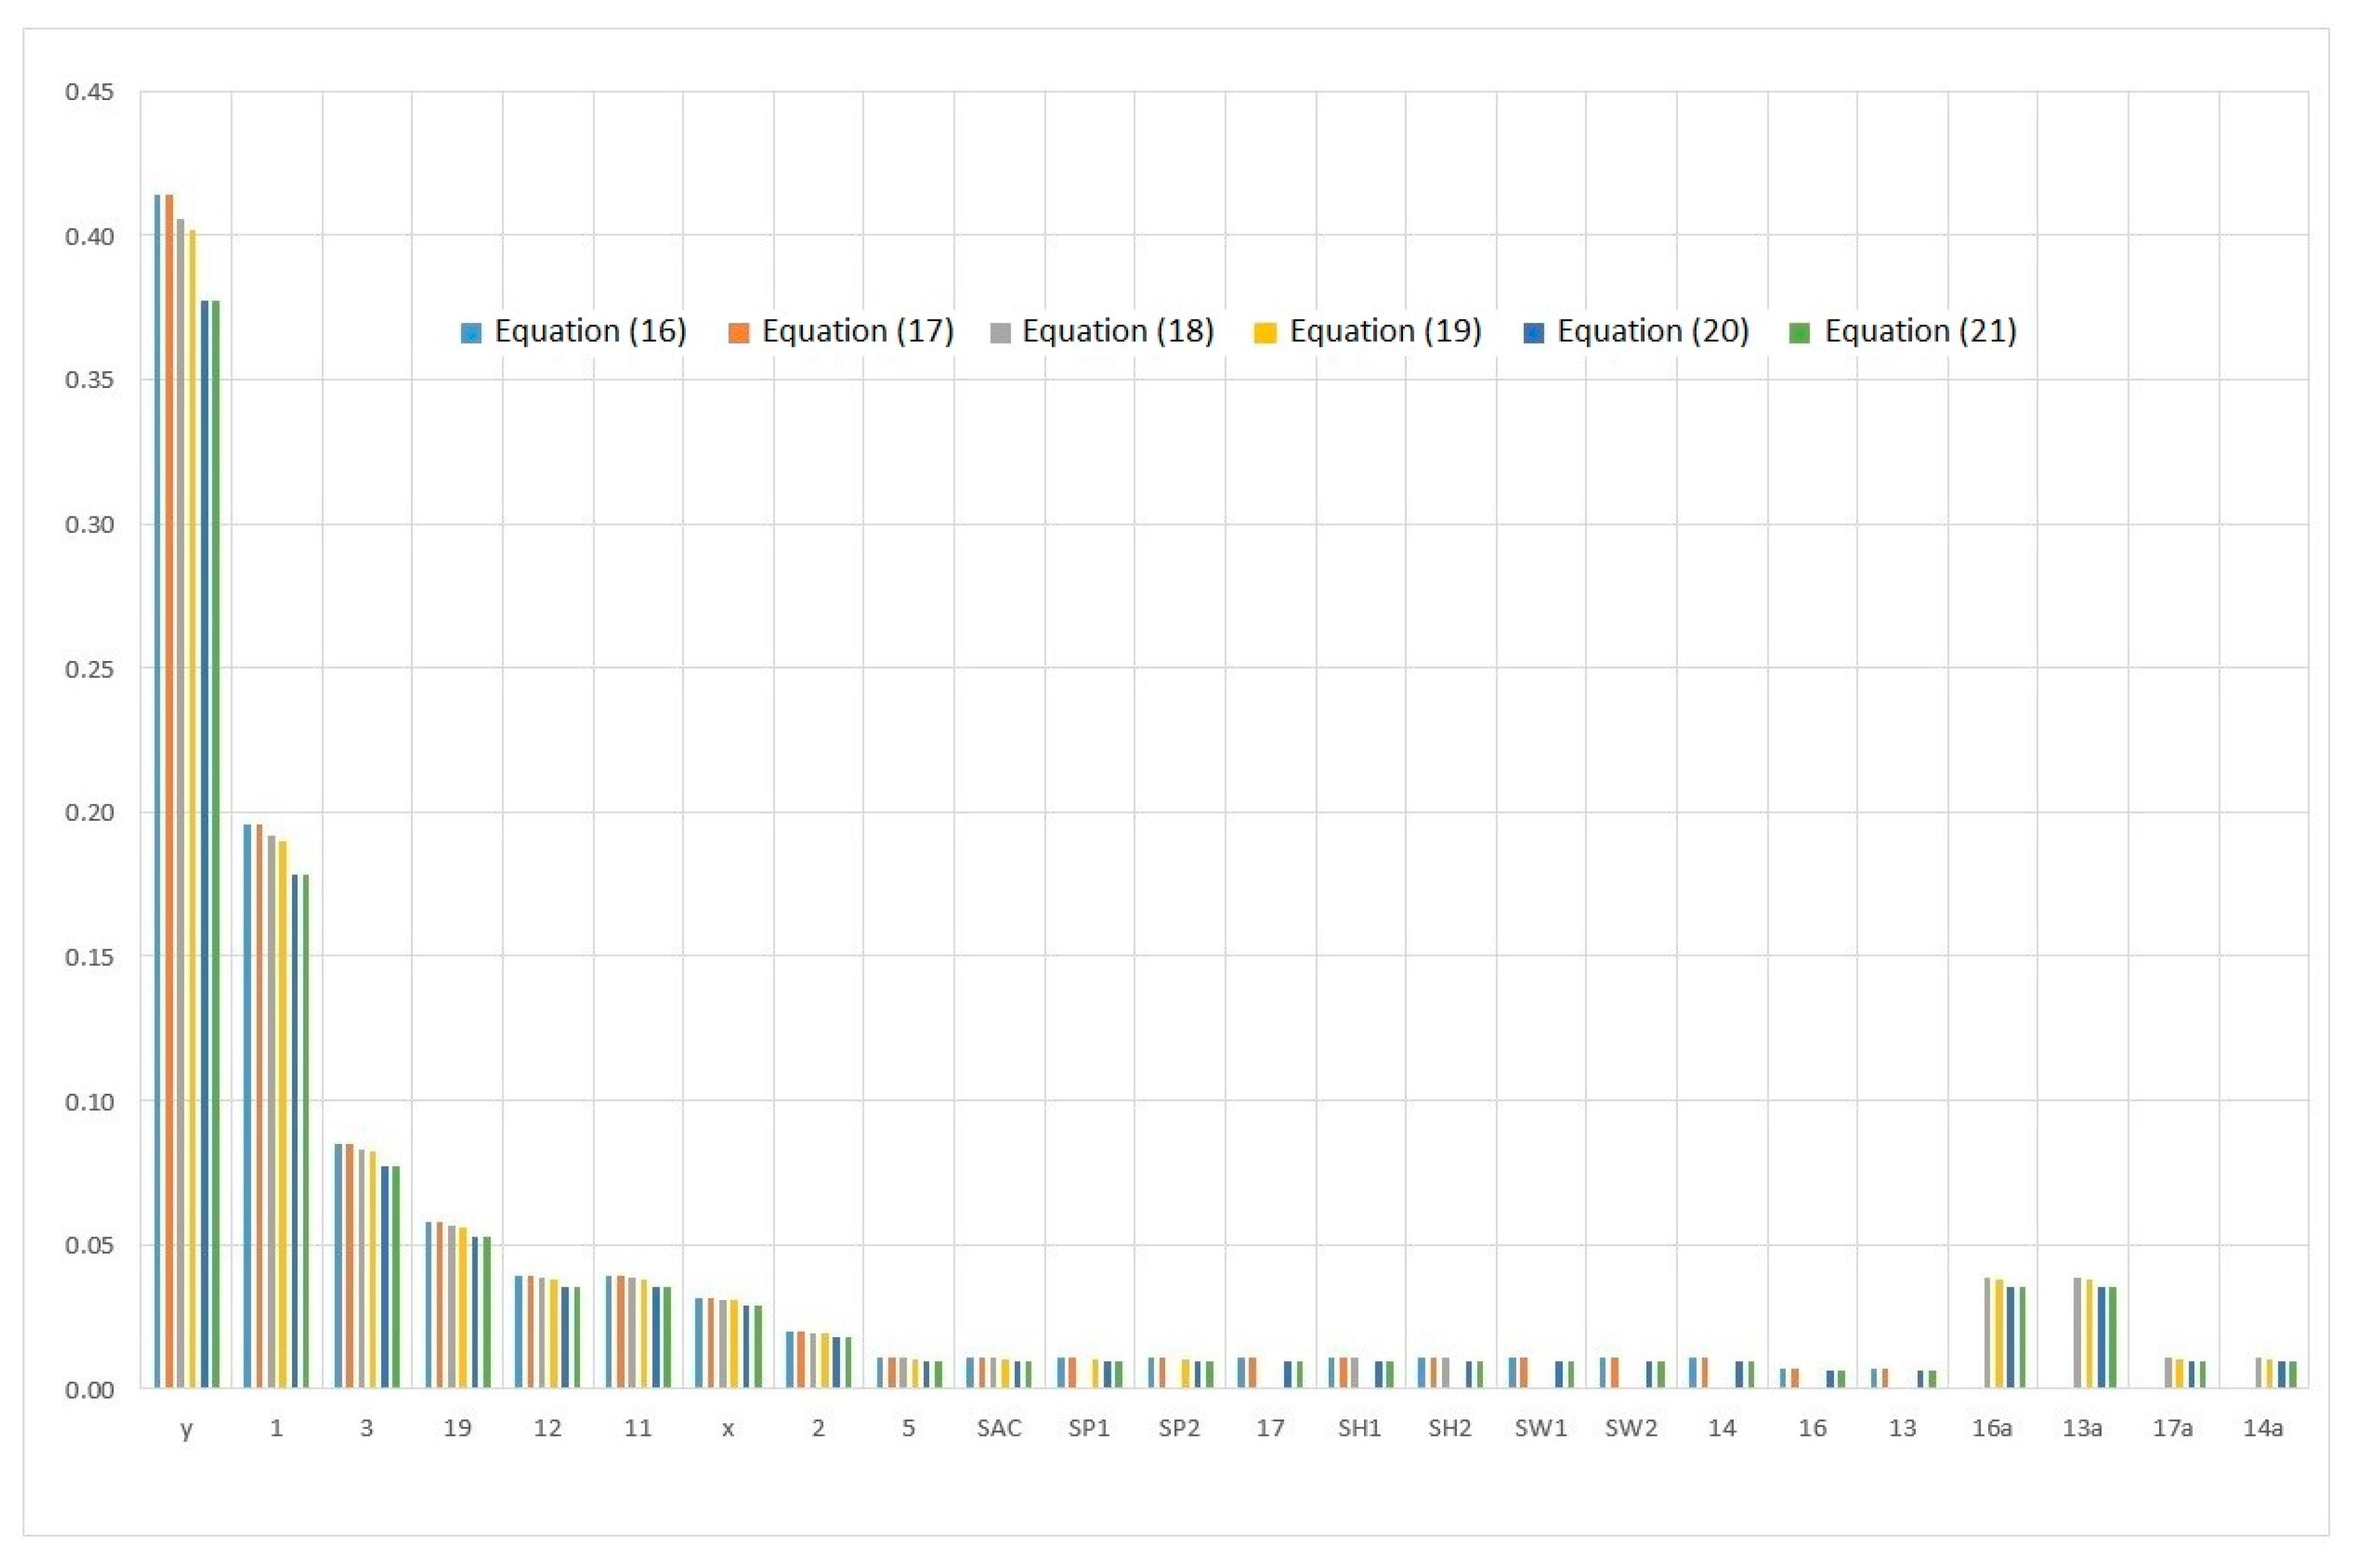
Figure 11 shows the estimates of the Vesely–Fussell measure for system components during operations of paying out and hauling in the nets.
When the system remains in this operational state, the most important components are other current-using equipment, the main engine of the ship with auxiliary plants, ancillary electrical and power units, and the specific equipment that handles the nets.

3.4. System Components Importance during Trawling

During trawling, all the energetic system components, except the net winches, are in operation. For this operational state, the structure may differ slightly from the number of installed trawl and net winches due to the possibility or the impossibility of a greater or smaller number of components being faulty (internally disabled state).
For a running main engine that drives, through a transmission, a nondisengaging propeller drive shaft, a fixed- or adjustable-pitch propeller with a Kort nozzle, an AC shaft generator in a coupled position, a coupled trawl winch installed in the system, or a decoupled net winch, both shaft-driven, and noninstalled electrical winches, the vector w of conditional events takes the following form [40]:
w = [ w 1 , 0 , w 2 b , w 3 a , w 3 b , w 4 a , 0 , 0 , w 5 b , w 6 a , w 6 b , w 7 a , w 7 b , w 7 c , w 8 a , 0 , 0 , 0 , 0 ] = [ 1 , 0 , 1 , 1 , 1 , 1 , 0 , 0 , 1 , 1 , 1 , 1 , 1 , 1 , 1 , 0 , 0 , 0 , 0 ]
In the case of a system without a Kort nozzle, the vector (22) will take the form of [27]
w = [ 0 , 0 , w 2 b , w 3 a , w 3 b , w 4 a , 0 , 0 , w 5 b , w 6 a , w 6 b , w 7 a , w 7 b , w 7 c , w 8 a , 0 , 0 , 0 , 0 ] = [ 0 , 0 , 1 , 1 , 1 , 1 , 0 , 0 , 1 , 1 , 1 , 1 , 1 , 1 , 1 , 0 , 0 , 0 , 0 ]
For a technological subsystem equipped only with electrically driven winches, the vectors (22) and (23) will take their respective forms [27]:
w = [ w 1 , 0 , w 2 b , w 3 a , w 3 b , w 4 a , 0 , 0 , w 5 b , w 6 a , w 6 b , 0 , 0 , 0 , 0 , 0 , 0 , w 9 , 0 ] = [ 1 , 0 , 1 , 1 , 1 , 1 , 0 , 0 , 1 , 1 , 1 , 0 , 0 , 0 , 0 , 0 , 0 , 1 , 0 ]
w = [ 0 , 0 , w 2 b , w 3 a , w 3 b , w 4 a , 0 , 0 , w 5 b , w 6 a , w 6 b , 0 , 0 , 0 , 0 , 0 , 0 , w 9 , 0 ] = [ 0 , 0 , 1 , 1 , 1 , 1 , 0 , 0 , 1 , 1 , 1 , 0 , 0 , 0 , 0 , 0 , 0 , 1 , 0 ]
If a vessel is equipped with both electrically driven and main propulsion engine-driven trawl and net winches, the vectors (24) and (25) will take their respective forms [27]:
w = [ w 1 , 0 , w 2 b , w 3 a , w 3 b , w 4 a , 0 , 0 , w 5 b , w 6 a , w 6 b , w 7 a , w 7 b , w 7 c , w 8 a , 0 , 0 , w 9 , 0 ] = [ 1 , 0 , 1 , 1 , 1 , 1 , 0 , 0 , 1 , 1 , 1 , 1 , 1 , 1 , 1 , 0 , 0 , 1 , 0 ]
w = [ 0 , 0 , w 2 b , w 3 a , w 3 b , w 4 a , 0 , 0 , w 5 b , w 6 a , w 6 b , w 7 a , w 7 b , w 7 c , w 8 a , 0 , 0 , w 9 , 0 ] = [ 0 , 0 , 1 , 1 , 1 , 1 , 0 , 0 , 1 , 1 , 1 , 1 , 1 , 1 , 1 , 1 , 0 , 1 , 0 ]
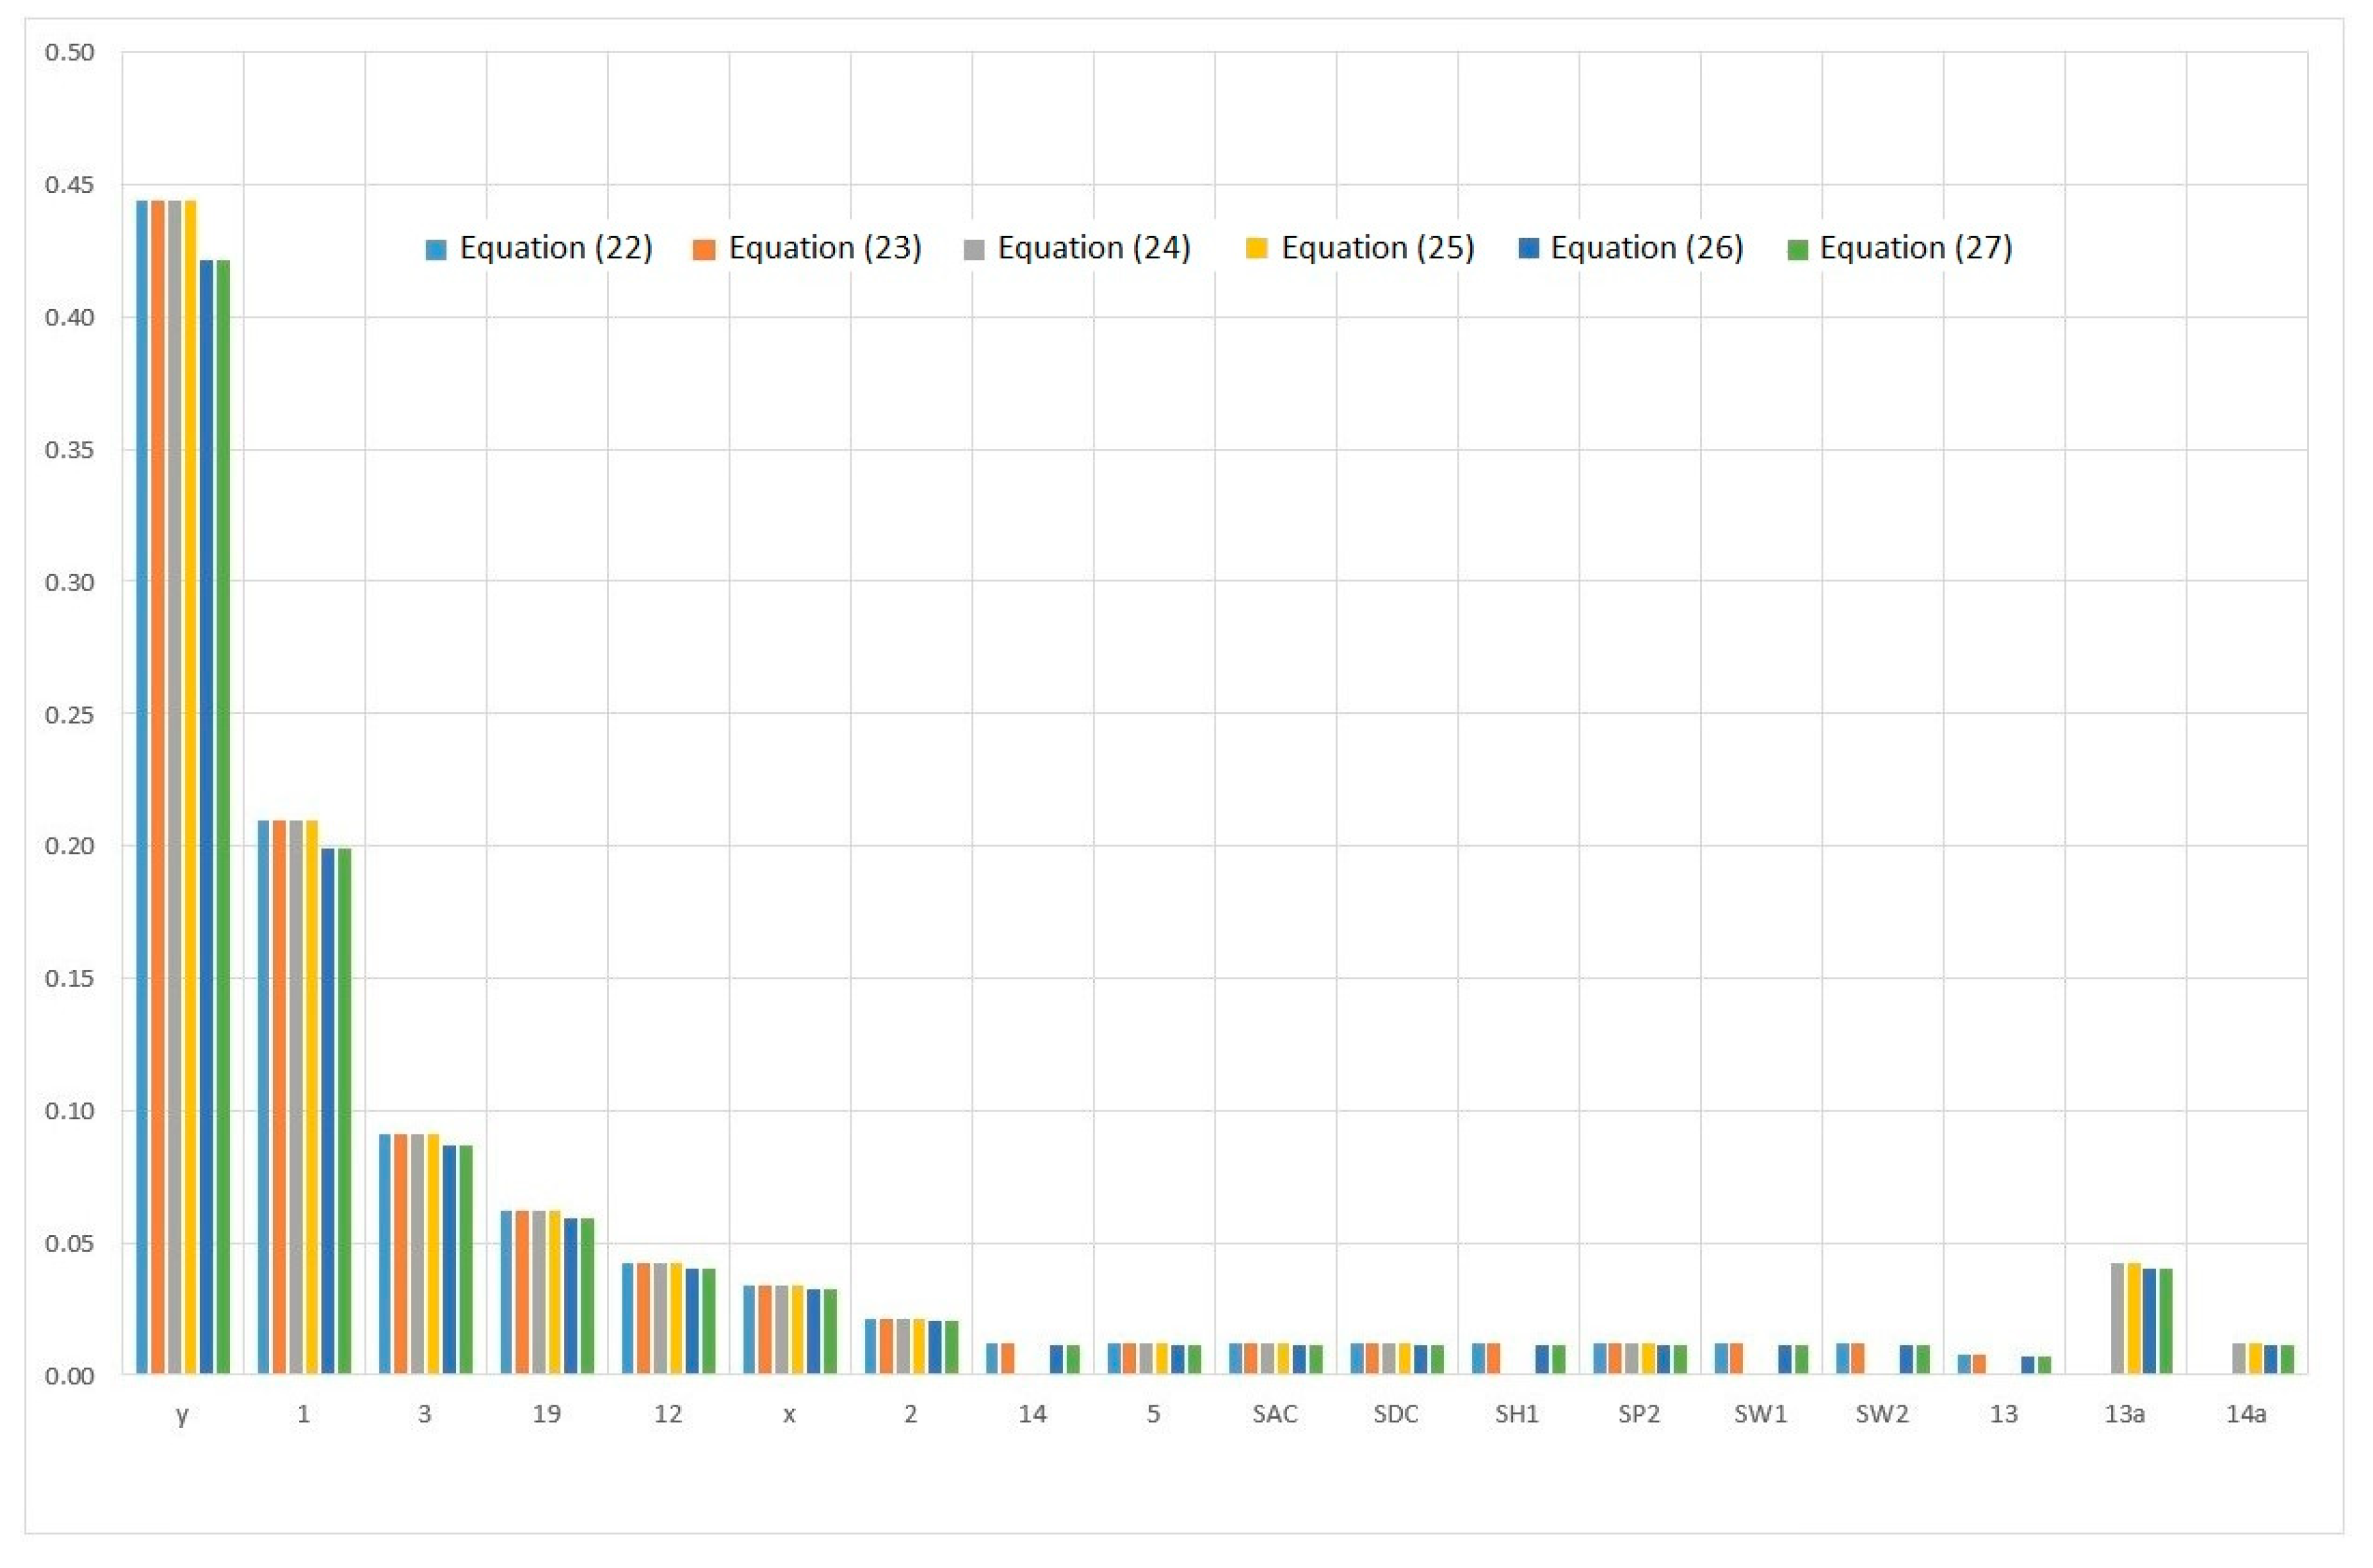
Figure 12 shows the Vesely–Fussell importance measure of the system components during the trawling operation.
The most important components are other current-using equipment, the main engine of the ship with ancillary plants, ancillary electrical and power unit, and the specific equipment that operates when trawling.

3.5. System Components Importance during Fishing, When Heaved To, or Staying in a Port

When fishing, heaving to, or staying in a port, generating sets are in operation, but neither the winch nor the vessel’s main propulsion are in operation. For a running main engine that drives, through a transmission, an AC shaft generator with a decouplable and decoupled propeller drive shaft, a fixed propeller without a Kort nozzle, coupled shaft pumps installed in the system, decoupled shaft winches installed in the system, and noninstalled or switched-off electrical winches, the vector w of conditional events takes the following form [40]:
w = [ 0 , w 2 a , 0 , w 3 a , w 3 b , 0 , 0 , w 5 a , w 5 b , w 6 a , w 6 b , 0 , 0 , w 7 c , 0 , 0 , 0 , 0 , 0 ] = [ 0 , 1 , 0 , 1 , 1 , 0 , 0 , 1 , 1 , 1 , 1 , 0 , 0 , 1 , 0 , 0 , 0 , 0 , 0 ]
In the case of a system with a DC shaft generator, the vector w takes on the form
w = [ 0 , w 2 a , 0 , 0 , 0 , w 4 a , w 4 b , w 5 a , w 5 b , w 6 a , w 6 b , 0 , 0 , w 7 c , 0 , 0 , 0 , 0 , 0 ] = [ 0 , 1 , 0 , 0 , 0 , 1 , 1 , 1 , 1 , 1 , 1 , 0 , 0 , 1 , 0 , 0 , 0 , 0 , 0 ]
If it is not possible to decouple the vessel’s drive shaft so that the main engine can drive the shaft generator when heaving to or staying in a port, electricity is produced exclusively by auxiliary generator sets.
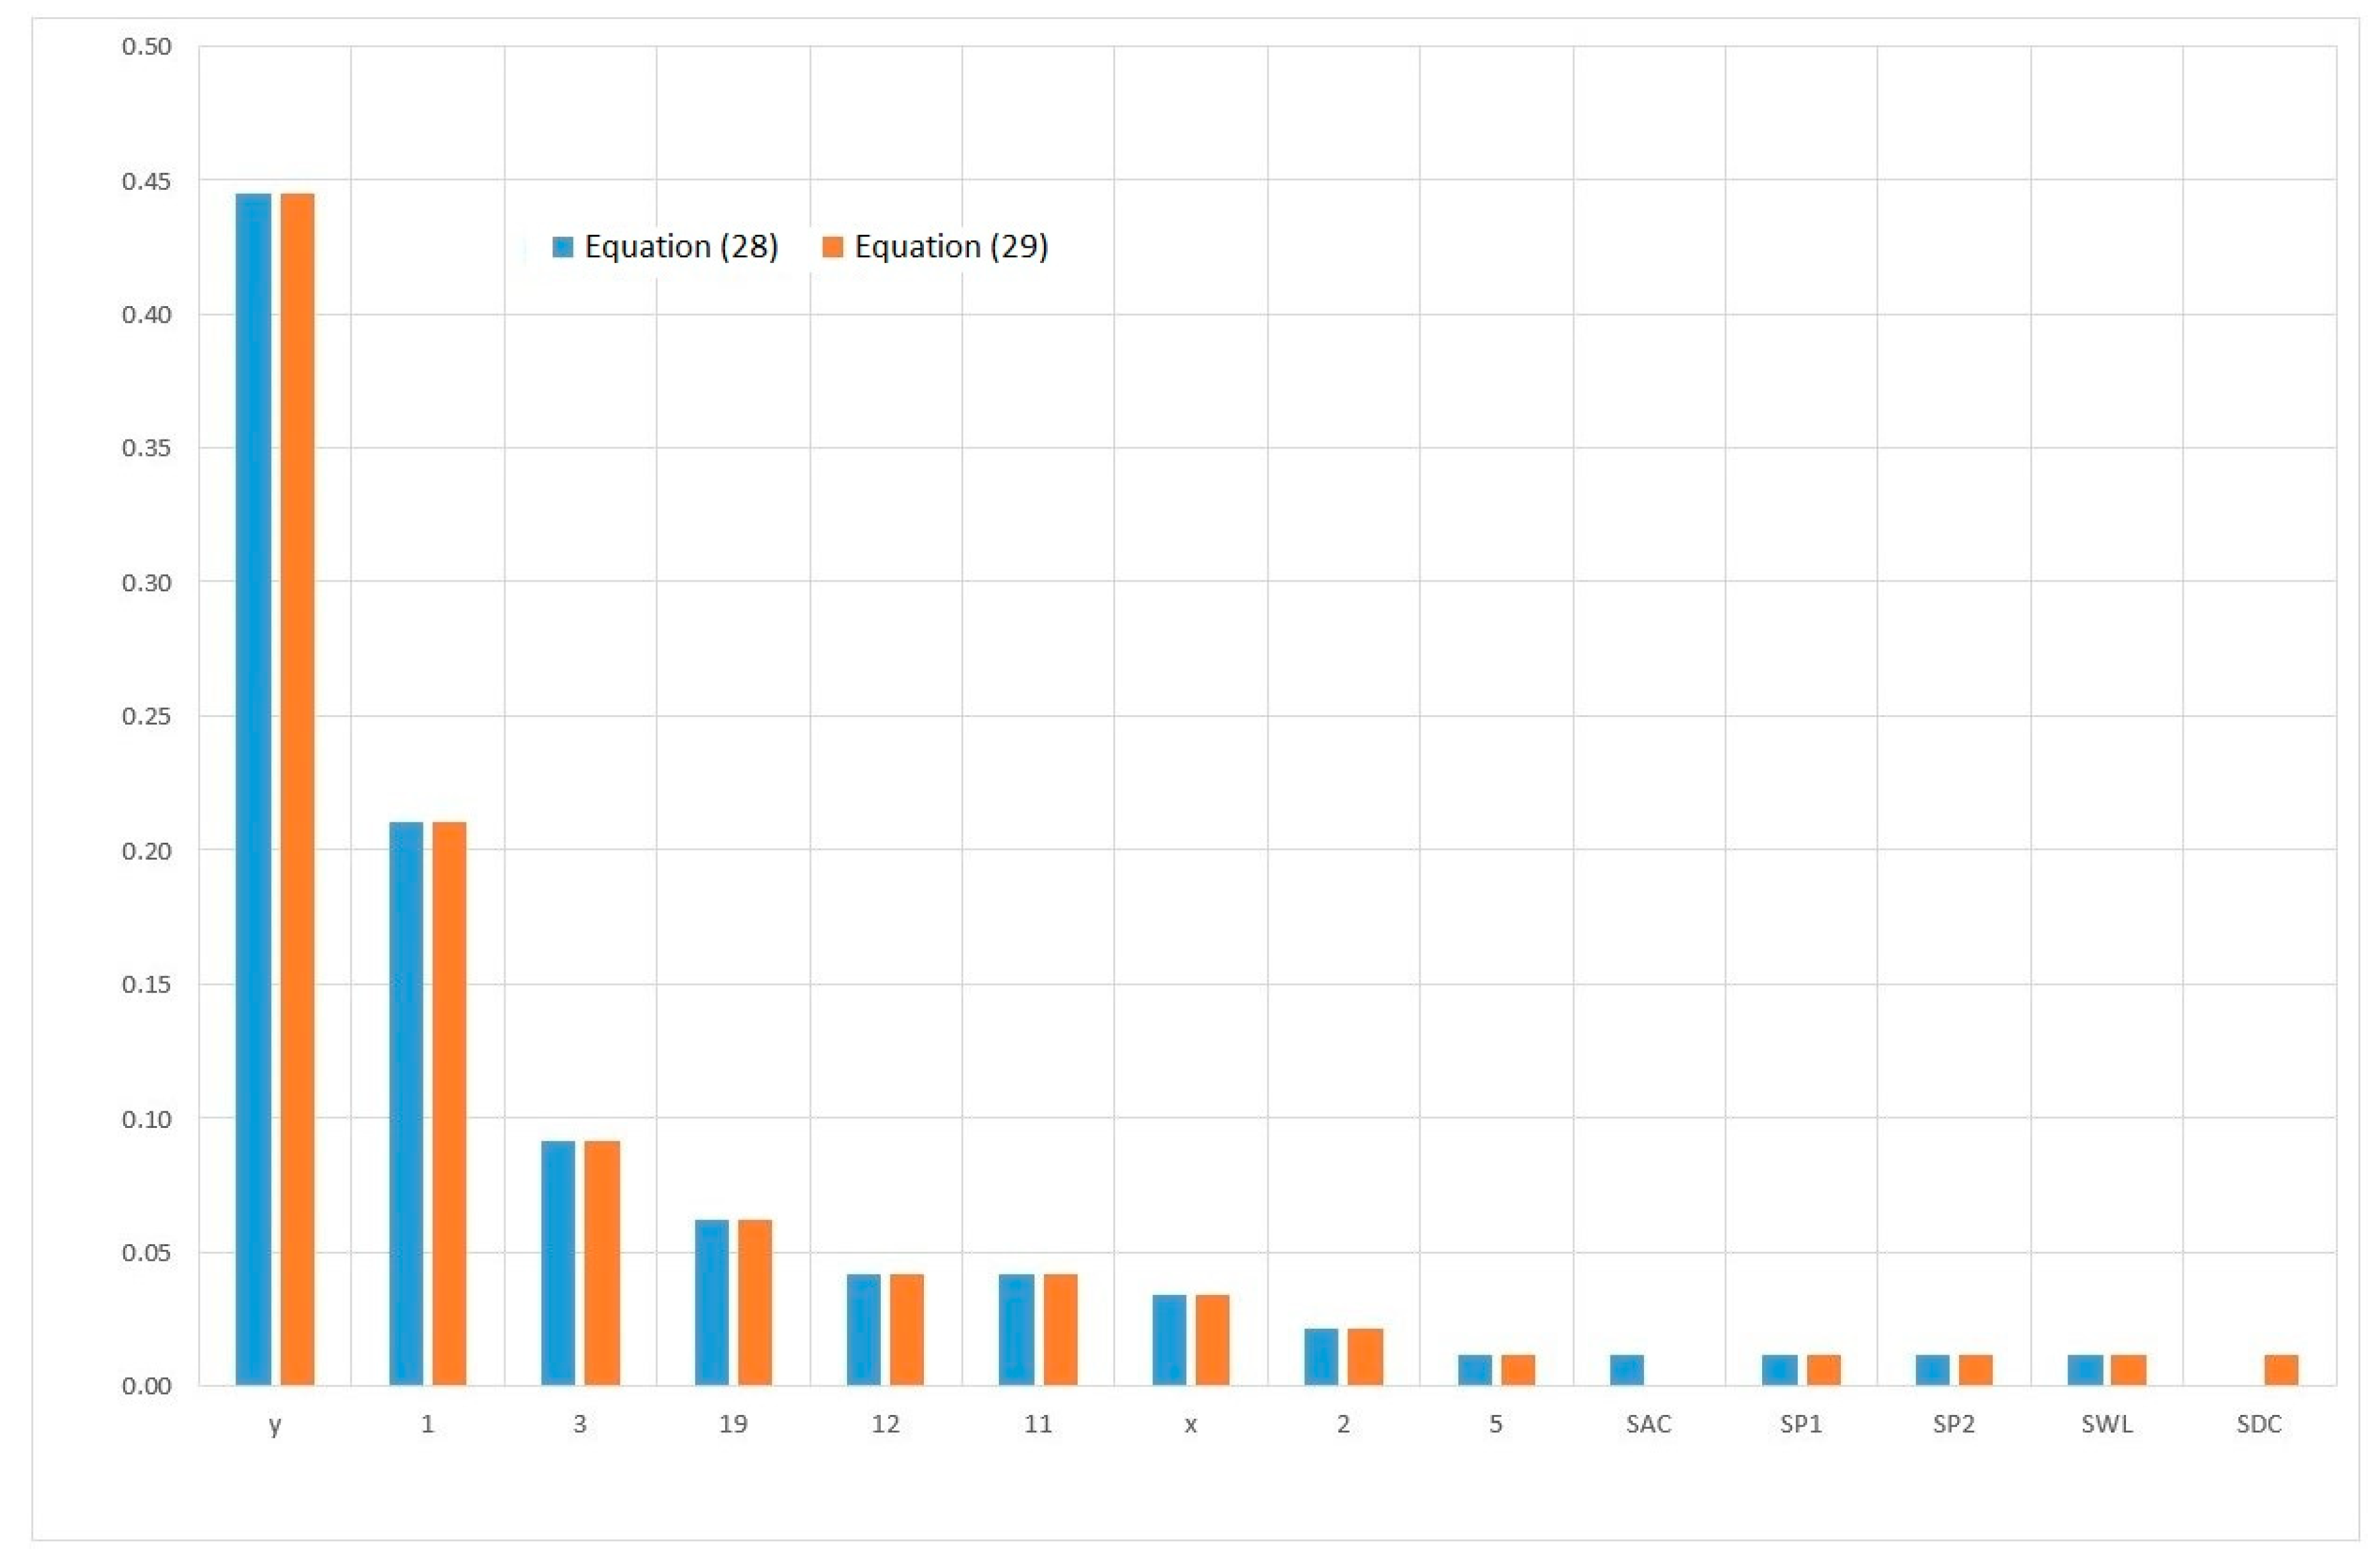
For the case of fishing, heaving to, or staying in a port, the estimation of Vesely–Fussell’s measure is shown in Figure 13.
The most important components are other current-using equipment, the main engine of the ship with ancillary plants, ancillary electrical, and power unit.

3.6. Quantitative Analysis

For the adopted system structure, analyses were conducted using CARA FaultTree Academic version 4.1 (Sydvest Software, Trondheim, Norway). The system availability values were calculated for all the described operational states. The system shows the greatest availability, exceeding 0.9820, for a sea voyage, and the lowest one, below 0.9795, for the state of paying out and hauling in the nets, which is caused by the reliability and the number of components necessary for the system to function. Comparative analysis of system components’ importance is presented in Table 2, Table 3 and Table 4.
The most important components are other current-using equipment, such as the ship’s main engine with ancillary plants (in the presented solution, the engine drives the generator during this operational state), the ancillary electrical and power unit, and individual couplings in the power system. The high importance of the main engine when staying in port is due to the engine room solution, wherein the main engine can be used as an ancillary electrical and power unit when staying in port.
It should be noted that in the presented system, it is possible to distinguish components that are important for the reliable operation in all operating states being analyzed. In the analyzed system, components with Vesely–Fussell importance value greater than 0.05 are items y, 1, 3, 19, that is, other current-using equipment and the main engine with ancillary plants.

4. Conclusions

The presented models allow for the analysis of reliability and availability of the systems in different combinations of component structure and for different operational states, as shown by the example of the power system of a fishing vessel.
The example presented in this article shows that the proposed methodology using a fault tree as a system metamodel enables a holistic analysis of the reliability of multi-operational-state systems and/or systems with many different technical constructions. In this context, the presented approach may become a part of the management strategy for companies (e.g., ship owners) to improve the reliability of the whole fleet of systems (e.g., vessels).
The proposed methodology makes it possible to identify the most important components regardless of the momentary operational status of the analyzed system, that is, the components important in all analyzed operational states.
Independently from the calculated measures, the proposed models may be used to compute other indices such as reliability, availability, mean time to failure, number of failures, list of minimal cut-sets, or other importance measures, for example, structural Birnbaum measure, reliability Birnbaum measure, criticality measure, order of minimal cut-sets, and so forth.
Future development of the proposed models is associated with an application of metamodels to partly loaded systems, where some components are operated in warm or cold redundancy. It may be done by combining metamodels with dynamic fault trees. Moreover, an integration of the presented approach with other modelling tools might be valuable as it will increase the flexibility of applying the models to a given system. It may be achieved by using a number of existing computer programs, for example, Reliasoft Synthesis BlockSim (HBM Prenscia, Tucson, AZ, USA), Reliability Workbench (Isograph Inc., Manchester, UK), and Windchill FTA (PTC Windchill Quality Solutions, Boston, MA, USA).

Funding

This research was co-funded by the Maritime University of Szczecin from research grant 1/S/IESO/17 “Increasing the operational effectiveness of complex technical systems by systematic development and implementation of innovations using novel materials and modifying the object’s structure”. The APC was funded by MDPI.

Acknowledgments

The author cooperates in pursuing the grant OR 16-61535-OR 1600006/06 “Fishing and Fish Processing 2004–2006. Preparation of guidelines for the modernization of fishing vessels in terms of energy expenditure minimizing and environmental impact reduction” under topic “Methodology of fishing vessels power plant systems reliability and availability evaluation”. The above grant was the inspiration to analyze the subject of this article.

Conflicts of Interest

The author declares no conflict of interest.

References

  1. Chybowski, L. Analiza drzewa niezdatności. Podstawy teoretyczne i zastosowania; Wyd. Nauk. Akademii Morskiej w Szczecinie: Szczecin, Radom, 2017; ISBN 978-83-64434-12-9. [Google Scholar]
  2. Chybowski, L.; Gawdzińska, K.; Ślesicki, O.; Patejuk, K.; Nowosad, G. An engine room simulator as an educational tool for marine engineers relating to explosion and fire prevention of marine diesel engines. Sci. J. Marit. Univ. Szczecin, Zesz. Nauk. Akad. Morskiej w Szczecinie 2016, 43, 15–21. [Google Scholar]
  3. Chybowski, L.; Twardochleb, M.; Wiśnicki, B. Multi-criteria Decision making in Components Importance Analysis applied to a Complex Marine System. Nase More 2016, 63, 264–270. [Google Scholar] [CrossRef]
  4. Kim, M.C. Reliability block diagram with general gates and its application to system reliability analysis. Ann. Nucl. Energy 2011, 38, 2456–2461. [Google Scholar] [CrossRef]
  5. Sharma, G.; Rai, R.N. Reliability modeling and analysis of environmental control and life support systems of space stations: A literature survey. Acta Astronaut. 2019, 155, 238–246. [Google Scholar] [CrossRef]
  6. Gawdzińska, K.; Chybowski, L.; Przetakiewicz, W.; Laskowski, R. Application of FMEA in the Quality Estimation of Metal Matrix Composite Castings Produced by Squeeze Infiltration. Arch. Metall. Mater. 2017, 62, 2171–2182. [Google Scholar] [CrossRef] [Green Version]
  7. Chybowski, L. Qualitative and quantitative multi-criteria models of the importance of the components in reliability structure of a complex technical system. J. Konbin 2012, 24, 33–48. [Google Scholar] [CrossRef]
  8. Gil, M.; Wróbel, K.; Montewka, J. Toward a Method Evaluating Control Actions in STPA-Based Model of Ship-Ship Collision Avoidance Process. J. Offshore Mech. Arct. Eng. 2019, 141, 051105. [Google Scholar] [CrossRef]
  9. Wróbel, K.; Montewka, J.; Kujala, P. Towards the development of a system-theoretic model for safety assessment of autonomous merchant vessels. Reliab. Eng. Syst. Saf. 2018, 178, 209–224. [Google Scholar] [CrossRef]
  10. Goerlandt, F.; Montewka, J. A Bayesian network model for accidental oil outflow in double hull oil product tanker collisions. In Proceedings of the PSAM 2014—Probabilistic Safety Assessment and Management, Honolulu, HI, USA, 22–27 June 2014; pp. 1–11. [Google Scholar]
  11. Goerlandt, F.; Montewka, J. A framework for risk analysis of maritime transportation systems: A case study for oil spill from tankers in a ship-ship collision. Saf. Sci. 2015, 76, 42–66. [Google Scholar] [CrossRef]
  12. Shafiee, M.; Enjema, E.; Kolios, A. An Integrated FTA-FMEA Model for Risk Analysis of Engineering Systems: A Case Study of Subsea Blowout Preventers. Appl. Sci. 2019, 9, 1192. [Google Scholar] [CrossRef] [Green Version]
  13. Gucma, L.; Schoeneich, M. Monte carlo method of ship’s underkeel clearance evaluation for safety of ferry approaching to ystad port determination. J. Konbin 2008, 8, 35–44. [Google Scholar] [CrossRef] [Green Version]
  14. Chybowski, L.; Gawdzińska, K. A stochastic simulation-based component importance analysis for complex technical systems. Probl. Eksploat. Maint. Probl. J. Mach. Constr. Maint. 2017, 17, 47–50. [Google Scholar]
  15. Ratajczak, M.; Ptak, M.; Chybowski, L.; Gawdzińska, K.; Będziński, R. Material and Structural Modeling Aspects of Brain Tissue Deformation under Dynamic Loads. Materials 2019, 12, 271. [Google Scholar] [CrossRef] [PubMed] [Green Version]
  16. Girtler, J. The semi-Markov model of the process of appearance of sea-going ship propupsion system ability and inability states in application to determining the reliablity of these systems. Polish Marit. Res. 2013, 20, 18–24. [Google Scholar] [CrossRef]
  17. Girtler, J. Issue of making decisions with regard to ship traffic safety in different situations at sea. In Marine Navigation and Safety of Sea Transportation: Navigational Problems; Adam, W., Ed.; CRC Press: Boca Raton, FL, USA, 2013; pp. 63–70. [Google Scholar]
  18. Girtler, J. Application of theory of semi-Markov processes to determining distribution of probabilistic process of marine accidents resulting from collision of ships. Polish Marit. Res. 2014, 1, 9–13. [Google Scholar] [CrossRef] [Green Version]
  19. Gucma, S.; Ślączka, W. Comprehensive method of formal safety assessment of ship manoeuvring in waterways. Sci. J. Marit. Univ. Szczecin, Zesz. Nauk. Akad. Morskiej w Szczecinie 2018, 54, 110–119. [Google Scholar]
  20. Gucma, L.; Pietrzykowski, Z. Ship manoeuvring in restricted areas: An attempt to quantify dangerous situations using a probabilistic-fuzzy method. J. Navig. 2006, 59, 251–262. [Google Scholar] [CrossRef]
  21. Tanaka, H.; Fan, L.T.; Lai, F.S.; Toguchi, K. Fault-Tree Analysis by Fuzzy Probability. IEEE Trans. Reliab. 1983, R-32, 453–457. [Google Scholar] [CrossRef]
  22. Markowski, A.S.; Mannan, M.S.; Bigoszewska, A. Fuzzy logic for process safety analysis. J. Loss Prev. Process Ind. 2009, 22, 695–702. [Google Scholar] [CrossRef]
  23. Alves, G.; Marques, D.; Silva, I.; Guedes, L.A.; da Silva, M.d.G. A Methodology for Dependability Evaluation of Smart Grids. Energies 2019, 12, 1817. [Google Scholar] [CrossRef] [Green Version]
  24. Chybowski, L.; Grzadziel, Z.; Gawdzinska, K. Simulation and experimental studies of a multi-tubular floating sea wave damper. Energies 2018, 11, 1012. [Google Scholar] [CrossRef] [Green Version]
  25. Nozdrzykowski, K.; Chybowski, L. A Force-Sensor-Based Method to Eliminate Deformation of Large Crankshafts during Measurements of Their Geometric Condition. Sensors 2019, 19, 3507. [Google Scholar] [CrossRef] [PubMed] [Green Version]
  26. Chybowski, L.; Laskowski, R.; Gawdzińska, K. An overview of systems supplying water into the combustion chamber of diesel engines to decrease the amount of nitrogen oxides in exhaust gas. J. Mar. Sci. Technol. 2015, 20, 393–405. [Google Scholar] [CrossRef]
  27. Chybowski, L. Ważność elementów w strukturze złożonych systemów technicznych; Wyd. Nauk. Instytutu Technologii Eksploatacji-PIB: Szczecin, Radom, 2014; ISBN 978-83-7789-309-8. [Google Scholar]
  28. Chybowski, L.; Matuszak, Z. Marine Auxuliary Diesel Engine Turbocharger Damage (Explosion) Cause Analysis. J. Polish CIMAC 2007, 2, 33–40. [Google Scholar]
  29. Vesely, W.E. A time-dependent methodology for fault tree evaluation. Nucl. Eng. Des. 1970, 13, 337–360. [Google Scholar] [CrossRef]
  30. Chiacchio, F.; Aizpurua, J.I.; Compagno, L.; Khodayee, S.M.; D’Urso, D. Modelling and Resolution of Dynamic Reliability Problems by the Coupling of Simulink and the Stochastic Hybrid Fault Tree Object Oriented (SHyFTOO) Library. Information 2019, 10, 283. [Google Scholar] [CrossRef] [Green Version]
  31. Xu, H.; Dugan, J.B. Combining dynamic fault trees and event trees for probabilistic risk assessment. In Proceedings of the Proceedings of the Annual Reliability and Maintainability Symposium, Los Angeles, CA, USA, 26–29 January 2004; pp. 214–219. [Google Scholar]
  32. Chybowski, L. Assessment of Reliability and Availability of Fishing Vessels Power, Propulsion and Technological Plants Based on Fault Tree Analysis. Polish J. Environ. Stud. 2009, 18, 39–44. [Google Scholar]
  33. Wu, Y.-C.; Laiwang, B.; Shu, C.-M. Investigation of an Explosion at a Styrene Plant with Alkylation Reactor Feed Furnace. Appl. Sci. 2019, 9, 503. [Google Scholar] [CrossRef] [Green Version]
  34. Tchórzewska-Cieślak, B.; Pietrucha-Urbanik, K.; Papciak, D. An Approach to Estimating Water Quality Changes in Water Distribution Systems Using Fault Tree Analysis. Resources 2019, 8, 162. [Google Scholar] [CrossRef] [Green Version]
  35. Chybowski, L. Application of External Events Vectors for Defining Reliability Structure of Fishing Vessels Power, Propulsion and Technological Plants. Polish J. Environ. Stud. 2009, 18, 45–50. [Google Scholar]
  36. Vesely, W.; Stamatelatos, M.; Dugan, J.; Fragola, J.; Minarick, J.I.; Railsback, J. Fault Tree Handbook with Aerospace Applications; NASA: Washington, DC, USA, 2002. [Google Scholar]
  37. Woropay, M. Metoda Budowy Wielopoziomowych Systemów do Badania Niezawodności Elementów o Wyznaczonej a Priori Istotności; ATR: Bydgoszcz, Poland, 1983. [Google Scholar]
  38. Kuo, W.; Zhu, X. Importance measures in reliability, risk and optimization. In Principles and Applications; John Wiley & Sons, Ltd.: New York, NY, USA, 2012. [Google Scholar]
  39. Chybowski, L.; Gawdzińska, K. On the Possibilities of Applying the AHP Method to a Multi-criteria Component Importance Analysis of Complex Technical Objects. Adv. Intell. Syst. Comput. 2016, 445, 701–710. [Google Scholar]
  40. Chybowski, L.; Matuszak, Z. Methodology of Fishing Vessels Power Plant Systems Reliability and Availability Evaluation; Report OR 16-61535-OR 1600006/06; Maritime University of Szczecin: Szczecin, Poland, 2008. [Google Scholar]
  41. Duda-Gwiazda, J. Reliability of Marine Diesel Power Plants; Report RT-95/T-01; Centrum Techniki Okrętowej: Gdańst, Poland, 1995. [Google Scholar]
  42. Natvig, B. New light on measures of importance of system components. Scand. J. Stat. 1985, 12, 43–54. [Google Scholar]
  43. Gnedenko, B.V.; Belyayev, Y.K.; Solovyev, A.D. Mathematical Methods of Reliability Theory; Elsevier/Academic Press: Cambridge, MA, USA, 1969; ISBN 9781483230535. [Google Scholar]
  44. Fussell, J.B. How to Hand-Calculate System Reliability and Safety Characteristics. IEEE Trans. Reliab. 1975, 24, 169–174. [Google Scholar] [CrossRef]
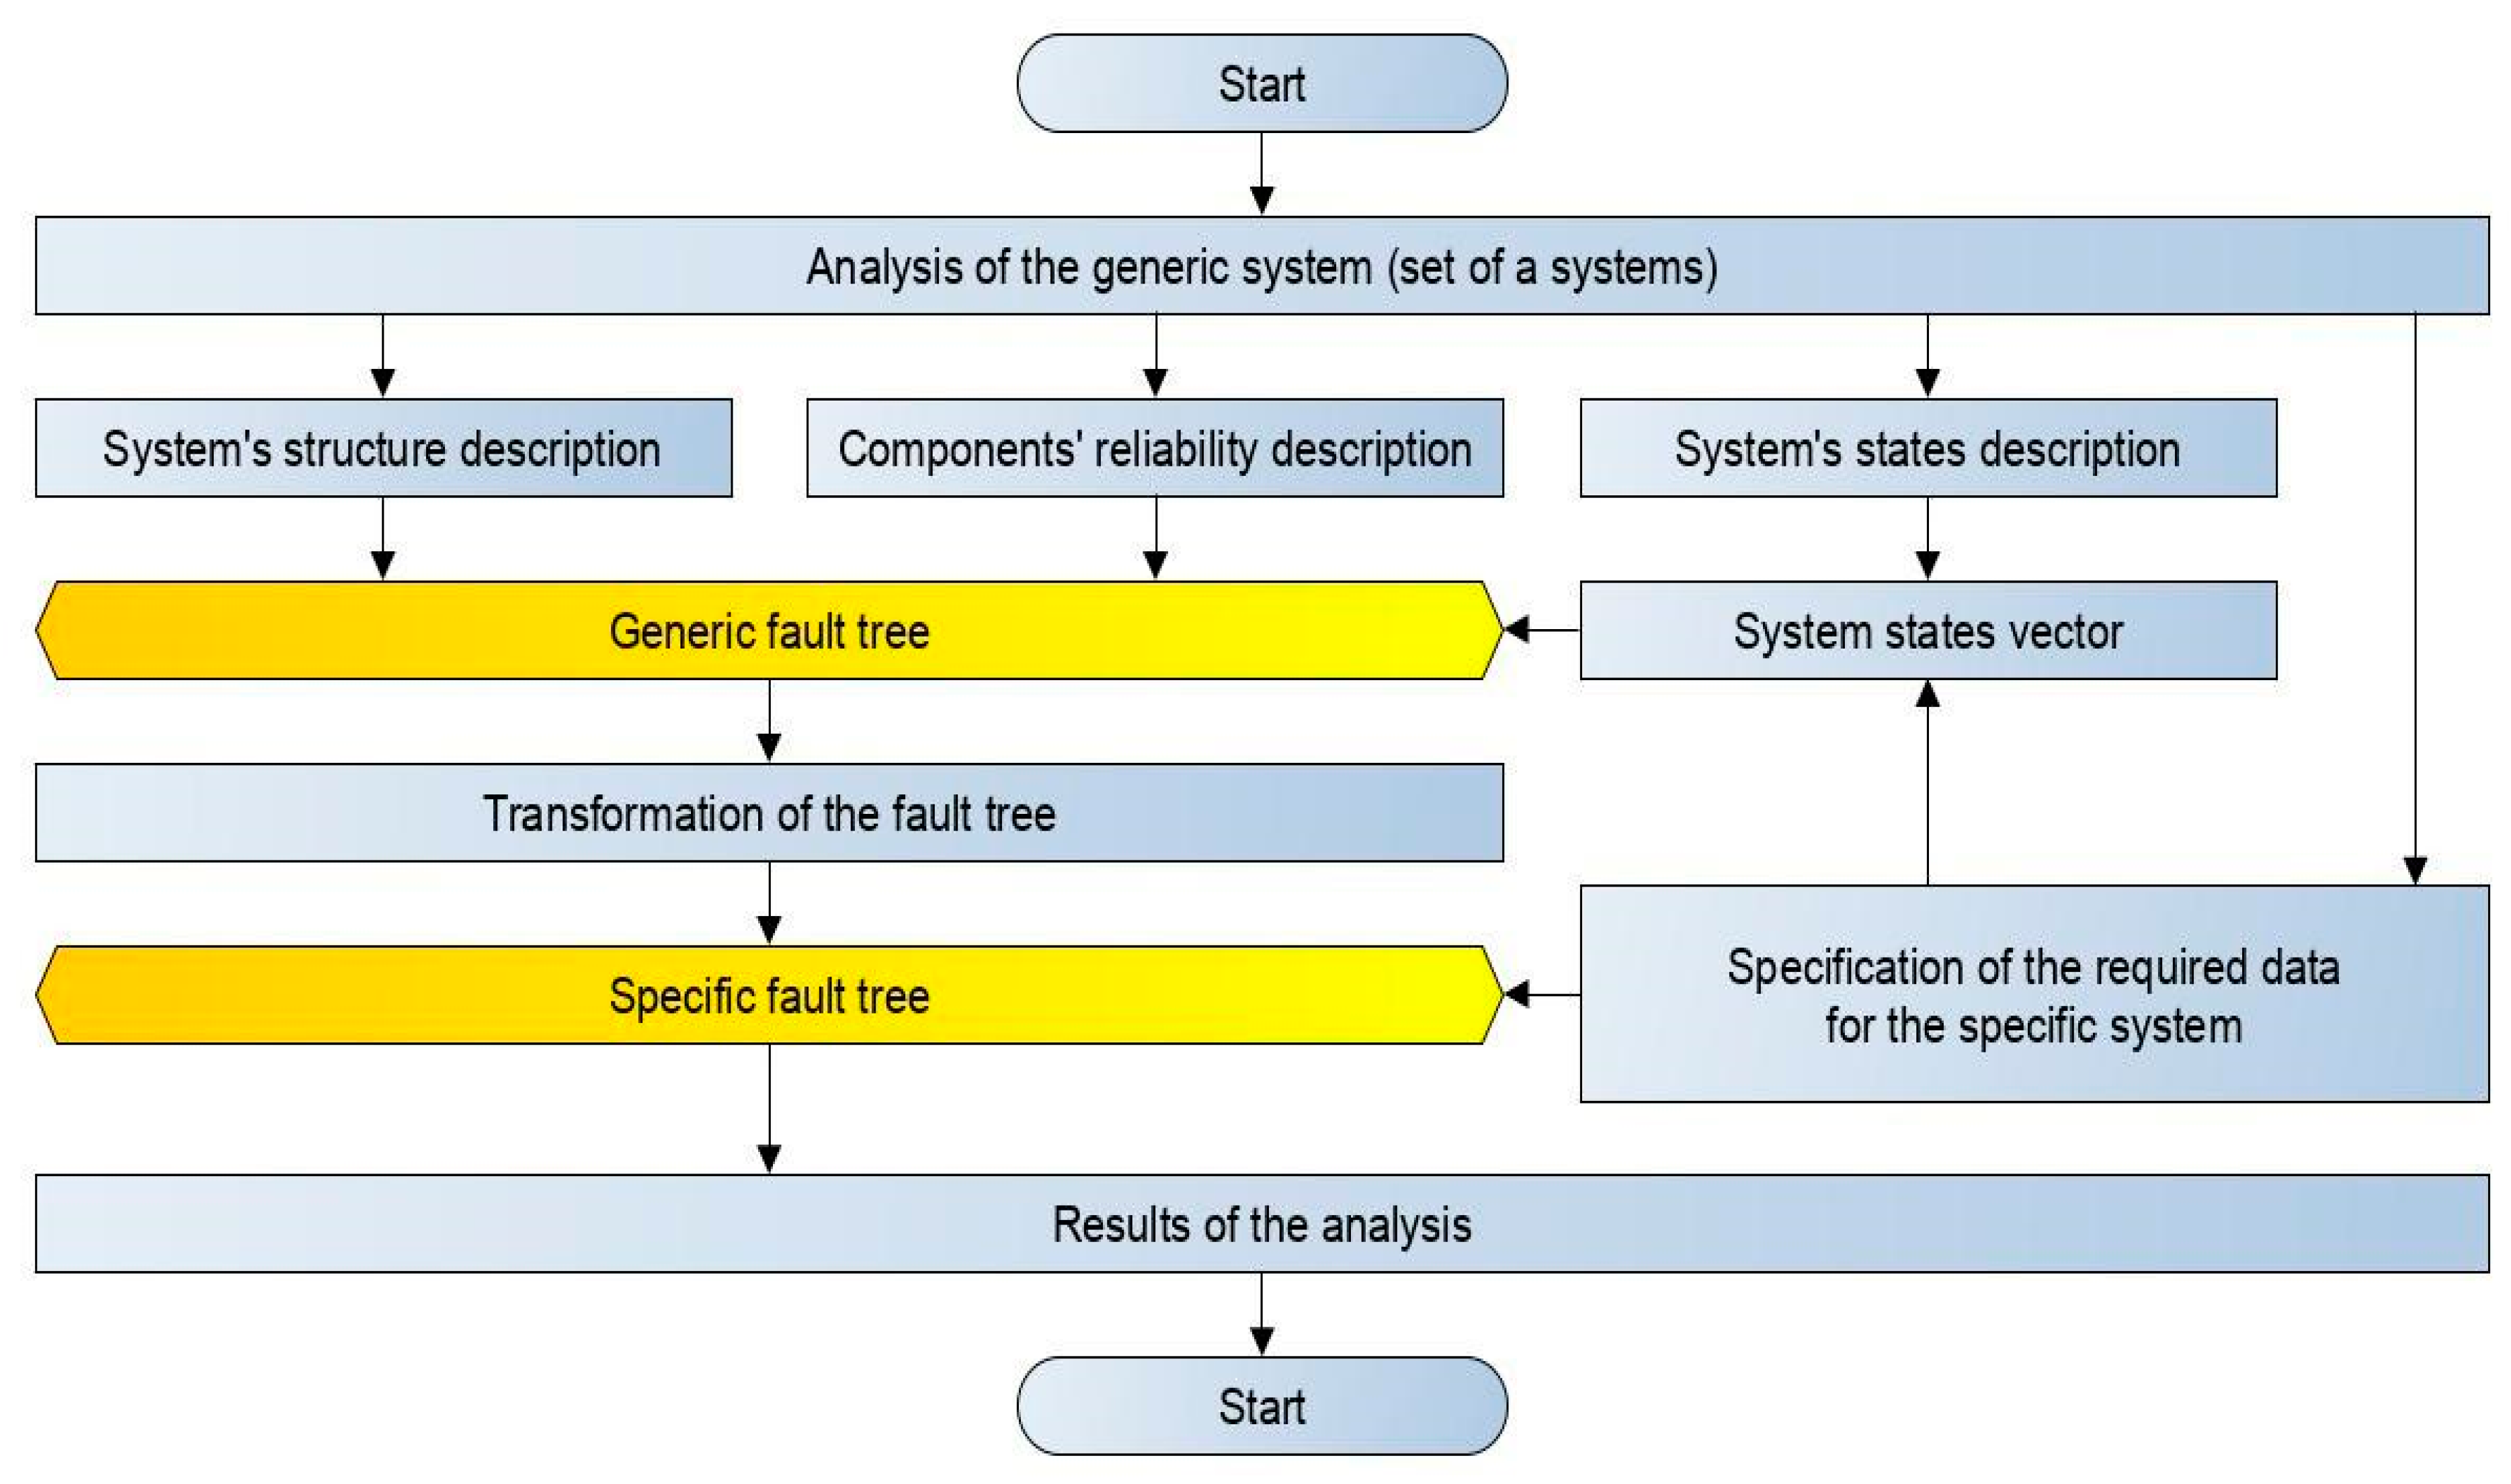
Figure 1. The process of analysis of a system with several operational states.
Information 11 00029 g001
Figure 2. The power system of a fishing vessel (modified by the author based on the document [40]).
Information 11 00029 g002
Figure 3. The interconnections between the fault trees.
Information 11 00029 g003
Figure 4. The main fault tree of a fishing vessel’s power system.
Information 11 00029 g004
Figure 5. The fault tree of a fishing vessel’s shaft lines.
Information 11 00029 g005
Figure 6. The fault tree of a fishing vessel’s power plant.
Information 11 00029 g006
Figure 7. The fault tree of a trawl winch driven by the main engine.
Information 11 00029 g007
Figure 8. The fault tree of the net winch driven by the main engine.
Information 11 00029 g008
Figure 9. The fault tree of the trawl winch and net winch driven by electrical sources.
Information 11 00029 g009
Figure 10. Estimated Vesely–Fussell measures indicating the importance of the main components of the system during a sea voyage.
Information 11 00029 g010
Figure 11. Estimated Vesely–Fussell measures indicating the importance of main system components during paying out and hauling in the nets.
Information 11 00029 g011
Figure 12. Estimated Vesely–Fussell measures indicating the importance on main system components when trawling.
Information 11 00029 g012
Figure 13. Estimated Vesely–Fussell measures indicating the importance of the main system components when staying at port or heaving to.
Information 11 00029 g013
Table 1. The characteristic of examples of simple events in the analyzed system [40,41].
SymbolType of FaultAvailability
a
[-]
Failure Rate λ
[10−6 h]
1Fault of a main propulsion engine and auxiliary systems supporting its operation0.9959070.0575
2The fault of an exhaust manifold of the main propulsion engine0.9995860.0082
3The fault of the charge exchange system (supercharging air filter, supercharging air cooler, turbocharger)0.9982210.0418
4The fault of the countershaft coupling to the engine (coupling locked)0.9999970.00033
5The fault of the transmission0.9997730.00429
6The fault of line shafting (countershaft and propeller shaft, stern bush bearing and seal);0.9999830.00291
7The fault of the screw propeller0.9999970.00033
8The fault of the screw propeller nozzle0.9999990.00002
9The fault of the alternating current (AC) shaft generator0.9999720.00044
10The fault of the direct-current (DC) shaft generator0.9999720.00044
11The fault of the pump no. 1 driven by the main propulsion engine through a transmission0.9991810.01769
12The fault of the pump no. 2 driven by the main propulsion engine through a transmission0.9991810.01769
13The fault of the hydraulic drive system (pump—engine) of the trawl winch driven by the main propulsion engine through the transmission;0.9998510.00882
14The fault of the transmission of the trawl winch driven by the main engine0.9997730.00429
15The fault of the head of the trawl winch driven by the main engine0.9999930.00111
16The fault of the hydraulic drive system (pump—engine) of the net winch driven by the main propulsion engine through the transmission;0.9998510.00882
17The fault of the transmission of the net winch driven by the main engine0.9997730.00429
18The fault of the head of the net winch driven by the main engine0.9999930.00111
13aThe fault of the electric motor of the trawl winch0.9991810.01749
14aThe fault of the transmission of the trawl winch driven by the main engine0.9997730.00429
15aThe fault of the head of the trawl winch driven by the main engine0.9999930.00111
16aThe fault of the electric motor of the net winch0.9991810.01749
17aThe fault of the transmission of the net winch driven by the main engine0.9997730.00429
18aThe fault of the head of the net winch driven by the main engine0.9999930.00111
19The fault of the seawater pump and its system0.9987870.02975
SACThe fault of the disengaging coupling of the AC shaft generator0.9997730.00429
SDCThe fault of the disengaging coupling of the DC shaft generator0.9997730.00429
SP1The fault of the disengaging coupling of the shaft pump no. 10.9997730.00429
SP2The fault of the disengaging coupling of the shaft pump no. 20.9997730.00429
SW1The fault of the disengaging coupling of the hydraulic pump of the trawl winch drive0.9997730.00429
SW2The fault of the disengaging coupling of the hydraulic pump of the net winch0.9997730.00429
SH1The fault of the disengaging coupling of the hydraulic motor of the trawl winch drive0.9997730.00429
SH2The fault of the disengaging coupling of the hydraulic motor of the net winch drive0.9997730.00429
SWLThe fault of the disengaging coupling of the ship’s driveshaft0.9997730.00429
xThe fault of the ancillary electrical and power unit0.9993390.01817
yThe fault of other current-using equipment0.9913350.19519
Table 2. Values of components’ Vesely–Fussell’s measure for system states (12)–(17).
ComponentExternal Events Vector
Equation (12)Equation (13)Equation (14)Equation (15)Equation (16)Equation (17)
10.231570.231570.228690.228690.195620.19562
20.023420.023420.023130.023130.019790.01979
30.100650.100650.099400.099400.085020.08502
40.000170.000170.000170.000170.000140.00014
50.012840.012840.012680.012680.010850.01085
60.000960.000960.000950.000950.000810.00081
70.000170.000170.000170.000170.000140.00014
80.00000-0.00000-0.00000-
90.001580.001580.001560.001560.001340.00134
10------
11----0.039140.03914
12----0.039140.03914
13----0.007120.00712
14----0.010850.01085
15----0.000330.00033
16----0.007120.00712
17----0.010850.01085
18----0.000330.00033
190.068630.068630.067770.067770.057970.05797
13a------
14a------
15a------
16a------
17a------
18a------
SAC0.012840.012840.012680.012680.010850.01085
SDC------
SH1----0.010850.01085
SH2----0.010850.01085
SP1----0.010850.01085
SP2----0.010850.01085
SW10.012840.012840.012680.012680.010850.01085
SW20.012840.012840.012680.012680.010850.01085
SWL0.000000.000000.012680.01268--
x0.037400.037400.036930.036930.031590.03159
y0.490250.490250.484140.484140.414120.41412
Table 3. Values of components’ Vesely–Fussell’s measure for system states (18)–(23).
ComponentExternal Events Vector
Equation (18)Equation (19)Equation (20)Equation (21)Equation (22)Equation (23)
10.191740.189760.178080.178080.209650.20965
20.019390.019190.018010.018010.021210.02121
30.083340.082480.077400.077400.091120.09112
40.000140.000140.000130.000130.000150.00015
50.010630.010520.009880.009880.011630.01163
60.000800.000790.000740.000740.000870.00087
70.000140.000140.000130.000130.000150.00015
80.00000-0.00000-0.00000-
90.001310.001300.001220.001220.001430.00143
10------
110.038370.037970.035630.03563--
120.038370.037970.035630.035630.041950.04195
13--0.006480.006480.007630.00763
14--0.009880.009880.011630.01163
15--0.000300.000300.000360.00036
16--0.006480.00648--
17--0.009880.00988--
18--0.000300.00030--
190.056820.056240.052780.052780.062130.06213
13a0.038370.037970.035630.03563--
14a0.010630.010520.009880.00988--
15a0.000330.000320.000300.00030--
16a0.038370.037970.035630.03563--
17a0.010630.010520.009880.00988--
18a0.000330.000320.000300.00030--
SAC0.010630.010520.009880.009880.011630.01163
SDC----0.011630.01163
SH10.01063-0.009880.009880.011630.01163
SH20.01063-0.009880.00988--
SP1-0.010520.009880.00988--
SP2-0.010520.009880.009880.011630.01163
SW1--0.009880.009880.011630.01163
SW2--0.009880.009880.011630.01163
SWL------
x0.030960.030650.028760.028760.033860.03386
y0.405910.401730.377000.377000.443830.44383
Table 4. Values of components’ Vesely–Fussell’s measure for system states (24)–(29).
ComponentExternal Events Vector
Equation (24)Equation (25)Equation (26)Equation (27)Equation (28)Equation (29)
10.209760.209760.199120.199120.210050.21005
20.021220.021220.020140.020140.021250.02125
30.091170.091170.086550.086550.091300.09130
40.000150.000150.000150.000150.000150.00015
50.011630.011630.011040.011040.011650.01165
60.000870.000870.000830.00083--
70.000150.000150.000150.00015--
80.00000-0.00000---
90.001440.001440.001360.001360.001440.00000
10-----0.00144
11----0.042030.04203
120.041970.041970.039840.039840.042030.04203
13--0.007250.00725--
14--0.011040.01104--
15--0.000340.00034--
16------
17------
18------
190.062170.062170.059010.059010.062250.06225
13a0.041970.041970.039840.03984--
14a0.011630.011630.011040.01104--
15a0.000360.000360.000340.00034--
16a------
17a------
18a------
SAC0.011630.011630.011040.011040.01165-
SDC0.011630.011630.011040.01104-0.01165
SH1--0.011040.01104--
SH2------
SP1----0.011650.01165
SP20.011630.011630.011040.011040.011650.01165
SW1--0.011040.011040.000000.00000
SW2--0.011040.011040.000000.00000
SWL----0.011650.01165
x0.033880.033880.032160.032160.033920.03392
y0.444070.444070.421540.421540.444670.44467