Article

Weakly Supervised Learning for Evaluating Road Surface Condition from Wheelchair Driving Data

1
Graduate School of Science and Engineering, Sophia University, 7-1 Kioi-cho, Chiyoda-ku, Tokyo 102-8554, Japan
2
Graduate School of Engineering, The University of Tokyo, 7-3-1 Hongo, Bunkyo-ku, Tokyo 113-8656, Japan
*
Author to whom correspondence should be addressed.
Information 2020, 11(1), 2; https://doi.org/10.3390/info11010002
Submission received: 27 November 2019 / Revised: 14 December 2019 / Accepted: 18 December 2019 / Published: 19 December 2019
(This article belongs to the Special Issue Machine Learning on Scientific Data and Information)

Abstract

:
Providing accessibility information about sidewalks for people with difficulties with moving is an important social issue. We previously proposed a fully supervised machine learning approach for providing accessibility information by estimating road surface conditions using wheelchair accelerometer data with manually annotated road surface condition labels. However, manually annotating road surface condition labels is expensive and impractical for extensive data. This paper proposes and evaluates a novel method for estimating road surface conditions without human annotation by applying weakly supervised learning. The proposed method only relies on positional information while driving for weak supervision to learn road surface conditions. Our results demonstrate that the proposed method learns detailed and subtle features of road surface conditions, such as the difference in ascending and descending of a slope, the angle of slopes, the exact locations of curbs, and the slight differences of similar pavements. The results demonstrate that the proposed method learns feature representations that are discriminative for a road surface classification task. When the amount of labeled data is 10% or less in a semi-supervised setting, the proposed method outperforms a fully supervised method that uses manually annotated labels to learn feature representations of road surface conditions.

1. Introduction

Providing accessibility information about sidewalks for people with difficulties with moving, such as older, mobility-impaired, and visually impaired people, is an important social issue. One solution to this issue using information and communication technology (ICT) is to develop an accessibility map as an extensive geographic information system (GIS) that provides accessibility information on sidewalks [1,2]. The concept of a personalized accessibility map (PAM) was proposed, which recommends an optimal route for people with difficulties in moving, considering accessibility information [3]. To collect accessibility information, Ponsard and Snoeck proposed a method where experts evaluate accessibilities of sidewalks from their images for each case [4]. Crowdsourcing methods to recruit information from volunteers were proposed by Hara [5] and Cardonha et al. [6]. These methods, however, depend on human labor and are impractical when collecting accessibility information in a huge area. Demir et al. summarized the state-of-the-art satellite image understanding approaches that recognize ground surface conditions [7]. Automatic approaches to detect unusual road conditions, such as potholes, using vehicle sensing data have also been reported [8,9]. Since these methods use satellite images or vehicle data, collecting sidewalk accessibility information, including subtle steps and slopes, is difficult. The development of a large-scale accessibility map requires an automated method that collects detailed road surface accessibility information.
Due to the further development of intelligent gadgets, such as smartphones and wristwatch-shaped vital sensors, the ability to sense human activities is improving [10,11]. Human activities measured by body-mounted vital sensors are recognized by applying machine learning [12,13]. Motivated by this background, we proposed a system that evaluates road surface conditions by applying machine learning to wheelchair accelerometer data [14]. Notably, wheelchair driving data can be collected extensively and are influenced by subtle road surface conditions.
In the conventional machine learning method, a large dataset with ground-truth labels is required to learn road surface conditions from accelerometer data. Manual annotation of the dataset depends on human labor, which is both expensive and impractical to collect extensively. This paper proposes and evaluates a novel method for estimating road surface conditions without human annotation by applying weakly supervised learning [15]. Our method uses positional information obtained while driving as low-cost weak supervision and does not depend on conventional human annotations. The positional information can be automatically collected with acceleration data during wheelchair driving and is semantically related to road surface conditions. As far as we know, no study has applied weakly supervised learning to collect information on road surface conditions, and the collected information represents detailed road surface conditions. The major contributions of this paper are as follows:
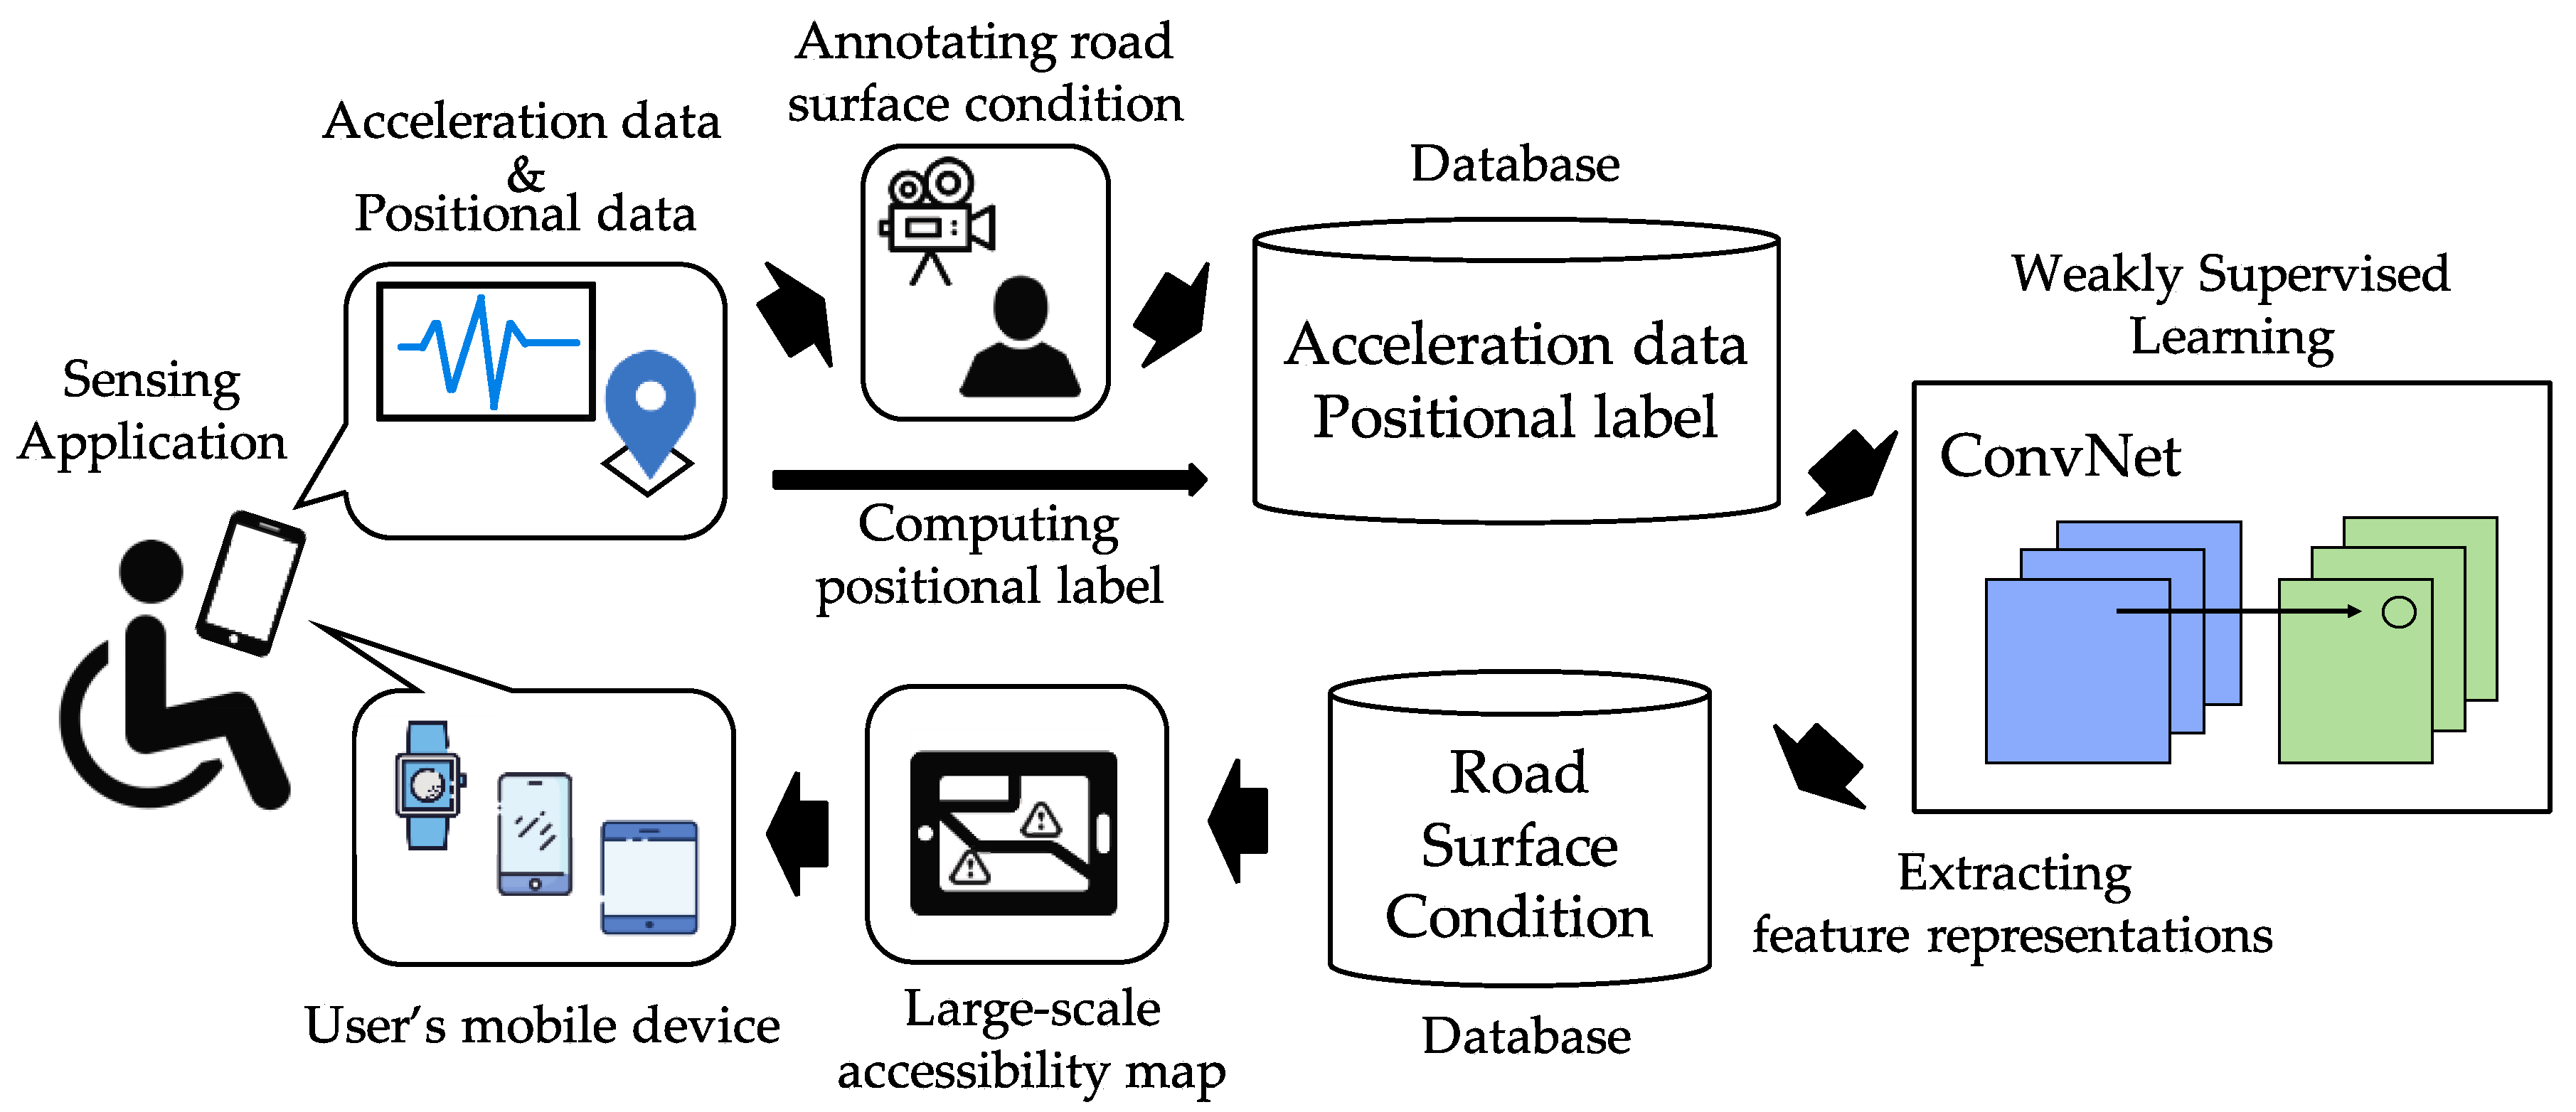
This paper proposes a novel method for evaluating road surface conditions via weakly supervised learning that uses wheelchair acceleration data and its positional information as weak supervision.
The proposed method is evaluated using actual wheelchair driving data. We applied a weak supervision design and visually demonstrate that the proposed method learns subtle and detailed representations of road surface conditions.
The representations that the proposed method learns were found to be discriminative for a road surface classification task. In a semi-supervised setting, the proposed method outperforms a fully supervised method that uses manually annotated labels to learn representations of road surface conditions.
The remainder of the paper is organized as follows: Section 2 summarizes the related work of this research. Section 3 describes the proposed system, the collection of the wheelchair driving dataset, and the methodology of the proposed weakly supervised learning design. In Section 4, we outline qualitative and quantitative evaluations of feature representations learned by the proposed model. Finally, Section 5 discusses the proposed method and concludes this paper.

2. Related Work

Various mobility support systems for people with difficulties moving have been proposed. Zimmermann-Janschitz provided a comprehensive synopsis of GIS applications for impaired people [16]. In Japan, Yairi and Igi proposed a GIS prototype to provide accessibility information for pedestrians [17]. This GIS consists of walking space network data. The network is composed of links and nodes; the links include information such as width, step, and transverse gradient of a walking route; the nodes connect the links with latitude/longitude information [18]. They expanded their research for practical use through on-site surveys in the community of the target area [19] and finally proposed a ubiquitous system to provide collected information on road conditions to users’ mobile terminals [20]. In the context of a navigation system for wheelchair users, Koga et al. developed a navigation system on smartphones using on-site surveys [21]. Although these mobility support systems are useful for impaired people, these systems depend on human labor, and collecting information on road surface conditions in a huge area is impractical. The following studies evaluated road surface conditions using automatic processing. High-resolution satellite images were used for land cover classification according to the physical condition of the ground surfaces such as agricultural land, grazing land, and barren areas [7,22,23]. Eriksson et al. applied a simple machine learning approach to detect potholes on road surfaces using accelerometer and geographical positioning system (GPS) sensor data of taxies [8]. Allouch et al. applied machine learning to detect depressions in road surfaces using the accelerometer and gyroscope data of vehicles [9]. Abnormal traffic conditions in cities were detected using rich sensor data such as accelerometer, GPS, and voice data from smartphones [24,25]. These methods can automatically collect information on road conditions; however, collecting subtle road surface conditions of sidewalks, such as slopes, curbs, and the roughness of a road surface, remains difficult. Therefore, we focused on wheelchair driving data that can be automatically collected and are influenced by the subtle condition of road surfaces.
The following research focuses on human activity recognition (HAR) and applies machine learning to human behavior data. Plötz et al. implemented feature learning based on principle component analysis (PCA) and the autoencoder model to extract features from human behavior acceleration data [12]. Zeng et al. and Yang et al. applied convolutional neural network (ConvNet) to recognize human activities using a dataset including daily activities and assembly work at a factory [26,27]. Jiang and Yin improved the learning efficiency of ConvNet by imaging the time-series data of human activities [28]. Rad and Furlanello used ConvNet to distinguish involuntary body vibrations due to illness from voluntary exercise [29]. Although various deep learning models, such as echo state networks (ESNs) and residual networks (ResNets), were proposed for the time-series classification task [30], ConvNet is one of the most effective models for HAR [13].
The weakly supervised learning [15] method and the unsupervised feature learning [31,32] method have been applied to various machine learning tasks to avoid human annotations. Oquab et al. proposed a weakly supervised method for object classification and object localization tasks that relies only on image-level labels for weak supervision, yet can learn from cluttered scenes containing multiple objects [33]. Agrawal et al. proposed a self-supervised visual feature learning method that trains a ConvNet model to predict the camera transition between pairs of images [34]. Owens et al. proposed a method that trains a ConvNet model to predict the statistical summary of the sound associated with a video frame [35]. Gidaris et al. also proposed a method that trains a ConvNet model to predict the two-dimensional (2D) rotation applied to the input image [36].
The following research applied weakly supervised learning or unsupervised learning to time-series data. You et al. analyzed weakly supervised dictionary learning that only relies on weak supervision that describes presence or absence in a set of data points [37]. Zhang et al. proposed a weakly supervised method to detect involuntary body vibrations due to illness from voluntary exercise [38]. Logeswaran and Lee proposed an unsupervised method to learn sentence representation by training a classifier that takes a sentence as input and predicts the context sentences from a sentence group [39]. Dau et al. introduced a semi-supervised technique to set the optimal parameter, w (warping window width), in dynamic time warping (DTW) on time-series clustering [40]. Although various research focused on weakly supervised and self-supervised feature learning methods, to the best of our knowledge, no research has applied positional information for weak supervision to human behavior data.
As Lara et al. and Liu et al. reported, extracting the influence of road surface conditions from raw acceleration data is challenging [41,42]; the observed wheelchair acceleration data must be converted into an index that represents the road surface condition. Fukushima et al. attempted to extract the user’s subjectivity to road surface conditions by converting wheelchair acceleration data into the vibration acceleration level (VAL) [43]; however, interpreting raw acceleration data is hard, and designing an index that represents only the factor of road surface conditions from raw data is extremely difficult. Nagamine et al. focused on the rowing action of manual wheelchair users and evaluated the degree of burden on the wheelchair users from the correlation between the peak-to-peak value of the acceleration data and the heartbeat data [44]. Iwasawa et al. proposed a machine learning method to represent road surface conditions in several discrete classes by classifying wheelchair acceleration data [45,46,47]. Takahashi et al. proposed a method to collect more detailed feature representations of road surface conditions than manually annotated labels from wheelchair acceleration data [48]. They trained a ConvNet model using wheelchair acceleration data with annotations of four classes of road surface conditions and extracted internal representation learned by the network. These methods were aimed at collecting road accessibility information from wheelchair acceleration data; however, these methods require human annotations. Takahashi et al. also focused on improving the efficiency of human annotations and proposed a method to automatically create ground-truth labels using map data and positional information while driving [49]. This method requires the manual creation of the information on road surface conditions linked to positional information, and the provision of large-scale accessibility information remains difficult. This paper proposes a weakly supervised learning approach to estimate road surface conditions without human annotations using wheelchair acceleration data and positional information while driving. The proposed method can provide road accessibility information in a huge area because wheelchair driving data can be automatically collected and are influenced by subtle road surface conditions.

3. Methodology

3.1. Proposed System

The simplest type of accessibility visualization using human sensing is the use of wheelchair trails [50]. Wheelchair trails provide practical information for wheelchair users regarding wheelchair accessible roads and facilities. Although the information is useful, it is not sufficient for all wheelchair users. The trail approach indicates if someone could travel in a location; however, wheelchair users may have different mobility and accessibility requirements. The physical abilities of wheelchair users are more diverse than generally imagined; some users are trained like Paralympic athletes, whereas others may damage their bodies with only a few wheelchair vibrations. Critical information for wheelchair users includes the physical state of the road surface, such as the angle of a slope, the height of a curb, and the roughness of a road surface. This information about the physical state of the road surface helps all people with mobility difficulties as well as wheelchair users to make decisions about access/avoidance of a road according to their physical conditions and abilities. The information about the physical state of the road is therefore the foundation of road accessibility. We hereafter refer to the physical state of a road as road surface condition and the information about the physical state of a road as road accessibility information.
Figure 1 shows an overview of the proposed system. Acceleration data and positional data of a wheelchair are measured by a sensing application downloaded on the user’s mobile device or installed in the wheelchair. Road surface condition labels, which are the conventional supervision, are manually annotated based on videos recorded while driving, and positional labels, which are the proposed weak supervision, are automatically computed from positional data. After training a ConvNet model, feature representations corresponding to the acceleration data are extracted from the network. ConvNet is one of the deep learning models [51] that effectively recognizes human activity data, including acceleration data [27]. The extracted features are analyzed and accumulated as accessibility information. Accessibility information is visualized on a map to create an accessibility map, and, finally, the accessibility map is provided on the mobile devices of users. The proposed method does not depend on road surface condition labels; our method uses only positional labels to train a ConvNet model.

3.2. Dataset

The actual wheelchair driving data were collected to evaluate the proposed method. A total of nine wheelchair users, including six manual wheelchair users (M1–M6) and three electric wheelchair users (E1–E3), participated in the experiment. The participants traveled about 1.4 km of the specified route (shown in Figure 2) around Yotsuya station in Tokyo. This route was carefully designed to include various road surface conditions to evaluate the generalization performance of the proposed method for common roads. Wheelchair movements were measured by a three-axis accelerometer (iPod touch 4th generation, Apple Inc., Cupertino, CA, USA) installed in the lower part of the wheelchair seat, and positional data were measured using the quasi-zenith satellite system (QZSS). One quasi-zenith satellite was under experimental operation when the experiment was conducted from November to December 2012. Acceleration data of the x, y, and z axes of the accelerometer were sampled at 50 Hz, and a total of 1,341,602 samples (about 7.5 h) were obtained. To confirm the circumstances when the acceleration data were measured, a video was recorded for both participants’ driving state and the road surface conditions. Most of the entire route was a standard sidewalk, and a part of the course was a crosswalk. If a user did not experience problems when moving up and down wheelchair ramp slopes, an excessive burden on the body and risk of an accident were considered minimal.
Each participant drove the route in three laps; they drove clockwise from the start point to the goal point for the first and third laps and drove counterclockwise for the second lap. The slope and the gentle slope that were ascending clockwise in Figure 2 were ascending for the first and third laps and descending for the second lap. The route consisted of following 11 general road surface conditions: gravel pavement (GRAV), tile pavement (TILE), block pavement-1 (BLK-1), block pavement-2 (BLK-2), concrete pavement-1 (CONC-1), concrete pavement-2 (CONC-2), curb (CURB), ascending slope (ASC-SLP), descending slope (DESC-SLP), gentle ascending slope (GENT-ASC-SLP), and gentle descending slope (GENT-DESC-SLP). These surfaces contained transverse gradients, local pavement irregularities, and intermittent slopes. Since the experiment was conducted in an ordinary environment, random external influences existed other than road surface conditions, such as pedestrians, passing bicycles, and traffic signals.

3.3. Generating Weak Supervision from Positional Information

This section describes the methodology to generate a positional label set for weak supervision. In the task of weakly supervised feature learning, determining what information to use for supervision is an important factor that affects the learning performance. We attempted to use a novel method incorporating positional information during wheelchair driving as weak supervision. The major reasons we chose positional information are as follows: Positional information while driving can be automatically collected, enabling the low-cost generation of a label set. Since adjacent road surfaces have similar conditions, our model effectively learns feature representations of road surface conditions by being trained to predict the position of the input acceleration data. For the positional information in this paper, we confirmed the position where the acceleration data were measured by visually observing the experiment video and provided positional data (latitude, longitude) for each acceleration data sample using Google Maps (Google LLC, Mountain View, CA, USA). Although the QZSS positional data were measured in the experiment, we used these manual positional data to correct errors included in the QZSS positional data. The procedure for generating weak supervision from positional data is explained, from Steps 1 to 3.
Step 1: Dividing the earth’s surface into a mesh shape. The earth’s surface was divided into a mesh shape, as shown in Figure 3a. The objectives of dividing the earth’s surface are to aggregate adjacent road surfaces into one group and to create discrete classes to formulate our position prediction task as a classification problem. The method for dividing the earth’s surface into a mesh shape is seen in an attempt to construct a new GIS [52]. The width of each grid created by the mesh is uniform in both the vertical and horizontal dimensions; hence, the area of each grid is the square of the grid width. The grid width was adopted as 3, 4, and 5 m because a grid width under 5 m can distinguish sidewalks on both sides of a road with two or more lanes based on the Road Structure Ordinance prescribed in Article 29 of the Road Act in Japan [53]. The comparison of grid width conditions is shown in Section 4.
Step 2: Targeting only the grids that cover the driving route. Only the grids that covered the driving route were used as target grids, as shown in Figure 3b. The target grids were the sidewalks or crosswalks that were driven by any participant during the experiment.
Step 3: Assigning positional label to all acceleration data sample. A unique number was assigned to each grid of the target grids, as shown in Figure 3c. These assigned numbers are the identification (ID) of each grid. Then, these IDs were assigned to all acceleration data samples. The grid to which each sample belonged was identified by its positional data. These assigned IDs are the positional label set and are used as weak supervision for acceleration data. Through these steps, the same class is assigned to the adjacent road surface; therefore, the ConvNet model is considered to effectively learn feature representations of road surface conditions.

3.4. Training ConvNet to Predict the Position from Acceleration Data

3.4.1. Preprocessing

As a denoising preprocess, a simple moving average (SMA) with a length of five was processed for the entire acceleration dataset. Then, the acceleration dataset was normalized to have a zero mean and unit standard deviation in each axis. To input acceleration data to a ConvNet model, the acceleration data were segmented into 29,727 examples using a sliding window [54]. The window size was fixed to 450 (about nine seconds) with 90% overlap. The window size and the overlapping percentage were selected to be adapted for the dataset following the procedure published previously [49], which applied machine learning for wheelchair acceleration data. As shown in Table 1, the number of classes and the positional label set vary according to the grid width condition. The true positional label of each segmented example was determined by the most-frequently occurring label in the example.

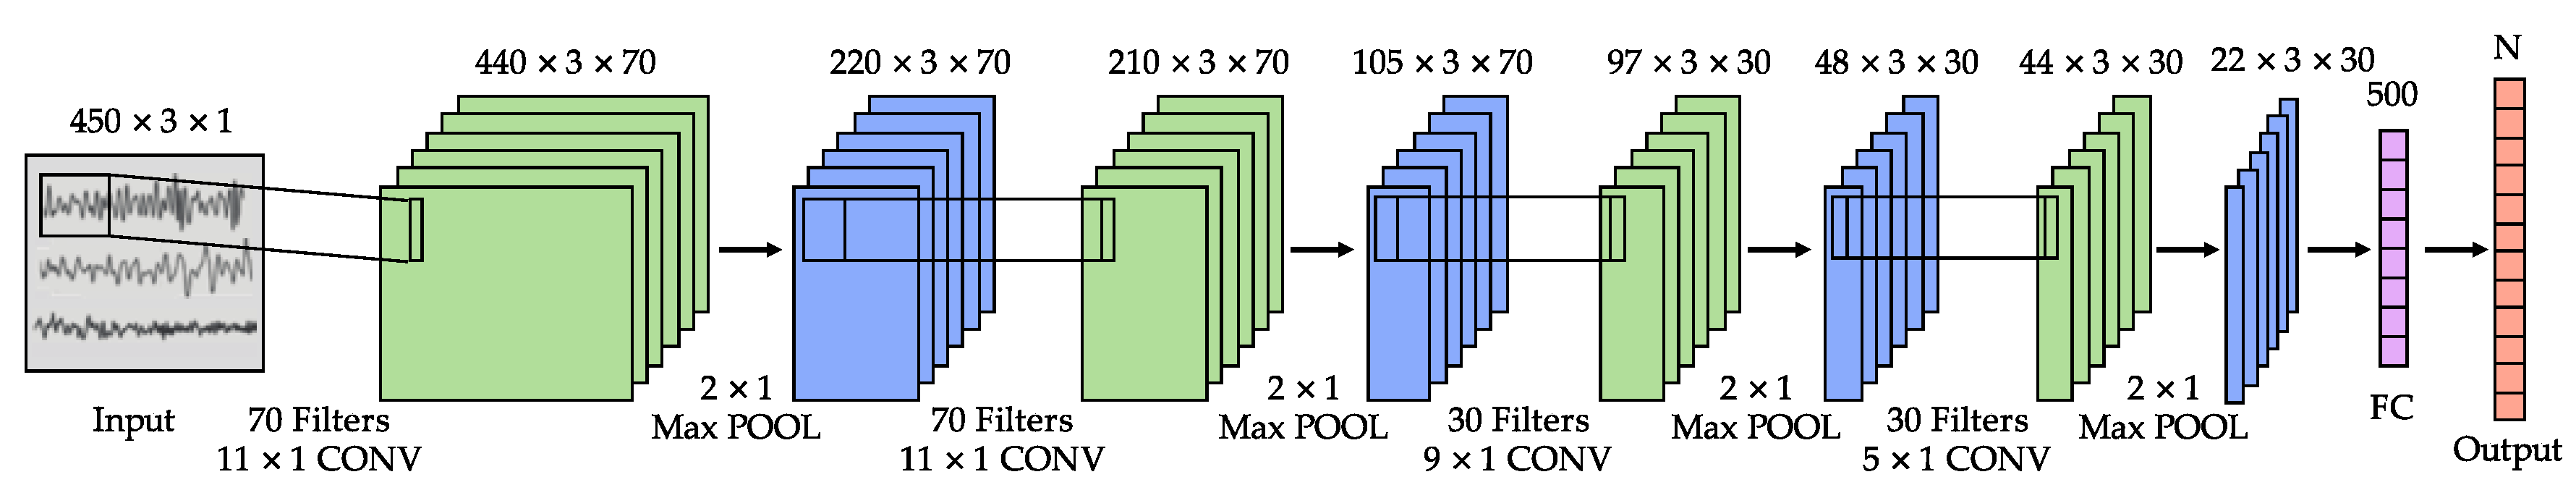
3.4.2. The Proposed ConvNet Model

Figure 4 shows the network architecture of the proposed ConvNet model. The network is composed of seven layers: an input layer, four convolution layers, one fully connected layer, and an output layer. The convolution layer consists of a convolution, a rectified linear unit (ReLU) function, and max-pooling processing. The fully connected layer consists of 500 units fully connected and a ReLU function. The output layer is governed by a SoftMax function that has N classes. The network has dropout layers after every convolution layer and fully connected layer. The dropout percentage is set to 20%, 30%, 30%, 40%, and 50% from the top to the bottom layer. This network follows the relevant research for recognizing human activity acceleration data [18] and is based on prior work [50] that used wheelchair acceleration data. For other settings, the adaptive moment estimation (ADAM) [55] was used as an optimizer, and the learning rate was set to 0.0001. The training dataset was divided into 90% training data and 10% validation data using stratified splitting. The network was trained until the categorical cross-entropy loss of validation data stopped decreasing. We hereafter refer to this ConvNet model trained on the weakly supervised task to predict position as the PosNet model.

3.4.3. Position Prediction

The result of the position prediction task of PosNet was compared to that using another machine learning method. The grid width was temporarily fixed to 5 m. The accuracy of the proposed model was 11.2%. As a comparison of the proposed model, fast Fourier transform (FFT) frequency components of each axis of each example were calculated and classified by logistic regression using a lbfgs solver. The regularization parameter, C, was chosen in the range of 10−5 to 105 using five-fold cross-validation to maximize the accuracy. The accuracy of the logistic regression was 5.86%. The pure chance was 0.32% in this case. The accuracy of these models is the mean of the total of nine trials obtained using a leave-one-subject-out (LOSO) methodology [56]. LOSO verifies the performance for unknown users by evaluating a model with a dataset of a user who was not included in the training data. Because wheelchair acceleration data reflect user characteristics, including physical abilities and rowing patterns, it is crucial to evaluate the generalization performance of the model for unknown users. In this study, the model was trained repeatedly with a dataset of eight users as a training dataset, and the trained model was tested with the dataset of the remaining one user. Although the score is low, the purpose of training the PosNet model with weak supervision was to learn feature representations of road surface conditions and accumulate them in the network. This absolute score is not important for evaluating the model.

4. Results

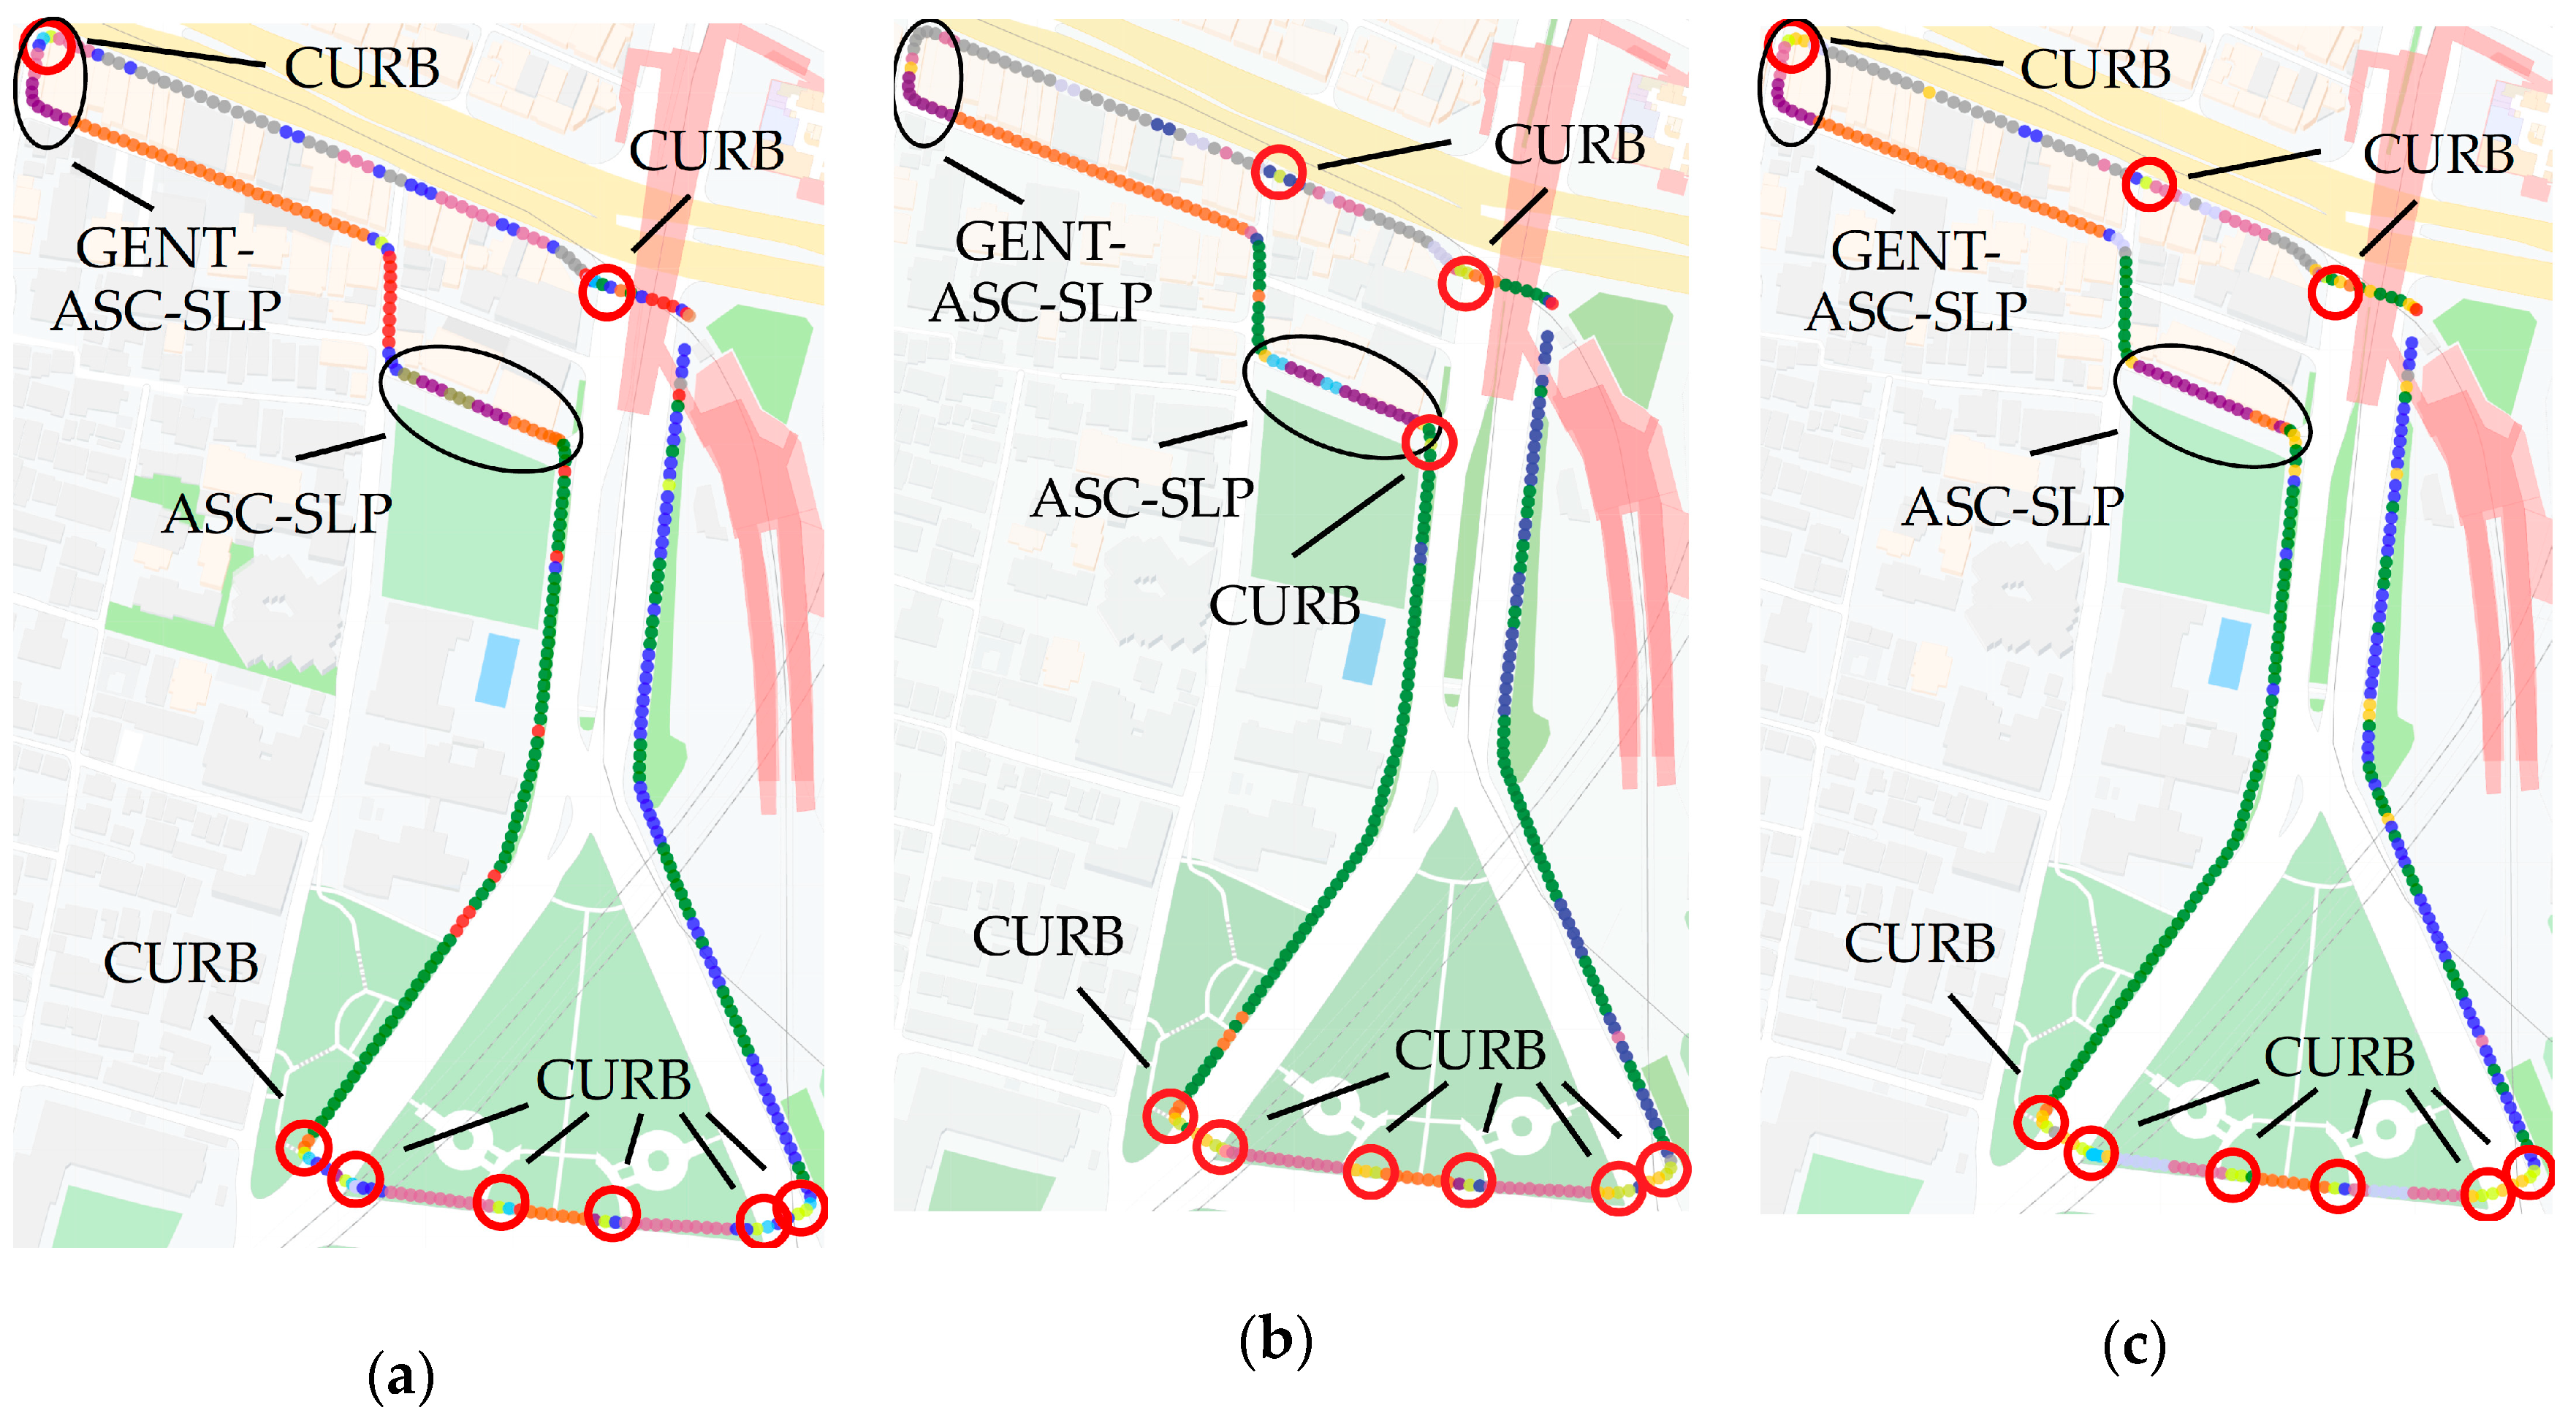
4.1. Qualitative Evaluation of the Learned Representation

4.1.1. Evaluation Procedure

This section provides a qualitative and quantitative evaluation of the representations of road surface conditions learned by the proposed model. The learned representation is first qualitatively evaluated. The qualitative evaluation procedure is explained, from Steps 1 to 4.
Step 1: Obtaining feature representations learned by PosNet. The PosNet model was trained with the training dataset. The test dataset was input to the trained network, and the activation of 500 units of the fully connected layer was obtained. This activation is a set of feature vectors and is the internal representation learned by the model from the input acceleration data. Since PosNet was trained using LOSO, nine results of nine trials were obtained. Each trial used a dataset of each wheelchair user (M1–M6 and E1–E3) as a test dataset; M1–M6 were manual wheelchair users and E1–E3 were electric wheelchair users. We hereafter refer to each result of the trials as M1–M6 and E1–E3.
Step 2: Clustering analysis of the obtained feature representations. The clustering was performed for each feature vector set to evaluate how well the learned representation conveys the road surface condition information. The 500-dimensional feature vectors were reduced to the dimension where the cumulative contribution ratio exceeded 80% using principal component analysis (PCA) [57]. The k-means algorithm was used as a clustering method. The number of clusters, k, is arbitrary in the k-means algorithm, and the clustering result changes depending on the specified parameter, k. In this study, the number of clusters was specified in the range of 3 to 20, and each clustering result was observed.
Step 3: Visualizing the clustering result on a map. The clustering results were color-coded for each cluster. The color-coded feature vector was plotted on the position of the input acceleration example on Google Maps (Google LLC, Mountain View, CA, USA) to be compared with the actual road surface conditions. Since input acceleration examples were dense, every third acceleration example was plotted on the map. The plot results were visually observed to analyze the type of road surface condition represented by each cluster. Table 2 shows the correspondence of a title and a color code of the main colors.
Step 4: Exploring the quality of the learned representation. The quality of the learned representation under each grid width condition was analyzed by comparing the plot results of Step 3, and the most suitable grid width was selected. The plot result with the best grid width condition was compared with the result of a fully supervised ConvNet model that was trained with conventional manual annotations.

4.1.2. Analysis of Grid Width Condition

The clustering results under the grid widths of 3, 4, and 5 m were evaluated by visually observing their plots. Figure 5 shows the visualization of the first lap of the clustering result of M1. The number of clusters, k, was set to 16. ASC-SLP and part of GENT-ASC-SLP were clearly grouped into the purple cluster when the grid width was 4 or 5 m. When the grid width was 3 m, ASC-SLP was not grouped as clearly as under the other grid width conditions. For every grid width condition, the exact locations of curb points were grouped into specific clusters. With the 3 m grid width condition, eight curb points were grouped into the yellow-green cluster or the light blue cluster. With the 4 m grid width condition, nine curb points were grouped into the yellow-green cluster. With the 5 m grid width condition, nine curb points were grouped into the yellow-green cluster or the light blue cluster. For other pavement types, GRAV was grouped into the green and blue clusters; BLK-1 and CONC-1 were grouped into the green cluster; CONC-2a and part of CONC-2b were grouped into the orange cluster; most of BLK-2 was grouped into the grey cluster. TILE was grouped into one cluster with grid widths of 3 and 4 m and was separated into two clusters with the 5 m grid width condition. CONC-2b was divided into two clusters by the T-junction under any grid width condition, and the assigned clusters were different for the different grid widths. This overall clustering tendency was observed in all nine dataset patterns. The visualization of E1 is shown in Figure A1.
The most crucial difference was observed for ASC-SLP with different grid width conditions. One cluster was assigned to ASC-SLP when the grid width condition was 4 or 5 m, whereas multiple clusters were assigned under the 3 m grid width condition. This observation demonstrates that when the grid width is narrow, the changes in wheelchair driving state in a small area are precisely learned. Two clusters were assigned to TILE only when the grid width was 5 m. This demonstrates that the proposed model precisely learns slight changes in the unevenness of the tile pavement and transverse gradients of the road when the grid width is large. Wheelchair driving state is affected by a variety of external factors, including road surface conditions, pedestrians, passing bicycles, and passing cars. When the M1 participant was driving on ASC-SLP, they meandered to avoid a car coming from the front. When the grid width is narrow, the small state changes caused by factors other than road surface conditions are learned in detail. When the grid width is large, slight differences in road surface conditions are precisely learned because the road surface conditions are continuous and generally in a similar state in an adjacent range. Although changes in road surface conditions within a small range, such as curbs, are expected to be difficult to learn when the grid width is large, more curb points were captured under the 5 m grid width condition because the whole wheelchair movements, including areas around a curb point, are effectively learned since wheelchair users decelerate and accelerate before and after a curb.
The clustering results under the 5 m grid width condition were evaluated in detail by visually observing their plots for each lap. Figure 6 shows the visualization of the clustering result of M2 under the 5 m grid width condition. The number of clusters, k, was set to 16. The ASC-SLP of both the first and third laps were clearly grouped into the purple cluster, and GENT-ASC-SLP in both the first and third laps were grouped into the light purple cluster. DESC-SLP and part of GENT-DESC-SLP for the second lap were grouped into the light green cluster. The exact locations of the most curb points were grouped into the yellow-green cluster on every lap. For other pavement types, GRAV and CONC-1 were grouped into the blue cluster for every lap, and most parts of CONC-2b were grouped into the green cluster for every lap. Although the clustering result of GRAV and CONC were similar for every lap, the clustering tendency of TILE, BLK-1, and BLK-2 were different depending on the driving direction. This overall clustering tendency was observed in all nine dataset patterns.
These observations demonstrate that the PosNet model learns feature representations of subtle and detailed road surface conditions. ASC-SLP and DESC-SLP were grouped into separate independent clusters, although the same position label was assigned to the adjacent road regardless of the driving direction. This result shows that the model effectively learned representations of the differences between the ascending gradient and the descending gradient. ASC-SLP and GENT-ASC-SLP were grouped into separate clusters. This result shows that the model learned representations of slight differences in gradient. The exact points of most CURB were grouped into the same cluster for any lap. This result shows that the model learned representations of wheelchair driving patterns over curbs. As a summary of the clustering results of three laps, all 12 curb points were detected. The same pavement types were roughly grouped into the same cluster, and the different pavements tended to be grouped into different clusters. This result shows that the model learned representations of detailed differences in the road surfaces.

4.1.3. Comparison with Fully Supervised Method

The representations learned by the PosNet model on the weakly supervised task and the representations learned by a fully supervised ConvNet model were compared. To ensure the comparison was as fair as possible, the same ConvNet architecture was trained, except the fully supervised ConvNet used manually annotated road surface condition labels. Road surface condition labels have four classes: moving on slopes, climbing on curbs, moving on tactile indicators, and others. Each category represents typical road surface conditions: a continuous gradient, an abrupt step, a continued unevenness, and other conditions, respectively. These labels were created by visually observing the participants and the road surface conditions over the whole experiment video. To predict the road surface condition labels, the output layer of the fully supervised ConvNet model was replaced to predict four classes.
Figure 7 shows the visualization of the clustering result of M3 of the PosNet model and the fully supervised ConvNet model. The number of clusters, k, was set to 16. The overall results show a similar clustering tendency; however, notable differences were observed on the slope road surface condition. For the weakly supervised result, ASC-SLP and GENT-ASC-SLP were grouped into the purple and the light purple cluster, respectively, and DESC-SLP was grouped into the light green cluster. For the fully supervised result, both ASC-SLP and GENT-ASC-SLP were grouped into the purple cluster, and DESC-SLP was not grouped into a specific cluster. This observation demonstrates that the weakly supervised method effectively learned representations of slight differences in the degree of ascending gradient. The weakly supervised method learned representations of descending gradients but the fully supervised method did not. Tactile indicators that were manually annotated in the fully supervised method were not grouped into a specific cluster in both methods. This overall clustering tendency was observed in all nine dataset patterns, and no significant difference was found in the clustering tendency of curb points. The visualization of E2 is shown in Figure A2. These observations demonstrate that the weakly supervised method learned rich representations of road surface conditions, such as degree of slope. This result validates the effectiveness of the positional labels. The reason the weakly supervised method learned rich representations of road surface conditions is that the simple assumption that adjacent road surface conditions are in the same state enabled the network to flexibly learn various road surface conditions. The result also suggests the difficulty of defining road surface condition labels using human annotation because road surface conditions are diverse and consecutively transition along a road.

4.2. Quantitative Evaluation of the Learned Representation

The PosNet model was found to learn rich feature representations of subtle and detailed road surface conditions through clustering evaluations. This section quantitatively evaluates the usefulness of the learned representation for recognizing general road surface conditions.

4.2.1. Implementation Details

The feature representation learned by PosNet was evaluated on a road surface classification task and compared with other machine learning methods. Four road surface condition classes—moving on slopes (Slope), climbing on curbs (Curb), moving on tactile indicators (TI), and others (Oths)—were predicted during the classification task. Since the fully connected layer of the PosNet model has 500 units, 500-dimensional feature vectors of each input example of acceleration data were obtained. This feature set was normalized to have a zero mean and unit standard deviation. A support vector machine (SVM) with radial basis function (RBF) kernel and a multilayer perceptron (MLP) model were used to classify the feature set to the four classes. The regularization parameter, C, in the range of 10−2 to 104 and the kernel coefficient parameter, γ, in the range of 10−4 to 102 of SVM were chosen using five-fold cross-validation to maximize the macro F-score. Since Oths represented nearly 77% of the dataset, the parameter, C, for each class was adjusted to inversely proportional weight to class frequencies in the training data to handle the class imbalance problem. The MLP model was composed of four layers: an input layer, two fully connected layers, and an output layer. The fully connected layer consisted of 500 units fully connected and a ReLU function. The output layer was governed by a SoftMax function and had four classes. The network had 50% dropout layers after every fully connected layer. The network was trained until the categorical cross-entropy loss of validation data stopped decreasing. The loss function was adjusted to inversely proportional weight to class frequencies in the training data. These classifiers were trained on the obtained feature vectors over the training data of the PosNet model and then tested with the feature vectors of the test data predicted by the trained PosNet model.
For comparisons with the proposed method, we evaluated six other methods. The first method (Raw + k-NN) used raw acceleration data as a feature set and used a k-nearest neighbor (k-NN) as a classifier. Segmented three-axis acceleration examples were concatenated to 1350-dimensional vectors and were input to the classifier. The second method (MV + k-NN) used the mean and the standard deviation (MV) of each axis of each segment as a feature set and used k-NN as a classifier. The parameter, k, of k-NN of these two methods was chosen in the range of 1 to 30 using five-fold cross-validation to maximize the macro F-score. The third and fourth methods used rich heuristic features as a feature set. The following 12 type of values of each axis of each segment were computed as heuristic features: mean, standard deviation, maximum, minimum, zero crossing, mean of the difference, standard deviation of the difference, maximum of the difference, minimum of the difference, FFT frequency component, energy of the FFT frequency component, and entropy of the FFT frequency component. FFT was implemented with a sampling frequency of 50 Hz. The heuristic features were classified by SVM (Heuristic + SVM) and MLP (Heuristic + MLP). The final comparison methods used a ConvNet model. The hyperparameters, the architecture, and all other settings except for the dimension of the output layer were the same as the PosNet model to ensure the fairness of the comparison. The fully connected layer of the trained model was activated and was normalized to have a zero mean and unit standard deviation. This activation was classified by SVM (ConvNet + SVM) and MLP (ConvNet + MLP). The method of hyperparameter searching for SVM, the architecture of MLP, and all other settings of the classifiers of the third, fourth, and final comparison methods were the same as the experiment of the proposed method to facilitate comparison. The methods were evaluated using the LOSO method, and the mean macro F-score and the mean accuracies of the nine trials were compared.
Motivated by previous research [18,58], a simple smoothing method was implemented to post-process the predicted labels to enhance the prediction performance of the classifiers. Since the adjacent road surface conditions are in a similar state, the sample labels have a smooth trend. This smoothing method employs a low-pass filter to remove the impulse noise and maintain the edges. The impulse noise is a potential incorrect prediction, and the edges, in this case, are the transition in the road surface conditions. For the ith example, a smoothing filter with length, u, was applied on the sequence whose center was the ith example. The predicted probabilities of the sequence were averaged for each class, and the class with the highest probability was assigned to the ith example.

4.2.2. Comparison Result

Table 3 compares the classification performance of the proposed models against the other methods. For the setting without smoothing, the proposed methods outperformed the four machine learning methods, including rich heuristic feature methods. Comparing two classifiers, SVM and MLP, MLP always outperformed SVM in terms of F-score. Only the accuracy of Heuristic + SVM outperformed Heuristic + MLP. The proposed method (PosNet + MLP) performed better than Raw + k-NN, MV + k-NN, and Heuristic + MLP in terms of both F-score and accuracy. PosNet + MLP outperformed Heuristic + MLP by 3.7 points in F-score and 2.2% in accuracy. The deep model (ConvNet + MLP) outperformed all other methods in terms of both F-score and accuracy. Comparing the prediction results of manual wheelchair data and electric wheelchair data, the electric wheelchair data tended to be classified more accurately in terms of both F-score and accuracy in every method.
The filter length, u, of the smoothing method was chosen in the range of 3 to 11 by evaluating its effect on PosNet + MLP. The per-class F-scores of Oths and Curb most improved when u was nine. The per-class F-score of Slope was most improved when u was 11. When u was three, the per-class F-score of TI was the most improved. The macro F-score, which is an unweighted mean of the per-class scores, was highest when u was seven. This result shows that a long filter is effective for predicting road surface conditions that are continuous over a long distance, whereas a short filter is useful for predicting road surface conditions that appear intermittently. The with-smoothing scores in Table 3 show the results when u is seven. The smoothing filter improved both of F-score and accuracy of most methods. In particular, the F-score and the accuracy of PosNet + MLP improved by one point and 2%, respectively. The F-score and the accuracy of ConvNet + MLP were improved by 2.6 points and 1.7%, respectively. When the base scores were not sufficient as Raw + k-NN, Heuristic + SVM, and Heuristic + MLP, the smoothing filter did not improve their F-score values.
Table 4 shows the per-class classification performance of the proposed models against comparison methods without smoothing post-processing. The scores of the dominant class Oths were the highest amongst the four classes. The proposed method (PosNet + MLP) outperformed the other machine learning baseline methods: Raw + k-NN, MV + k-NN, and Heuristic + MLP, in Slope, Curb, and Oths in terms of F-score. In terms of precision, the proposed method (PosNet + MLP) outperformed the other machine learning baseline methods: Raw + k-NN, MV + k-NN, and Heuristic + SVM, in Slope, Curb, and Oths. The deep model (ConvNet + MLP) received the highest scores in all classes in terms of F-score. The F-scores and the precision scores in Slope and Oths of the proposed method (PosNet + MLP) were close to those of the deep model (ConvNet + MLP).

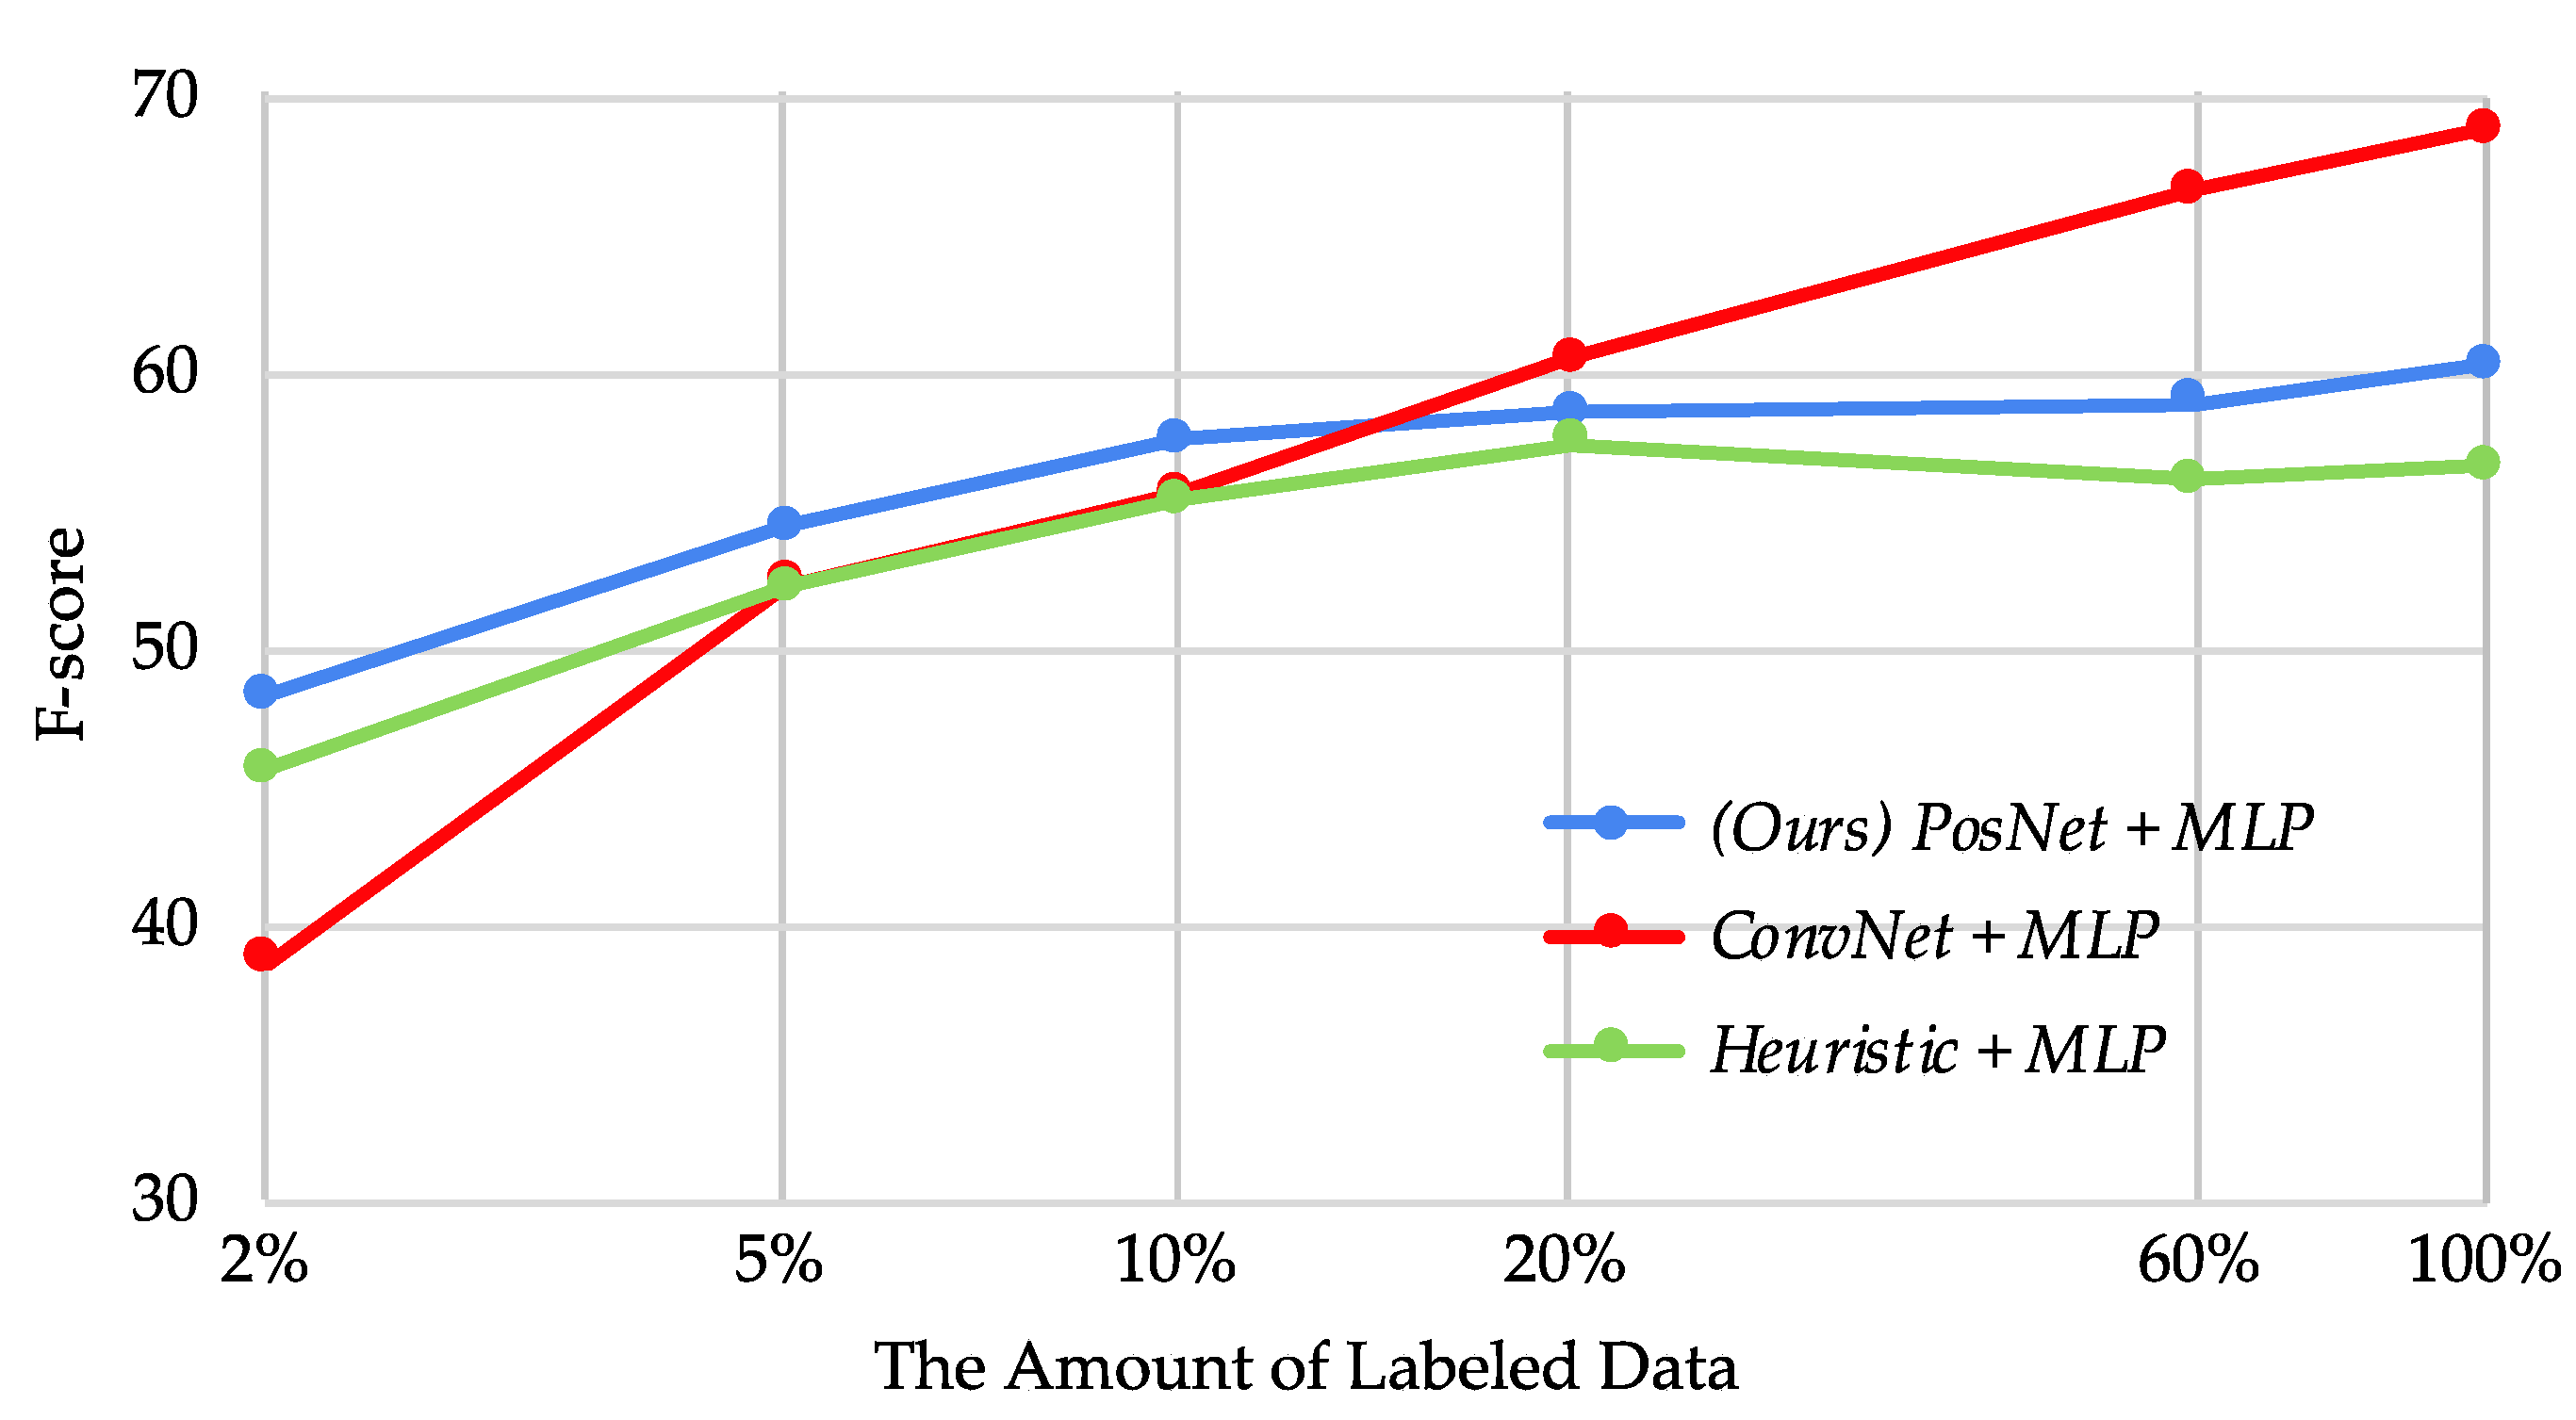
4.2.3. Semi-Supervised Setting

Motivated by the high performance of the proposed model, the classification task of road surface conditions was evaluated in a semi-supervised setting. A common scenario for a semi-supervised setting is that a large amount of data is available and only a small fraction is labeled. This scenario is realistically expected for wheelchair data because acceleration data and positional information of wheelchairs can be extensively collected, and manual annotation to all acceleration data is expensive and impractical. Since the positional information can be automatically collected, the PosNet model was trained with the entire dataset. Then a classifier was trained with a subset of road surface condition labels and their corresponding feature set, which was obtained from the trained PosNet model. The dataset of eight users using the LOSO method was first divided into 90% training data and 10% validation data via stratified splitting. Then, the subset was created by randomly dividing the training data by stratified splitting. Heuristic + MLP and ConvNet + MLP were selected for comparison to the proposed method (PosNet + MLP). In the case of ConvNet + MLP, the ConvNet model was trained only with the subset of the training data because the ConvNet model was trained with road surface condition labels.
Figure 8 shows the transition of the classification performance under the semi-supervised setting. The 100% subset is the extreme case of using the entire dataset. The performance of ConvNet + MLP decreases rapidly as the amount of labeled data decreases. The proposed model (PosNet + MLP) exceeds the performance of the fully supervised method (ConvNet + MLP) when the amount of labeled data decreases below 10%. The performance gap between PosNet + MLP and ConvNet + MLP increased as the amount of labeled data decreased. The proposed method (PosNet + MLP) always outperformed Heuristic + MLP on any subset proportion. This result demonstrates the usefulness of the proposed method in a practical environment. When more extensive wheelchair driving data are collected than the experiment conducted in this paper, the performance of the proposed method improves even if the amount of labeled data is limited, providing a highly practical model.

5. Discussion

This paper proposed a novel method for estimating road surface conditions without manual annotation by applying weakly supervised learning. Positional information during wheelchair driving was used as weak supervision to learn road surface conditions using three-axis wheelchair acceleration data. In the weak supervision design in this paper, the adjacent road surfaces generally have similar conditions, and the model effectively learns feature representations of road surface conditions by being trained to predict the position of the input acceleration data. The sidewalks that the wheelchair drove were divided into a mesh shape to aggregate adjacent road surfaces into a category, and the position prediction task was formulated as a classification problem.
This result demonstrated that positional information helps with learning rich representations of road surface conditions, and the learned representations were discriminative for a road surface classification task. The learned representations were visualized using a clustering method and were demonstrated to provide subtle and detailed representations of road surface conditions, such as the difference of ascending and descending of a slope, the angle of slopes, the exact locations of curbs, and the slight differences of similar pavements. The learned representations were found to be more useful than calculated rich heuristic features for the road surface classification task. When the amount of labeled data was 10% or less in a semi-supervised setting, the proposed method outperformed a conventional fully supervised method that used manually annotated labels to learn representations of road surface conditions. When the amount of labeled data was 20% or more, the fully supervised method performed better than the proposed method. The fully supervised method is generally better than weakly supervised or self-supervised methods when a large amount of labeled data is available. However, the proposed method is useful in a practical environment because most wheelchair acceleration data are not annotated with their ground-truth labels.
Our future work will be directed towards the design of supervisions that can be automatically collected with wheelchair driving data and are beneficial to learn feature representations of road surface conditions. The findings here demonstrated that the proposed method of generating positional labels helps the proposed model to learn various representations of road surface conditions. However, the classification result experienced difficulty when recognizing continuous road surfaces and intermittent road surfaces simultaneously. This paper proposed a simple but effective method for uniformly dividing all road surfaces into a mesh shape of a same grid size. The future prospective method involves dividing road surfaces more flexibly. One approach is to segment road surfaces by intersections or corners of roads. This approach is considered to be beneficial for learning representations of road surface conditions because the transitions of road surface conditions are generally observed at intersections or corners, and the positional information of these points can be easily collected. The formulation of the position prediction task can be designed in another approach to enhance the performance for learning feature representations of road surface conditions. One method is to predict the next position given the last several positions and corresponding acceleration data. This method considers the temporal features of acceleration data and can be beneficial to learn sequential road surface conditions. Another future direction is the architecture of the deep model. In this study, a ConvNet model was used to recognize wheelchair acceleration data. To learn the temporal correlation of acceleration data, the recurrent neural network model is expected to be useful [13].

Author Contributions

Conceptualization, I.E.Y., Y.I. and T.W.; methodology, T.W. and Y.I.; software, T.W.; formal analysis, T.W.; investigation, Y.I. and I.E.Y.; resources, I.E.Y. and Y.M.; data curation, H.T., Y.I. and T.W.; writing—original draft preparation, T.W.; writing—review and editing, I.E.Y., H.T. and Y.I.; visualization, T.W.; supervision, I.E.Y.; project administration, I.E.Y.; funding acquisition, I.E.Y. All authors have read and agreed to the published version of the manuscript.

Funding

This research was funded by a Research Grant from the Tateishi Science and Technology Foundation in FY2011—12, Research Grant from Chiyoda ward of Tokyo named “Chiyodagaku” in FY2014—16, and Grant-in-Aid for Scientific Research (B), 17H01946, Japan Society for the Promotion of Science.

Acknowledgments

The authors would like to thank all participants who helped to collect the sensing data and label the data.

Conflicts of Interest

The authors declare no conflict of interest. The funders had no role in the design of the study; in the collection, analyses, or interpretation of data; in the writing of the manuscript, or in the decision to publish the results.

Appendix A

The clustering visualization results for users that are not placed in the main text are shown in the appendix. Since wheelchair rowing patterns are different between manual and electric wheelchairs, the visualizations for users whose wheelchair type is not shown in the main text are exhibited. Figure A1 compares the clustering with different grid width conditions of 3, 4, and 5 m. Significant differences among grid width conditions were observed on ASC-SLP and CURB. ASC-SLP was clearly grouped into a specific cluster when the grid width condition was 4 or 5 m. When the grid width condition was 3 m, ASC-SLP was not grouped as clearly as under other grid width conditions. When the grid width was large, more curb points were captured. This tendency of curb points was significant for electric wheelchair users. Figure A2 compares the clustering between the proposed weakly supervised method and the manually annotated fully supervised method. The most notable differences were observed on slopes. For the weakly supervised result, ASC-SLP and part of GENT-ASC-SLP of the first and third laps were grouped into an independent cluster. On the fully supervised result, the cluster that was assigned to the ascending slopes was observed on other pavement types, including GENT-DESC-SLP, even when the number of clusters was higher. DESC-SLP was clearly grouped into a specific cluster on the fully supervised method, although the assigned cluster was slightly observed on other roads. For the weakly supervised result, DESC-SLP was separated from CONC-2b, but it was not grouped into a specific cluster. This result suggests that the acceleration of an electric wheelchair does not reflect the influence of slopes compared with that of a manual wheelchair because an electric wheelchair climbs slopes quietly. Between the weakly supervised and the fully supervised results, no significant difference was found in the clustering tendency of curb points, and similar curb points were captured in both manual and electric wheelchairs.
Figure A1. The clustering visualization of the first lap of an electric wheelchair user (E1) when the grid width was (a) 3 m, (b) 4 m, and (c) 5 m. The number of clusters was set to 18. Only the recognized curb points are marked with a red circle. The areas of ASC-SLP and GENT-ASC-SLP are marked with a black circle.
Information 11 00002 g0a1
Figure A2. The clustering comparison of an electric wheelchair user (E2) between the conventional fully supervised method and the proposed weakly supervised method. The grid width condition of the weakly supervised method was 5 m. The number of clusters was 16 in both methods. Only the recognized curb points are marked with a red circle. The areas of ASC-SLP, DESC-SLP, GENT-ASC-SLP, and GENT-DESC-SLP are marked with a black circle. (a) The first, (b) second, and (c) third lap visualizations of the fully supervised method. (d) The first, (e) second, and (f) third lap visualizations of the weakly supervised method.
Information 11 00002 g0a2aInformation 11 00002 g0a2b

References

  1. Laakso, M.; Sarjakoski, T.; Sarjakoski, L.T. Improving accessibility information in pedestrian maps and databases. Cartogr. Int. J. Geogr. Inf. Geovis. 2011, 46, 101–108. [Google Scholar] [CrossRef] [Green Version]
  2. Matthews, H.; Beale, L.; Picton, P.; Briggs, D. Modelling access with GIS in urban systems (MAGUS): Capturing the experiences of wheelchair users. Area 2003, 35, 34–45. [Google Scholar] [CrossRef]
  3. Karimi, H.A.; Zhang, L.; Benner, J.G. Personalized accessibility map (PAM): A novel assisted wayfinding approach for people with disabilities. Ann. GIS 2014, 20, 99–108. [Google Scholar] [CrossRef]
  4. Ponsard, C.; Snoeck, V. Objective accessibility assessment of public infrastructures. In Proceedings of the 10th International Conference on Computers Helping People with Special Needs, Linz, Austria, 11–13 July 2006; Springer: Berlin/Heidelberg, Germany, 2006; pp. 314–321. [Google Scholar] [CrossRef]
  5. Hara, K. Scalable methods to collect and visualize sidewalk accessibility data for people with mobility impairments. In Proceedings of the Adjunct Publication of the 27th Annual ACM Symposium on User Interface Software and Technology, Honolulu, HI, USA, 5–8 October 2014; ACM: New York, NY, USA, 2014; pp. 1–4. [Google Scholar] [CrossRef] [Green Version]
  6. Cardonha, C.; Gallo, D.; Avegliano, P.; Herrmann, R.; Koch, F.; Borger, S. A crowdsourcing platform for the construction of accessibility maps. In Proceedings of the 10th International Cross-Disciplinary Conference on Web Accessibility, Rio de Janeiro, Brazil, 13–15 May 2013; ACM: New York, NY, USA, 2013; p. 26. [Google Scholar] [CrossRef]
  7. Demir, I.; Koperski, K.; Lindenbaum, D.; Pang, G.; Huang, J.; Basu, S.; Hughes, F.; Tuia, D.; Raskar, R. Deepglobe 2018: A challenge to parse the earth through satellite images. In Proceedings of the IEEE Conference on Computer Vision and Pattern Recognition (CVPR) Workshops, Salt Lake City, UT, USA, 18–22 June 2018; pp. 172–181. [Google Scholar] [CrossRef] [Green Version]
  8. Eriksson, J.; Girod, L.; Hull, B.; Newton, R.; Madden, S.; Balakrishnan, H. The pothole patrol: Using a mobile sensor network for road surface monitoring. In Proceedings of the 6th International Conference on Mobile Systems, Applications, and Services, Breckenridge, CO, USA, 17–20 June 2008; ACM: New York, NY, USA, 2008; pp. 29–39. [Google Scholar] [CrossRef]
  9. Allouch, A.; Koubâa, A.; Abbes, T.; Ammar, A. Roadsense: Smartphone application to estimate road conditions using accelerometer and gyroscope. IEEE Sens. J. 2017, 17, 4231–4238. [Google Scholar] [CrossRef]
  10. Swan, M. The quantified self: Fundamental disruption in big data science and biological discovery. Big Data 2013, 1, 85–99. [Google Scholar] [CrossRef]
  11. Nagamine, K.; Iwasawa, Y.; Matsuo, Y.; Yairi, E.I. An estimation of wheelchair user’s muscle fatigue by accelerometers on smart devices. In Proceedings of the 2015 ACM International Joint Conference on Pervasive and Ubiquitous Computing and Proceedings of the 2015 ACM International Symposium on Wearable Computers, Osaka, Japan, 7–11 September 2015; ACM: New York, NY, USA, 2015; pp. 57–60. [Google Scholar] [CrossRef]
  12. Plötz, T.; Hammerla, N.Y.; Olivier, P. Feature learning for activity recognition in ubiquitous computing. In Proceedings of the International Joint Conference on Artificial Intelligence, Barcelona, Spain, 16–22 July 2011; Volume 22, pp. 1729–1734. [Google Scholar] [CrossRef]
  13. Wang, J.; Chen, Y.; Hao, S.; Peng, X.; Hu, L. Deep learning for sensor-based activity recognition: A survey. Pattern Recognit. Lett. 2019, 119, 3–11. [Google Scholar] [CrossRef] [Green Version]
  14. Yairi, E.I.; Takahashi, H.; Watanabe, T.; Nagamine, K.; Fukushima, Y.; Matsuo, Y.; Iwasawa, Y. Estimating Spatiotemporal Information from Behavioral Sensing Data of Wheelchair Users by Machine Learning Technologies. Information 2019, 10, 114. [Google Scholar] [CrossRef] [Green Version]
  15. Zhou, Z.H. A brief introduction to weakly supervised learning. Natl. Sci. Rev. 2018, 5, 44–53. [Google Scholar] [CrossRef] [Green Version]
  16. Zimmermann-Janschitz, S. Geographic Information Systems in the context of disabilities. J. Access. Des. All 2018, 8, 161–192. [Google Scholar] [CrossRef]
  17. Yairi, E.I.; Igi, S. Geographic Information System for Pedestrian Navigation with Areas and Routes Accessibility. J. Inf. Process. 2005, 46, 2940–2951. (In Japanese) [Google Scholar]
  18. Development Specification for Spatial Network Model for Pedestrians. Available online: http://www.mlit.go.jp/common/001244374.pdf (accessed on 3 November 2019). (In Japanese).
  19. Yairi, E.I.; Nara, H.; Igi, S. The GIS for improving accessibility of routes and areas, and its practical use by community of residents. Trans. Hum. Interface Soc. 2005, 7, 463–475. (In Japanese) [Google Scholar]
  20. Yairi, E.I.; Igi, S. Research on Ubiquitous System for Mobility Support of the Elderly and Disabled and Its Technology Transfer to Industry. J. Inf. Process. 2007, 48, 770–779. (In Japanese) [Google Scholar]
  21. Koga, M.; Izumi, S.; Matsubara, S.; Morishita, K.; Yoshioka, D. Development and verification of navigation system to support wheelchair user activity in urban areas. IADIS Int. J. WWW/Internet 2015, 13, 43–56. [Google Scholar]
  22. Kuo, T.S.; Tseng, K.S.; Yan, J.W.; Liu, Y.C.; Frank Wang, Y.C. Deep aggregation net for land cover classification. In Proceedings of the IEEE Conference on Computer Vision and Pattern Recognition (CVPR) Workshops, Salt Lake City, UT, USA, 18–22 June 2018; pp. 252–256. [Google Scholar] [CrossRef]
  23. Rakhlin, A.; Davydow, A.; Nikolenko, S. Land Cover Classification from Satellite Imagery with U-Net and Lovász-Softmax Loss. In Proceedings of the IEEE Conference on Computer Vision and Pattern Recognition (CVPR) Workshops, Salt Lake City, UT, USA, 18–22 June 2018; pp. 262–266. [Google Scholar] [CrossRef]
  24. Mohan, P.; Padmanabhan, V.N.; Ramjee, R. Nericell: Rich monitoring of road and traffic conditions using mobile smartphones. In Proceedings of the 6th ACM International Conference on Embedded Networked Sensor Systems, Raleigh, NC, USA, 5–7 November 2008; ACM: New York, NY, USA, 2008; pp. 323–336. [Google Scholar] [CrossRef]
  25. Yu, J.; Zhu, H.; Han, H.; Chen, Y.J.; Yang, J.; Zhu, Y.; Chen, Z.; Xue, G.; Li, M. Senspeed: Sensing driving conditions to estimate vehicle speed in urban environments. IEEE Trans. Mob. Comput. 2016, 15, 202–216. [Google Scholar] [CrossRef]
  26. Zeng, M.; Nguyen, L.T.; Yu, B.; Mengshoel, O.J.; Zhu, J.; Wu, P.; Zhang, J. Convolutional neural networks for human activity recognition using mobile sensors. In Proceedings of the 6th International Conference on Mobile Computing, Applications and Services, Austin, TX, USA, 6–7 November 2014; pp. 197–205. [Google Scholar] [CrossRef] [Green Version]
  27. Yang, J.B.; Nguyen, M.N.; San, P.P.; Li, X.L.; Krishnaswamy, S. Deep convolutional neural networks on multichannel time series for human activity recognition. In Proceedings of the 24th International Joint Conference on Artificial Intelligence (IJCAI), Buenos Aires, Argentina, 25–31 July 2015; pp. 3995–4001. [Google Scholar]
  28. Jiang, W.; Yin, Z. Human activity recognition using wearable sensors by deep convolutional neural networks. In Proceedings of the 23rd ACM International Conference on Multimedia, Brisbane, Australia, 26–30 October 2015; ACM: New York, NY, USA, 2015; pp. 1307–1310. [Google Scholar] [CrossRef]
  29. Rad, N.M.; Furlanello, C. Applying deep learning to stereotypical motor movement detection in autism spectrum disorders. In Proceedings of the IEEE 16th International Conference on Data Mining Workshops (ICDMW), Barcelona, Spain, 12–15 December 2016; pp. 1235–1242. [Google Scholar] [CrossRef]
  30. Fawaz, H.I.; Forestier, G.; Weber, J.; Idoumghar, L.; Muller, P.A. Deep learning for time series classification: A review. Data Min. Knowl. Discov. 2019, 33, 917–963. [Google Scholar] [CrossRef] [Green Version]
  31. Bengio, Y.; Courville, A.C.; Vincent, P. Unsupervised feature learning and deep learning: A review and new perspectives. arXiv 2012, arXiv:1206.5538. [Google Scholar]
  32. Längkvist, M.; Karlsson, L.; Loutfi, A. A review of unsupervised feature learning and deep learning for time-series modeling. Pattern Recognit. Lett. 2014, 42, 11–24. [Google Scholar] [CrossRef] [Green Version]
  33. Oquab, M.; Bottou, L.; Laptev, I.; Sivic, J. Is object localization for free?-weakly-supervised learning with convolutional neural networks. In Proceedings of the IEEE Conference on Computer Vision and Pattern Recognition (CVPR), Boston, MA, USA, 7–12 June 2015; pp. 685–694. [Google Scholar] [CrossRef] [Green Version]
  34. Agrawal, P.; Carreira, J.; Malik, J. Learning to see by moving. In Proceedings of the IEEE International Conference on Computer Vision, Santiago, Chile, 7–13 December 2015; pp. 37–45. [Google Scholar] [CrossRef]
  35. Owens, A.; Wu, J.; McDermott, J.H.; Freeman, W.T.; Torralba, A. Ambient sound provides supervision for visual learning. In Proceedings of the European Conference on Computer Vision, Amsterdam, The Netherlands, 11–14 October 2016; Springer: Berlin/Heidelberg, Germany, 2016; pp. 801–816. [Google Scholar] [CrossRef]
  36. Gidaris, S.; Singh, P.; Komodakis, N. Unsupervised Representation Learning by Predicting Image Rotations. In Proceedings of the 6th International Conference on Learning Representations, Vancouver, BC, Canada, 30 April–3 May 2018. [Google Scholar]
  37. You, Z.; Raich, R.; Fern, X.Z.; Kim, J. Weakly Supervised Dictionary Learning. IEEE Trans. Signal Process. 2018, 66, 2527–2541. [Google Scholar] [CrossRef] [Green Version]
  38. Zhang, A.; Cebulla, A.; Panev, S.; Hodgins, J.; Torre, F.D.L. Weakly-supervised Learning for Parkinson’s Disease Tremor Detection. In Proceedings of the 2017 39th Annual International Conference of the IEEE Engineering in Medicine and Biology Society (EMBC), Seogwipo, Korea, 11–15 July 2017; pp. 143–147. [Google Scholar] [CrossRef]
  39. Logeswaran, L.; Lee, H. An efficient framework for learning sentence representations. In Proceedings of the 6th International Conference on Learning Representations, Vancouver, BC, Canada, 30 April–3 May 2018. [Google Scholar]
  40. Dau, H.A.; Begum, N.; Keogh, E. Semi-supervision dramatically improves time series clustering under dynamic time warping. In Proceedings of the 25th ACM International Conference on Information and Knowledge Management, Indianapolis, IN, USA, 24–28 October 2016; ACM: New York, NY, USA, 2016; pp. 999–1008. [Google Scholar] [CrossRef]
  41. Lara, O.D.; Labrador, M.A. A survey on human activity recognition using wearable sensors. IEEE Commun. Surv. Tutor. 2012, 15, 1192–1209. [Google Scholar] [CrossRef]
  42. Liu, H.; Taniguchi, T.; Tanaka, Y.; Takenaka, K.; Bando, T. Visualization of driving behavior based on hidden feature extraction by using deep learning. IEEE Trans. Intell. Transp. Syst. 2017, 18, 2477–2489. [Google Scholar] [CrossRef]
  43. Fukushima, Y.; Uematsu, H.; Mitsuhashi, R.; Suzuki, H.; Yairi, E.I. Sensing human movement of mobility and visually impaired people. In Proceedings of the 13th International ACM SIGACCESS Conference on Computers and Accessibility, Dundee, Scotland, UK, 24–26 October 2011; ACM: New York, NY, USA, 2011; pp. 279–280. [Google Scholar] [CrossRef]
  44. Nagamine, K.; Iwasawa, Y.; Yutaka, M.; Yairi, E.I. Physical Strain Evaluation of Manual Wheelchair Driving by Accelerometer. IEICE Trans. Inf. Syst. 2017, J100-D, 773–782. (In Japanese) [Google Scholar] [CrossRef]
  45. Iwasawa, Y.; Yairi, E.I. Life-logging of wheelchair driving on web maps for visualizing potential accidents and incidents. In Proceedings of the 12th Pacific Rim International Conference on Artificial Intelligence, Kuching, Malaysia, 3–7 September 2012; Springer: Berlin/Heidelberg, Germany, 2012; pp. 157–169. [Google Scholar] [CrossRef]
  46. Iwasawa, Y.; Nagamine, K.; Yutaka, M.; Yairi, E.I. Road sensing: Personal sensing and machine learning for development of large scale accessibility map. In Proceedings of the 17th International ACM SIGACCESS Conference on Computers & Accessibility, Lisbon, Portugal, 26–28 October 2015; ACM: New York, NY, USA, 2015; pp. 335–336. [Google Scholar] [CrossRef]
  47. Iwasawa, Y.; Yairi, I.E.; Matsuo, Y. Combining human action sensing of wheelchair users and machine learning for autonomous accessibility data collection. IEICE Trans. Inf. Syst. 2016, E99-D, 115–124. [Google Scholar] [CrossRef] [Green Version]
  48. Takahashi, H.; Nagamine, K.; Iwasawa, Y.; Yutaka, M.; Yairi, E.I. Quantification of Road Condition from Wheelchair Sensing Data Using Deep Convolutional Neural Network. IEICE Trans. Inf. Syst. 2018, J101-D, 1009–1021. (In Japanese) [Google Scholar] [CrossRef]
  49. Takahashi, H.; Iwasawa, Y.; Nagamine, K.; Yairi, E.I. Study on data labeling method using GPS for DCNN learning to extract road surface characteristics from wheelchair sensing data. In Proceedings of the 32nd Annual Conference of the Japanese Society for Artificial Intelligence, Kagoshima, Japan, 5–8 June 2018; pp. 2502–2505. (In Japanese). [Google Scholar]
  50. Mora, H.; Gilart-Iglesias, V.; Pérez-del Hoyo, R.; Andújar-Montoya, M.D. A Comprehensive System for Monitoring Urban Accessibility in Smart Cities. Sensors 2017, 17, 1834. [Google Scholar] [CrossRef] [Green Version]
  51. LeCun, Y.; Bengio, Y.; Hinton, G. Deep learning. Nature 2015, 521, 436–444. [Google Scholar] [CrossRef]
  52. Jones, G.R. Human friendly coordinates. GeoInformatics 2015, 18, 10–12. [Google Scholar]
  53. Ministry of Land, Infrastructure, Transport and Tourism, Commentary of Each Rule of Road Structure Ordinance. Available online: http://www.mlit.go.jp/road/sign/kouzourei_kaisetsu.html (accessed on 3 November 2019). (In Japanese).
  54. Bersch, S.D.; Azzi, D.; Khusainov, R.; Achumba, I.E.; Ries, J. Sensor Data Acquisition and Processing Parameters for Human Activity Classification. Sensors 2014, 14, 4239–4270. [Google Scholar] [CrossRef] [Green Version]
  55. Kingma, D.P.; Ba, J. Adam: A method for stochastic optimization. In Proceedings of the 3rd International Conference on Learning Representations, San Diego, CA, USA, 7–9 May 2015. [Google Scholar]
  56. Esterman, M.; Tamber-Rosenau, B.J.; Chiu, Y.C.; Yantis, S. Avoiding non-independence in fMRI data analysis: Leave one subject out. Neuroimage 2010, 50, 572–576. [Google Scholar] [CrossRef] [Green Version]
  57. Jolliffe, I. Principal Component Analysis; Springer: Berlin/Heidelberg, Germany, 2011; pp. 1094–1096. [Google Scholar]
  58. Cao, H.; Nguyen, M.N.; Phua, C.; Krishnaswamy, S.; Li, X. An integrated framework for human activity classification. In Proceedings of the 2012 ACM Conference on Ubiquitous Computing, Pittsburgh, PA, USA, 5–8 September 2012; ACM: New York, NY, USA, 2012; pp. 331–340. [Google Scholar] [CrossRef]
Figure 1. Overview of the proposed system. This system extensively collects acceleration data and positional data of wheelchairs. The convolutional neural network (ConvNet) model is trained using a weakly supervised method, and feature representations of road surface conditions are extracted from the trained network. The information on road surface conditions is visualized on a map and provided to all users as an accessibility map. The system can provide large-scale and detailed information on road surface conditions because wheelchair driving data can be collected extensively and is influenced by a slight state of road surfaces.
Information 11 00002 g001
Figure 2. (a) The driving route was generally divided into six road surface conditions: gravel pavement (blue), tile pavement (green), block pavement (orange), concrete pavement (black), slope (purple), and curb (red). The slope was short and had a gentle gradient. A total of 12 curbs existed along the route. The points of curbs are marked with a red circle in the figure. All the curbs were similar, but their height and gradient differed slightly. (b) The block pavement was categorized into two types: Block pavement-1 and Block pavement-2. The concrete pavement was categorized into two types: Concrete pavement-1 and Concrete pavement-2. Concrete pavement-2 was slightly smoother than Concrete pavement-1.
Information 11 00002 g002
Figure 3. (a) Dividing the earth’s surface into a mesh shape. The dotted line in the figure denotes the traveled route. The mesh divides the earth’s surface and creates multiple grids. (b) Targeting only the grids that cover the driving route. The grey-colored area denotes the target grids. (c) Assigning a unique number to each grid. A unique number is assigned to each grid, and an assigned number is assigned to all acceleration data samples.
Information 11 00002 g003
Figure 4. The network architecture that is trained on the weakly supervised task to predict position. The network is composed of an input layer (Input), four convolution layers (CONV + Max POOL), one fully connected layer (FC), and an output layer (Output). The output has N classes; N varies according to the grid width condition. The rectified linear unit (ReLU) and dropout layers are not shown due to space limitations.
Information 11 00002 g004
Figure 5. The clustering visualization of the first lap of a manual wheelchair user (M1) when the grid width condition was (a) 3 m, (b) 4 m, and (c) 5 m. The number of clusters was set to 16. Only the recognized curb points are marked with a red circle. The areas of ascending slope (ASC-SLP) and gentle ascending slope (GENT-ASC-SLP) are marked with a black circle.
Information 11 00002 g005
Figure 6. The clustering visualization of the result of a manual wheelchair user (M2) of (a) the first, (b) second, and (c) third laps. The grid width condition was 5 m, and the number of clusters was set to 16. Only the recognized curb points are marked with a red circle. The areas of ASC-SLP, descending slope (DESC-SLP), GENT-ASC-SLP, and gentle descending slope (GENT-DESC-SLP) are marked with a black circle.
Information 11 00002 g006
Figure 7. The clustering comparison of a manual wheelchair user (M3) between the conventional fully supervised (SUP) method and the proposed weakly (WEAK) supervised method. (a) The first, (b) second, and (c) third lap visualizations of the fully supervised method. (d) The first, (e) second, and (f) third lap visualizations of the weakly supervised method. The grid width condition of the weakly supervised method was 5 m. The number of clusters was 16 for both methods. Only the recognized curb points are marked with a red circle. The areas of ASC-SLP, DESC-SLP, GENT-ASC-SLP, and GENT-DESC-SLP are marked with a black circle.
Information 11 00002 g007
Figure 8. The classification performance in a semi-supervised setting. The classification was implemented under 100%, 60%, 20%, 10%, 5%, and 2% subsets. The x-axis is logarithmic scale percentage of the amount of data with road surface condition labels. The y-axis is the macro F-score of the four classes. The PosNet model of the proposed method (PosNet + MLP) was trained in weakly supervised learning with positional information as weak supervision, whereas the ConvNet model (ConvNet + MLP) was trained in fully supervised learning with road condition labels. The performance of PosNet + MLP exceeded that of ConvNet + MLP when the amount of labeled data decreased below 10%. The performance gap between them increased as the amount of labeled data decreased.
Information 11 00002 g008
Table 1. The number of classes in each grid width condition.
Grid Width (m)345
Number of classes581403310
The smaller the grid width, the larger are the number of grids generated, and the larger the number of classes.
Table 2. Correspondence table of hexadecimal color code and its title defined in this paper.
Color TitleBlueGreenLight BlueLight GreenPurpleGreyLight PurpleYellow-GreenOrange
Color code#3333FF#339933#66CCFF#66FF33#993399#999999#CC6699#DDFF00#FF6700
Only the main colors are shown due to space limitations.
Table 3. Road surface classification performance with/without smoothing post-processing.
MethodF-scoreAccuracy (%)F-scoreAccuracy (%)
Without SmoothingWith Smoothing
Raw + k-NN28.275.526.474.9
MV + k-NN45.069.945.673.2
Heuristic + SVM51.980.351.880.7
Heuristic + MLP56.578.256.378.9
(Ours) PosNet + SVM57.780.459.882.1
(Ours) PosNet + MLP60.280.461.282.4
ConvNet + SVM62.682.567.485.2
ConvNet + MLP68.784.771.386.4
The performance was evaluated using macro F-score and accuracy. Macro F-score is the key performance indicator since the classes are imbalanced. A support vector machine (SVM) with radial basis function (RBF) kernel and a multilayer perceptron (MLP) model were used to classify the feature set learned by the proposed model (PosNet + SVM and PosNet + MLP). Six other methods were evaluated for comparisons with the proposed method. The first method (Raw + k-NN) used raw acceleration data as a feature set and used a k-nearest neighbor (k-NN) as a classifier. The second method (MV + k-NN) used the mean and the standard deviation (MV) of each axis of each segment as a feature set and used k-NN as a classifier. The third and fourth methods used 12 type of rich heuristic features of each axis of each segment as a feature set. The heuristic features were classified by SVM (Heuristic + SVM) and MLP (Heuristic + MLP). The final comparison methods used a ConvNet model. The feature set learned by the ConvNet model was classified by SVM (ConvNet + SVM) and MLP (ConvNet + MLP). The PosNet model of the proposed method was trained with weakly supervised learning with positional information as weak supervision, whereas the ConvNet model was trained with fully supervised learning with road condition labels.
Table 4. Per-class road surface classification performance.
MethodPer-Class F-ScorePer-Class Precision (%)
SlopeCurbTIOthsSlopeCurbTIOths
Raw + k-NN15.87.933.1086.131.259.814.276.2
MV + k-NN35.842.918.882.540.942.518.882.9
Heuristic + SVM19.663.235.889.149.170.246.985.1
Heuristic + MLP26.765.646.487.343.366.648.988.7
(Ours) PosNet + SVM41.268.532.588.759.073.644.084.9
(Ours) PosNet + MLP49.667.934.188.952.471.638.987.2
ConvNet + SVM43.671.344.490.861.465.249.190.4
ConvNet + MLP51.177.854.291.655.578.158.090.9
Four road surface condition classes—moving on slopes (Slope), climbing on curbs (Curb), moving on tactile indicators (TI), and others (Oths)—were predicted during the classification task. The PosNet model of the proposed methods (PosNet + SVM and PosNet + MLP) was trained using weakly supervised learning with positional information as weak supervision, whereas the ConvNet model of ConvNet + SVM and ConvNet + MLP was trained with fully supervised learning with road condition labels.

