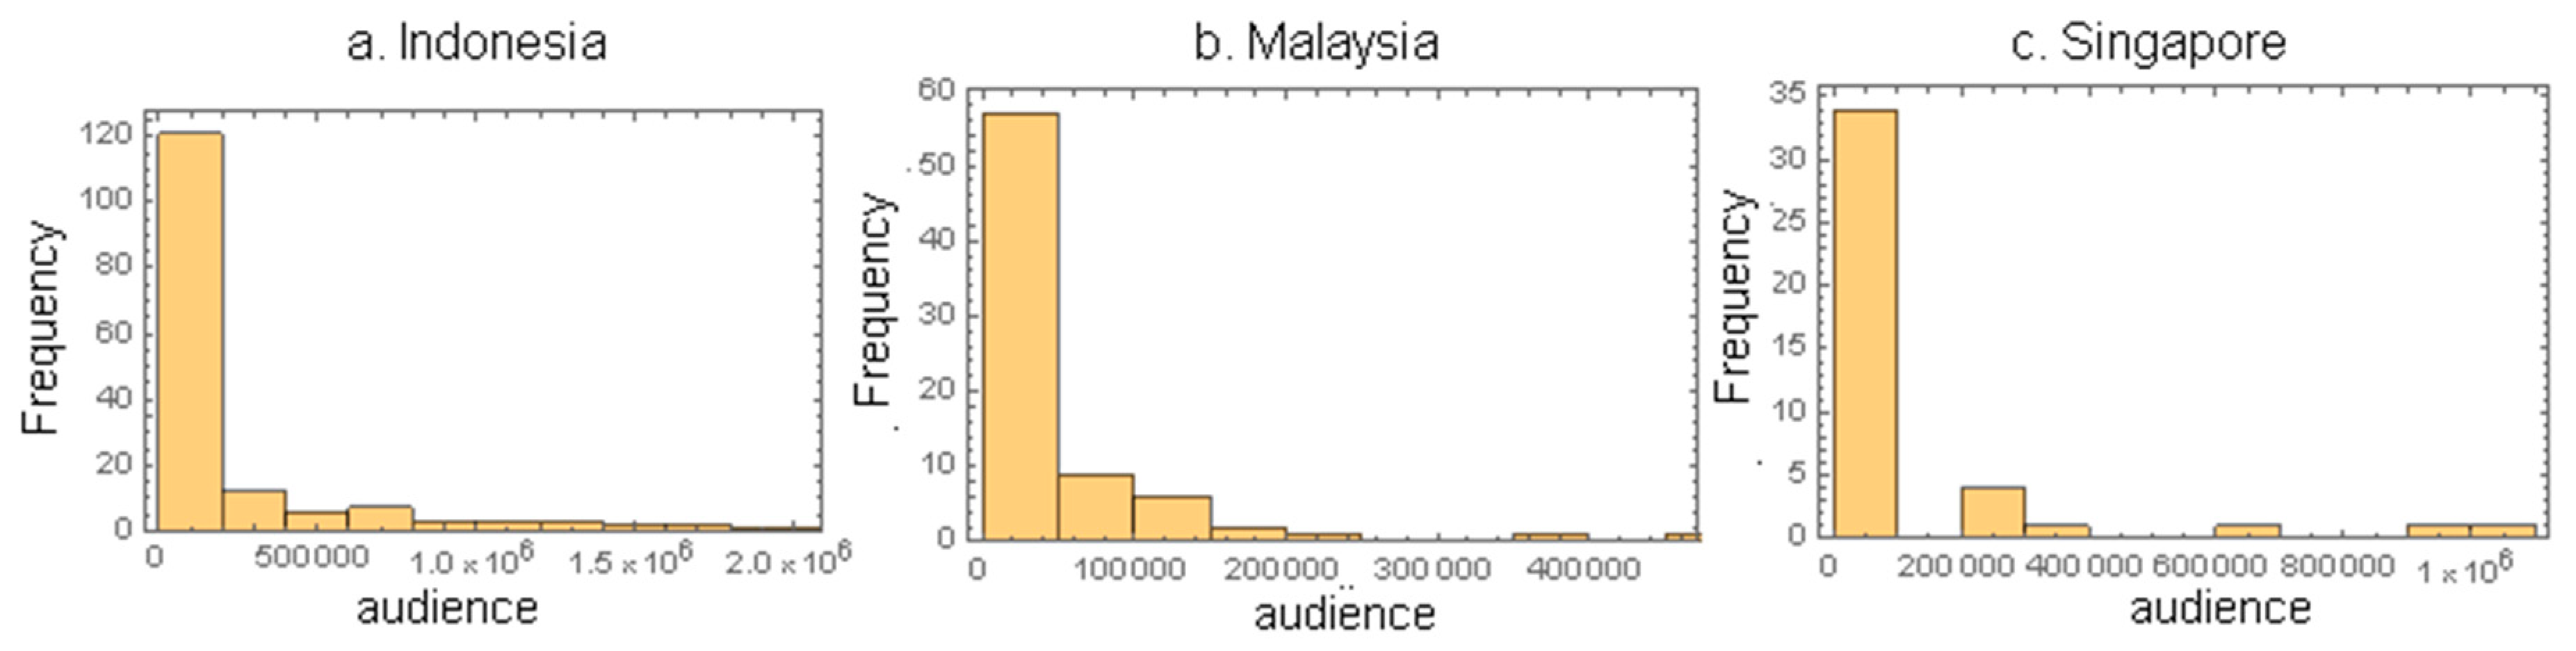
The number of followers of a news outlet on Twitter gives us an overview of the size of the audience that outlets have on social media. However, in order to get a complete understanding of audience behavior and reveal the pattern of news consumption at the population level, we must view the news media landscape as a collection of interconnected news sources based on overlapping audiences. In this study, we used Twitter follower data to build online news media networks, where the nodes represent news outlets and the edges tell us how much overlap any two news outlets have in the audience they share. In other words, we wanted to map the media landscape, as it emerges from the preferences of social media users for news sources available online
Figure 4,
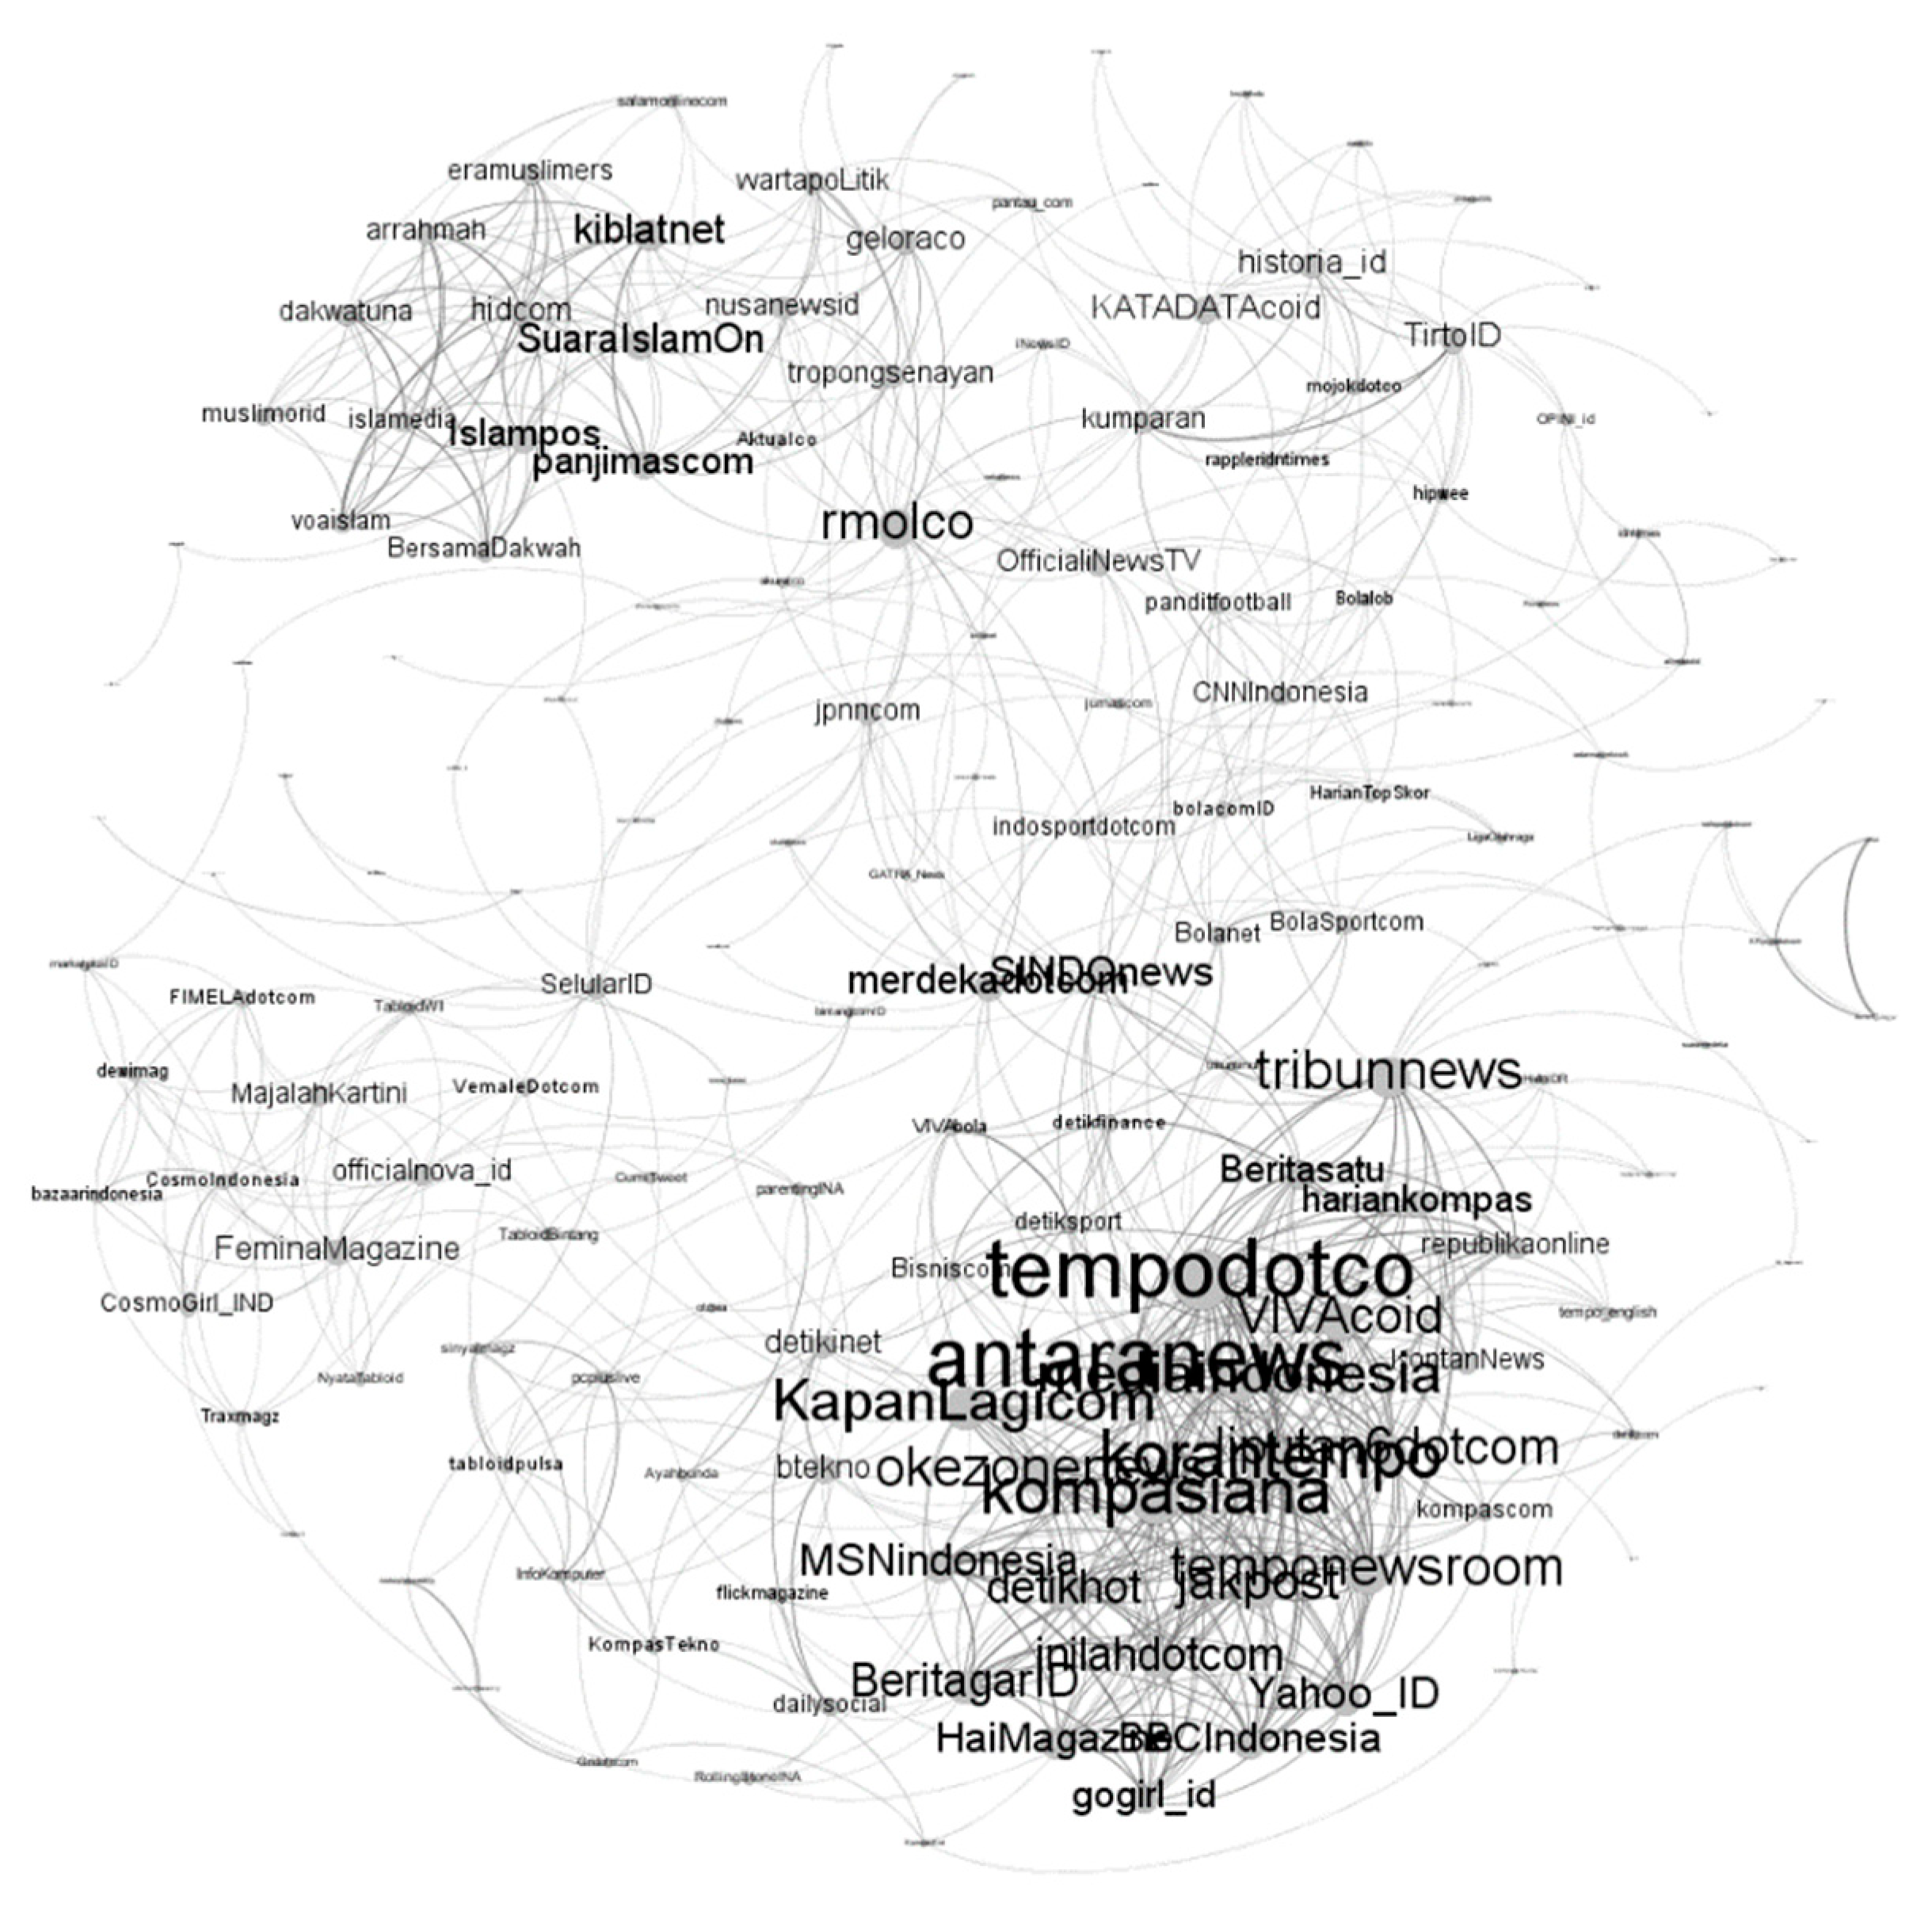
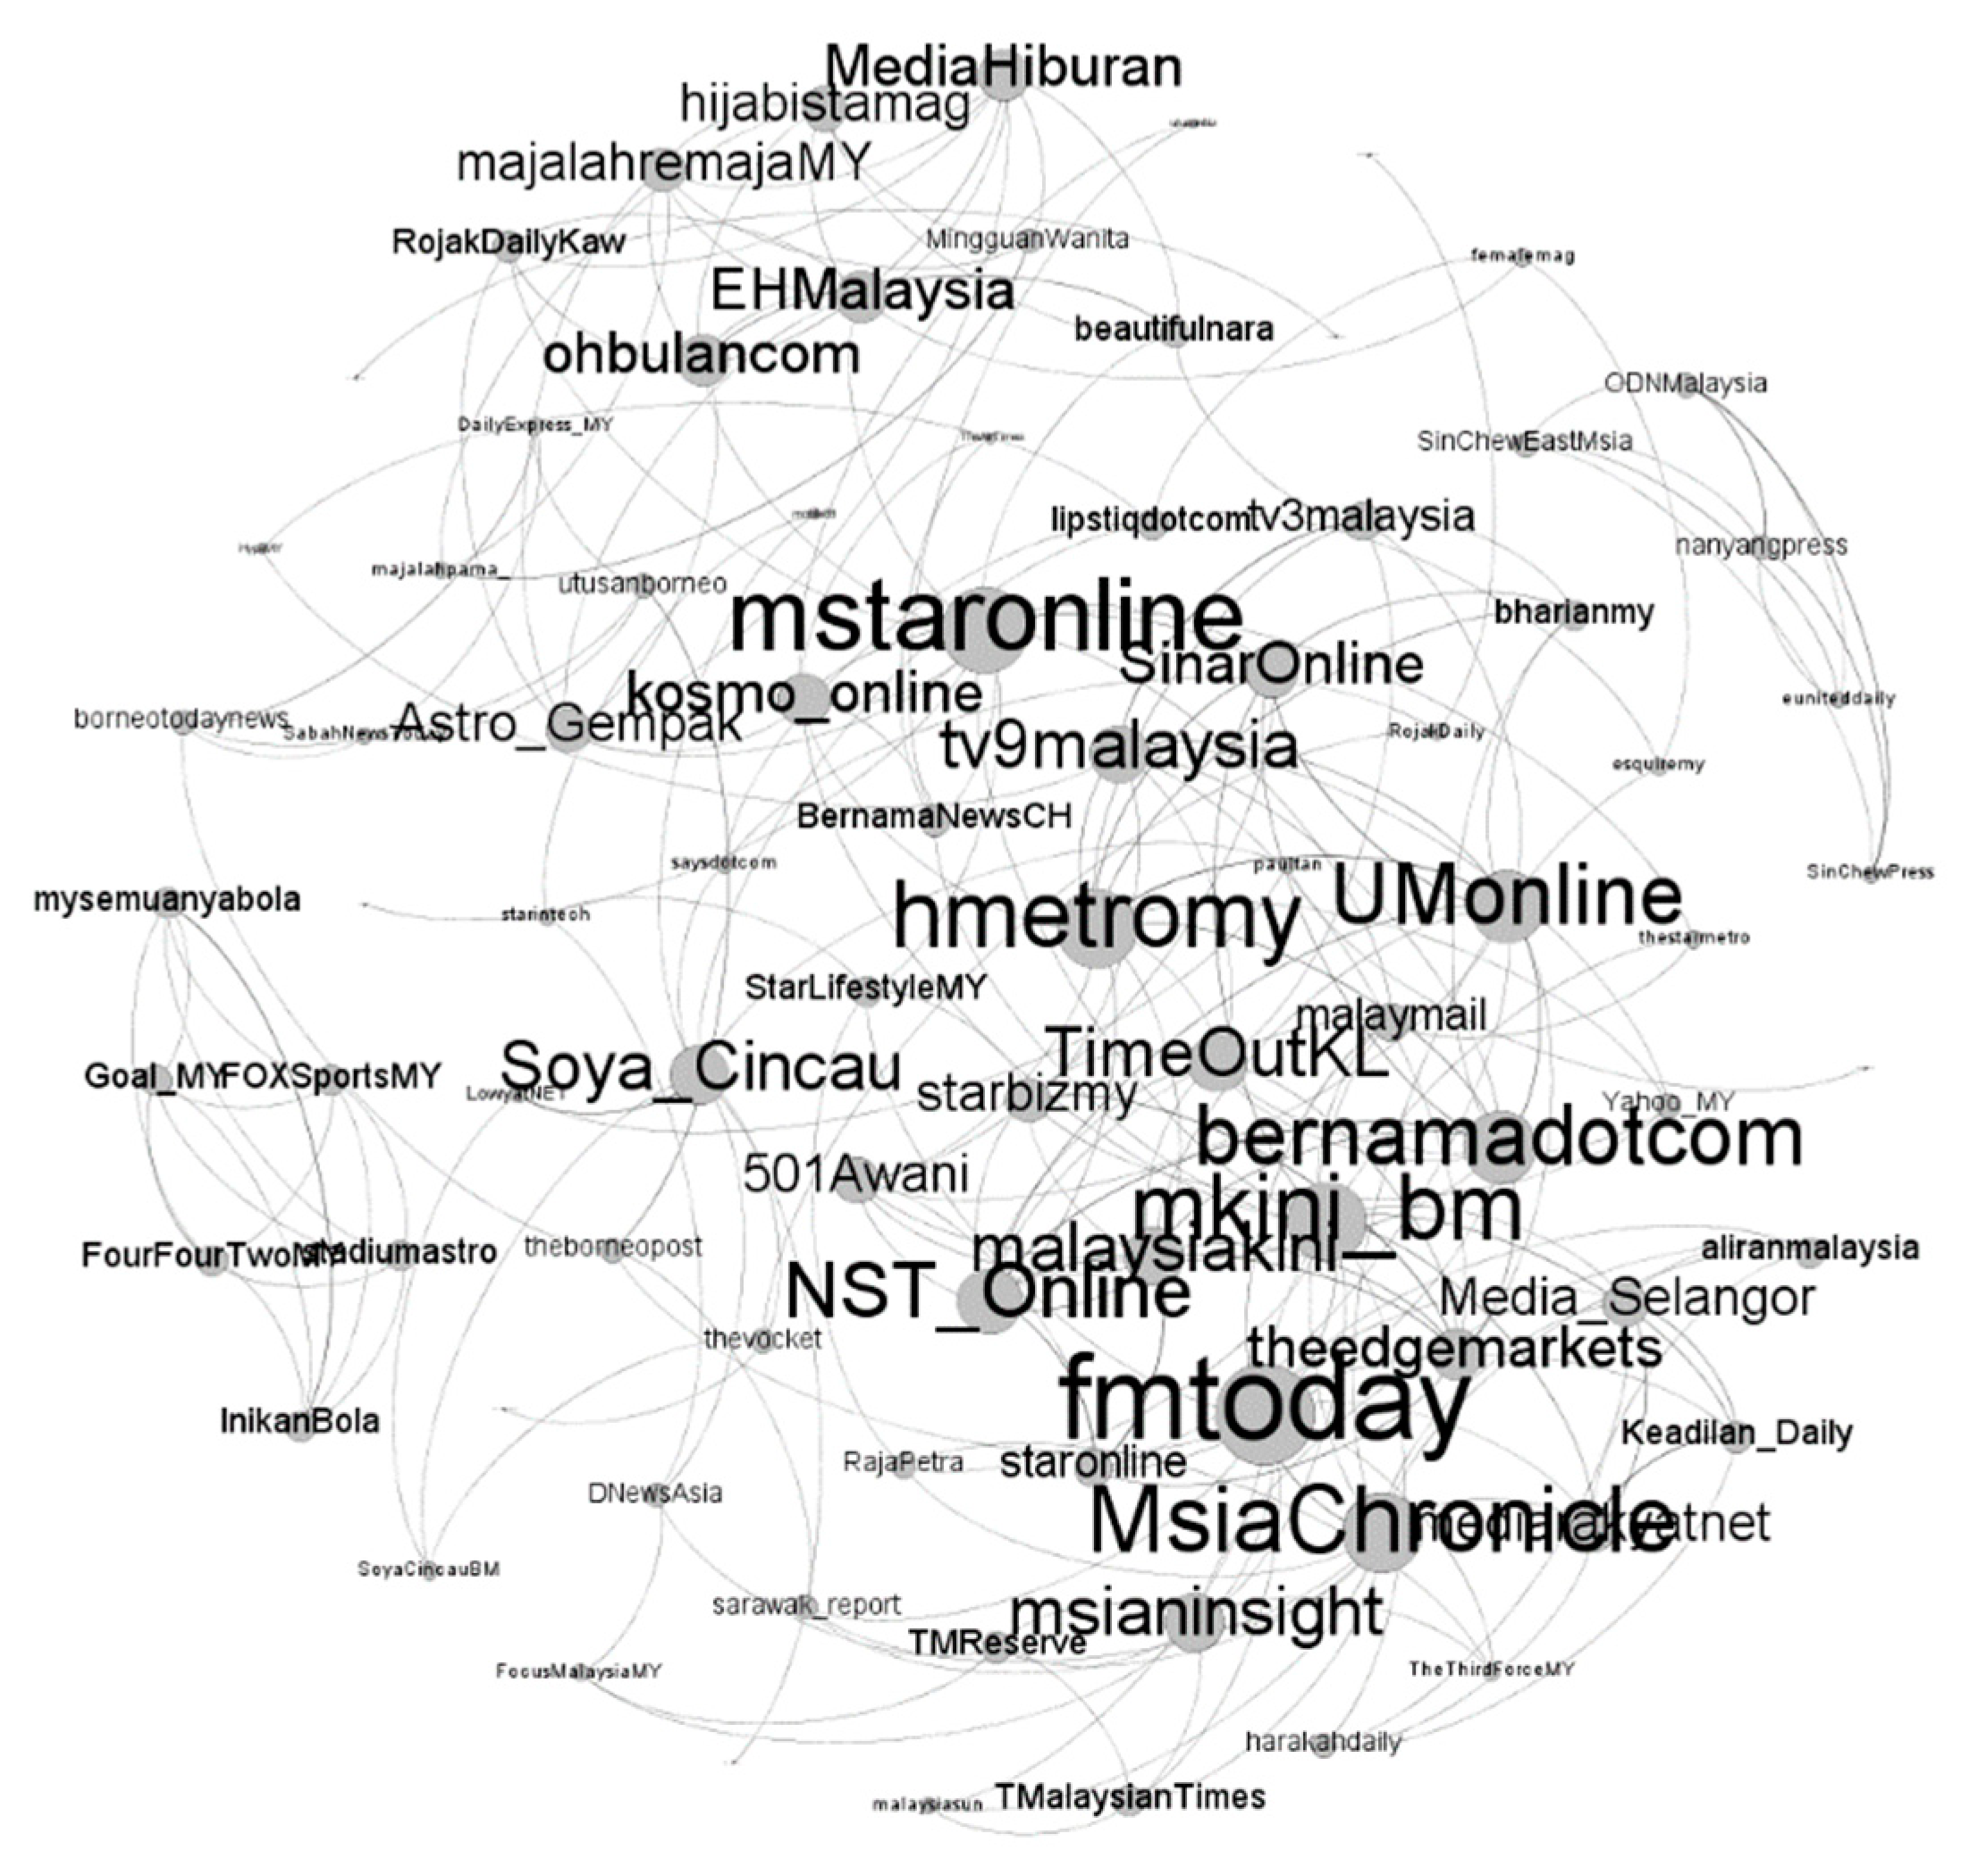
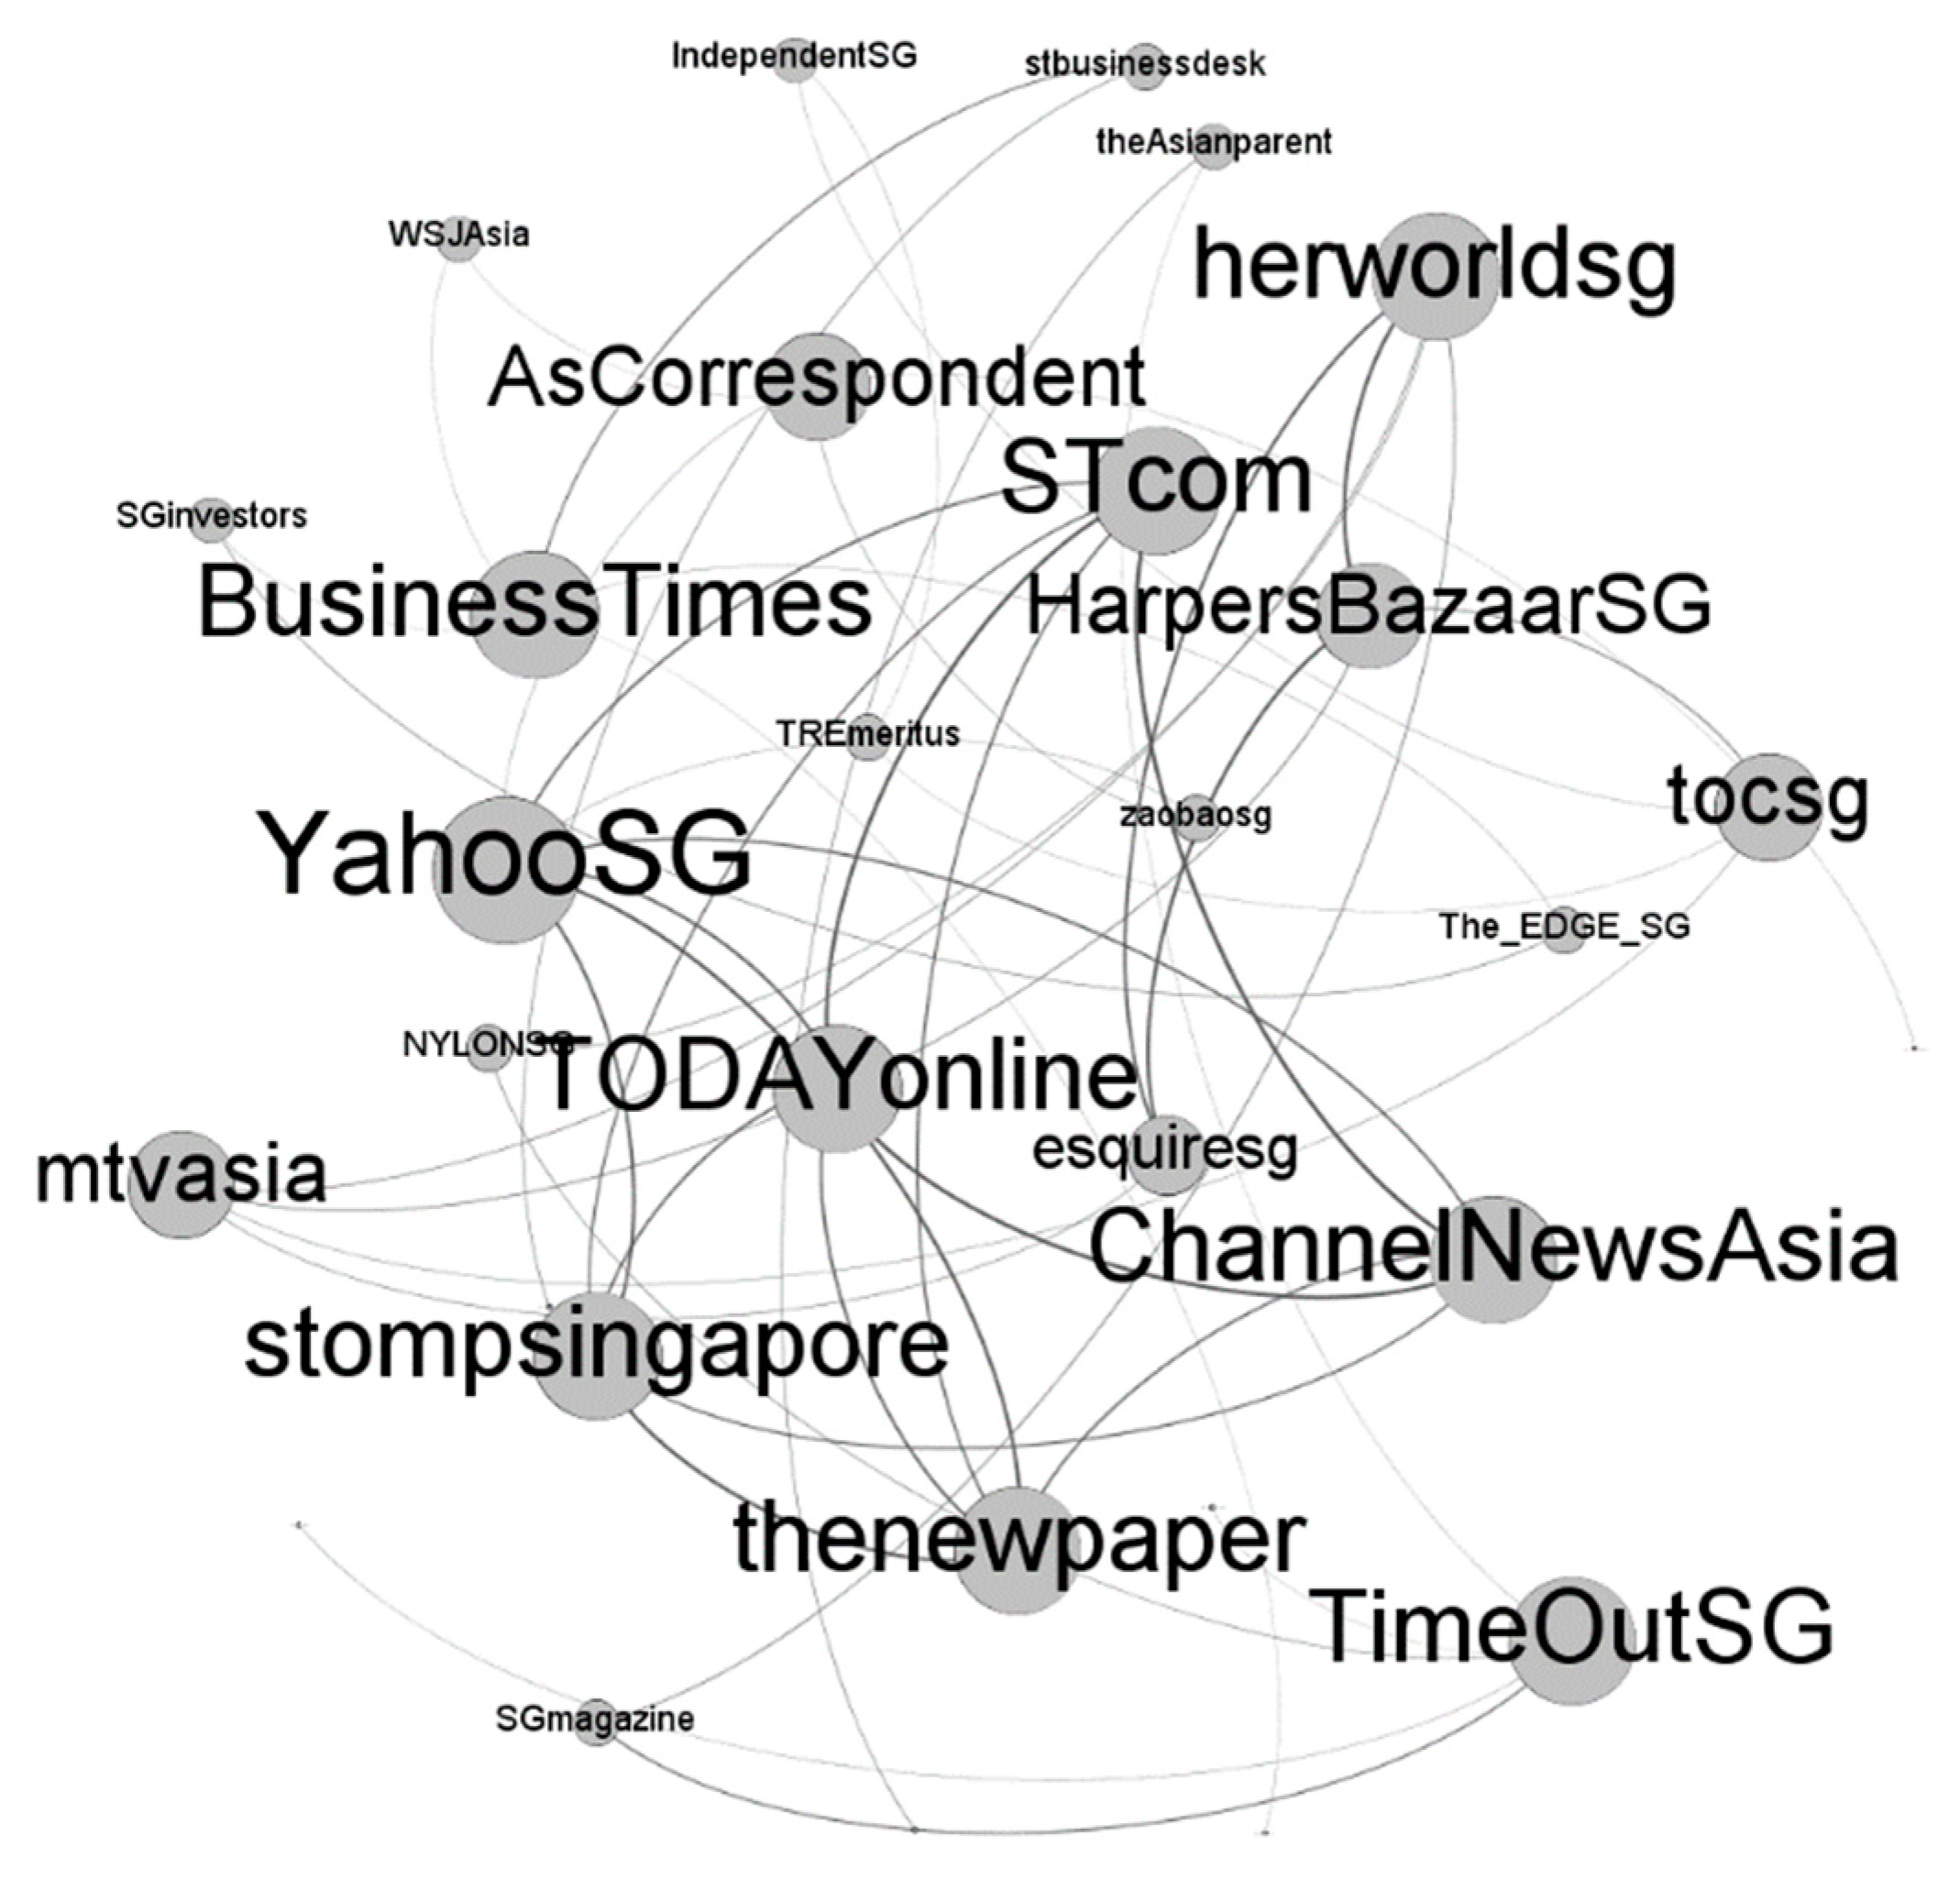
Figure 5 and
Figure 6 show the visual representation of online news media networks in the three countries analyzed in this study. The networks were built using Gephi 0.91, an open source software for social networking analysis [
36], with a list of edges between media outlets as input. By representing the landscape of online news media as a network, we can get a clear and measurable picture of the configuration of relationships between news outlets and the position of various news outlets in the media landscape.
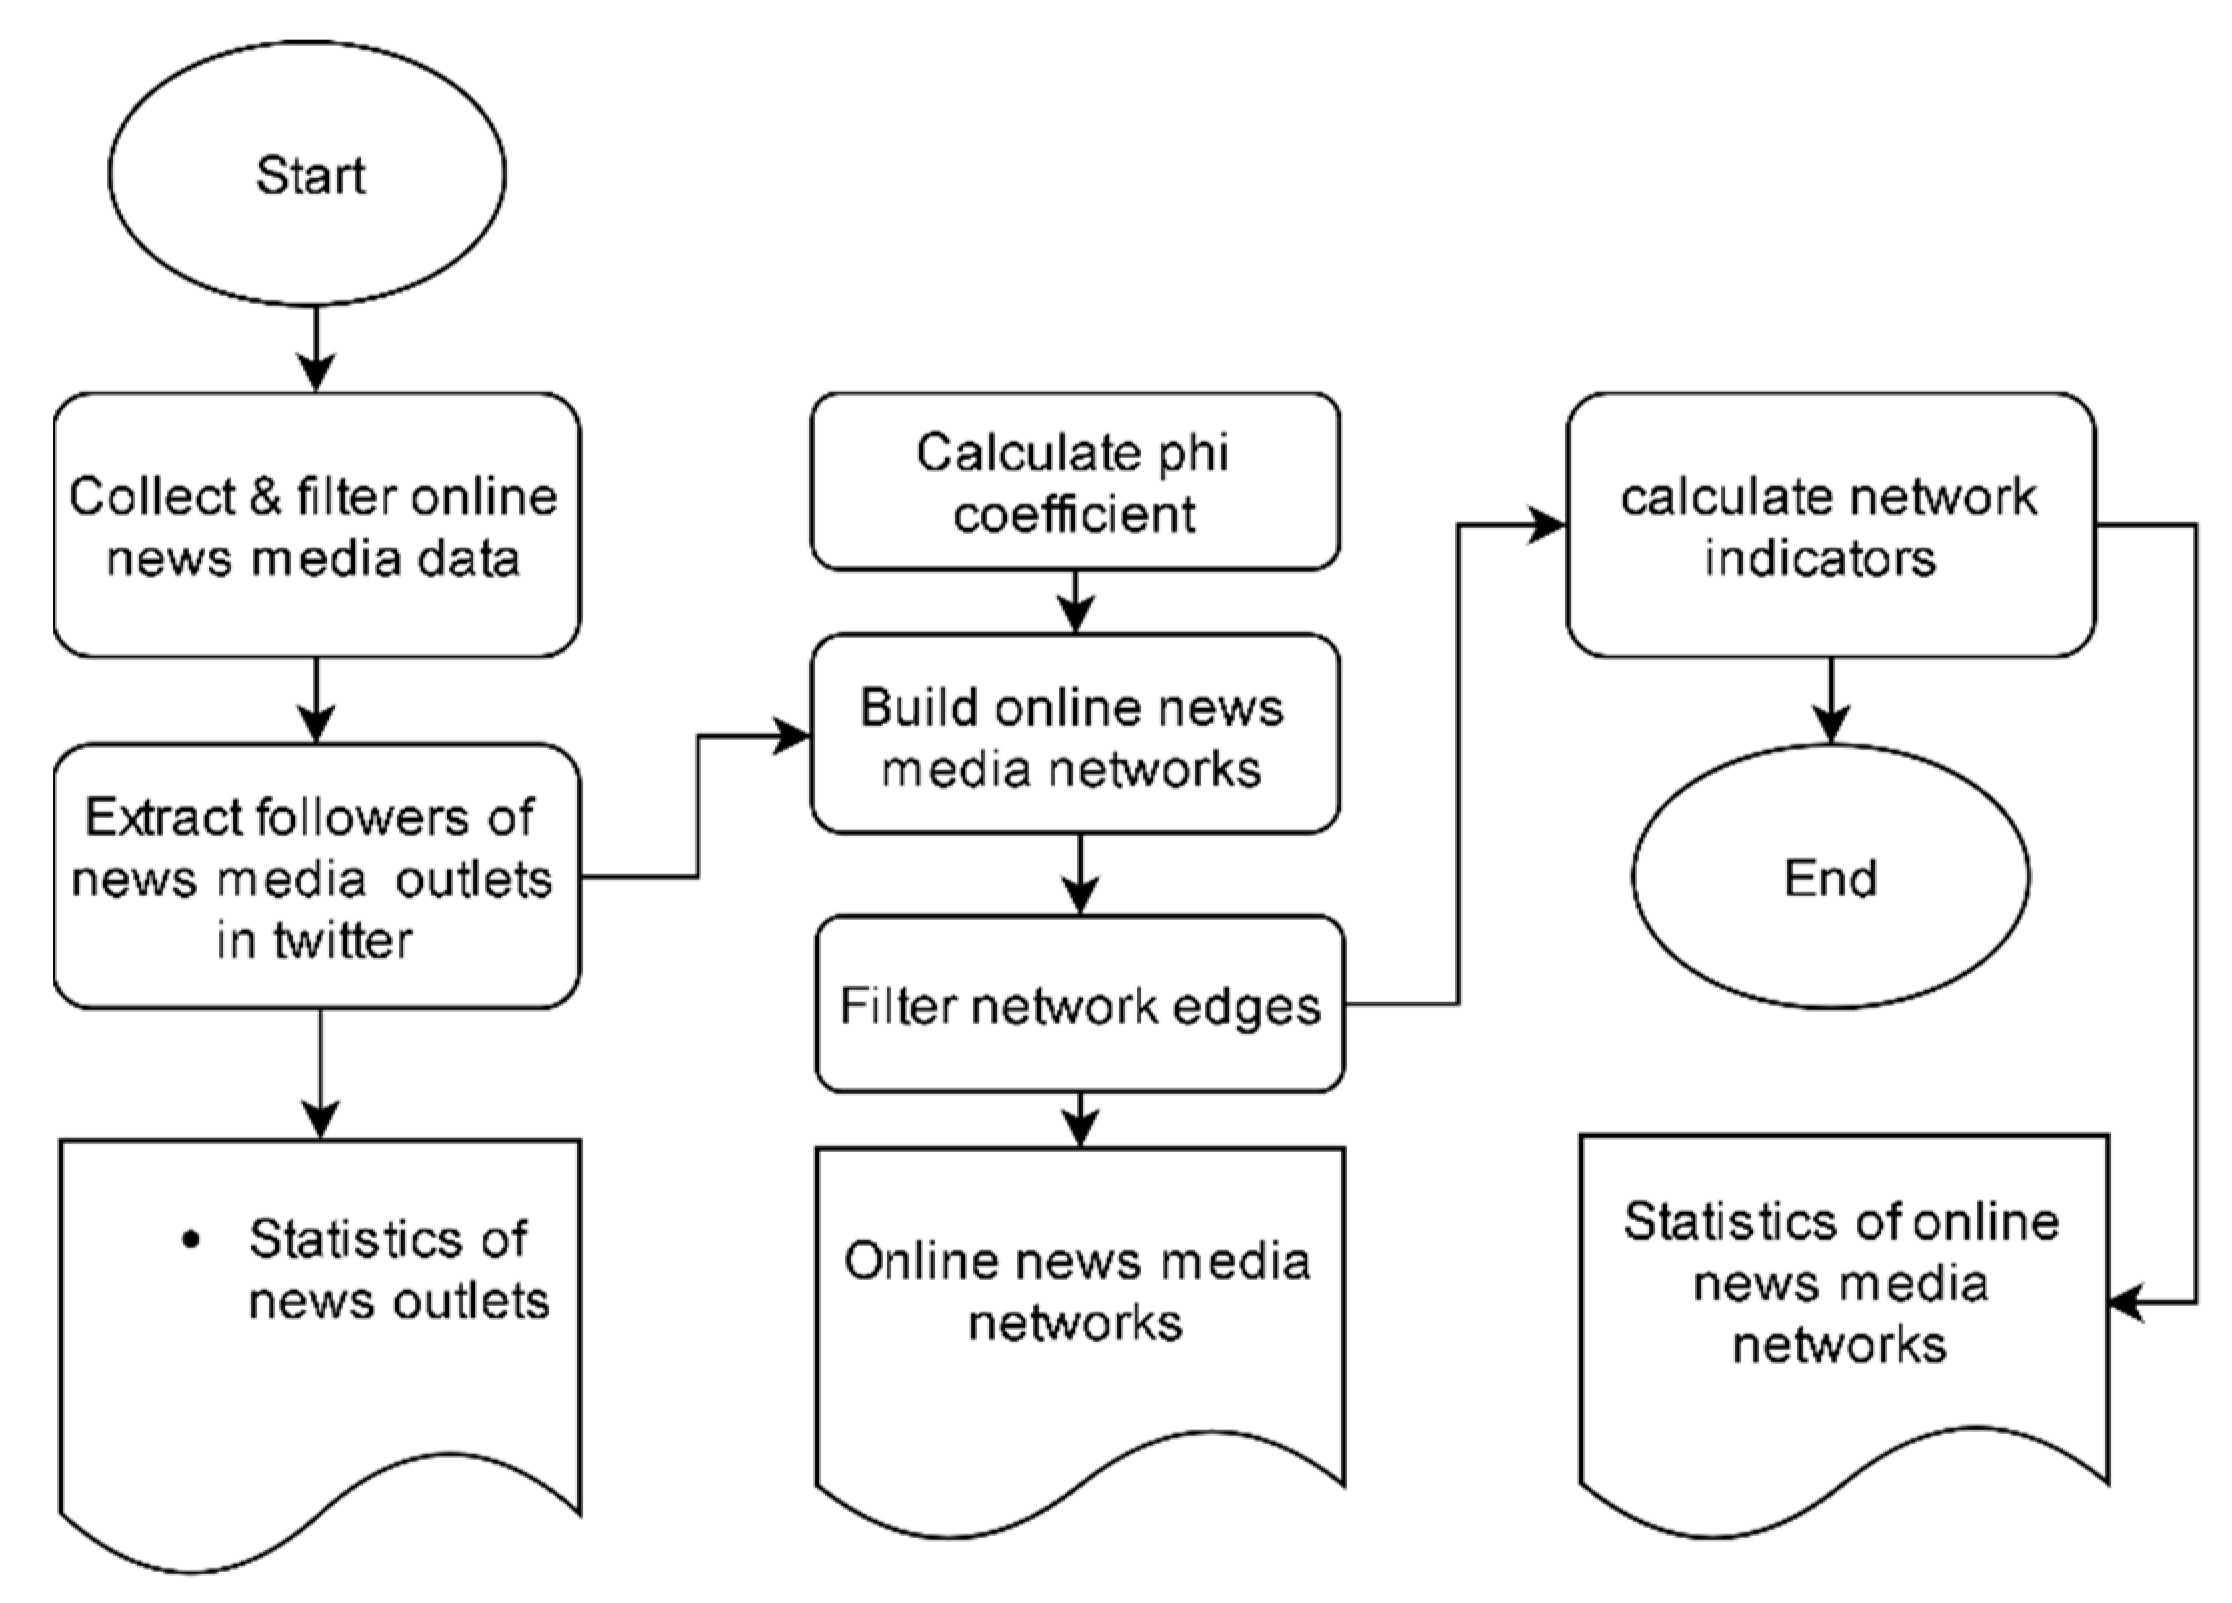
There are several ways to build a news media network based on follower overlap data. We can measure the similarity between news outlets using phi coefficients, as done in this study and in [
19,
21], or using closeness metrics [
10,
24], and then represent all the ties between news outlets collectively as undirected weighted networks [
19,
21,
24] and directed weighted networks [
10]. However, we argue that the resulting media network can look very different depending on how we filter the insignificant edges in the network. A weighted graph can be easily reduced to a sub-graph in which any of the edges’ weights are larger than a given threshold. This global weight threshold technique has been applied in [
19] using the
t-test and in [
10] using simple strategy: choose the strongest one. The short coming of this method is that it overpasses the nodes with small strength. Meanwhile, other studies analyze media networks as they are [
24]. This can lead to wrong conclusions when carrying out network analysis given that the media networks constructed in these studies are correlational networks which naturally have a dense structure. In the analysis of media networks, network density needs to be reduced first to bring out the actual structure so that the media network can be analyzed reliably. Furthermore, in media networks, as shown in [
19,
21], both strength and weight distribution in general follows heavy tailed distribution which spans several orders of degrees. Applying a simple cutoff on weight will remove all the information below the cut-off. In this study, we show the effectiveness of the disparity filter method to extract the relevant connection backbone in media networks. Compared to other studies that use
t-tests [
19], the density of the final media networks in this study, as in [
19], is very low which reflects this method can sufficiently reduce the network density without destroying its multi-scale nature.
After we represent the media landscape as a network, we can use the various metrics available in network analysis to summarize what the network reveals about news consumption. In this study, we applied metric degrees centrality to measure how central the position of news outlets is in the network. Traditionally, the size of the audience has been a measure of the prominence of a media. However, in this study we show that how strategic the position of a news outlet is in the network is not always reflected in the number of followers they have. In fact, compared to the size of their followers, media outlets reach a considerably larger audience through indirect exposure via social links [
10]. An et al. [
10] show that, based on indicators of social network exposure, a number of unconventional news sources made up the top list media, along with several established media sources with millions of direct followers. In
Figure 4, how central the position of a media outlet in the network is visualized by the size of the node, which is proportional to the value of the centrality of the media: the larger the node size, the more central the media represented by that node.
So far, the intersection between social media and news media mainly occurs on Facebook and Twitter. However, these two platforms are used for vastly different purposes when it comes to news consumption, due to the various features of the respective sites. Research on social media shows that consumers use Twitter for breaking news or searching information about their interest, but this is not the case for Facebook. Facebook members want to stay connected with their offline social network, and as such, tend to get news about their social environment through those networks [
37]. However, news consumption on social media is strongly affected by the tendency of users to limit their exposure to a few sites [
37]. That is why the structural characteristics of the news media landscape on the two platforms are relatively the same [
38].
The news media network on Twitter presented in this study should be evaluated with consideration of two limitations. First, not all followers of news media accounts on Twitter are true audiences. It is known that about 15% of Twitter accounts are bot accounts that are controlled by software [
39]. Second, not all news media followers are active users. Future research work should consider building a news media network based on followers who actively interact with news media accounts.


