Network Anomaly Detection by Using a Time-Decay Closed Frequent Pattern

 ,
,  and
and
Abstract
1. Introduction
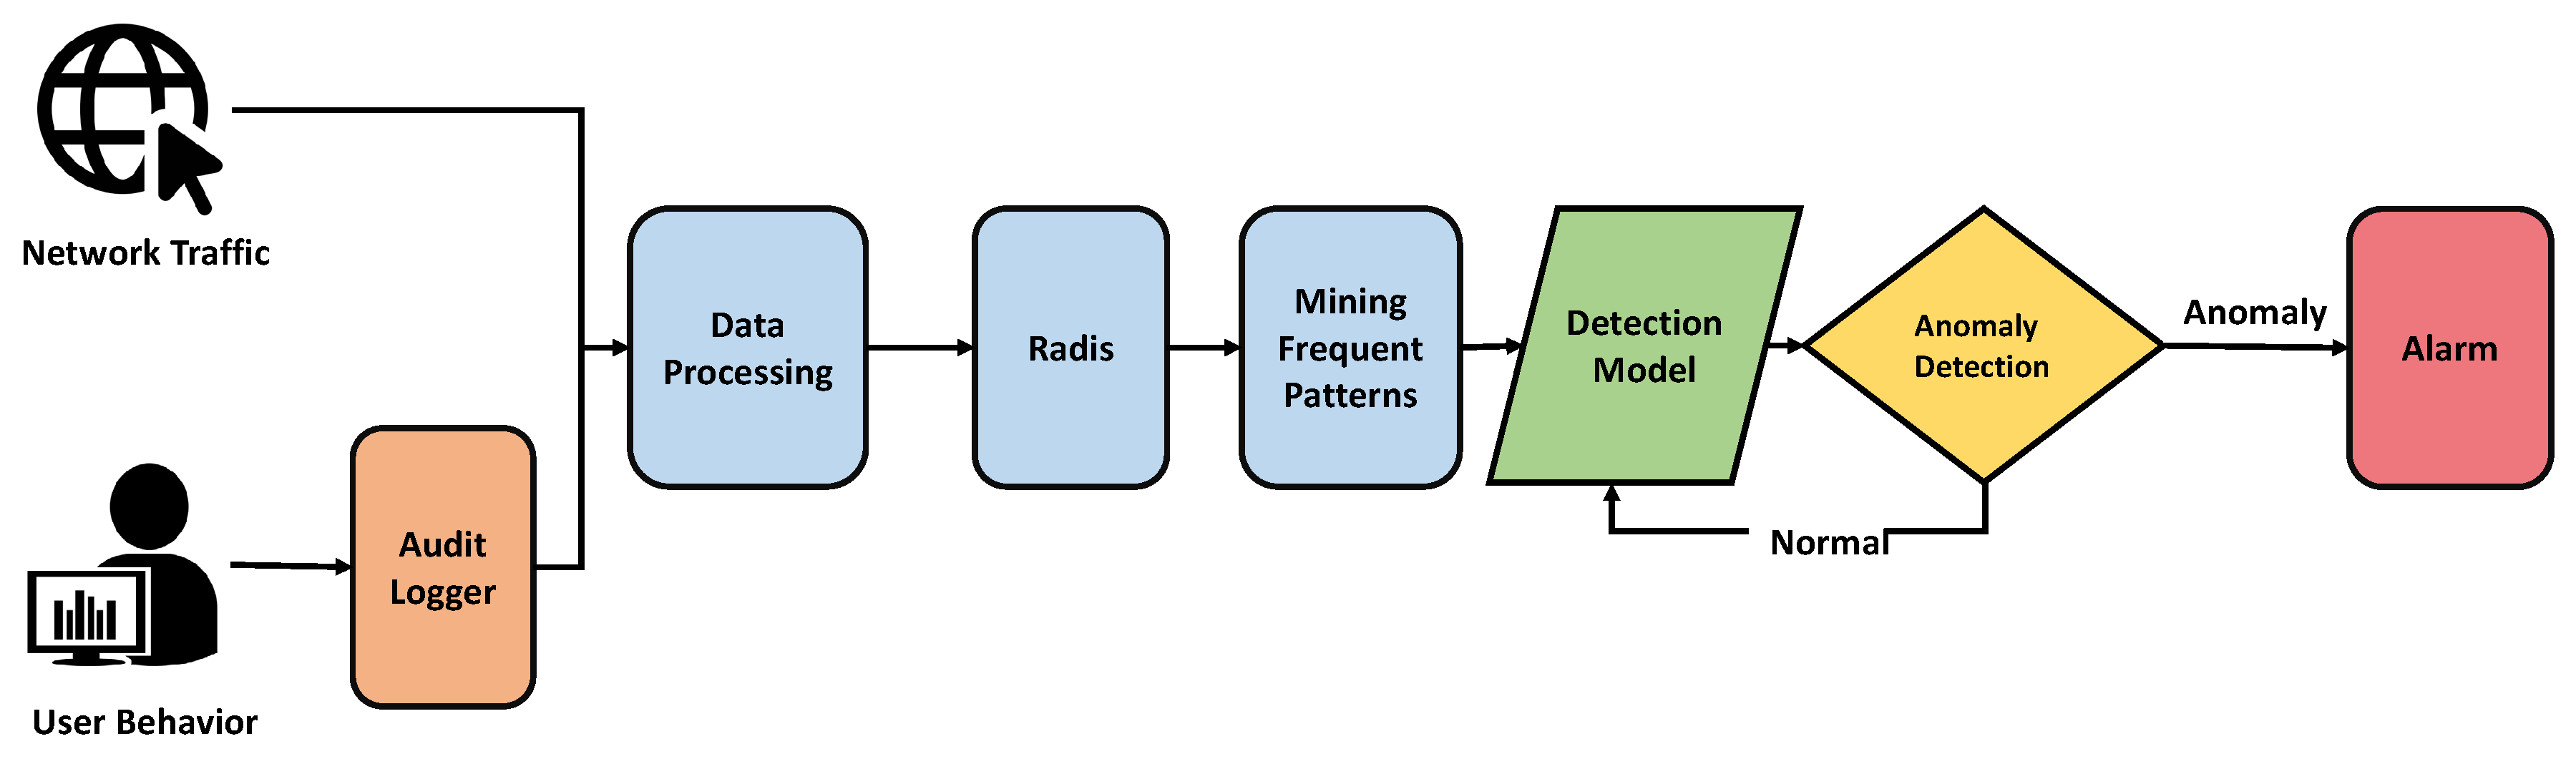
- We propose a framework which can mine frequent patterns from the user network traffic to represent user network behavior. We use frequent patterns to construct user behavior models for anomaly detection. Moreover, a time-decay factor is applied to the frequent pattern for distinguishing the weights between the current network flow and historical network flow.
- To deal with the changes of user behavior, a detection model update strategy is provided in the anomaly detection framework.
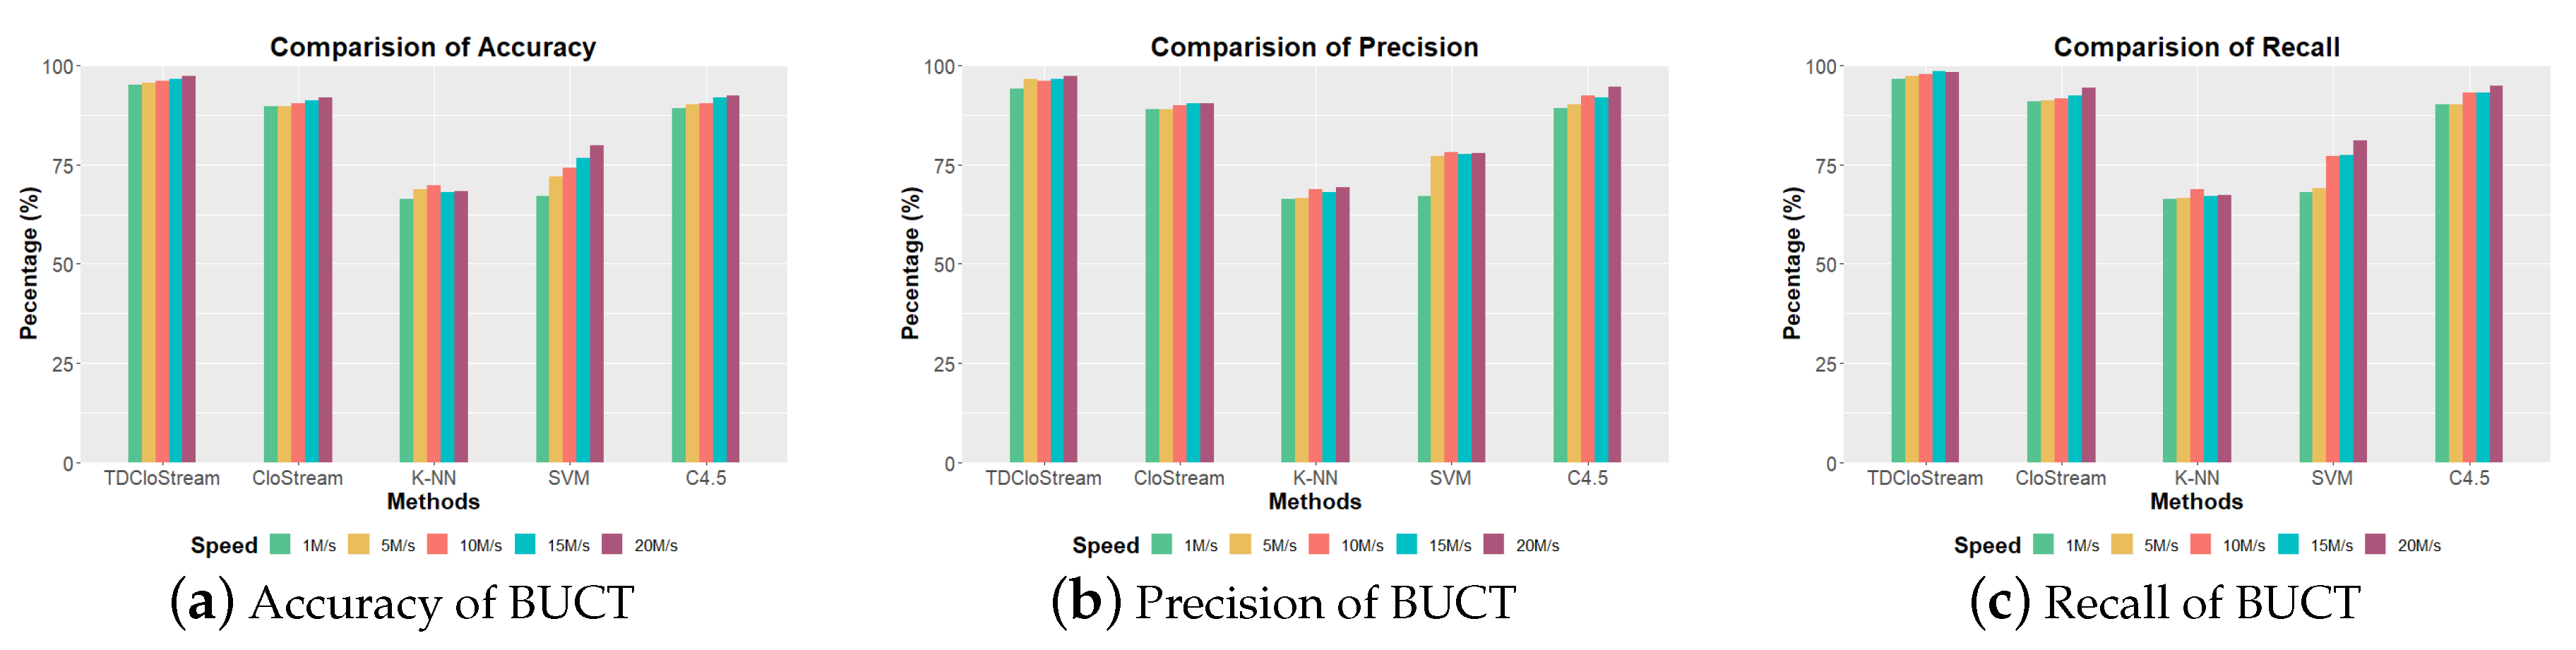
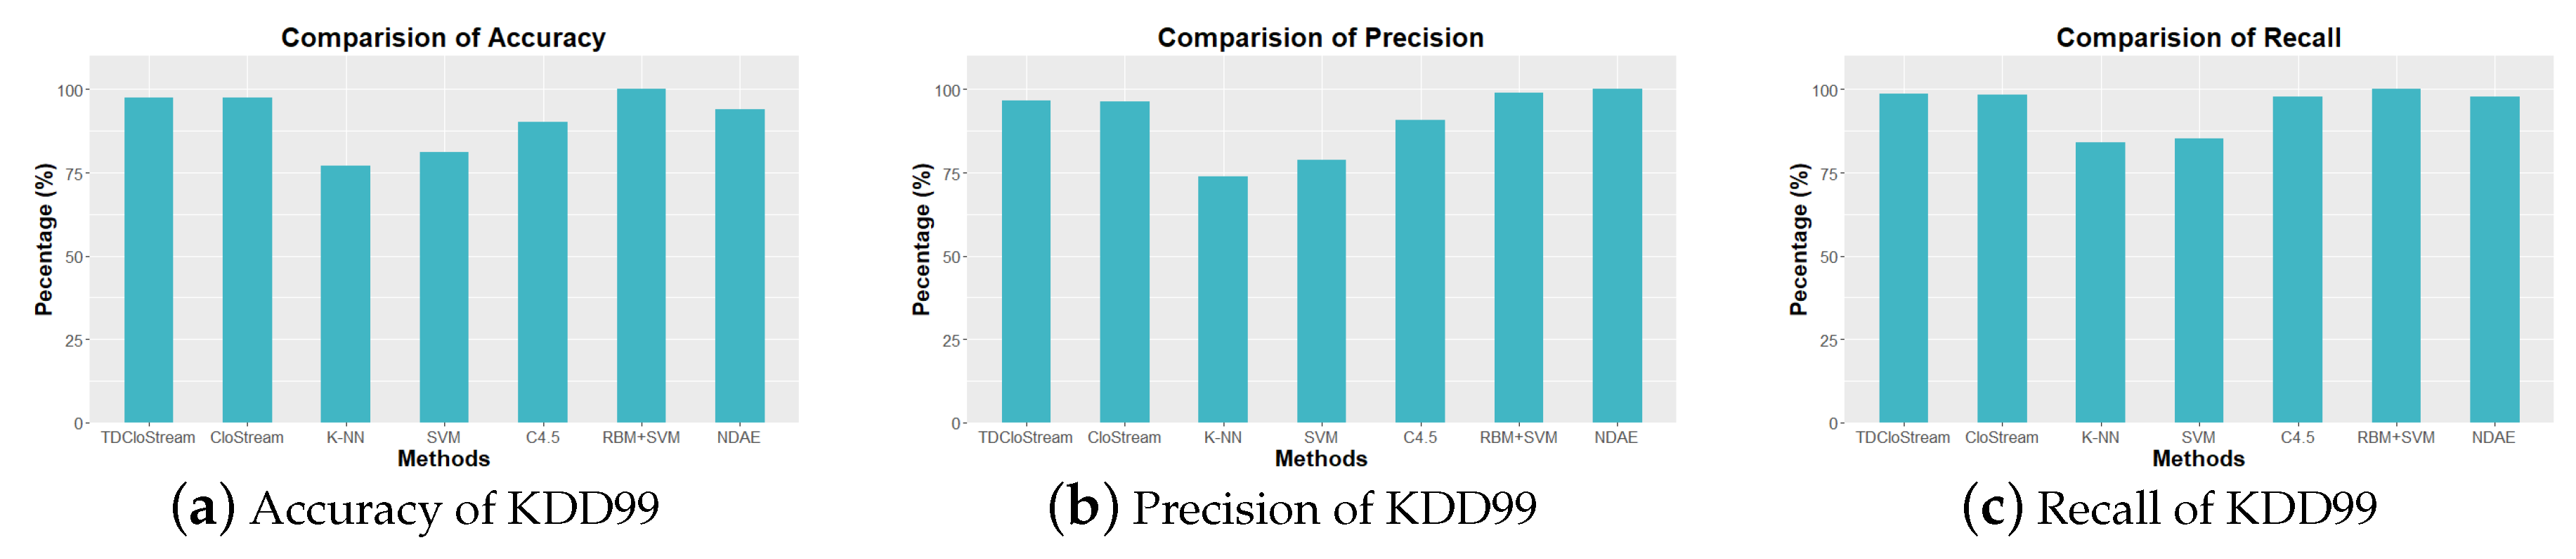
- Experimental results show that the proposed method can detect user behavior anomaly, and the network anomaly detection performance achieved by the proposed method is similar to the state-of-the-art methods (Restricted Boltzmann Machine and Support Vector Machines (RBM+SVM) [14] and non-symmetric deep auto-encoder (NDAE) [15]) and significantly better than the baseline methods (K-nearest Neighbors (K-NN), Support Vector Machines (SVM), and C4.5 Decision Tree).
2. Related Work
2.1. Network Anomaly Detection
2.2. User Behavior Anomaly Detection
3. Frequent Pattern
3.1. Closed Frequent Patterns
3.2. Closed Frequent Pattern Based on Time-Decay
4. Framework
5. Algorithm
5.1. TDCloStream Algorithm
| Algorithm 1: TDCloStream |
 |
| Algorithm 2: TDCloStreamADD |
 |
5.2. Anomaly Detection and Model Update
| Algorithm 3: Anomaly detection and model update |
 |
6. Evaluation
6.1. Datasets
- DOS: denial-of-service, e.g., SYN-ACK flood attack;
- R2L: unauthorized remote access, e.g., brute force password attack;
- U2R: unauthorized local root privileges, e.g., privilege escalation attack;
- Probing: surveillance and data collection, e.g., port scanning.
6.2. Features
6.3. Metrics
- TP: anomaly traffic transactions classified as anomaly transactions.
- FP: normal traffic transactions classified as anomaly transactions.
- TN: normal traffic transactions classified as normal transactions.
- FN: anomaly traffic transactions classified as normal transactions.
6.4. Results
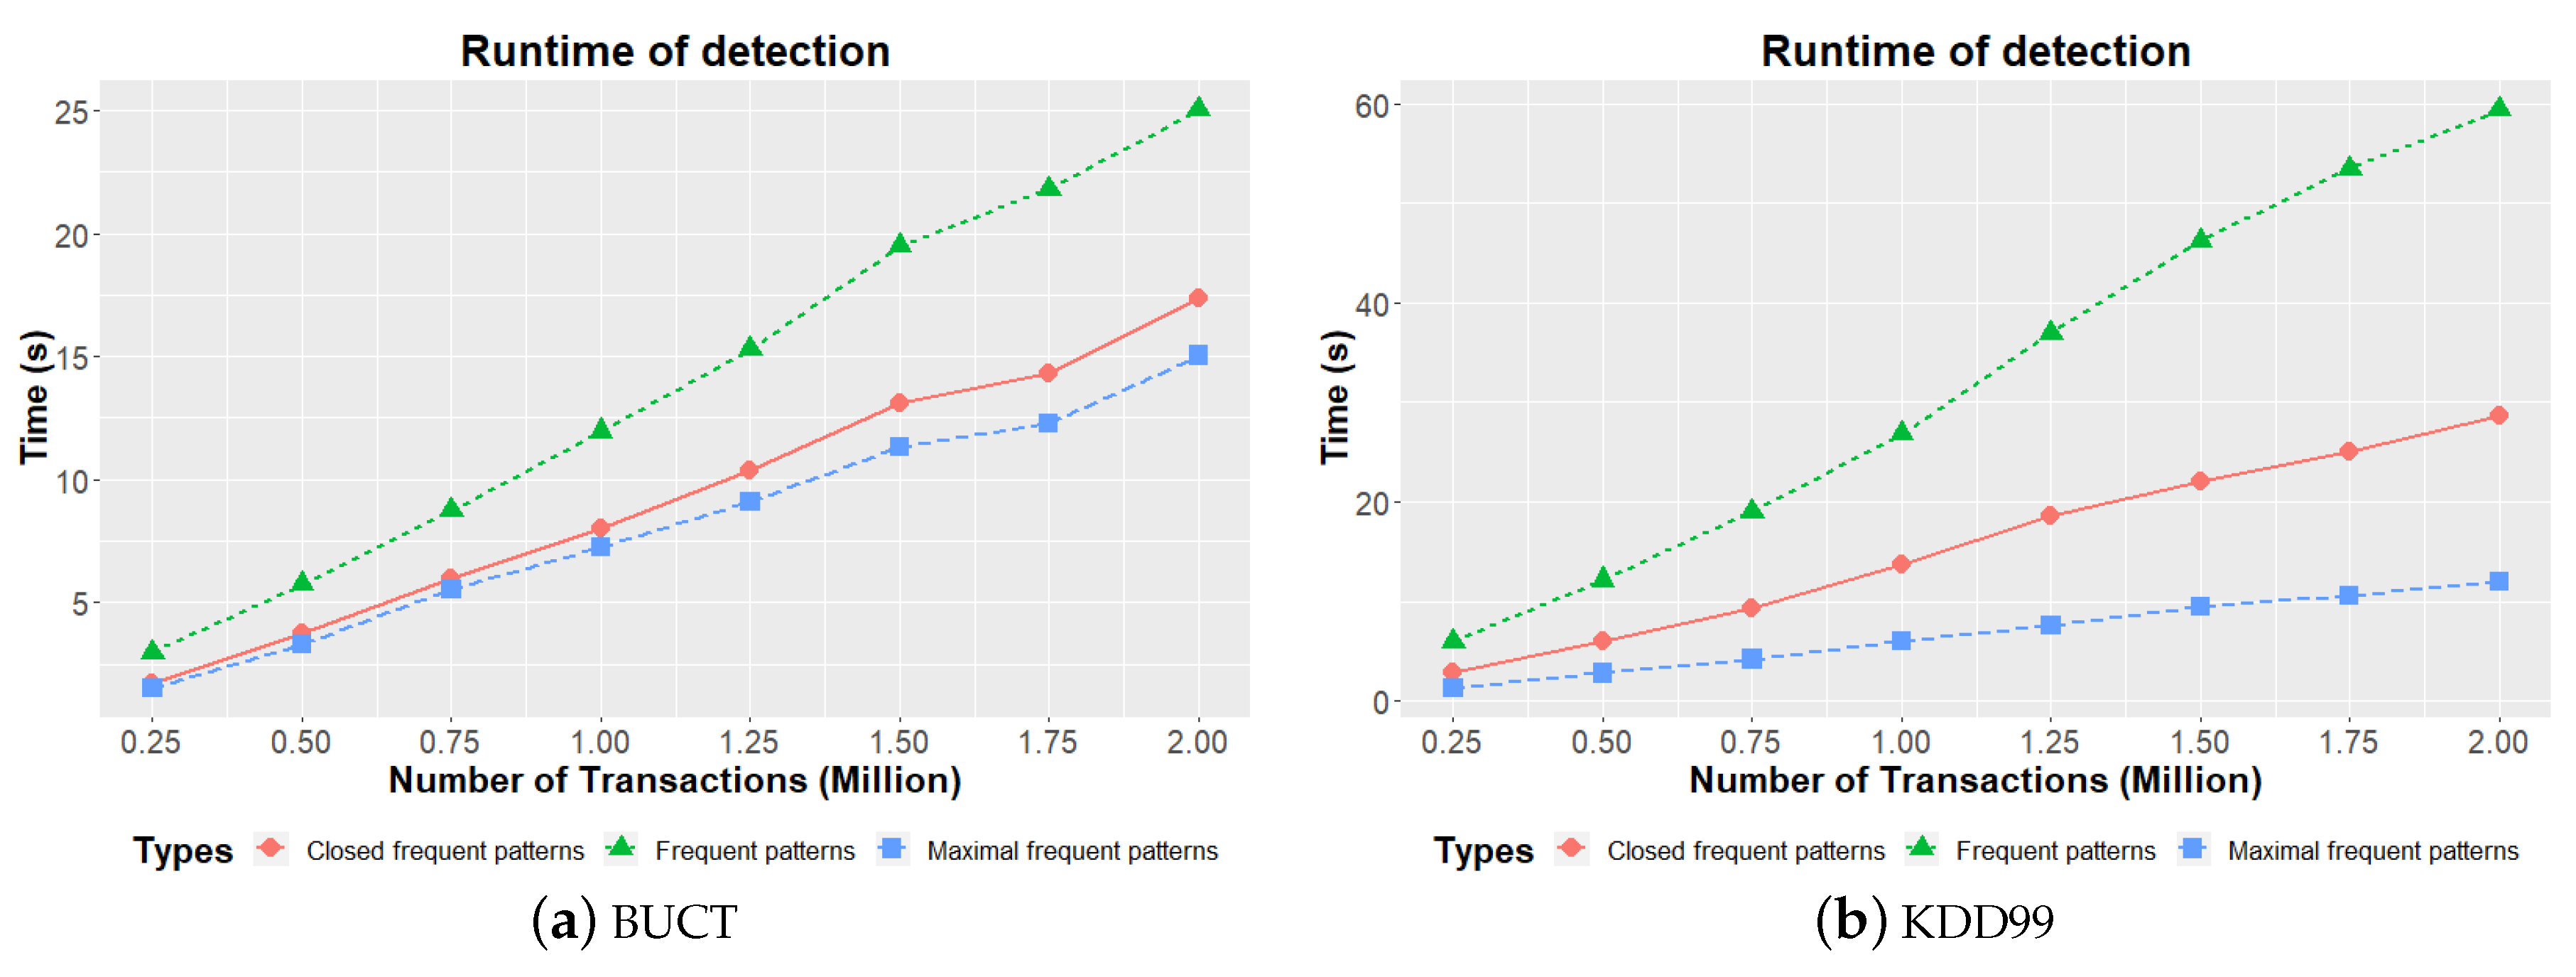
6.4.1. Mining Frequent Patterns
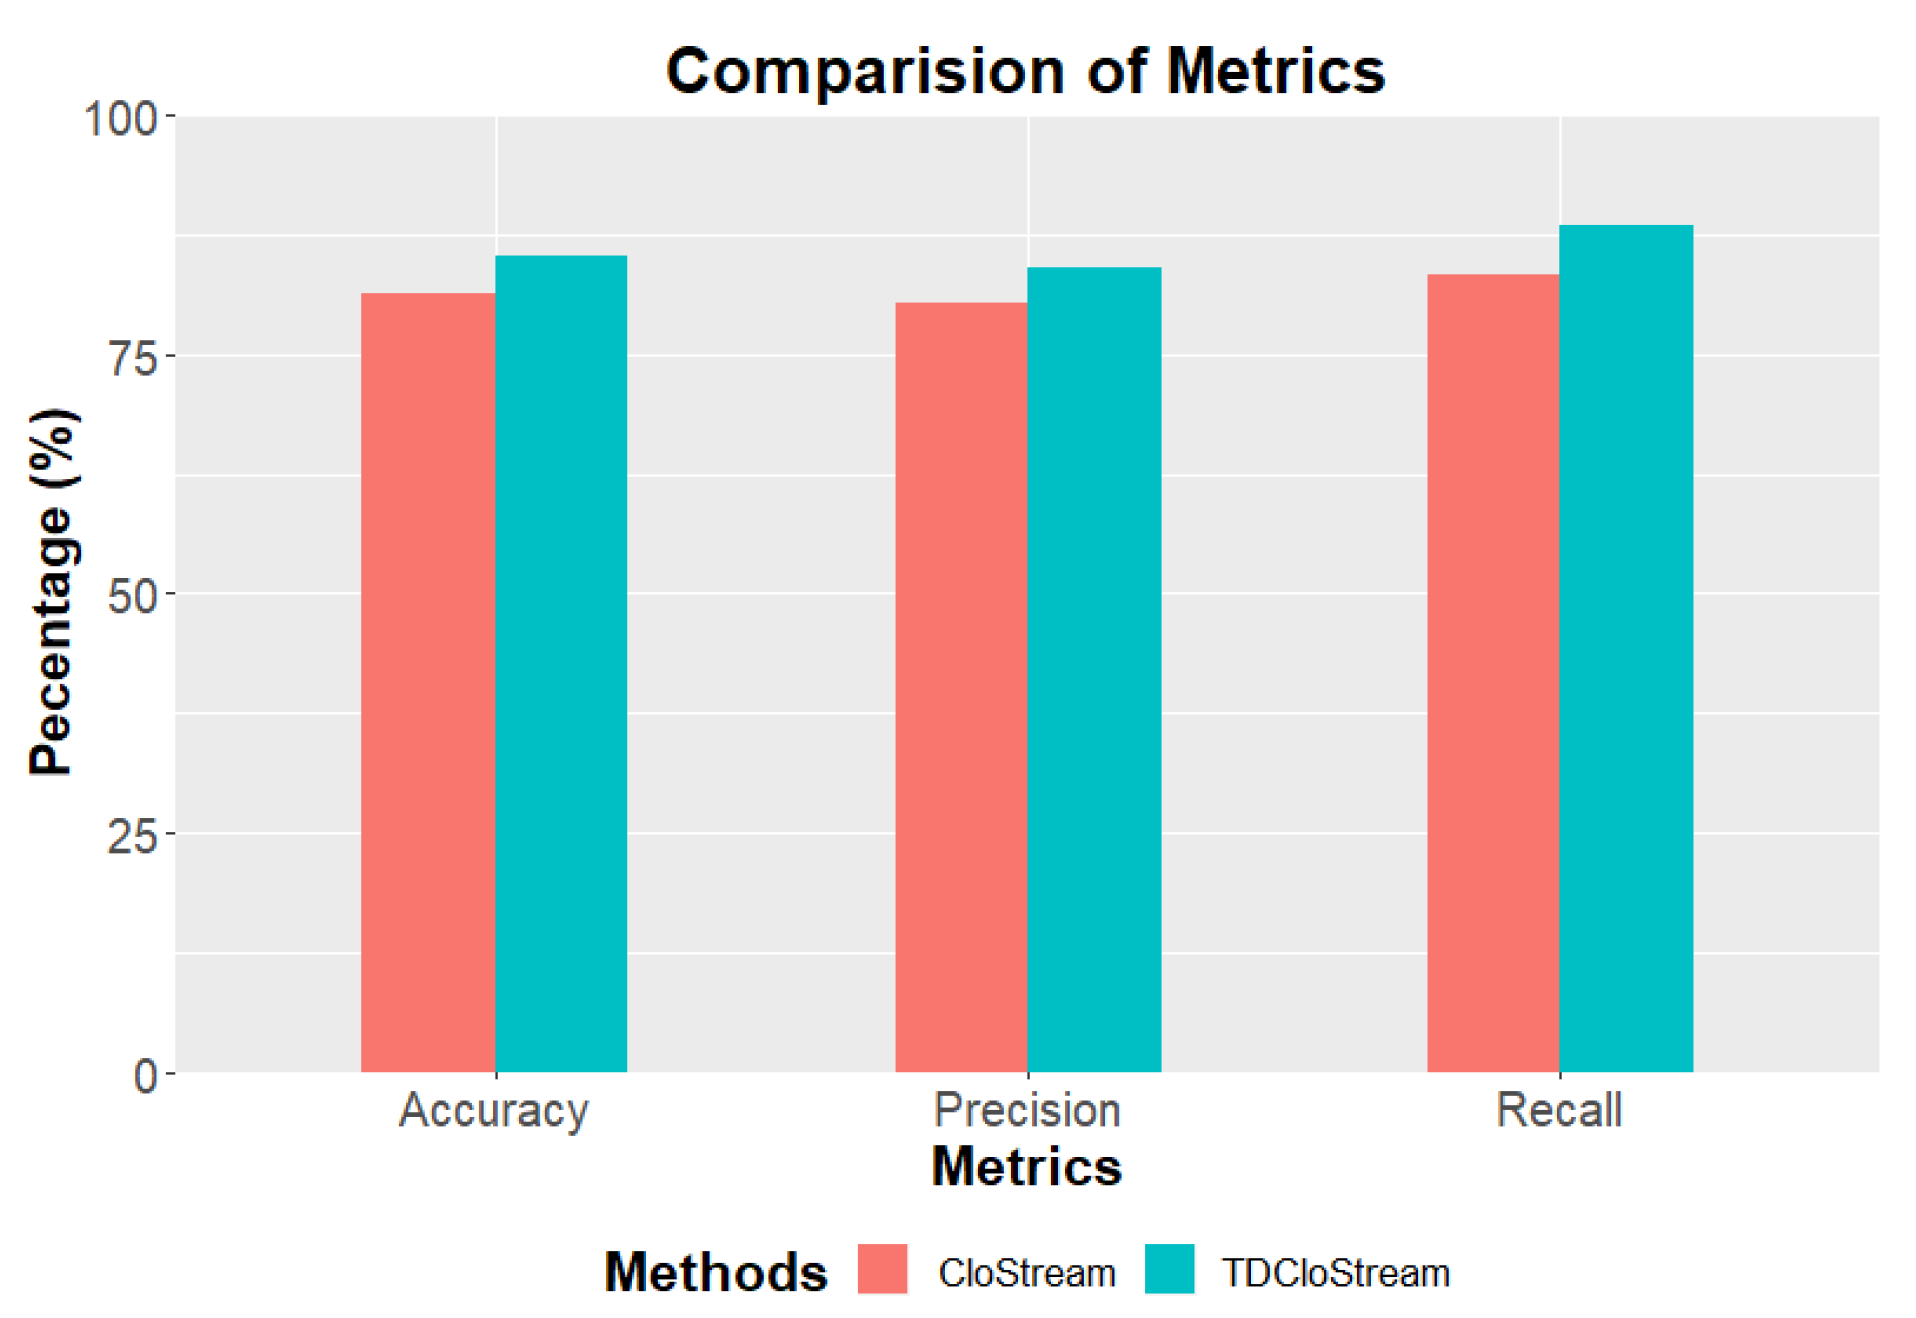
6.4.2. User Anomaly Behavior Detection
6.4.3. Network Anomaly Detection
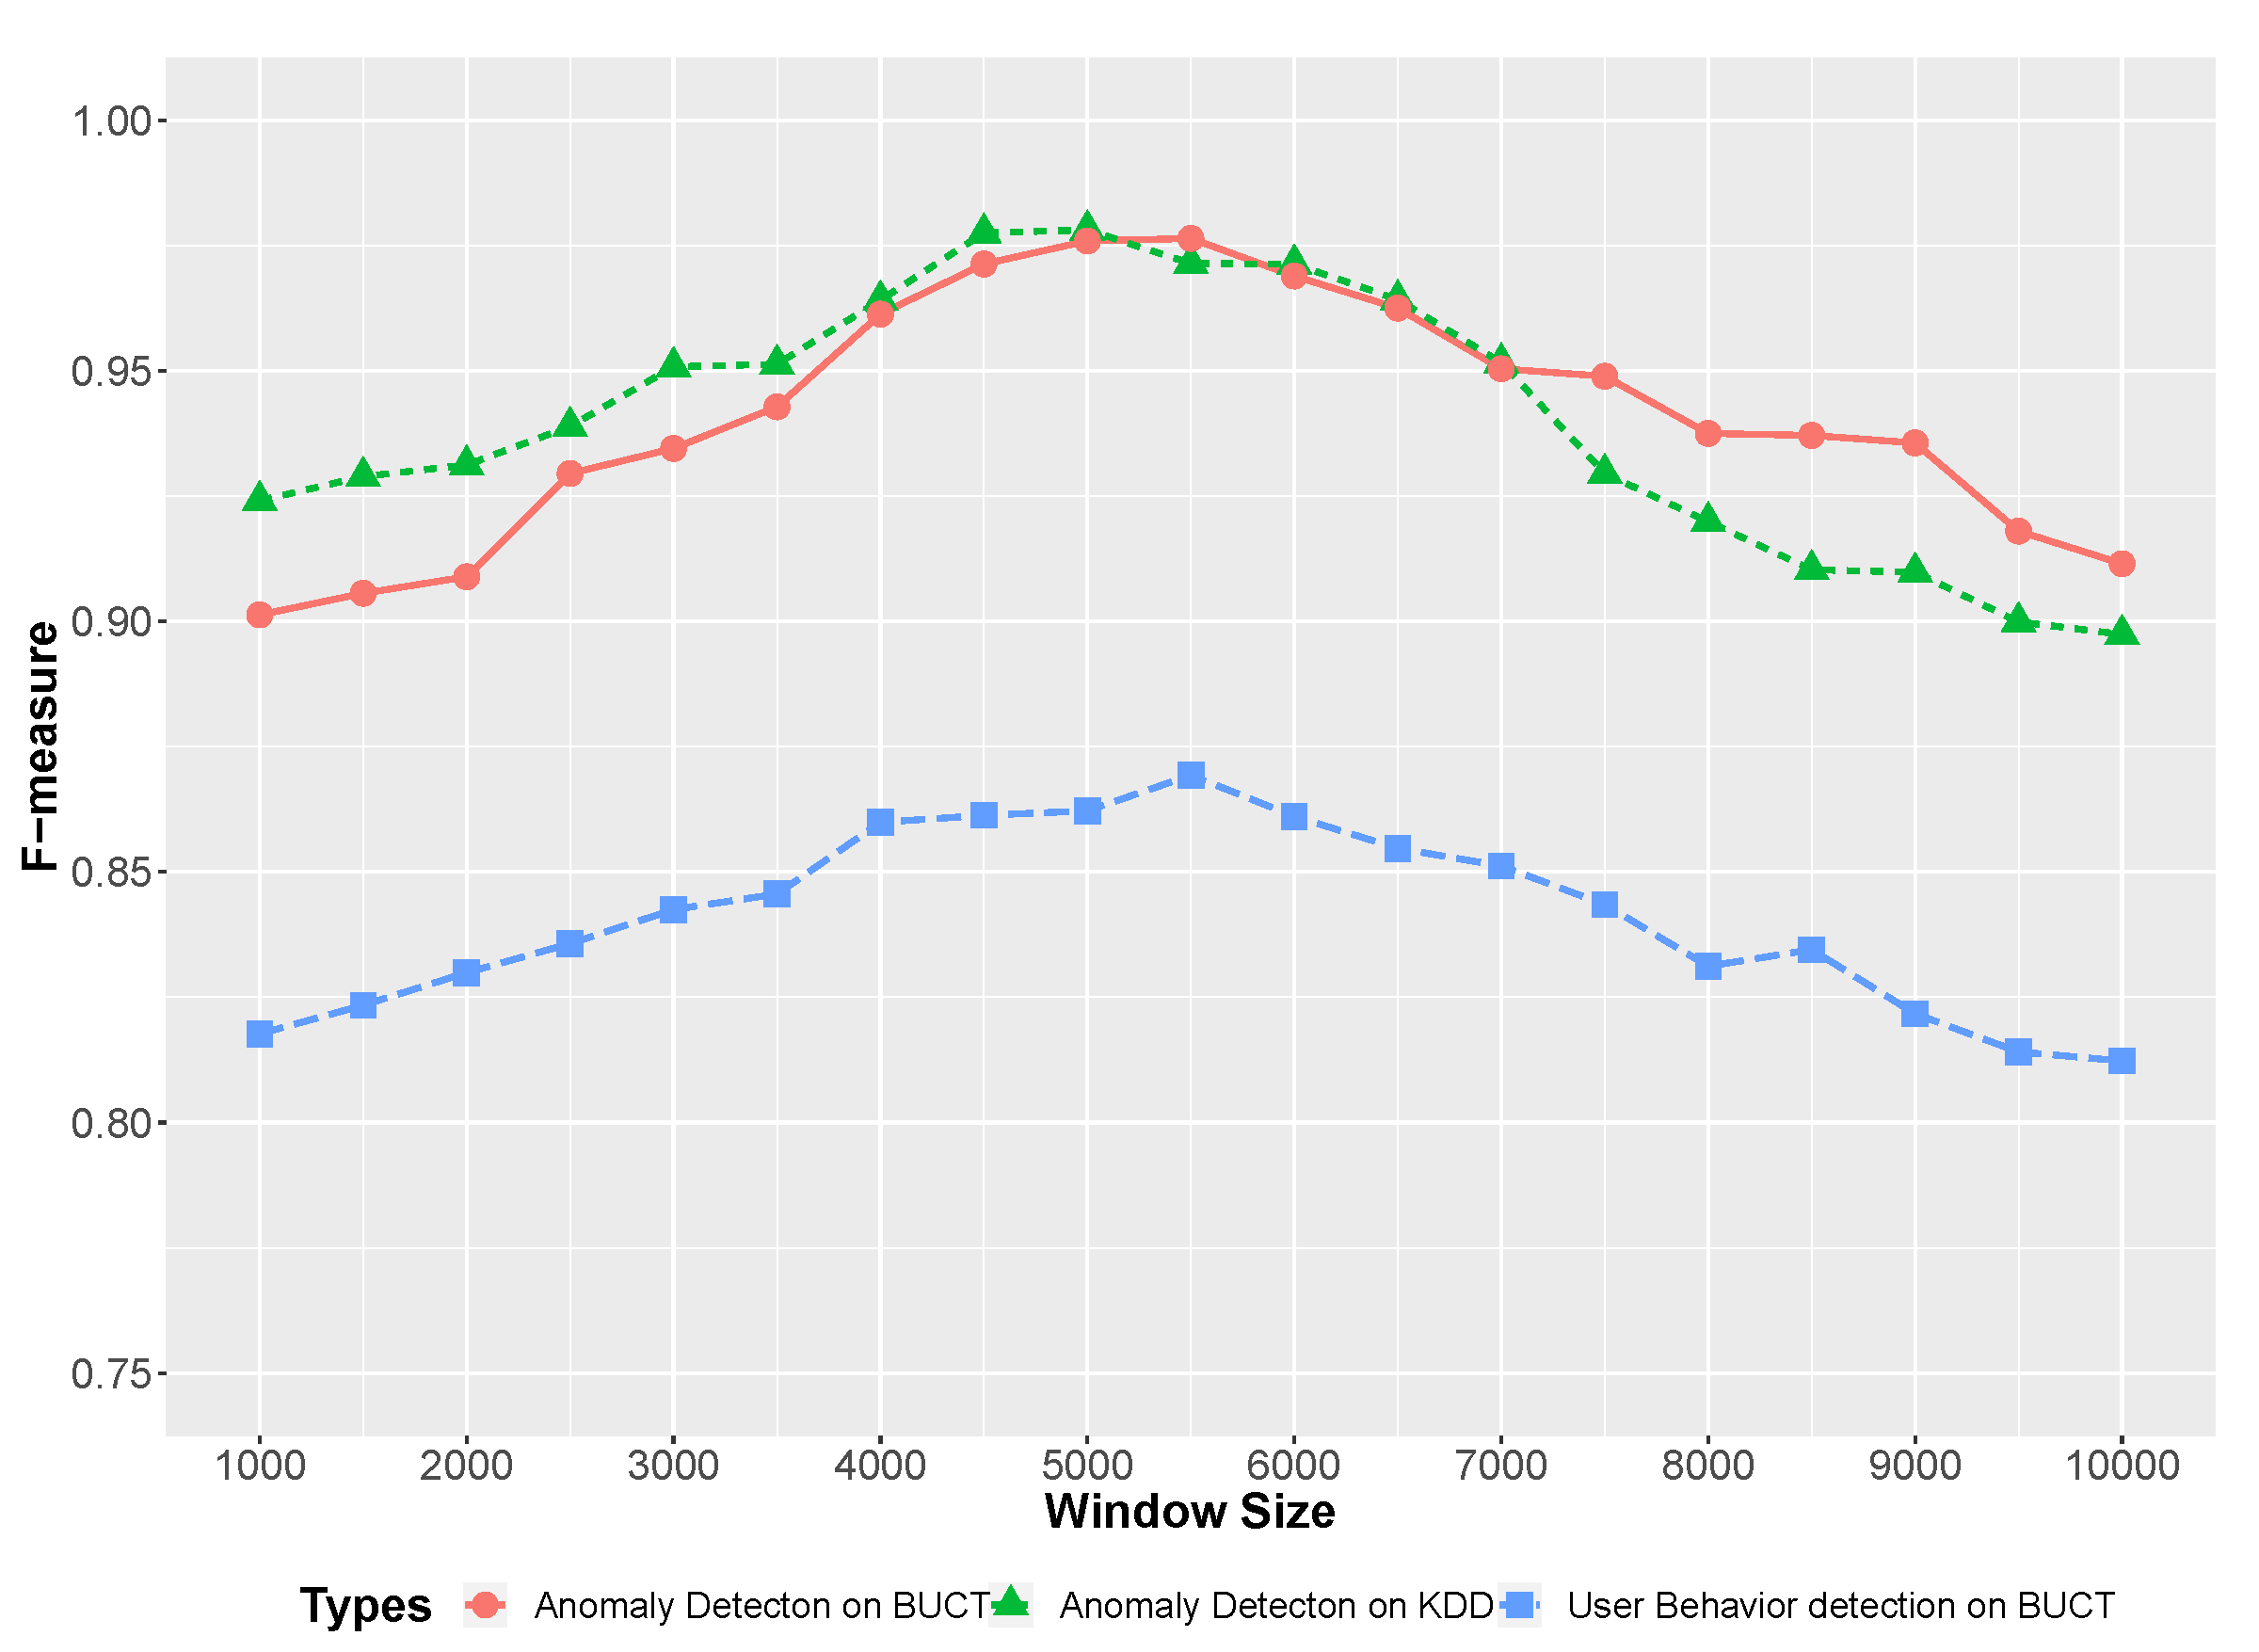
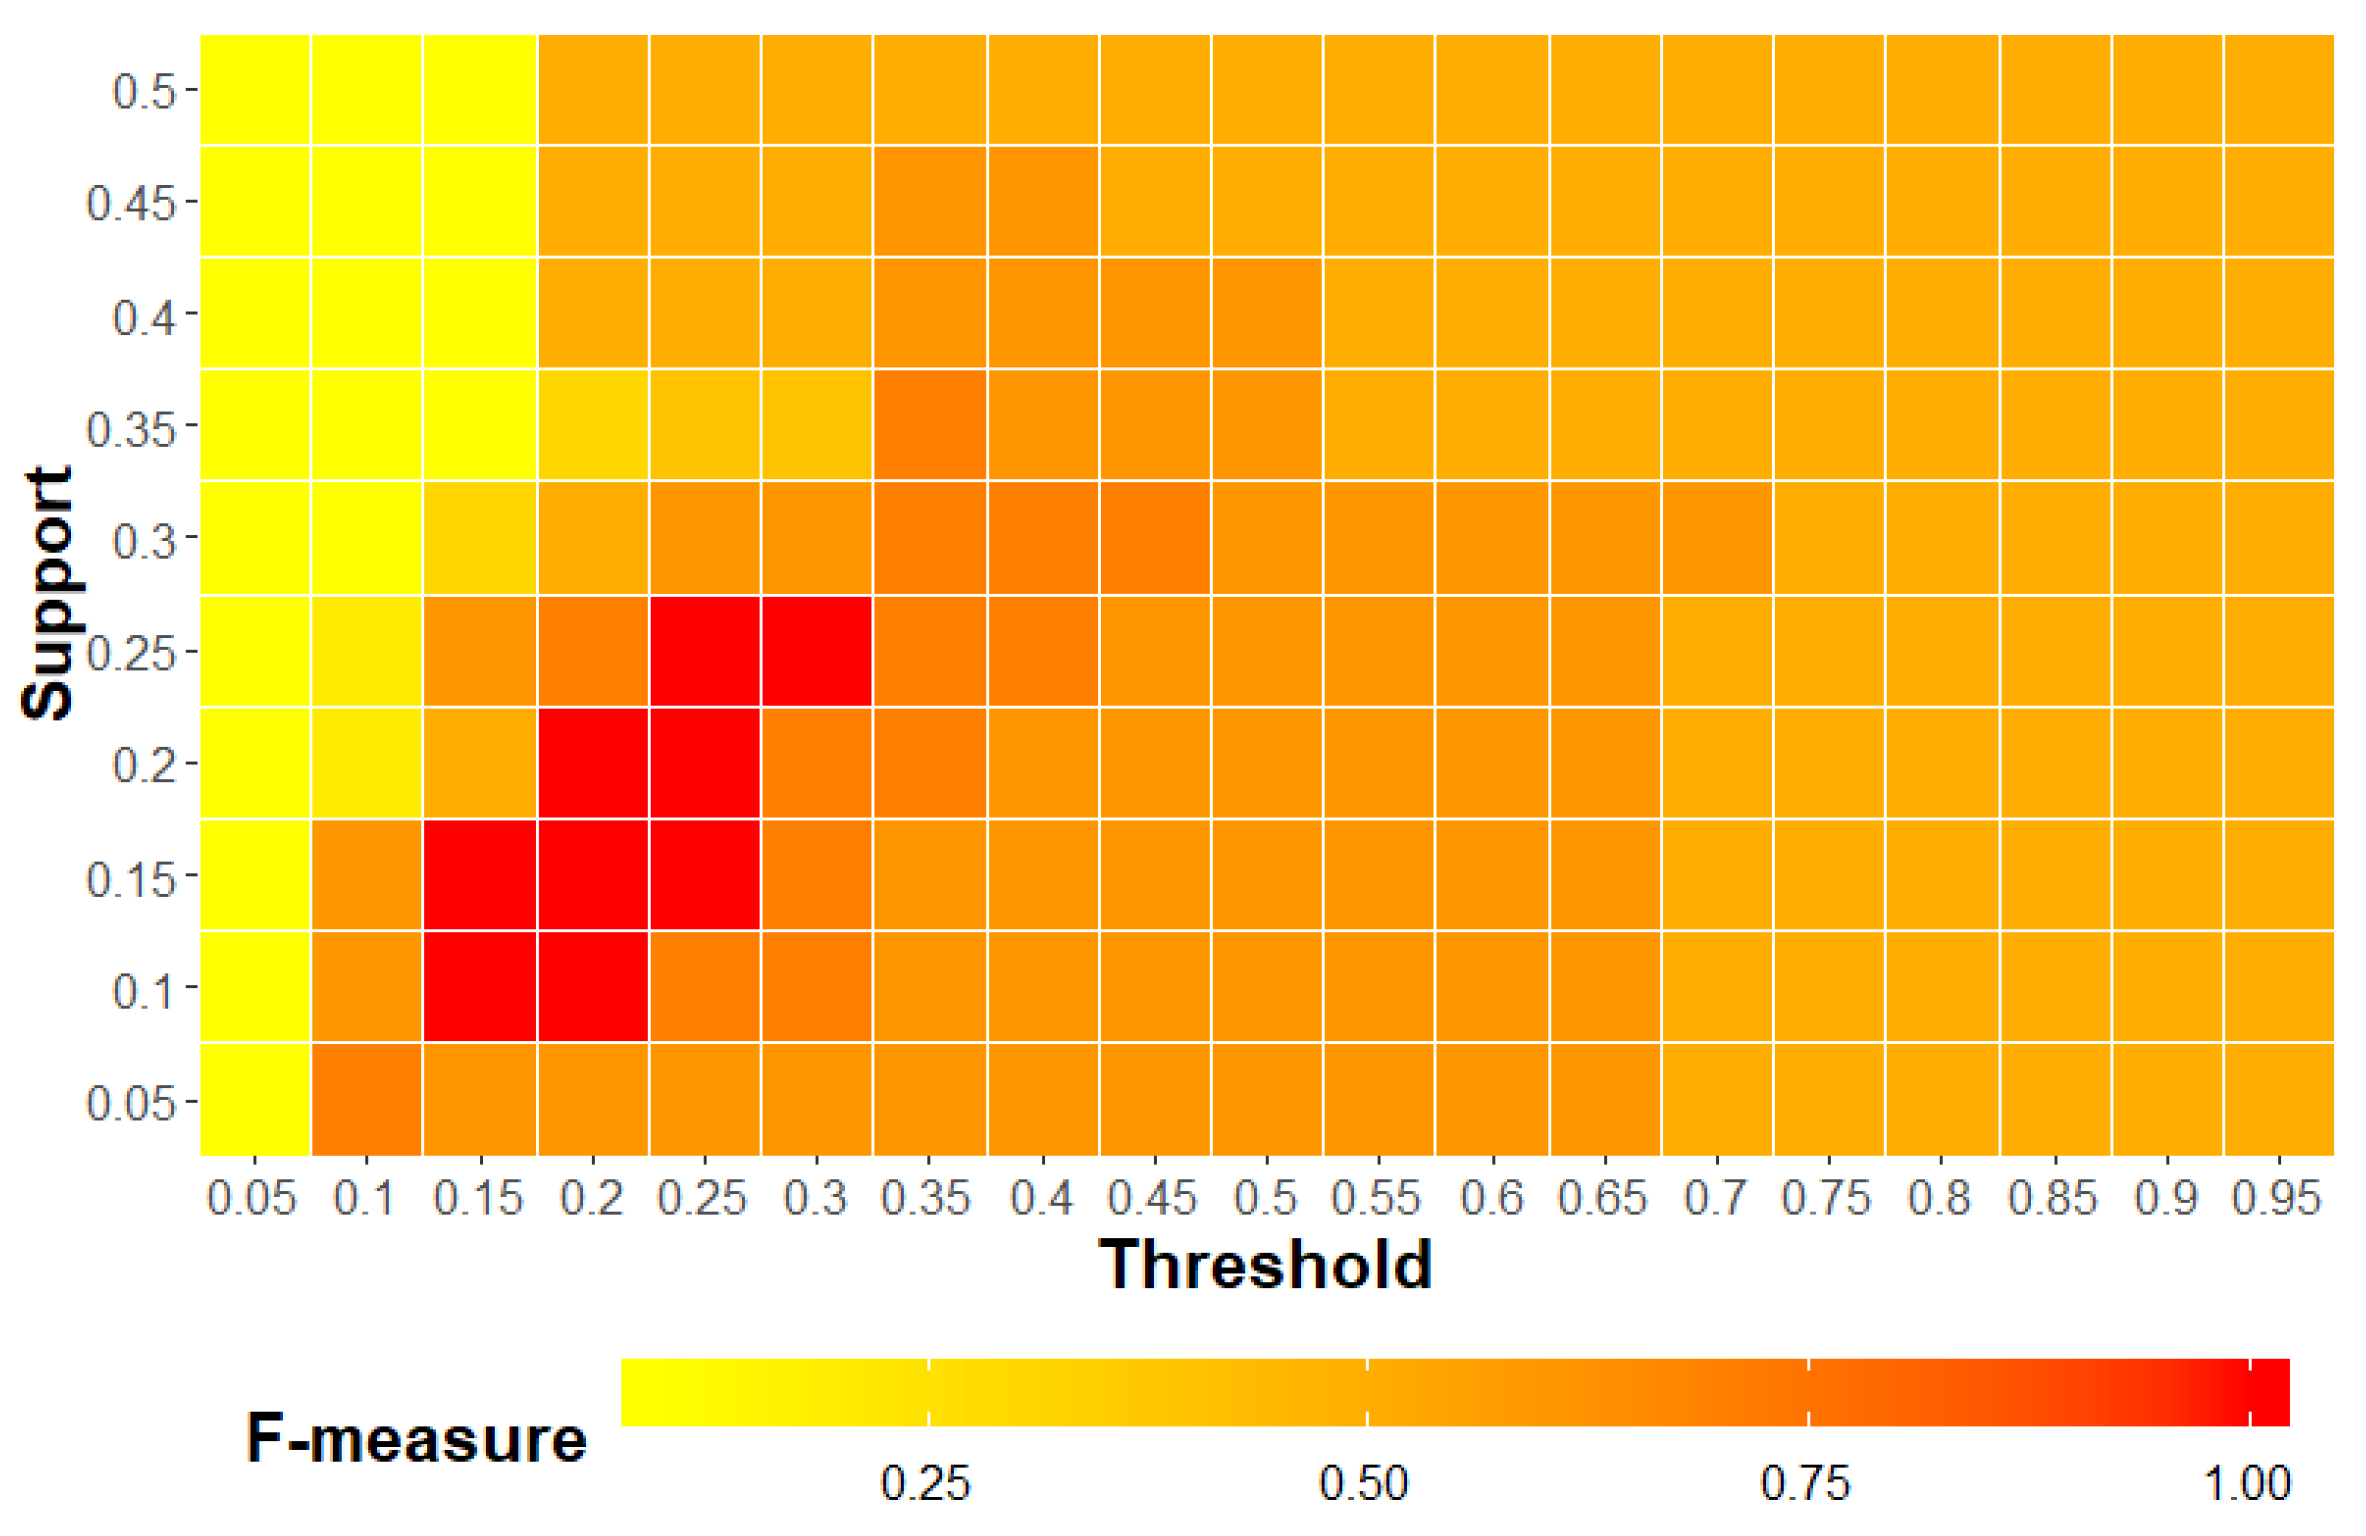
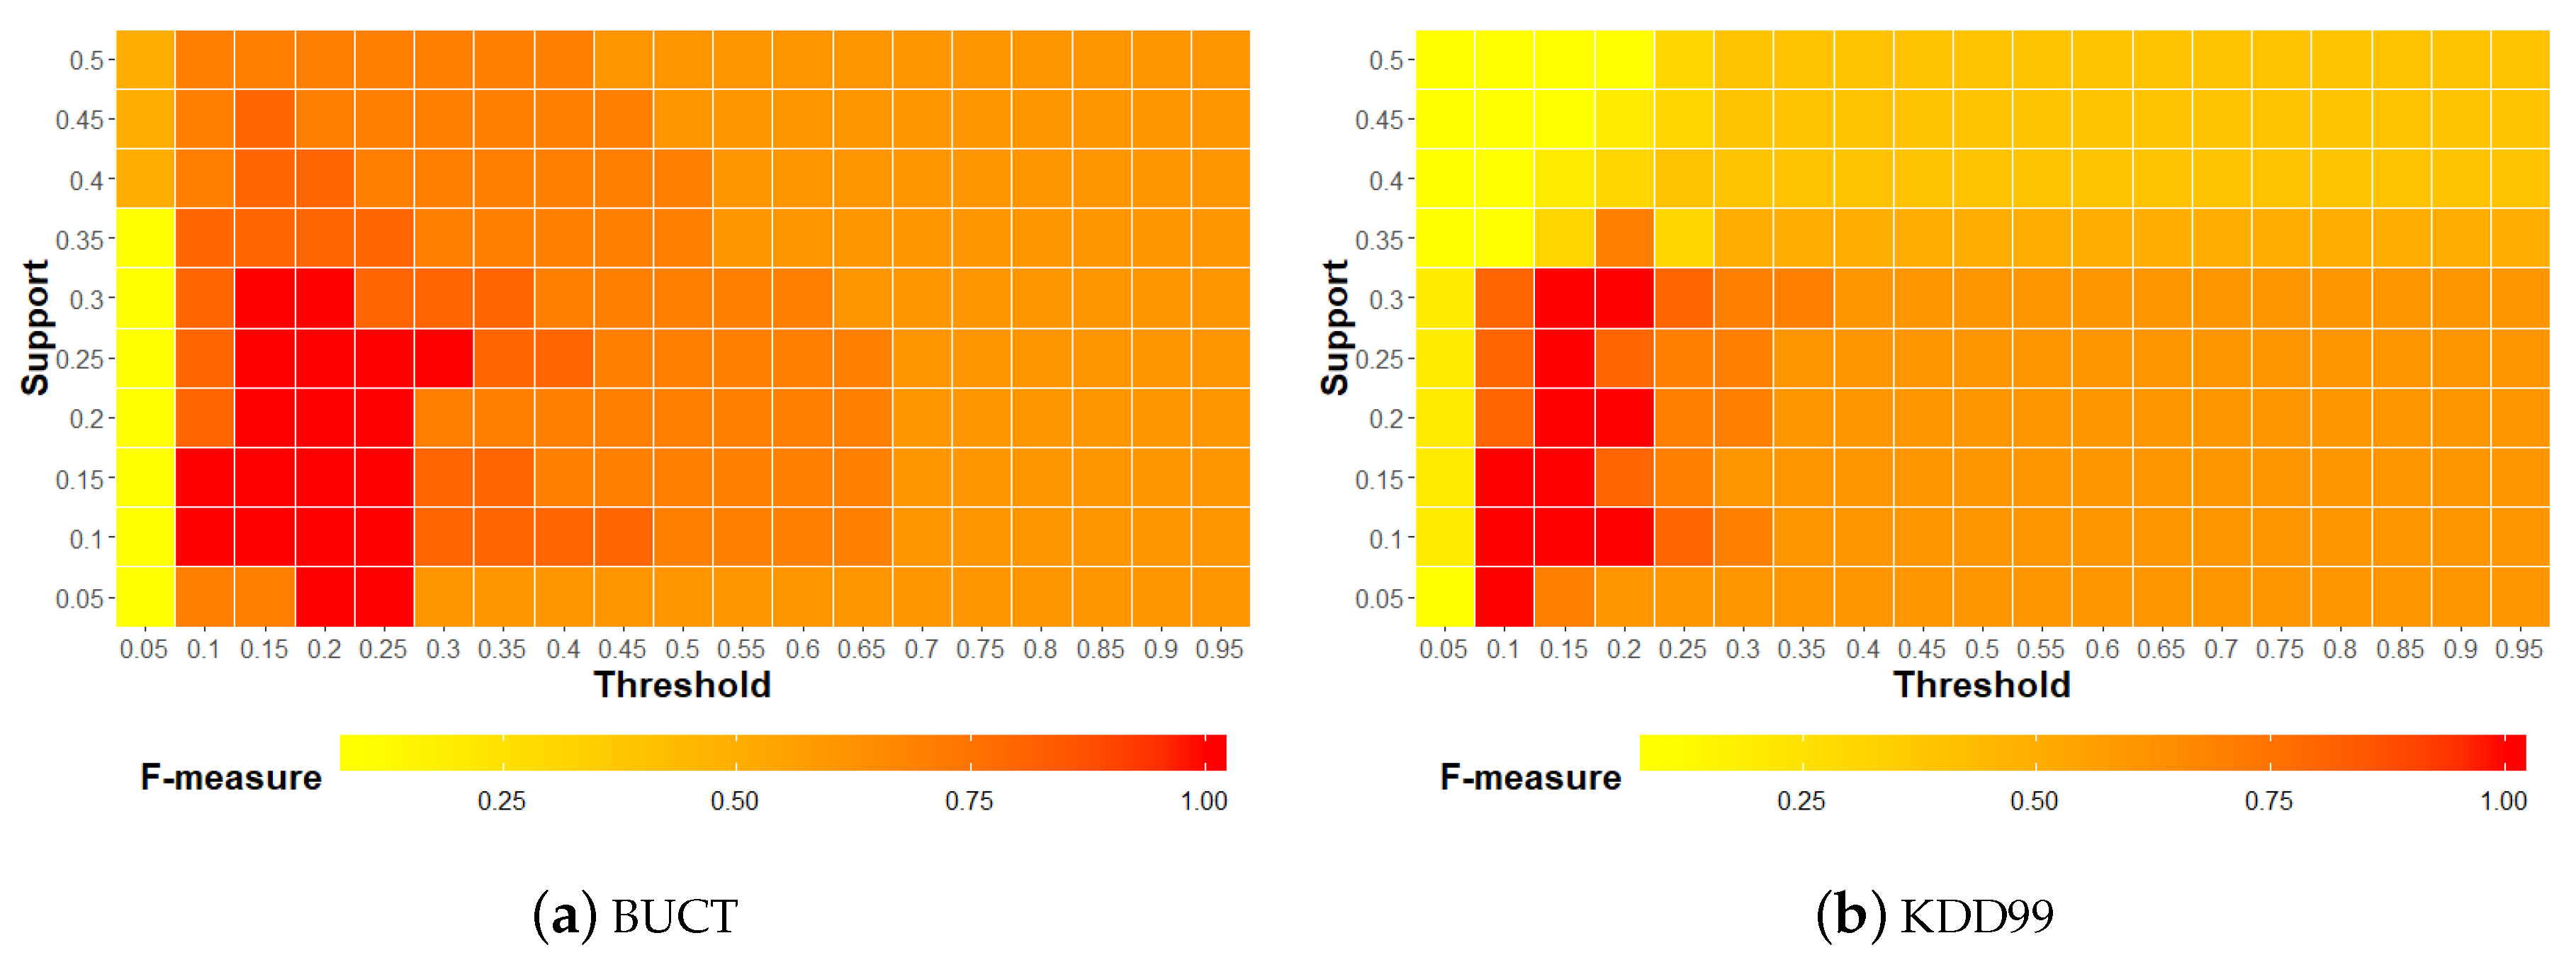
6.4.4. Parameter Evaluation
7. Conclusions
Author Contributions
Funding
Conflicts of Interest
References
- Buczak, A.L.; Guven, E. A survey of data mining and machine learning methods for cyber security intrusion detection. IEEE Commun. Surv. Tutor. 2016, 18, 1153–1176. [Google Scholar] [CrossRef]
- Husák, M.; Komárková, J.; Bou-Harb, E.; Čeleda, P. Survey of Attack Projection, Prediction, and Forecasting in Cyber Security. IEEE Commun. Surv. Tutor. 2018, 21, 640–660. [Google Scholar] [CrossRef]
- Ambusaidi, M.A.; He, X.; Nanda, P.; Tan, Z. Building an intrusion detection system using a filter-based feature selection algorithm. IEEE Trans. Comput. 2016, 65, 2986–2998. [Google Scholar] [CrossRef]
- Aljawarneh, S.; Aldwairi, M.; Yassein, M.B. Anomaly-based intrusion detection system through feature selection analysis and building hybrid efficient model. J. Comput. Sci. 2018, 25, 152–160. [Google Scholar] [CrossRef]
- Ashfaq, R.A.R.; Wang, X.Z.; Huang, J.Z.; Abbas, H.; He, Y.L. Fuzziness based semi-supervised learning approach for intrusion detection system. Inf. Sci. 2017, 378, 484–497. [Google Scholar] [CrossRef]
- Mirsky, Y.; Doitshman, T.; Elovici, Y.; Shabtai, A. Kitsune: An ensemble of autoencoders for online network intrusion detection. arXiv 2018, arXiv:1802.09089. [Google Scholar]
- Zenati, H.; Romain, M.; Foo, C.S.; Lecouat, B.; Chandrasekhar, V. Adversarially Learned Anomaly Detection. In Proceedings of the 2018 IEEE International Conference on Data Mining (ICDM), Singapore, 17–20 November 2018. [Google Scholar] [CrossRef]
- Parwez, M.S.; Rawat, D.B.; Garuba, M. Big data analytics for user-activity analysis and user-anomaly detection in mobile wireless network. IEEE Trans. Ind. Inform. 2017, 13, 2058–2065. [Google Scholar] [CrossRef]
- Fawaz, A.M.; Sanders, W.H. Learning process behavioral baselines for anomaly detection. In Proceedings of the 2017 IEEE 22nd Pacific Rim International Symposium on Dependable Computing (PRDC), Christchurch, New Zealand, 22–25 January 2017; pp. 145–154. [Google Scholar]
- Legg, P.A.; Buckley, O.; Goldsmith, M.; Creese, S. Automated insider threat detection system using user and role-based profile assessment. IEEE Syst. J. 2015, 11, 503–512. [Google Scholar] [CrossRef]
- Bi, M.; Xu, J.; Wang, M.; Zhou, F. Anomaly detection model of user behavior based on principal component analysis. J. Ambient. Intell. Humaniz. Comput. 2016, 7, 547–554. [Google Scholar] [CrossRef]
- Najafabadi, M.M.; Khoshgoftaar, T.M.; Calvert, C.; Kemp, C. User behavior anomaly detection for application layer ddos attacks. In Proceedings of the 2017 IEEE International Conference on Information Reuse and Integration (IRI), San Diego, CA, USA, 4–6 August 2017; pp. 154–161. [Google Scholar]
- Han, J.; Cheng, H.; Xin, D.; Yan, X. Frequent pattern mining: Current status and future directions. Data Min. Knowl. Discov. 2007, 15, 55–86. [Google Scholar] [CrossRef]
- Garg, S.; Kaur, K.; Kumar, N.; Rodrigues, J.J. Hybrid Deep Learning-based Anomaly Detection Scheme for Suspicious Flow Detection in SDN: A Social Multimedia Perspective. IEEE Trans. Multimed. 2019, 21, 566–578. [Google Scholar] [CrossRef]
- Shone, N.; Ngoc, T.N.; Phai, V.D.; Shi, Q. A deep learning approach to network intrusion detection. IEEE Trans. Emerg. Top. Comput. Intell. 2018, 2, 41–50. [Google Scholar] [CrossRef]
- Brahmi, H.; Brahmi, I.; Yahia, S.B. OMC-IDS: At the cross-roads of OLAP mining and intrusion detection. In Pacific-Asia Conference on Knowledge Discovery and Data Mining; Springer: Berlin, Germany, 2012; pp. 13–24. [Google Scholar]
- Li, Y.; Xia, J.; Zhang, S.; Yan, J.; Ai, X.; Dai, K. An efficient intrusion detection system based on support vector machines and gradually feature removal method. Expert Syst. Appl. 2012, 39, 424–430. [Google Scholar] [CrossRef]
- Papamartzivanos, D.; Mármol, F.G.; Kambourakis, G. Dendron: Genetic trees driven rule induction for network intrusion detection systems. Future Gener. Comput. Syst. 2018, 79, 558–574. [Google Scholar] [CrossRef]
- Cao, N.; Shi, C.; Lin, S.; Lu, J.; Lin, Y.R.; Lin, C.Y. Targetvue: Visual analysis of anomalous user behaviors in online communication systems. IEEE Trans. Vis. Comput. Graph. 2015, 22, 280–289. [Google Scholar] [CrossRef] [PubMed]
- Noorbehbahani, F.; Fanian, A.; Mousavi, R.; Hasannejad, H. An incremental intrusion detection system using a new semi-supervised stream classification method. Int. J. Commun. Syst. 2017, 30, e3002. [Google Scholar] [CrossRef]
- Mohamed, M.R.; Nasr, A.A.; Tarrad, I.F.; Abdulmageed, M.Z. Exploiting Incremental Classifiers for the Training of an Adaptive Intrusion Detection Model. IJ Netw. Secur. 2019, 21, 275–289. [Google Scholar]
- Saurav, S.; Malhotra, P.; TV, V.; Gugulothu, N.; Vig, L.; Agarwal, P.; Shroff, G. Online anomaly detection with concept drift adaptation using recurrent neural networks. In Proceedings of the ACM India Joint International Conference on Data Science and Management of Data, Goa, India, 11–13 January 2018; pp. 78–87. [Google Scholar]
- Yen, S.J.; Lee, Y.S.; Wu, C.W.; Lin, C.L. An efficient algorithm for maintaining frequent closed itemsets over data stream. In International Conference on Industrial, Engineering and Other Applications of Applied Intelligent Systems; Springer: Berlin, Germany, 2009; pp. 767–776. [Google Scholar]
- Han, M.; Ding, J.; Li, J. TDMCS: An efficient method for mining closed frequent patterns over data streams based on time decay model. Int. Arab J. Inf. Technol. 2017, 14, 851–860. [Google Scholar]
- Deri, L.; Martinelli, M.; Bujlow, T.; Cardigliano, A. ndpi: Open-source high-speed deep packet inspection. In Proceedings of the 2014 International Wireless Communications and Mobile Computing Conference (IWCMC), Nicosia, Cyprus, 4–8 August 2014; pp. 617–622. [Google Scholar]
- Carlson, J.L. Redis in Action; Manning Publications Co.: Shelter Island, NY, USA, 2013. [Google Scholar]
- Kobayashi, T.H.; Batista, A.B.; Brito, A.M.; Pires, P.S.M. Using a packet manipulation tool for security analysis of industrial network protocols. In Proceedings of the 2007 IEEE Conference on Emerging Technologies and Factory Automation (EFTA 2007), Patras, Greece, 25–28 September 2007; pp. 744–747. [Google Scholar]
- Kwon, D.; Kim, H.; Kim, J.; Suh, S.C.; Kim, I.; Kim, K.J. A survey of deep learning-based network anomaly detection. Clust. Comput. 2019, 22, 949–961. [Google Scholar] [CrossRef]
- Tavallaee, M.; Bagheri, E.; Lu, W.; Ghorbani, A.A. A detailed analysis of the KDD CUP 99 data set. In Proceedings of the 2009 IEEE Symposium on Computational Intelligence for Security and Defense Applications, Ottawa, ON, Canada, 8–10 July 2009; pp. 1–6. [Google Scholar]
- Zhao, Y.; Chen, J.; You, G.; Teng, J. Network Traffic Classification Model Based on MDL Criterion. In Advanced Multimedia and Ubiquitous Engineering; Springer: Berlin, Germany, 2016; pp. 1–8. [Google Scholar]
- Han, J.; Pei, J.; Yin, Y. Mining Frequent Patterns without Candidate Generation; ACM Sigmod Record; ACM: New York, NY, USA, 2000; Volume 29, pp. 1–12. [Google Scholar]


| Dataset | Records | Bandwidth | Size |
|---|---|---|---|
| BUCT | 32 million | 150 M/s | 1.3TB |
| KDD99 | 4.9 million | - | - |
| No. | Feature | Description |
|---|---|---|
| 1 | UserID | UserID of the transaction |
| 2 | protocol_type | TCP (Transmission Control Protocol), UDP (User Datagram Protocol), or Other |
| 3 | InPort | Source port |
| 4 | OutIP | Destination IP |
| 5 | OutPort | Destination Port |
| 6 | Pkts | Number of packets |
| 7 | Bytes | Size of flow |
| 8 | Max_pkt_size | Max packet size |
| 9 | Min_pkt_size | Min packet size |
| 10 | Acks | Acks flag |
| 11 | P1_size | Size of the first valid packet |
| 12 | P2_size | Size of the second valid packet |
| 13 | Type | Application type |
| No. | Feature | Type |
|---|---|---|
| 1 | duration | connection basic features |
| 2 | protocol_type | |
| 3 | service | |
| 4 | flag | |
| 5 | src_bytes | |
| 6 | dst_bytes | |
| 7 | logged_in | connection content features |
| 8 | count | time-based traffic |
| 9 | srv_count | features |
| 10 | dst_host_count | host-based traffic features |
| 11 | dst_host_srv_count | |
| 12 | dst_host_same_srv_rate | |
| 13 | dst_host_diff_srv_rate |
| Dataset | Transaction_number | Frequent | Closed | Maximal |
|---|---|---|---|---|
| BUCT | 0.5 million | 313 | 153 | 10 |
| 1 million | 315 | 156 | 9 | |
| 2 million | 303 | 151 | 10 | |
| KDD99 | 0.5 million | 8672 | 256 | 8 |
| 1 million | 9017 | 348 | 9 | |
| 2 million | 8782 | 353 | 5 |
| BUCT Feature No. | 1 | 2 | 3 | 4 | 5 | 6 | 7 | 8 | 9 | 10 | 11 | 12 | 13 | Support |
|---|---|---|---|---|---|---|---|---|---|---|---|---|---|---|
| User1 | - | TCP | 80 | - | - | - | 1400∼1500 | 0∼100 | 1 | 1400∼1500 | - | Web | 0.217 | |
| - | TCP | 80 | - | - | 1400∼1500 | 0∼100 | 1 | 1400∼1500 | - | Web | 0.126 | |||
| - | TCP | 80 | - | - | 1400∼1500 | 0∼100 | 1 | 1400∼1500 | - | Web | 0.102 | |||
| User2 | - | TCP | 80 | - | - | - | 1400∼1500 | 0∼100 | 1 | 1400∼1500 | - | Web | 0.172 | |
| - | TCP | 80 | - | - | 1400∼1500 | 0∼100 | 1 | 1400∼1500 | - | Web | 0.124 | |||
| - | UDP | - | - | - | - | 500∼600 | 0 | 500∼600 | 500∼600 | Stream | 0.115 |
| BUCT Feature No. | 1 | 2 | 3 | 4 | 5 | 6 | 7 | 8 | 9 | 10 | 11 | 12 | 13 | Support |
|---|---|---|---|---|---|---|---|---|---|---|---|---|---|---|
| Normal | - | TCP | 80 | - | - | 1400∼1500 | 0∼100 | 1 | 1400∼1500 | - | Web | 0.161 | ||
| Pattern | - | TCP | 80 | - | - | 1400∼1500 | 0∼100 | 1 | 1400∼1500 | 1400∼1500 | Web | 0.128 | ||
| Anomaly Pattern | - | TCP | 80 | - | - | 0∼10 | 0∼100 | 0∼100 | - | 0 | 0 | Web | 0.314 |
| KDD99 Feature No. | 1 | 2 | 3 | 4 | 5 | 6 | 7 | 8 | 9 | 10 | 11 | 12 | 13 | Support |
|---|---|---|---|---|---|---|---|---|---|---|---|---|---|---|
| 0 | tcp | http | SF | 100∼200 | - | 1 | 0∼10 | - | - | - | 0.95∼1 | 0∼0.05 | 0.274 | |
| Normal | 0 | TCP | http | SF | - | - | 1 | - | - | 250∼260 | 250∼260 | - | 0∼0.05 | 0.149 |
| Pattern | 0 | TCP | http | SF | - | - | 1 | 0∼10 | 0∼10 | - | - | 0.95∼1 | 0∼0.05 | 0.132 |
| 0 | TCP | http | SF | - | 1000∼1100 | 1 | 0∼10 | 0∼10 | - | - | 0.95∼1 | 0∼0.05 | 0.111 | |
| - | ICMP | ecr_i | SF | 1000∼1100 | 0∼100 | - | 510∼520 | 510∼520 | - | - | - | - | 0.289 | |
| Anomaly Pattern | - | TCP | - | S0 | 0∼100 | 0∼100 | 0 | - | - | 250∼260 | 0∼10 | 0∼0.05 | 0.05∼0.1 | 0.282 |
| 0 | TCP | private | S0 | 0∼100 | 0∼100 | 0 | - | 10∼20 | - | - | - | - | 0.184 |
© 2019 by the authors. Licensee MDPI, Basel, Switzerland. This article is an open access article distributed under the terms and conditions of the Creative Commons Attribution (CC BY) license (http://creativecommons.org/licenses/by/4.0/).
Share and Cite
Zhao, Y.; Chen, J.; Wu, D.; Teng, J.; Sharma, N.; Sajjanhar, A.; Blumenstein, M. Network Anomaly Detection by Using a Time-Decay Closed Frequent Pattern. Information 2019, 10, 262. https://doi.org/10.3390/info10080262
Zhao Y, Chen J, Wu D, Teng J, Sharma N, Sajjanhar A, Blumenstein M. Network Anomaly Detection by Using a Time-Decay Closed Frequent Pattern. Information. 2019; 10(8):262. https://doi.org/10.3390/info10080262
Chicago/Turabian StyleZhao, Ying, Junjun Chen, Di Wu, Jian Teng, Nabin Sharma, Atul Sajjanhar, and Michael Blumenstein. 2019. "Network Anomaly Detection by Using a Time-Decay Closed Frequent Pattern" Information 10, no. 8: 262. https://doi.org/10.3390/info10080262
APA StyleZhao, Y., Chen, J., Wu, D., Teng, J., Sharma, N., Sajjanhar, A., & Blumenstein, M. (2019). Network Anomaly Detection by Using a Time-Decay Closed Frequent Pattern. Information, 10(8), 262. https://doi.org/10.3390/info10080262