Quantitative Model of Attacks on Distribution Automation Systems Based on CVSS and Attack Trees


Abstract
:1. Introduction
1.1. Motivations
1.2. Main Contributions
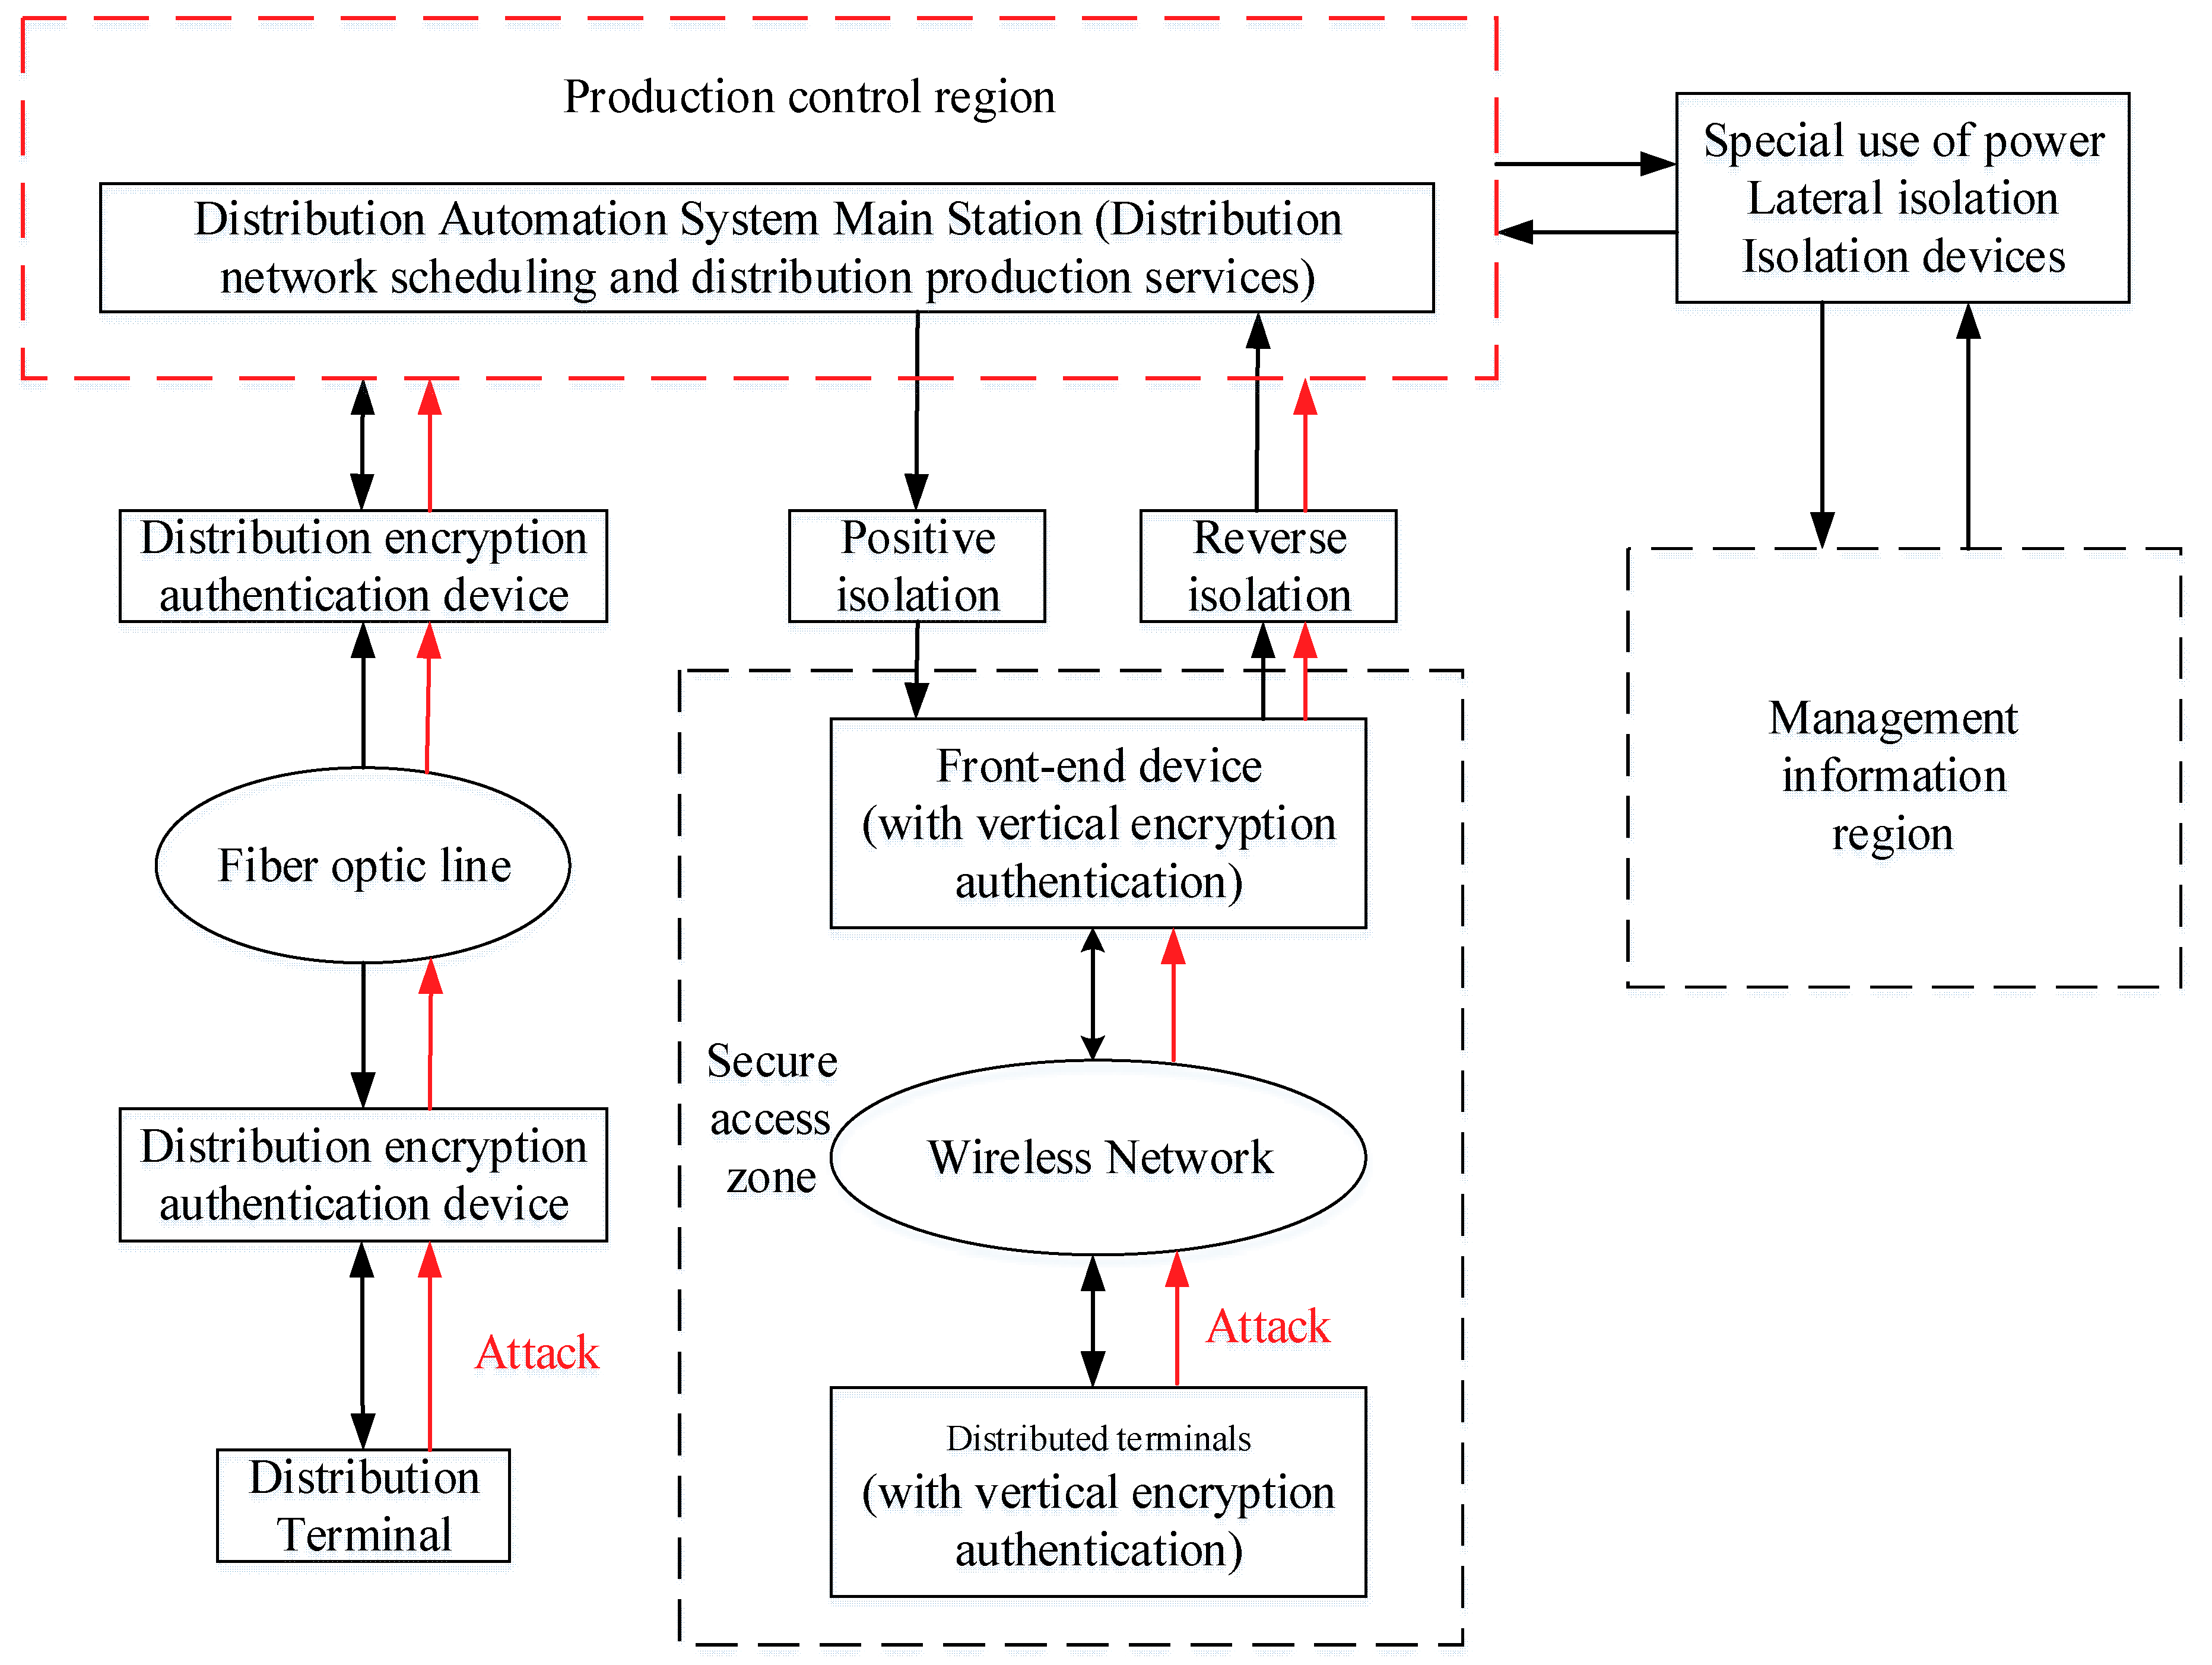
- First, a DAS security architecture is developed on the basis of the functional characteristics and security protection requirements of DASs. This architecture provides an intuitive view of the security components of a DAS, which can help system designers have a clear understanding of the path to possible cyber-attacks and physical-attacks.
- Second, a DAS attack quantification model was established by forming a set of complete attack processes and paths based on attacker behavior, which can help DAS security practitioners to find the system components that should be defended, helping penetration testers to deploy targeted and focused attacks.
- Third, a quantification algorithm for attack probability based on an AT and the CVSS was proposed. This algorithm reduces the influence of the subjective factors in the process for quantifying attacks in traditional approaches and improves the accuracy of attack prediction. The efficacy of the model was evaluated by introducing the environmental characteristics of the DAS.
2. Design of the DAS Security Architecture
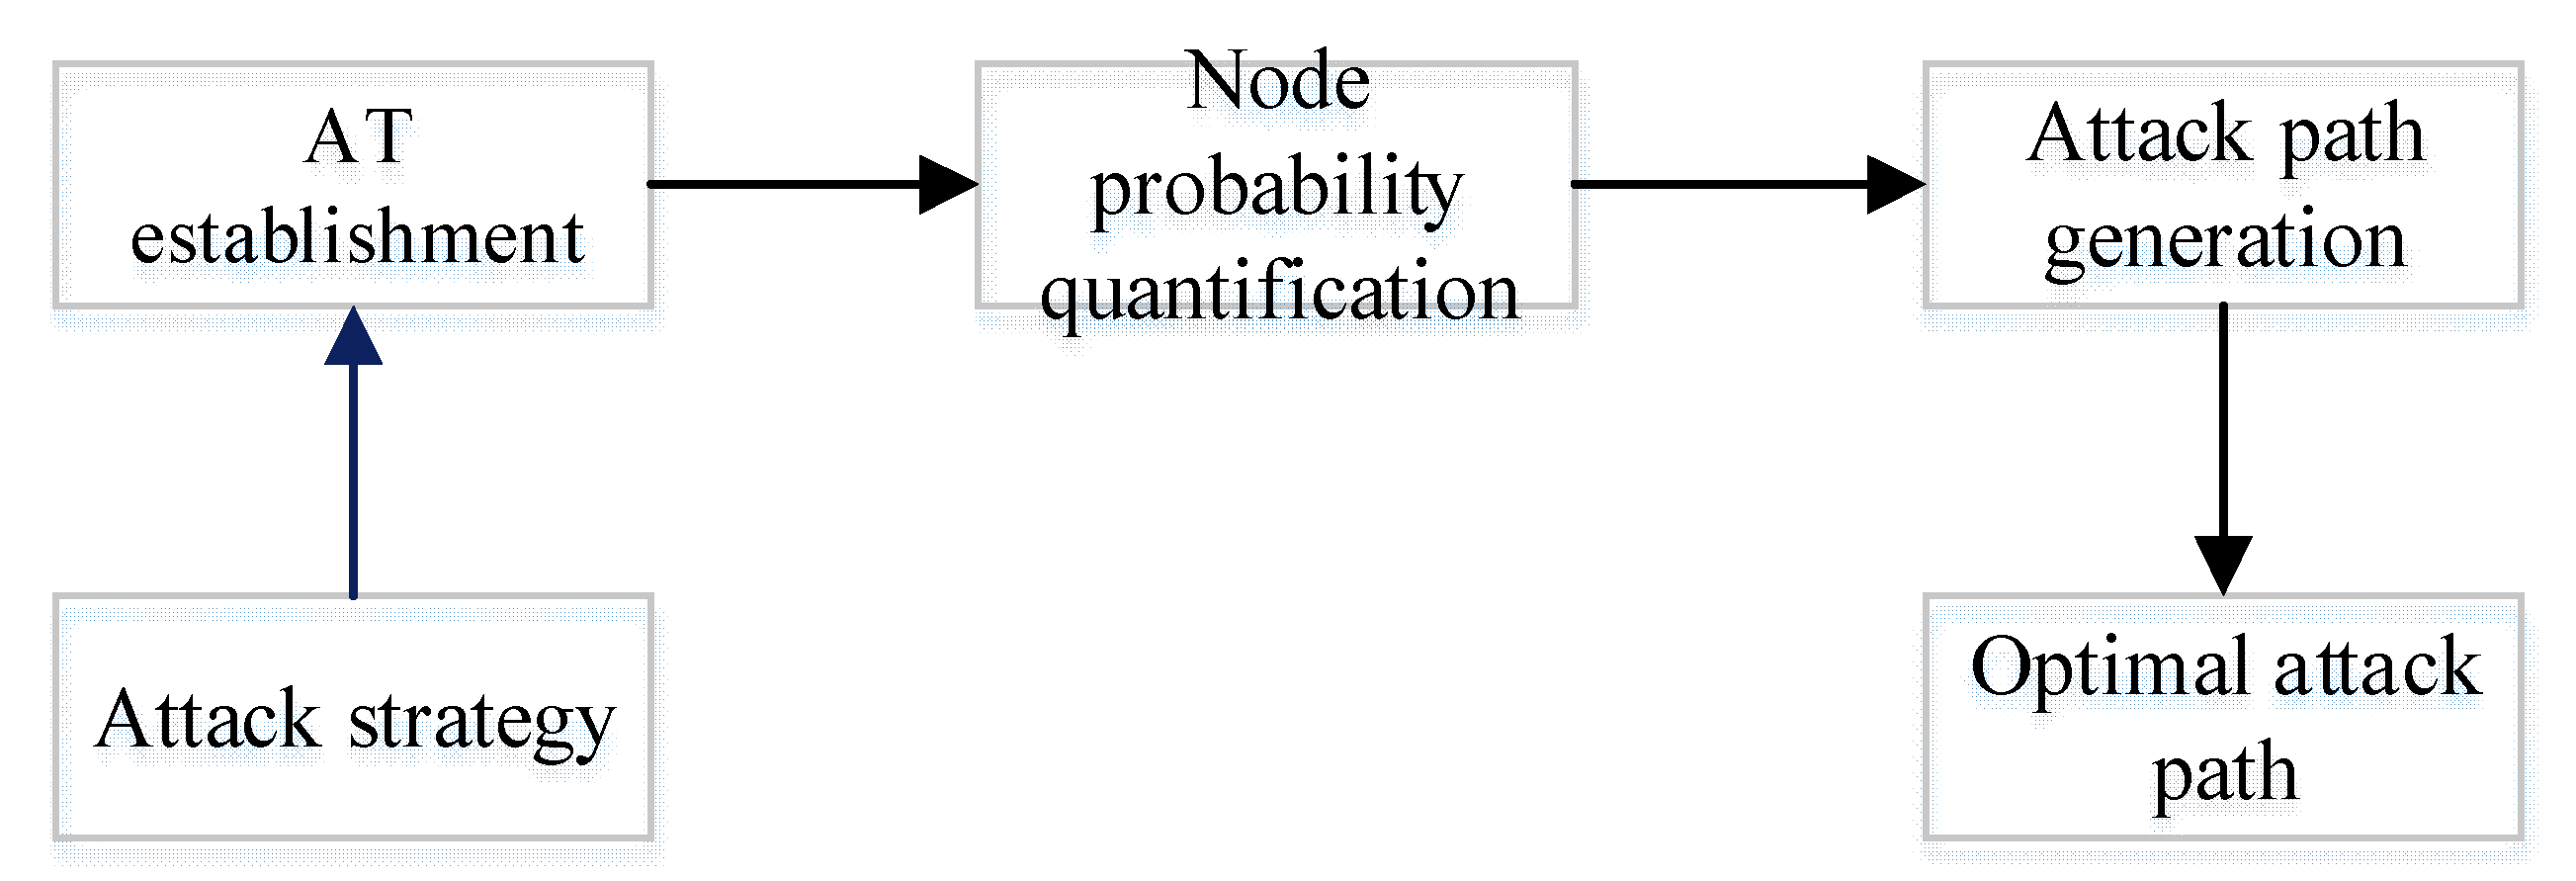
3. DAS Attack Quantification Algorithm
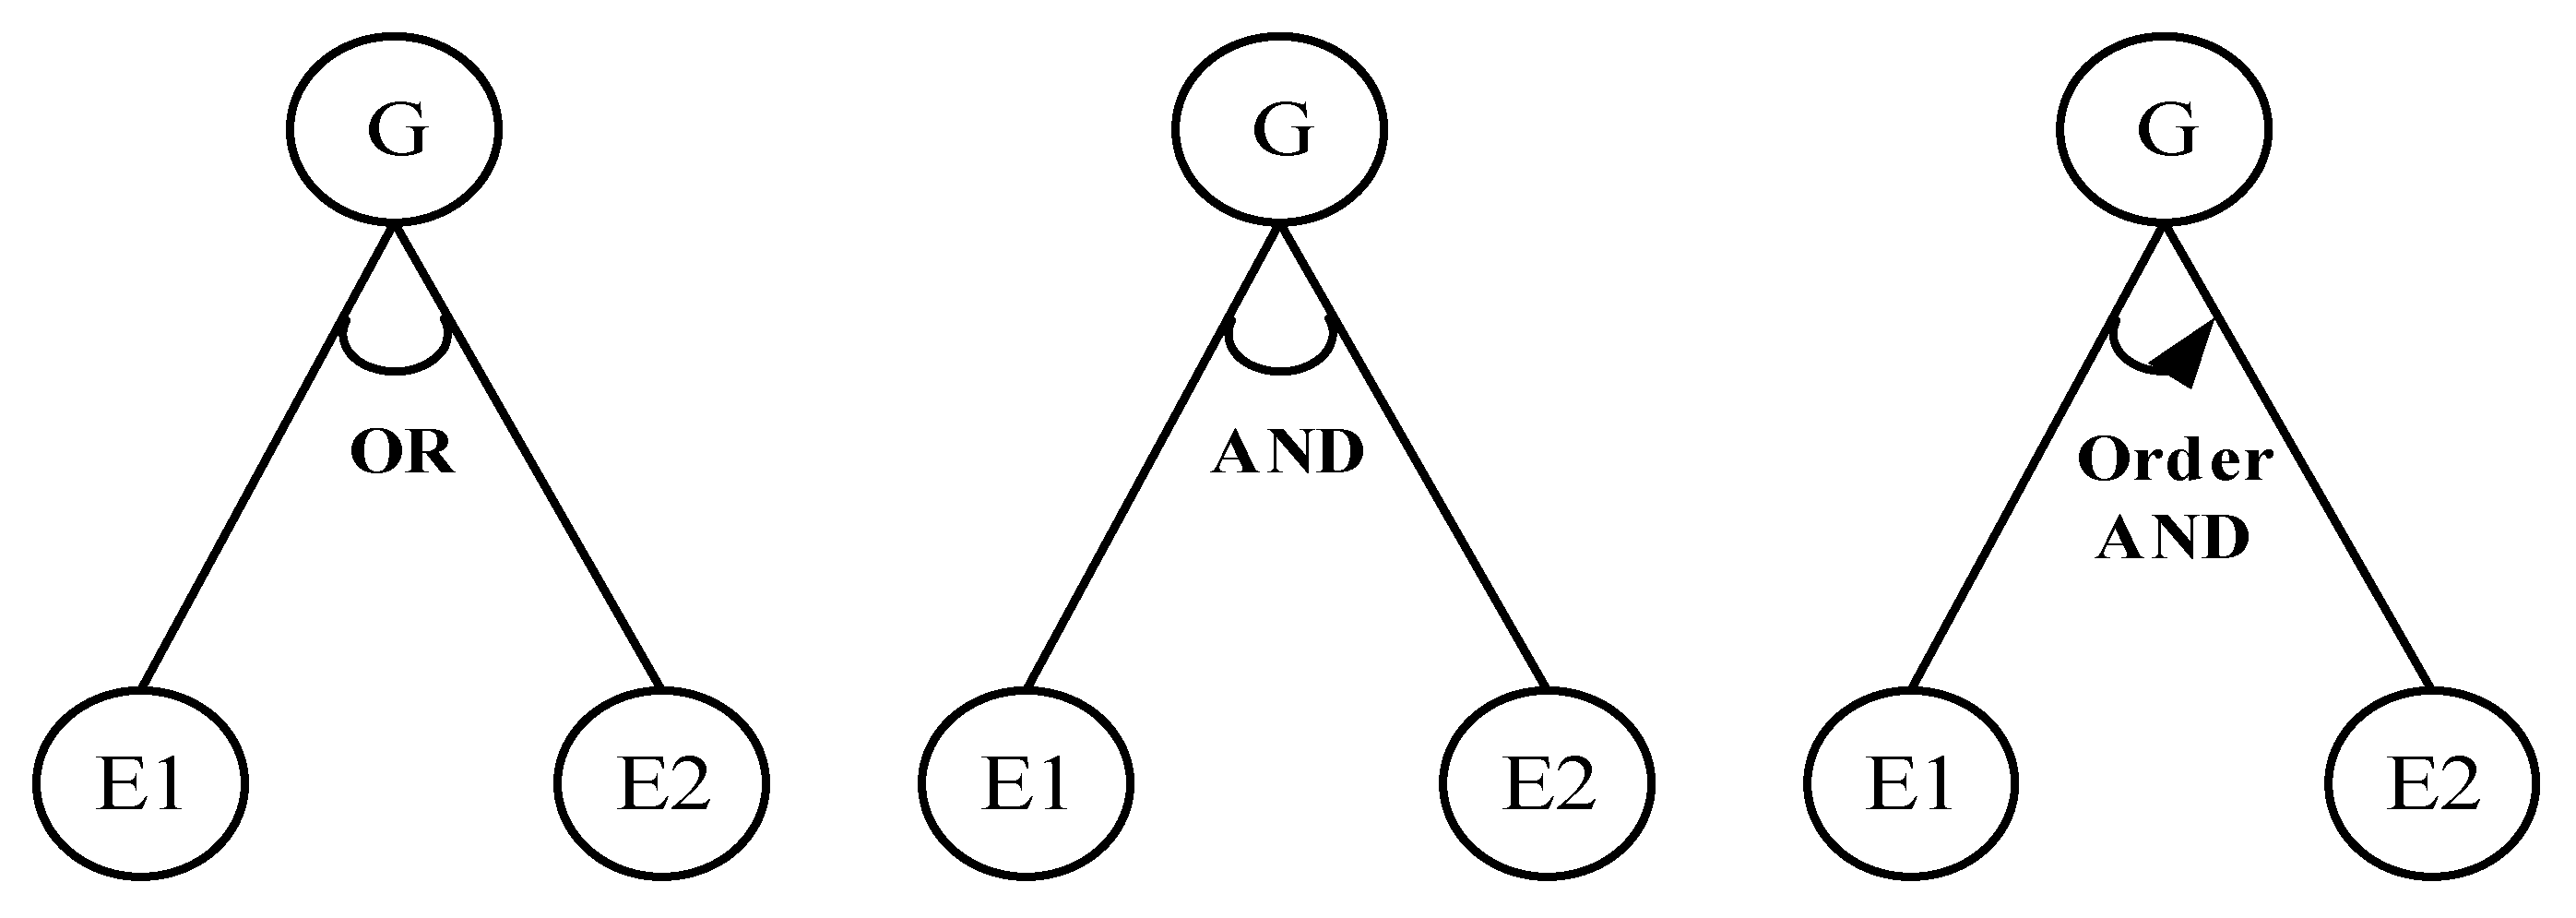
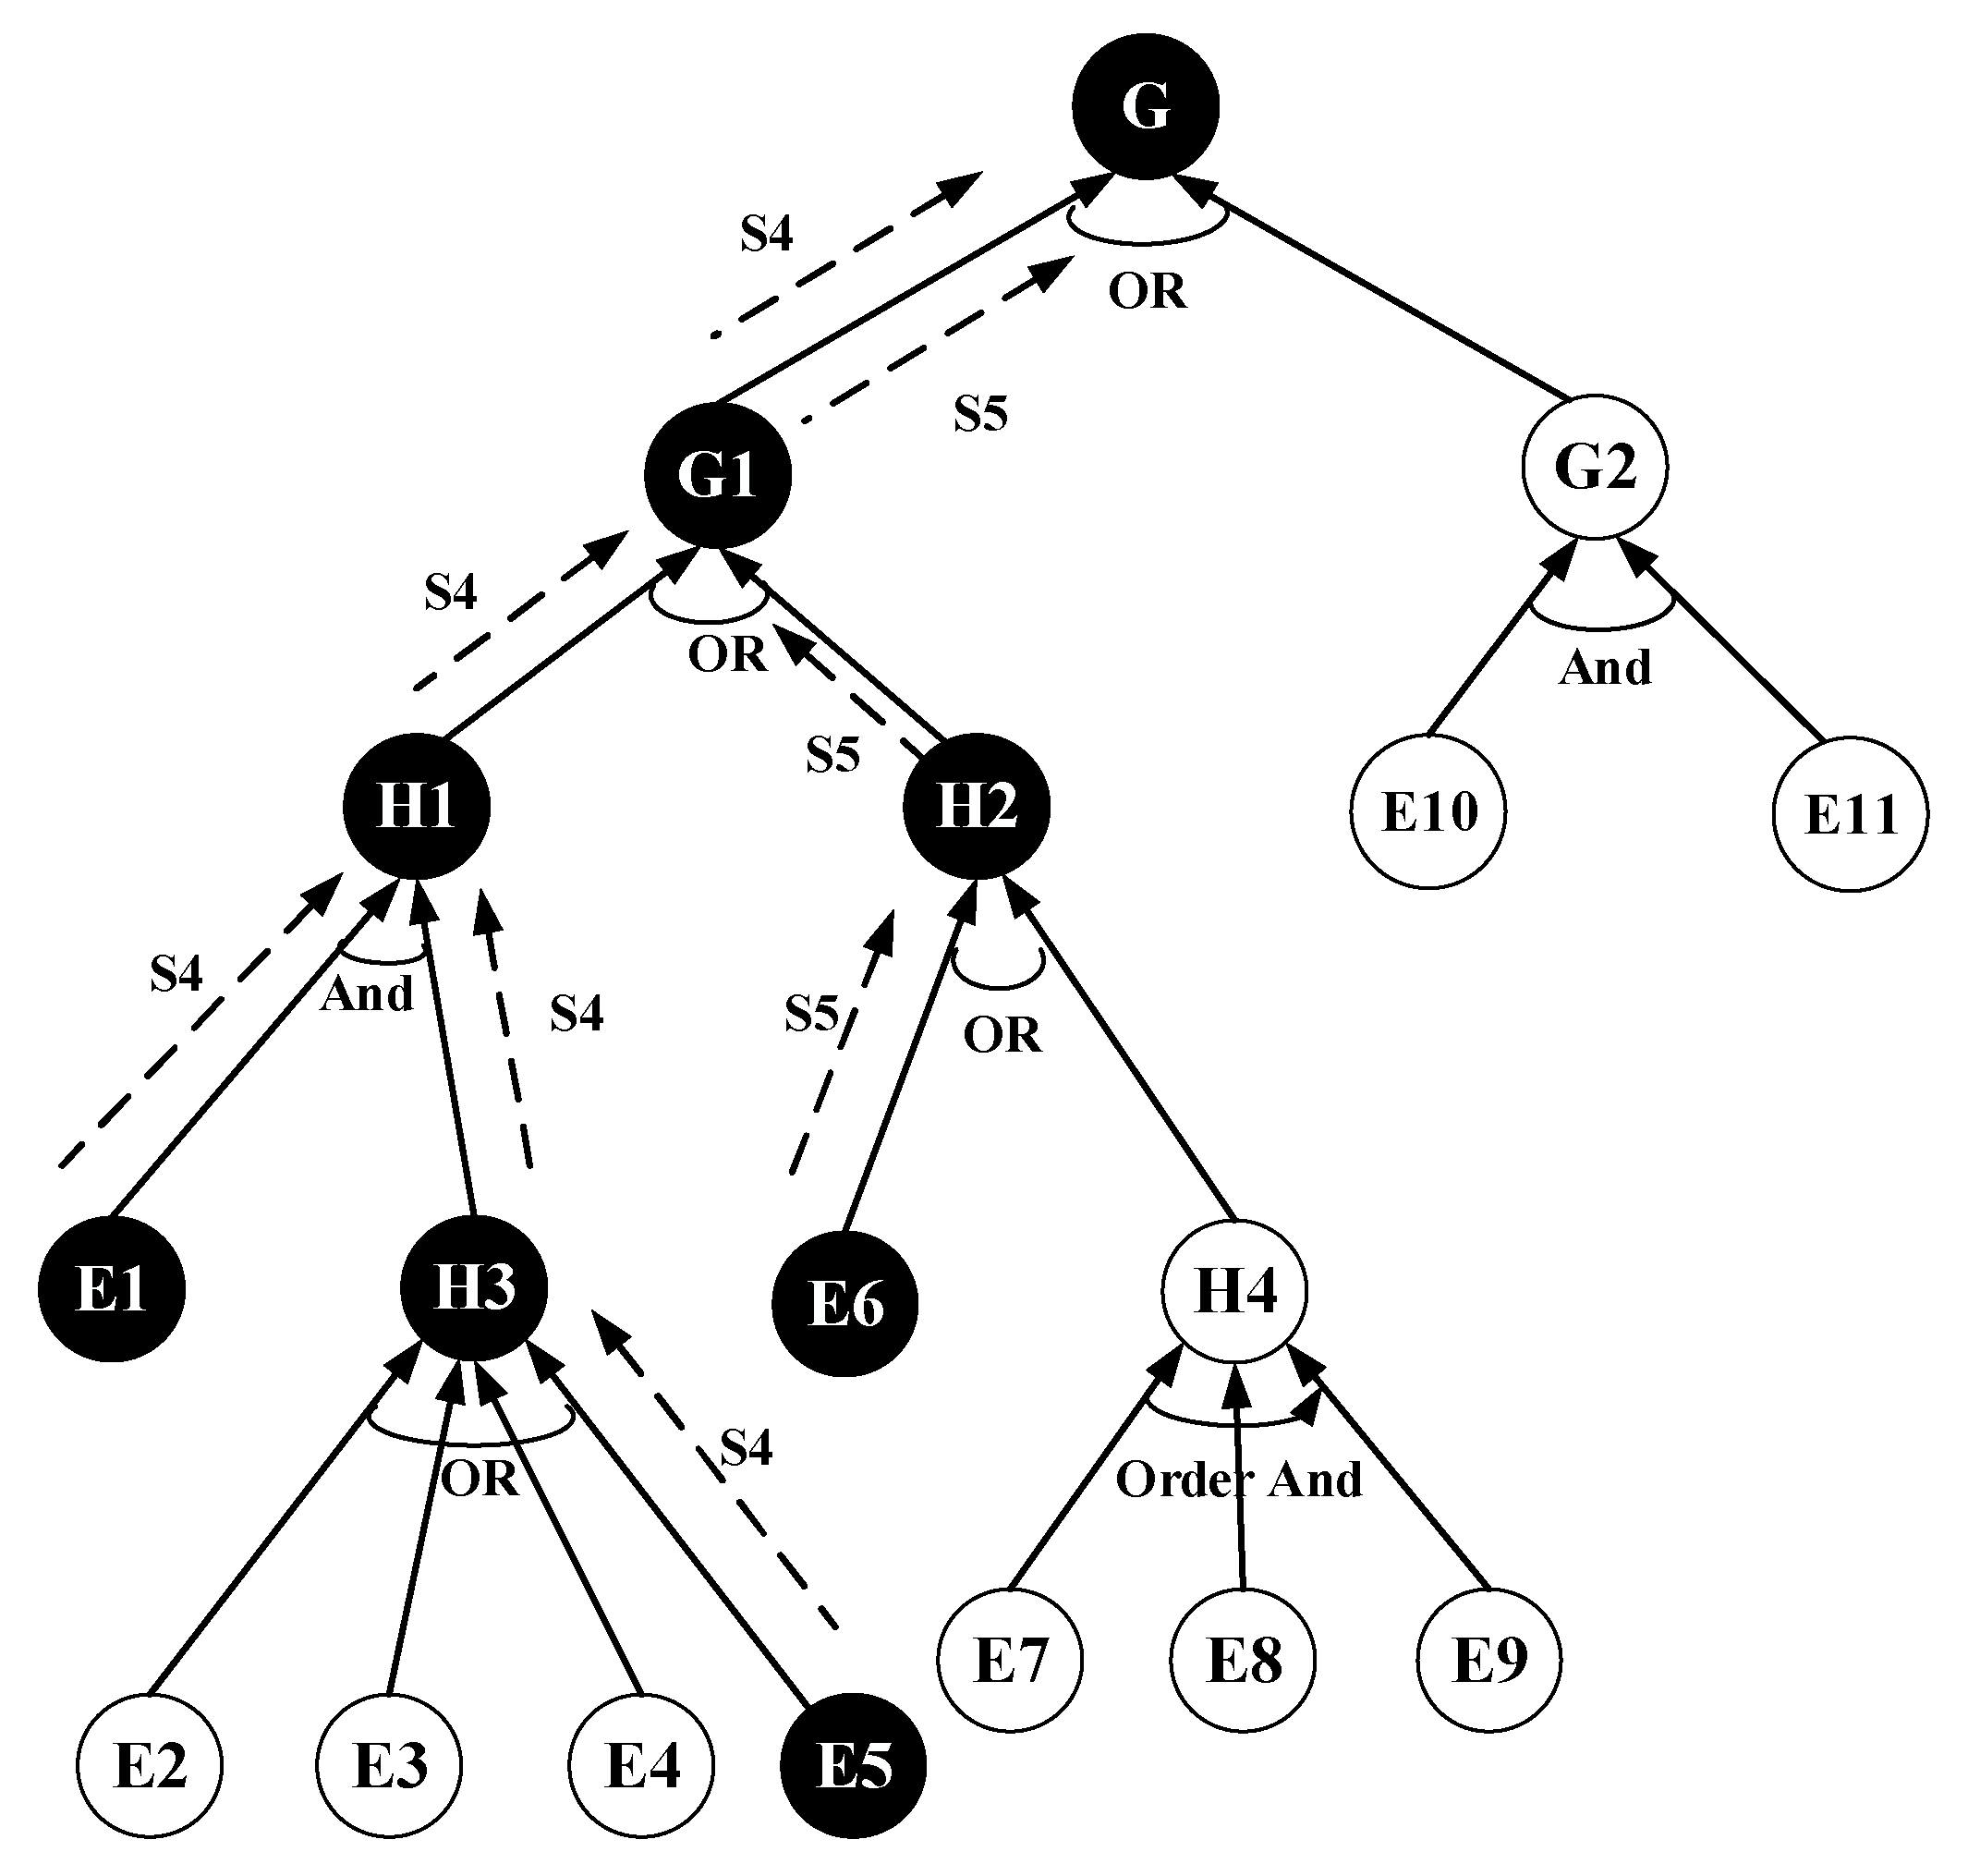
3.1. DAS AT Model
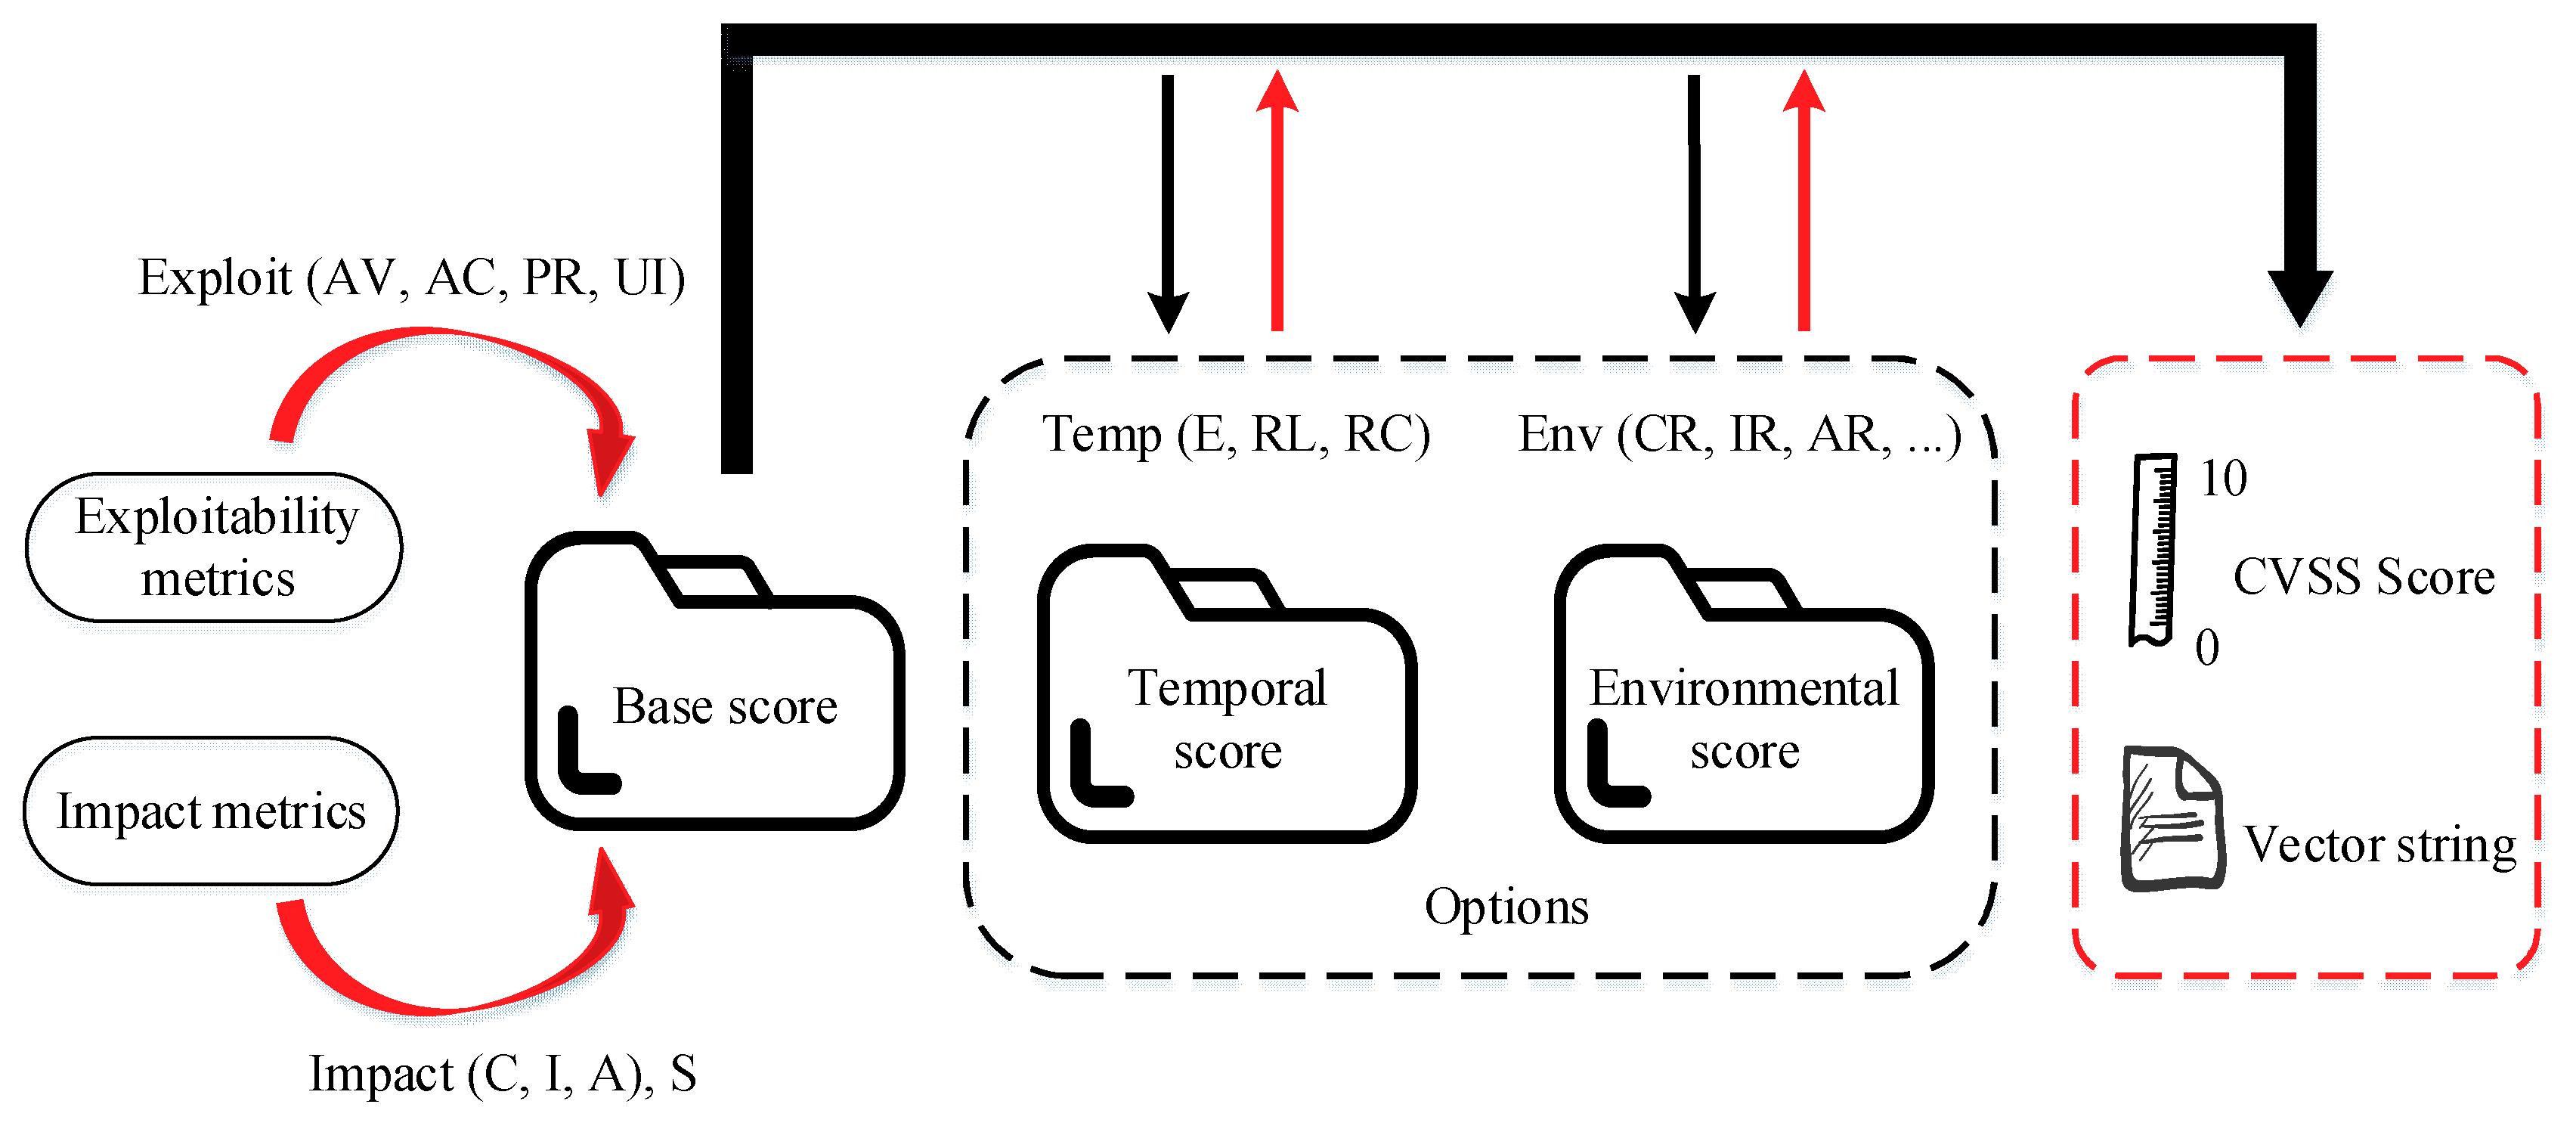
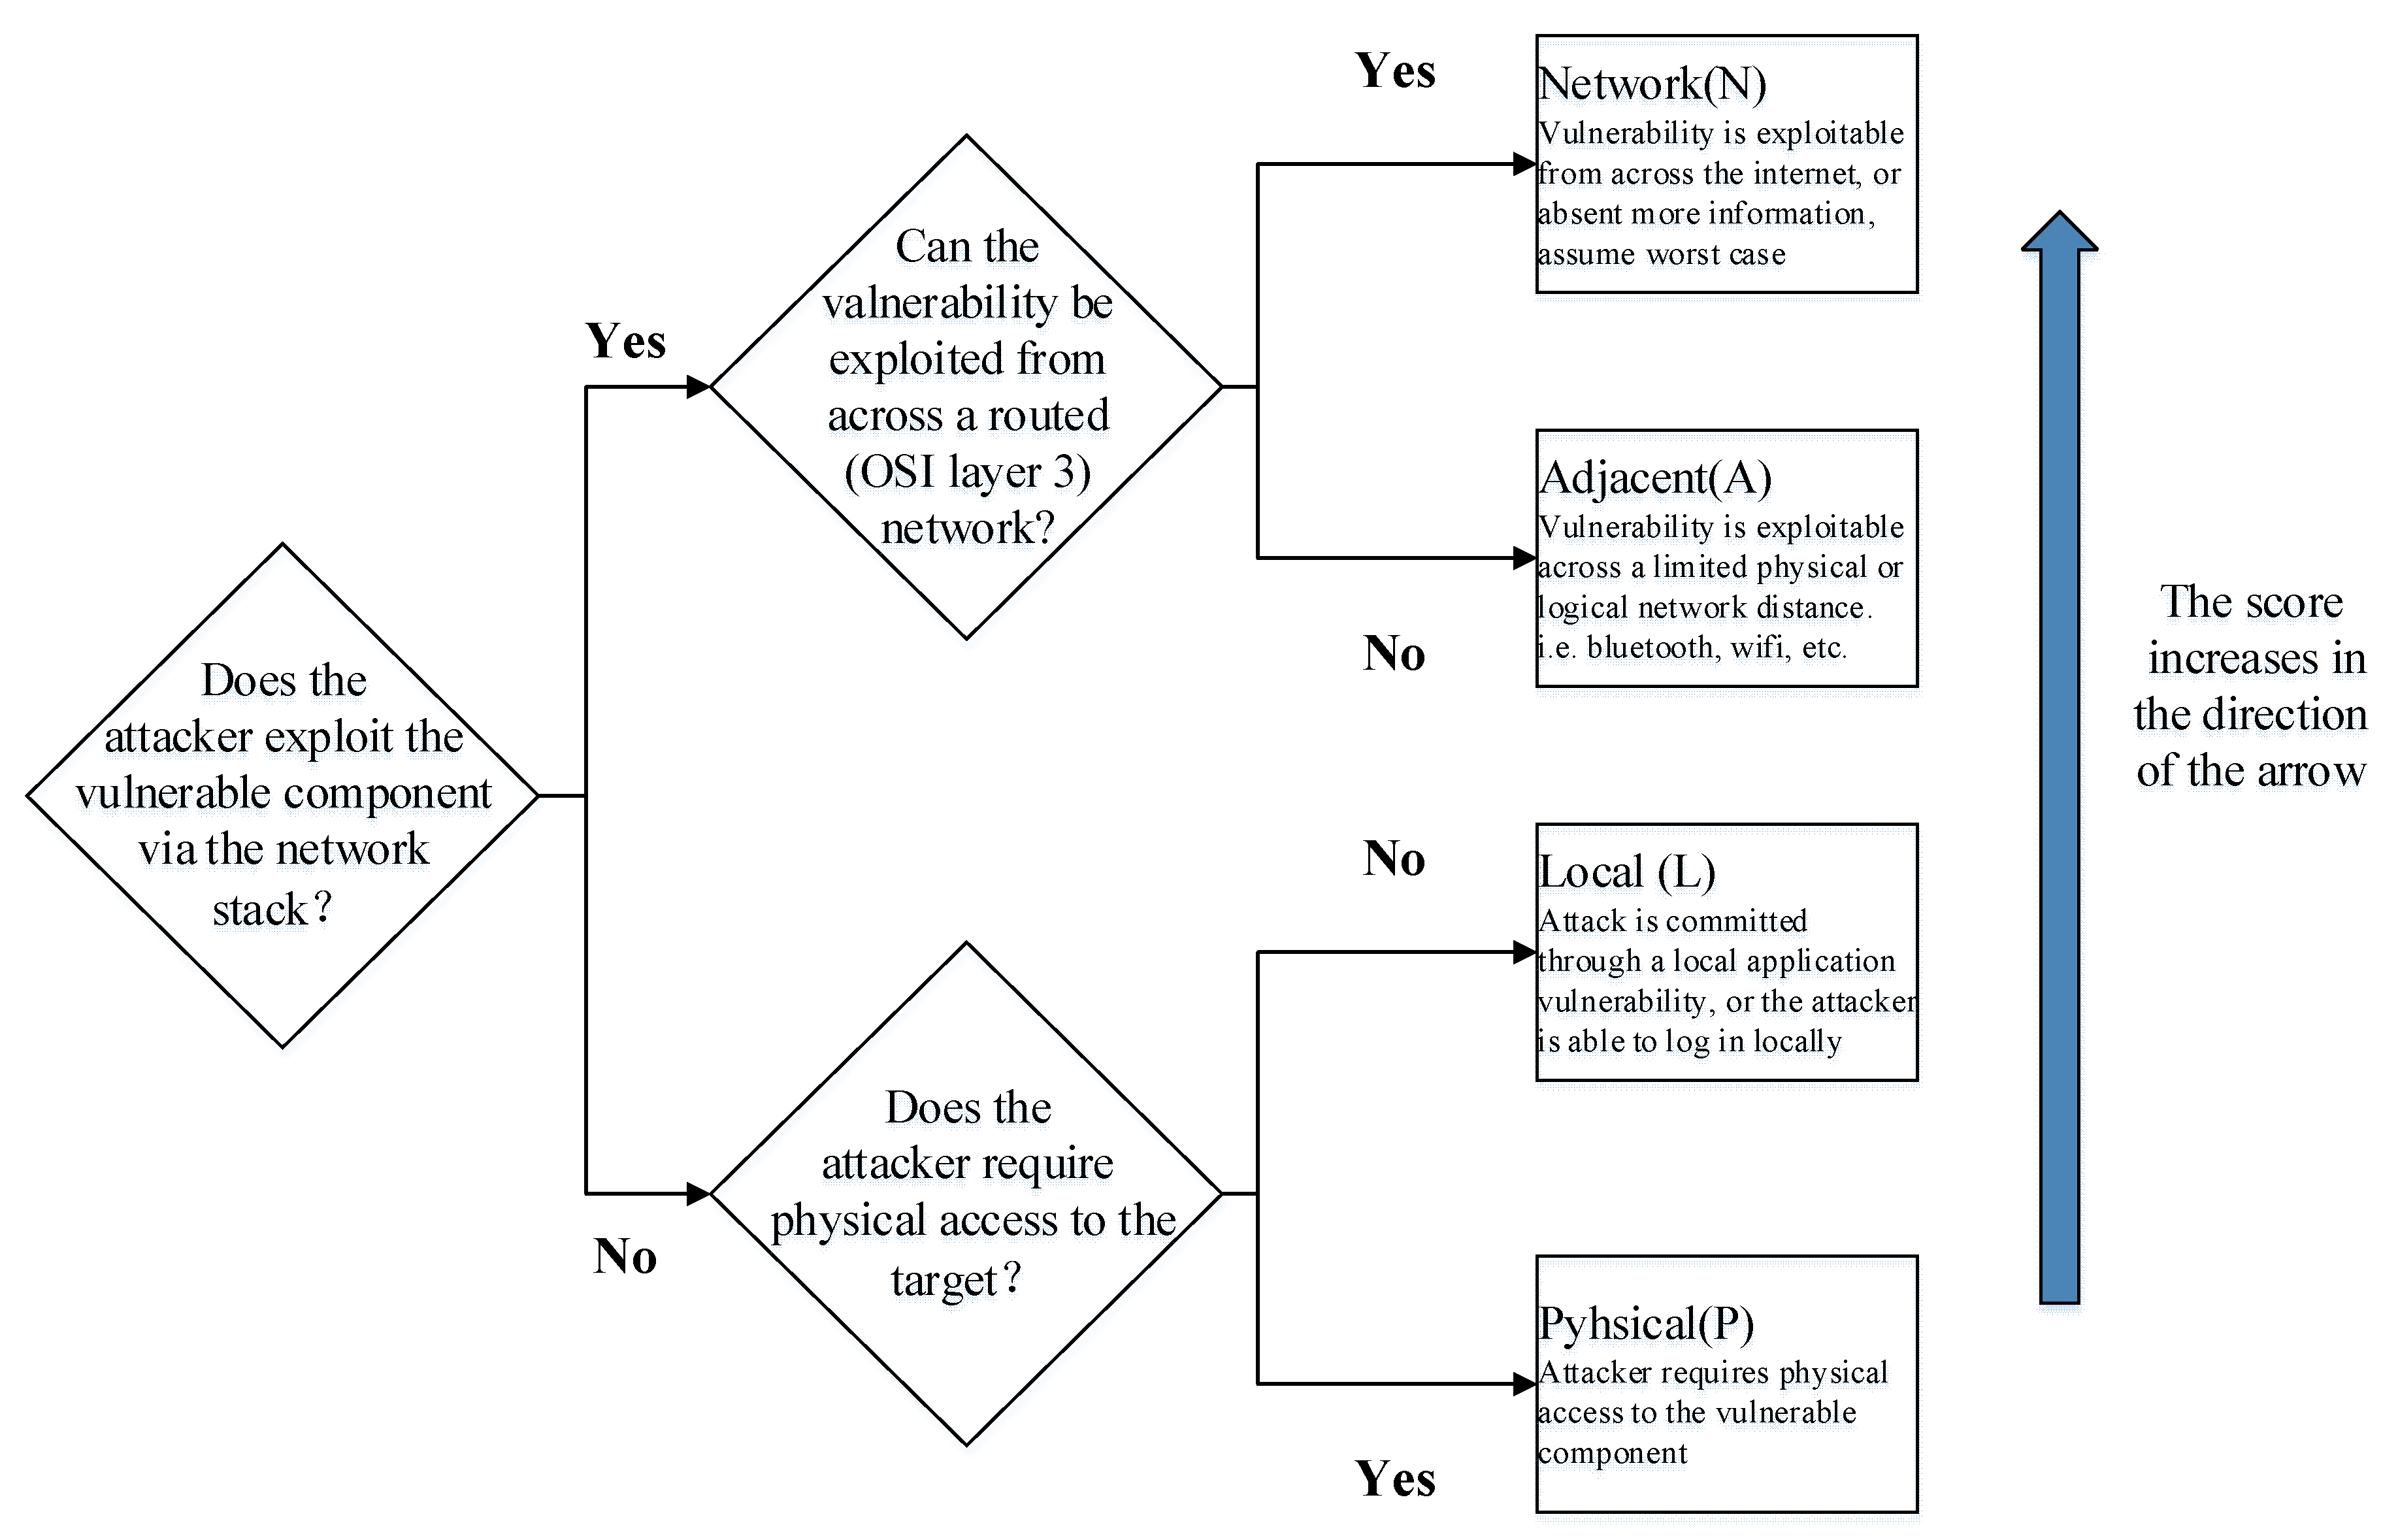
3.2. CVSS
3.3. Attack Probability Quantification Algorithm Based on the AT
| Algorithm 1. Calculate the value of the Base Score. |
| Input: ESS (Exploitability Sub Score); ISC (Impact Sub Score) Output: Base Score (1) procedure: Base Score, Roundup() (2) If ISC <= 0 then (3) Base Score = 0 (4) else if ScopeUnchanged then (5) Base Score = Roundup (Minimum [(ESS + ISC), 10]) (6) else (7) Base Score = Roundup (Minimum [1.08 × (ESS + ISC), 10]) (8) end if (9) end procedure |
| Algorithm 2. Calculate the value of impact sub score (ISC). |
| Input:ImpactConf; ImpactInteg; ImpactAvail Output: ISC (1) procedure: ISC (2) ISCtmp = 1 − [(1 − ImpactConf) × (1 − ImpactInteg) × (1 − ImpactAvail)] (3) if ScopeUnchanged then (4) ISC = 6.42 × ISCtmp (5) else if Scopechanged then (6) ISC = 7.52 × [ISCtmp − 0.029] − 3.25 × [ISCtmp − 0.02]15 (7) end if (8) end procedure |
- (1)
- For the AND or Order AND node, the attack probability of the current parent node G is the product of the attack probability at the child nodes.
- (2)
- For the OR node, the attack probability of the parent node G is the maximum attack probability of the child nodes.
4. Experimental Evaluation
4.1. Construction of the Experimental Environment
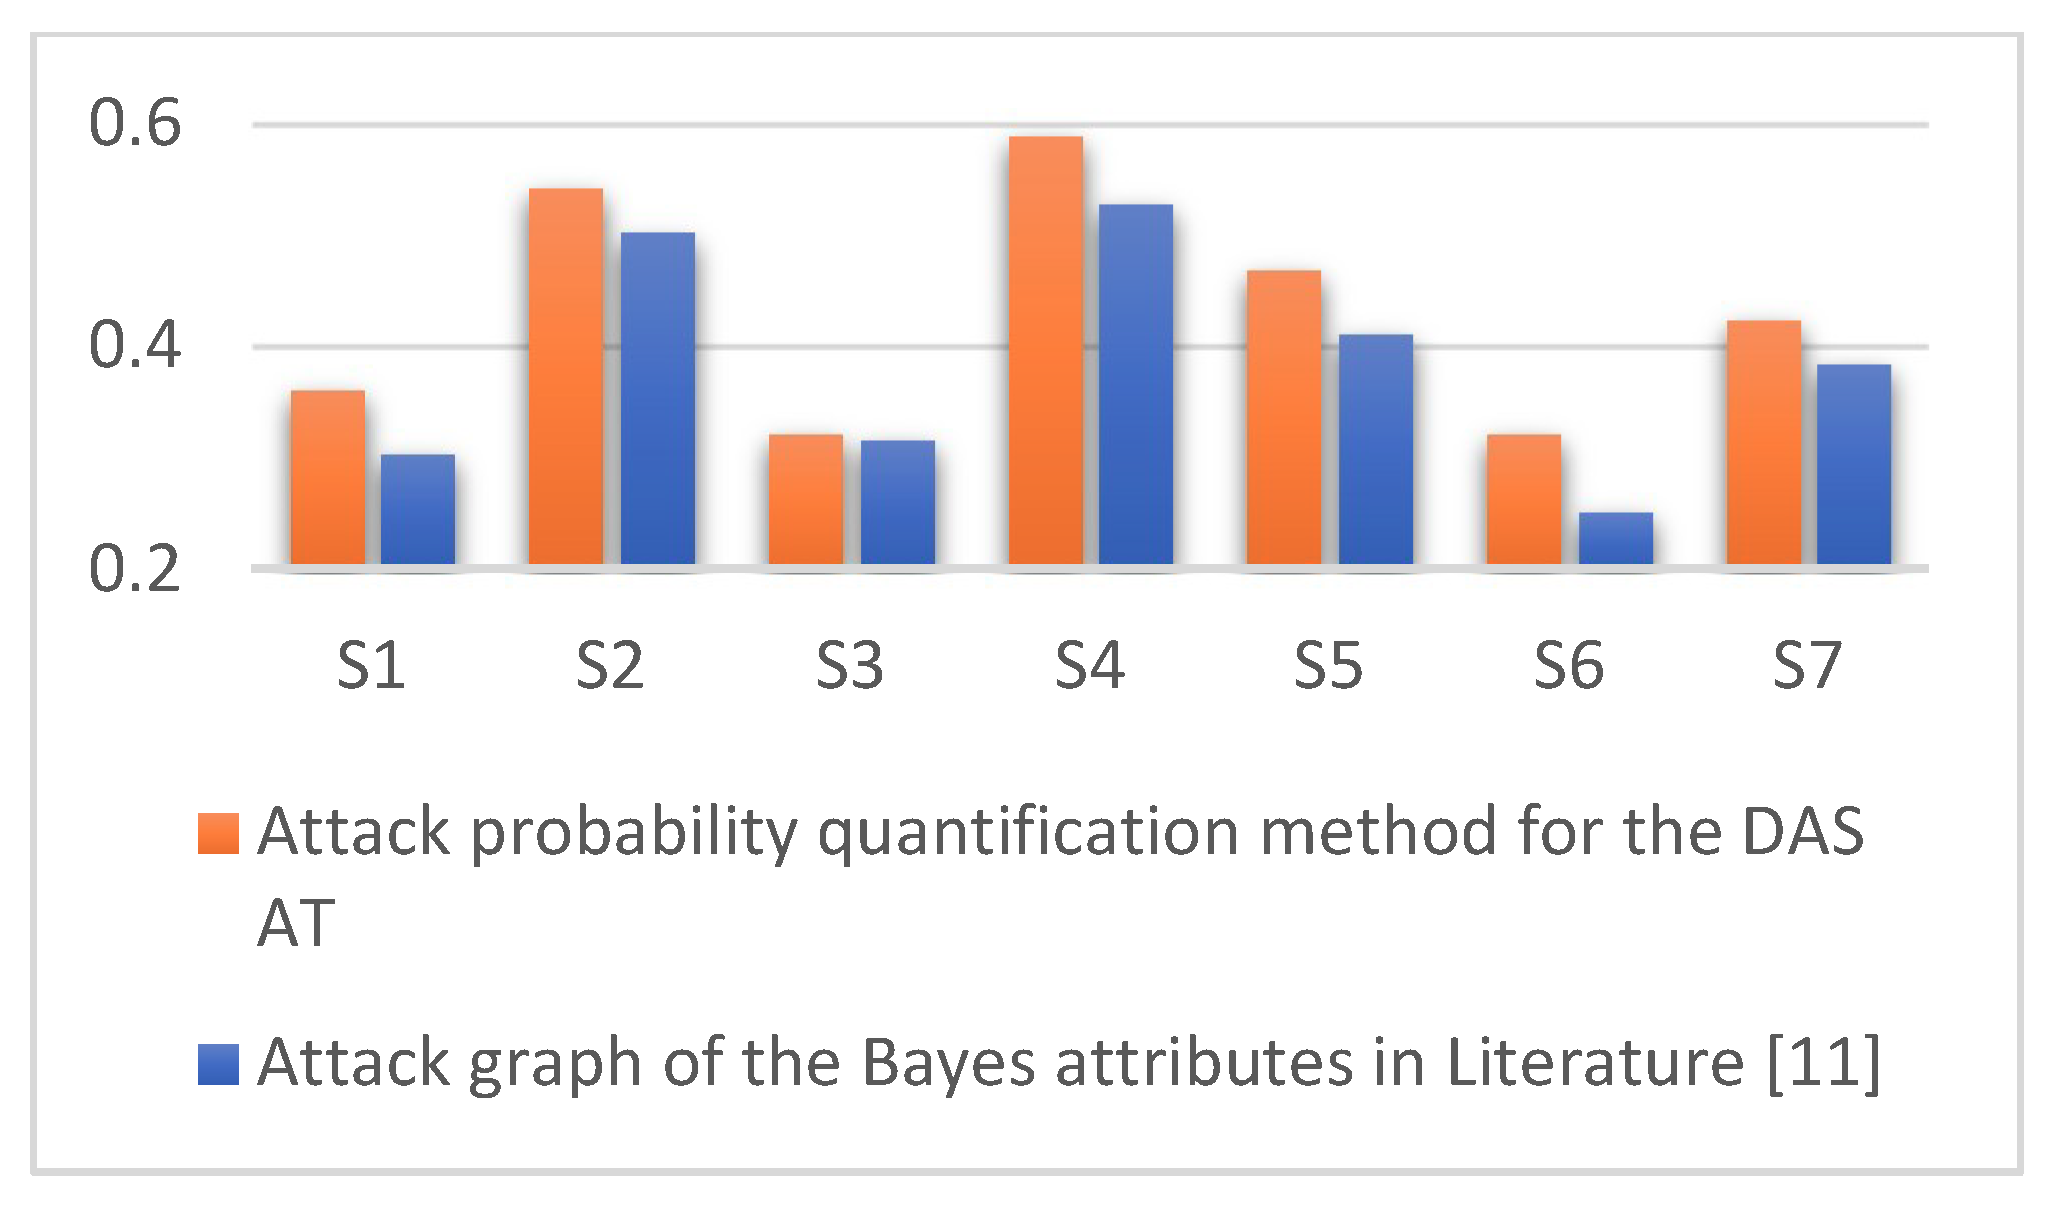
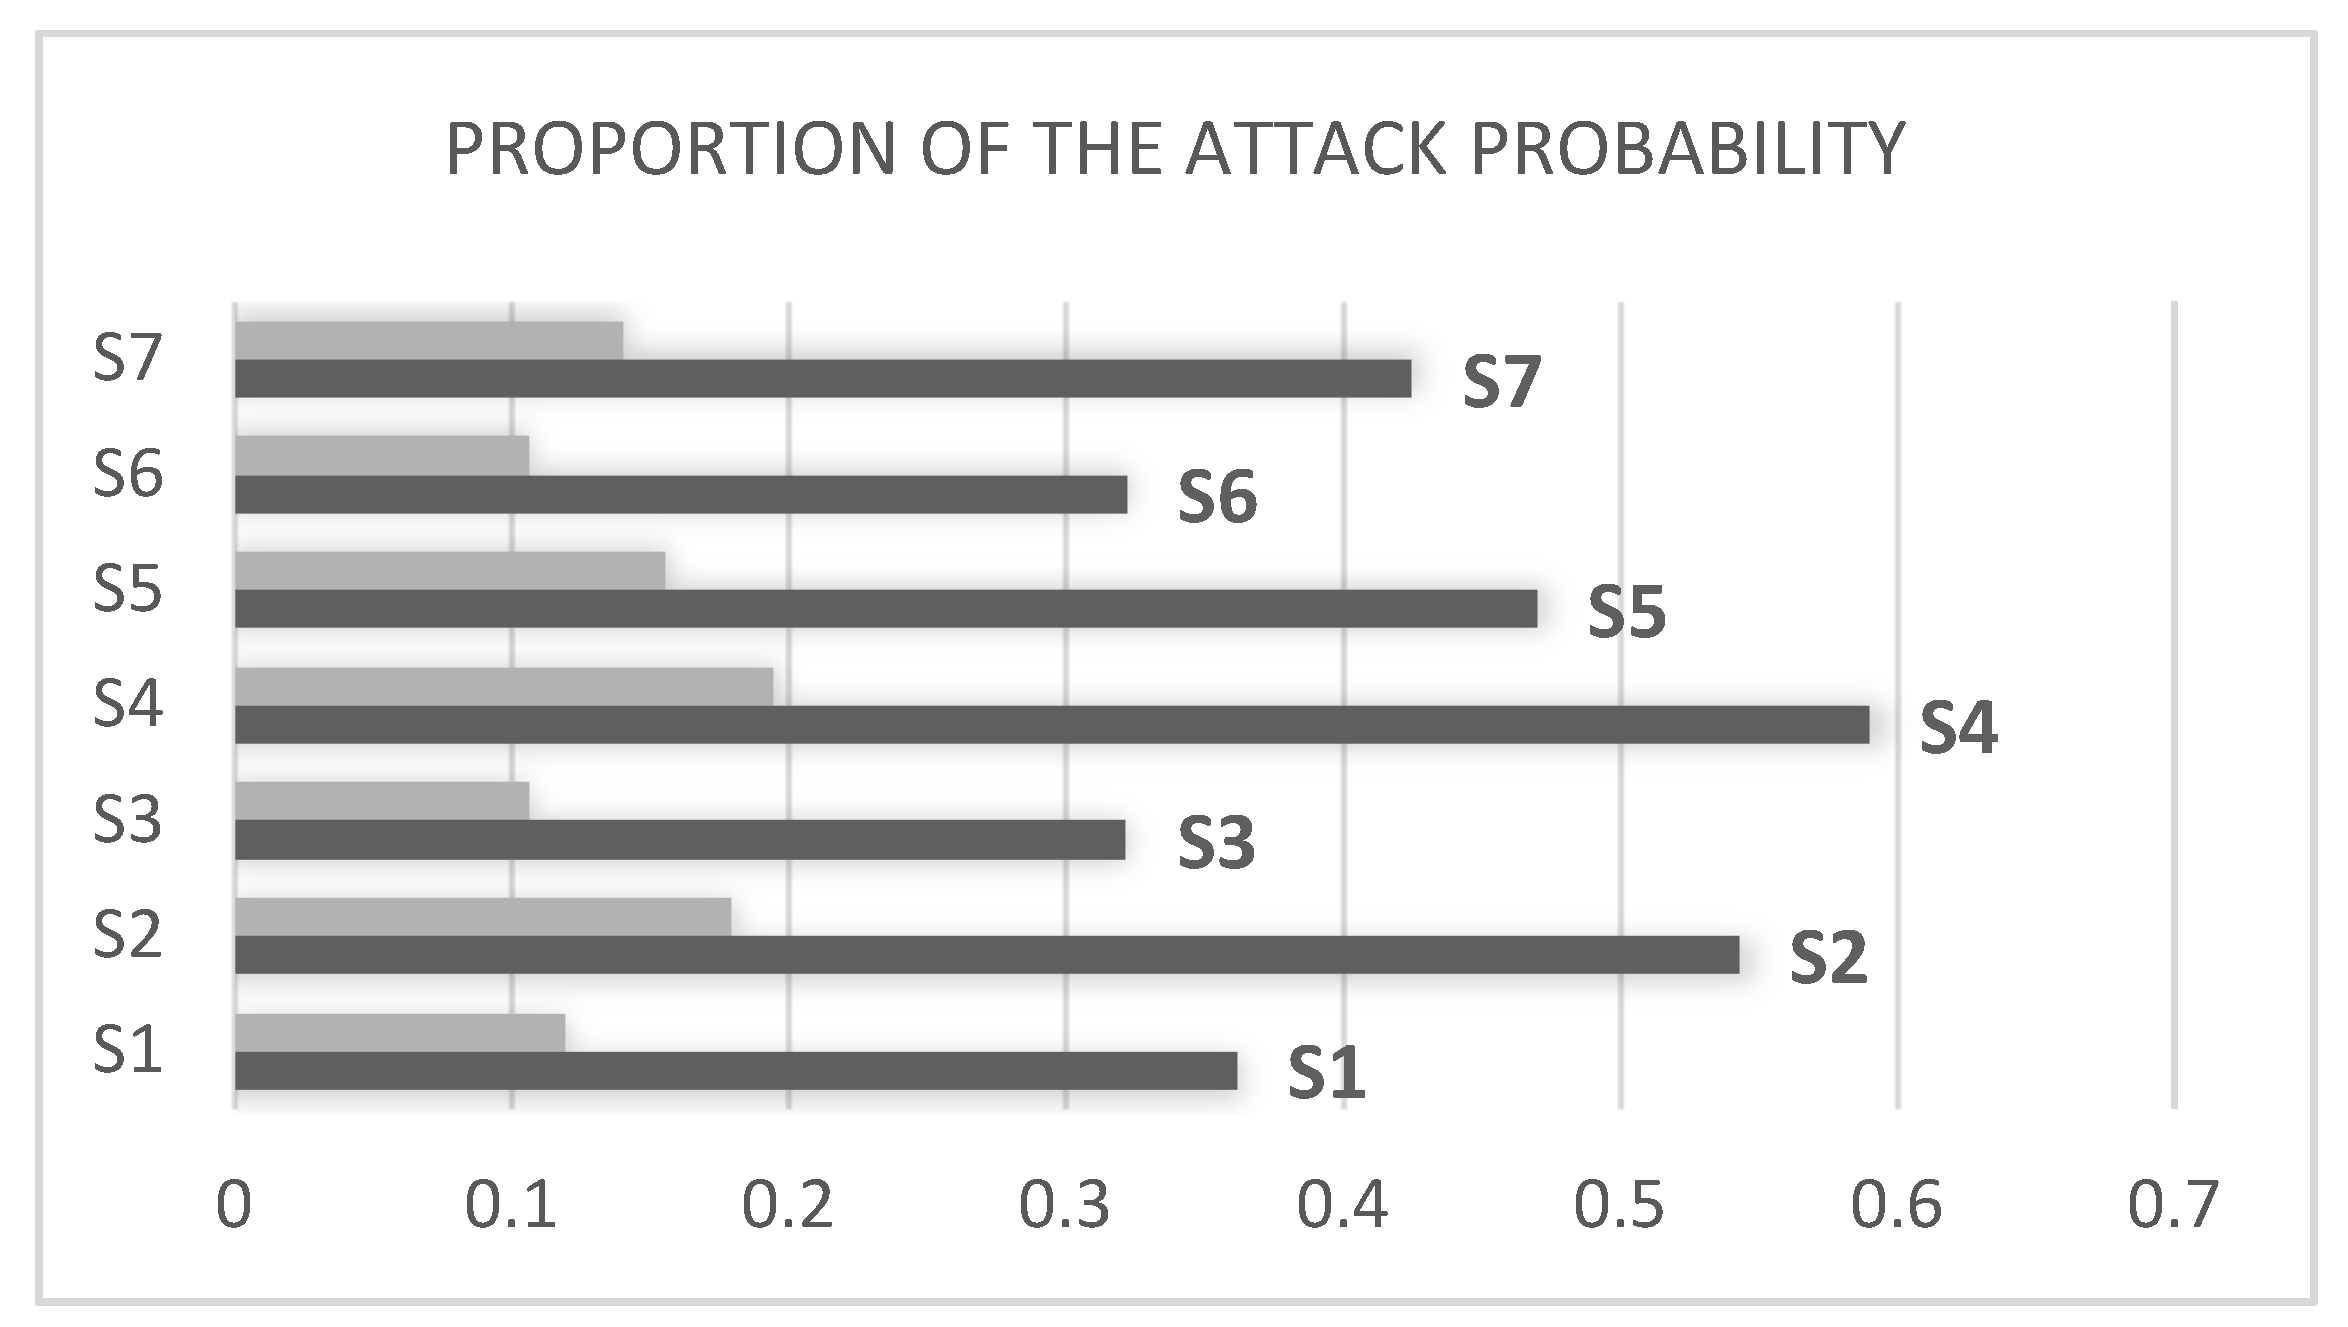
4.2. Analysis of the Experimental Results
5. Conclusions
Author Contributions
Funding
Acknowledgments
Conflicts of Interest
References
- Dobson, P.; Koerner, L.; Vaz, R. Venezuela: Guaido stripped of immunity, protests erupt over blackouts. Green Left Weekly 2019, 1216, 13. [Google Scholar]
- Zhou, L.; Ouyang, X.; Ying, H.; Han, L.; Cheng, Y.; Zhang, T. Cyber-Attack Classification in Smart Grid via Deep Neural Network. In Proceedings of the 2nd International Conference on Computer Science and Application Engineering, Hohhot, China, 22–24 October 2018. [Google Scholar]
- Sun, C.C.; Hahn, A.; Liu, C.C. Cyber security of a power grid: State-of-the-art. Int. J. Electr. Power Energy Syst. 2018, 99, 45–56. [Google Scholar] [CrossRef]
- Zhao, Y.; Bai, M.; Liang, Y.; Ma, J.; Deng, P. Fault Modeling and Simulation Based on Cyber Physical System in Complex Distribution Network. In Proceedings of the 2018 China International Conference on Electricity Distribution (CICED), Tianjin, China, 17–19 September 2018; pp. 1566–1571. [Google Scholar]
- Ciapessoni, E.; Cirio, D.; Massucco, S.; Morini, A.; Pitto, A.; Silvestro, F. Risk-based dynamic security assessment for power system operation and operational planning. Energies 2017, 10, 475. [Google Scholar] [CrossRef]
- Huang, K.; Zhou, C.; Qin, Y.; Tu, W. A Game-Theoretic Approach to Cross-Layer Security Decision-Making in Industrial Cyber-Physical Systems. IEEE Trans. Ind. Electron. 2019. [Google Scholar] [CrossRef]
- Huang, W.; Liu, Q.; Yang, S.; Xiong, W.; Liu, Z. Security situation awareness based on power-supply ability model of active distribution system. Electr. Power Autom. Equip. 2017, 37, 74–80. [Google Scholar]
- Hahn, A.; Ashok, A.; Sridhar, S.; Govindarasu, M. Cyber-physical security testbeds: Architecture, application, and evaluation for smart grid. IEEE Trans. Smart Grid 2013, 4, 847–855. [Google Scholar] [CrossRef]
- Wang, Q.; Pipattanasomporn, M.; Kuzlu, M.; Tang, Y.; Li, Y.; Rahman, S. Framework for vulnerability assessment of communication systems for electric power grids. IET Gener. Transm. Distrib. 2016, 10, 477–486. [Google Scholar] [CrossRef]
- Kateb, R.; Tushar, M.H.K.; Assi, C.; Debbabi, M. Optimal tree construction model for cyber-attacks to wide area measurement systems. IEEE Trans. Smart Grid 2018, 9, 25–34. [Google Scholar] [CrossRef]
- Wang, X.; Sun, B.; Liao, Y.; Xiang, C. Computer Network Vulnerability Assessment Based on Bayesian Attribute Network. J. Beijing Univ. Posts Telecommun. 2015, 38, 106–112. [Google Scholar]
- Miao, F.; Zhu, Q.; Pajic, M.; Pappas, G.J. A hybrid stochastic game for secure control of cyber-physical systems. Automatica 2018, 93, 55–63. [Google Scholar] [CrossRef]
- Yan, F.; Yin, X.; Huang, H. Research on establishing network intrusion modeling based on MLL-AT. J. Commun. 2011, 32, 115–124. [Google Scholar]
- Zhang, H.; Wu, Z.; Ge, F.; Rong, X.; Yang, W.; Xu, C. Research on Power Distribution Automation Construction Effects Evaluation System Based on SMART Criteria. Power Syst. Technol. 2016, 40, 2192–2198. [Google Scholar]
- Luo, F.; Yang, W.; Zhang, T.; Wang, C.; Wei, G.; Yao, L. Influence of Distribution Automation Data Transmission Errors on Power Supply Reliability of Distribution System. Autom. Electr. Power Syst. 2018, 42, 10–19. [Google Scholar]
- Schneier, B. Attack trees. Dr. Dobb’s J. 1999, 24, 21–29. [Google Scholar]
- Lallie, H.S.; Debattista, K.; Bal, J. An empirical evaluation of the effectiveness of attack graphs and fault trees in cyber-attack perception. IEEE Trans. Inf. Forensics Secur. 2018, 13, 1110–1122. [Google Scholar] [CrossRef]
- Kong, H.K.; Hong, M.K.; Kim, T.S. Security risk assessment framework for smart car using the attack tree analysis. J. Ambient Intell. Hum. Comput. 2018, 9, 531–551. [Google Scholar] [CrossRef]
- Doynikova, E.; Kotenko, I. CVSS-based probabilistic risk assessment for cyber situational awareness and countermeasure selection. In Proceedings of the 2017 25th Euromicro International Conference on Parallel, Distributed and Network-Based Processing (PDP), St. Petersburg, Russia, 6–8 March 2017; pp. 346–353. [Google Scholar]
- Venkataramanan, V.; Srivastava, A.; Hahn, A.; Zonouz, S. Enhancing Microgrid Resiliency Against Cyber Vulnerabilities. In Proceedings of the 2018 IEEE Industry Applications Society Annual Meeting (IAS), Portland, OR, USA, 23–27 September 2018; pp. 1–8. [Google Scholar]
- Aksu, M.U.; Dilek, M.H.; Tatlı, E.İ.; Bicakci, K.; Dirik, H.İ.; Demirezen, M.U.; Aykır, T. A quantitative CVSS-based cyber security risk assessment methodology for IT systems. In Proceedings of the 2017 International Carnahan Conference on Security Technology (ICCST), Madrid, Spain, 23–26 October 2017; pp. 1–8. [Google Scholar]
- Common Vulnerability Scoring System v3.0: User Guide. Available online: https://www.first.org/cvss/v3.0/user-guide (accessed on 19 June 2019).
- Moussa, B.; Debbabi, M.; Assi, C. A detection and mitigation model for PTP delay attack in an IEC 61850 substation. IEEE Trans. Smart Grid 2018, 9, 3954–3965. [Google Scholar] [CrossRef]
- Li, X.; Ma, H.; Zhou, F.; Gui, X. Service operator-aware trust scheme for resource matchmaking across multiple clouds. IEEE Trans. Parallel Distrib. Syst. 2015, 26, 1419–1429. [Google Scholar] [CrossRef]


| Relevant Metrics | Possible Metric Values | Quantified Scores |
|---|---|---|
| Attack vector (AV) | Network (N)/Adjacent (A)/Local (L)/Physical (P) | 0.85/0.62/0.55/0.2 |
| Attack complexity (AC) | Low (L)/High (H) | 0.77/0.44 |
| Privilege required (PR) | Non (N)/Low (L)/High (H) | 0.85/0.62/0.27 |
| User interaction (UI) | Non (N)/Requirement (R) | 0.85/0.62 |
| Scope of influence (S) | Unchanged (U)/Changed (C) | Depends on ESS, ISC |
| Confidentiality (C) | Non (N)/Low (L)/High (H) | 0/0.22/0.56 |
| Integrity (I) | Non (N)/Low (L)/High (H) | 0/0.22/0.56 |
| Availability (A) | Non (N)/Low (L)/High (H) | 0/0.22/0.56 |
| Nodes | Definitions |
|---|---|
| G | Damaging/intruding into the DAS, endangering security |
| G1 | Reaching G through a network attack |
| G2 | Reaching G through an attack on physical equipment |
| H1 | Reaching G1 through an Internet attack |
| H2 | Reaching G1 through internal and related business network attacks |
| H3 | Attack after acquiring a puppet machine |
| H4 | Acquiring sensitive information from the internal database |
| E1 | Implanting a Trojan horse into the control server |
| E2 | Obtaining server data through phishing mail/web pages |
| E3 | Intruding through a distributed denial-of-service attack |
| E4 | Obtaining data by invading a web service of the DAS on the Internet |
| E5 | Intruding through remote network vulnerabilities |
| E6 | Cracking an internal wireless network password to obtain traffic information |
| E7 | Scanning internal network port, service, and other asset information |
| E8 | Acquiring root access to the database |
| E9 | Attempting remote code execution through SMB vulnerabilities |
| E10 | Entering into the distribution automation system through social engineering |
| E11 | Breaking the BIOS through a u-disk to bypass a password requirement |
| Leaf Nodes | Vulnerability No. | DAS Components | Vector String | |
|---|---|---|---|---|
| Figure 6E1 | CVE-2017-1287 | Distributed encryption authentication device | AV:N/AC:L/PR:L/UI:R/S:C/C:L/I:L/A:N | 0.67 |
| E2 | CVE-2017-5873 | Management information region terminal | AV:L/AC:L/PR:H/UI:N/S:U/C:H/I:H/A:H | 0.54 |
| E3 | CVE-2018-1137 | Front-end device | AV:N/AC:L/PR:L/UI:N/S:U/C:N/I:H/A:H | 0.81 |
| E4 | CVE-2017-5873 | Management information region terminals | AV:N/AC:L/PR:H/UI:R/S:C/C:L/I:L/A:N | 0.48 |
| E5 | CVE-2018-9935 | Distributed terminal | AV:N/AC:L/PR:N/UI:R/S:U/C:H/I:H/A:H | 0.88 |
| E6 | CVE-2018-0247 | Wireless network in the security access region | AV:A/AC:L/PR:N/UI:N/S:C/C:N/I:L/A:N | 0.47 |
| E7 | CVE-2015-6314 | Production control region server | AV:N/AC:L/PR:N/UI:N/S:U/C:H/I:H/A:H | 0.98 |
| E8 | CVE-2015-596 | Acquisition server in the security access region | AV:L/AC:L/PR:N/UI:N/S:U/C:H/I:N/A:N | 0.62 |
| E9 | CVE-2018-3269 | Production control region server | AV:N/AC:L/PR:L/UI:N/S:U/C:N/I:N/A:L | 0.53 |
| E10 | CVE-2017-2839 | Monitoring computing station in the main station | AV:N/AC:H/PR:N/UI:N/S:U/C:N/I:N/A:H | 0.59 |
| E11 | CVE-2009-0243 | Transport unit controller in the main station | AV:L/AC:L/UI:N/C:C/I:C/A:C | 0.72 |
| Serial No. | Attack Paths | Attack Probability |
|---|---|---|
| S1 | E1, E2, G1, G | 0.3618 |
| S2 | E1, E3, G1, G | 0.5427 |
| S3 | E1, E4, G1, G | 0.3216 |
| S4 | E1, E5, G1, G | 0.5896 |
| S5 | E6, G1, G | 0.47 |
| S6 | E7, E8, E9, G1, G | 0.322 |
| S7 | E10, E11, G2, G | 0.4248 |
© 2019 by the authors. Licensee MDPI, Basel, Switzerland. This article is an open access article distributed under the terms and conditions of the Creative Commons Attribution (CC BY) license (http://creativecommons.org/licenses/by/4.0/).
Share and Cite
Li, E.; Kang, C.; Huang, D.; Hu, M.; Chang, F.; He, L.; Li, X. Quantitative Model of Attacks on Distribution Automation Systems Based on CVSS and Attack Trees. Information 2019, 10, 251. https://doi.org/10.3390/info10080251
Li E, Kang C, Huang D, Hu M, Chang F, He L, Li X. Quantitative Model of Attacks on Distribution Automation Systems Based on CVSS and Attack Trees. Information. 2019; 10(8):251. https://doi.org/10.3390/info10080251
Chicago/Turabian StyleLi, Erxia, Chaoqun Kang, Deyu Huang, Modi Hu, Fangyuan Chang, Lianjie He, and Xiaoyong Li. 2019. "Quantitative Model of Attacks on Distribution Automation Systems Based on CVSS and Attack Trees" Information 10, no. 8: 251. https://doi.org/10.3390/info10080251
APA StyleLi, E., Kang, C., Huang, D., Hu, M., Chang, F., He, L., & Li, X. (2019). Quantitative Model of Attacks on Distribution Automation Systems Based on CVSS and Attack Trees. Information, 10(8), 251. https://doi.org/10.3390/info10080251