Exploring Whether Data Can be Represented as a Composite Unit in Form Processing Using the Manufacturing of Information Approach


Abstract
:1. Introduction
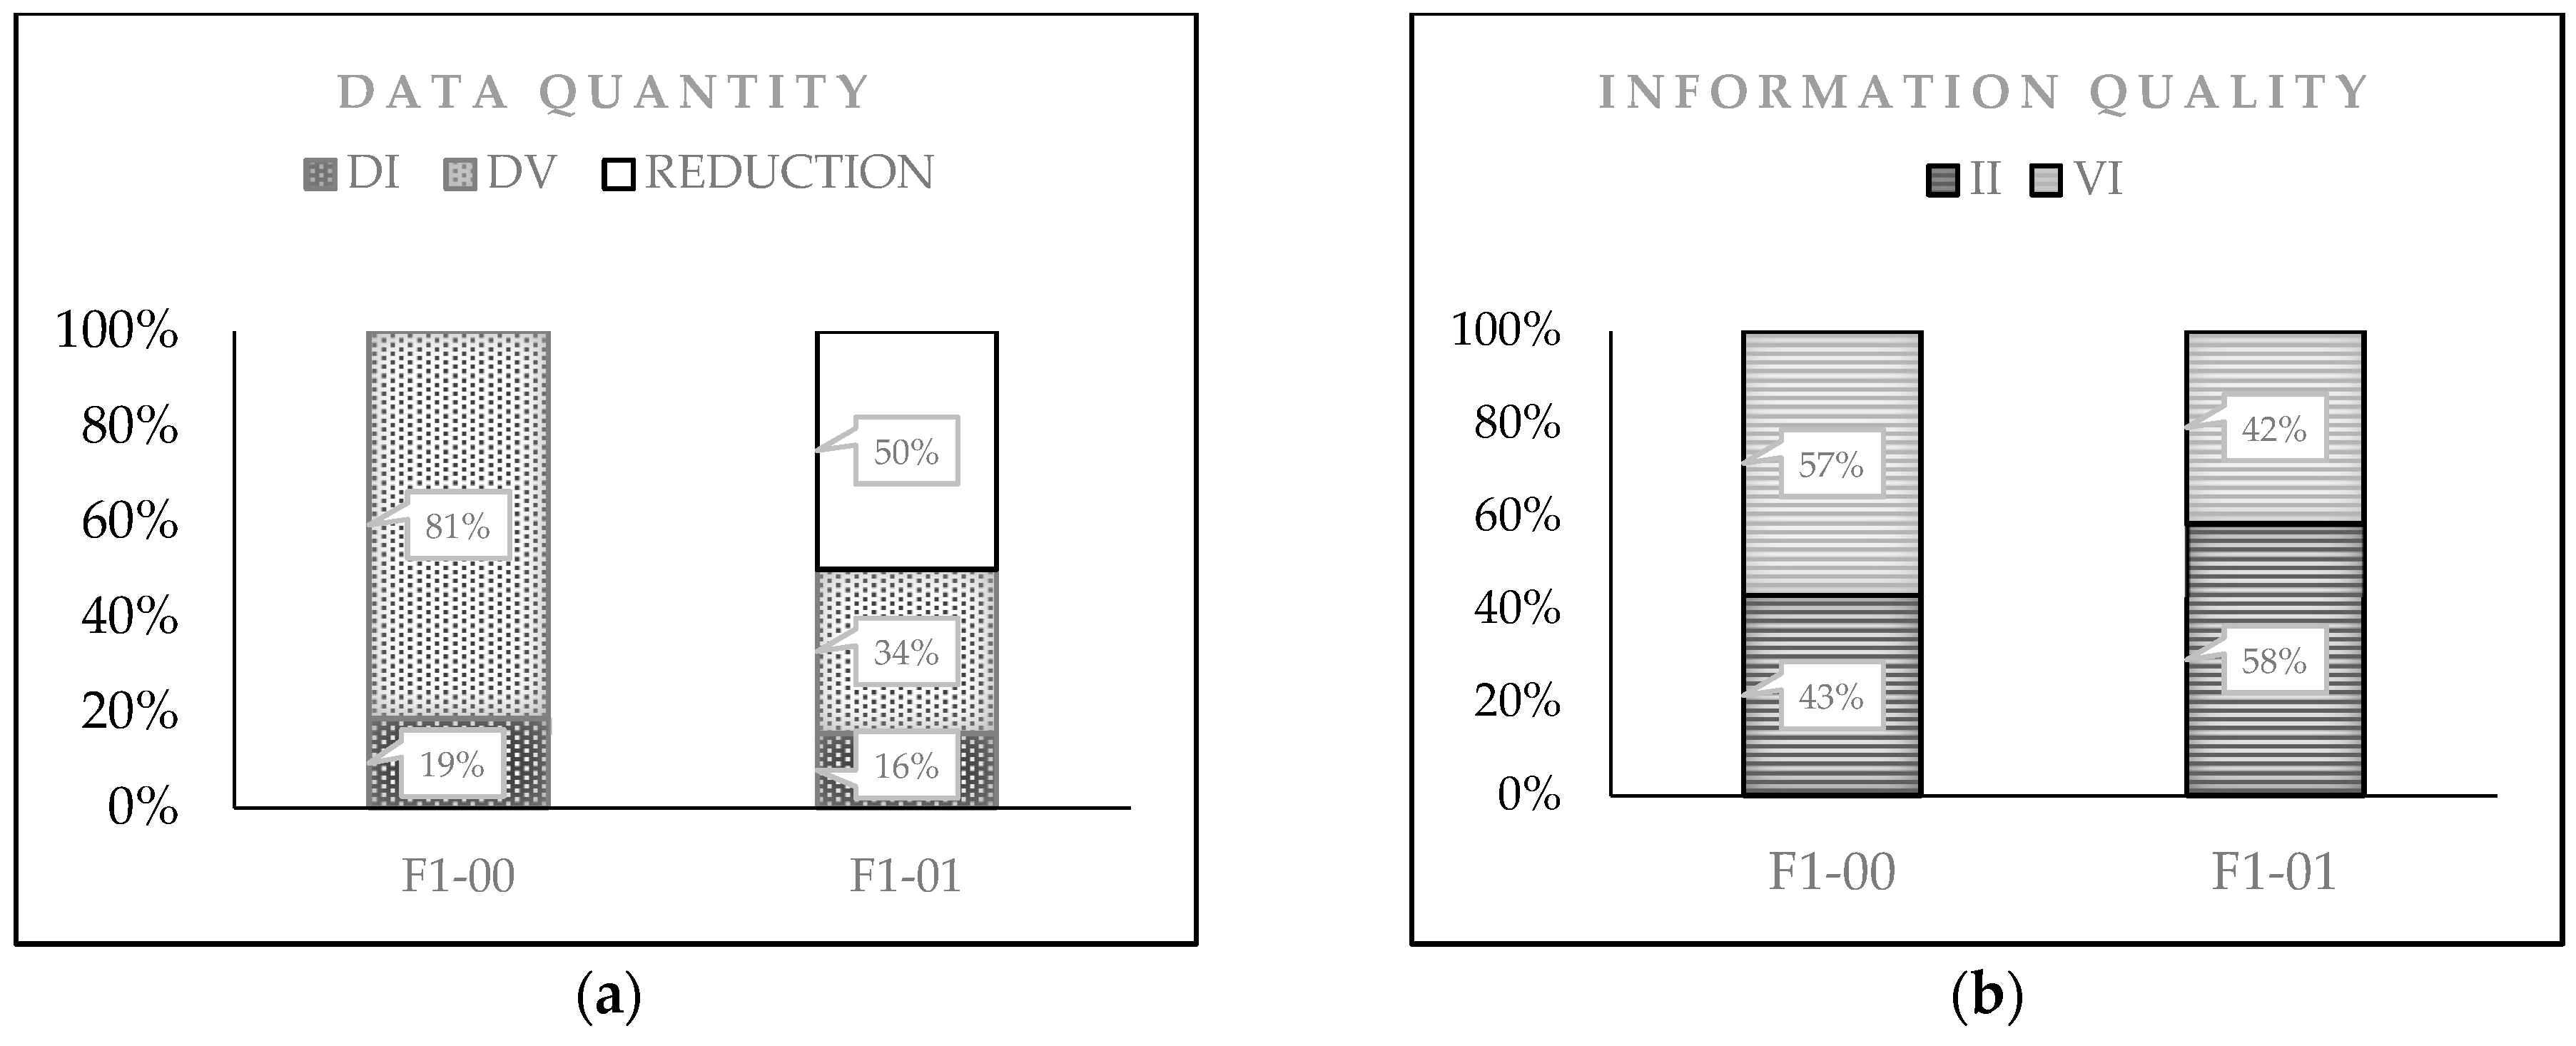
- The results suggest that this new representation of the data input should be considered in the evaluation of information quality output from a communication system (CS). With the application of the CD-PI-A model developed here, we show that it is possible to pursue and achieve the same objective with two different documents. Thus, it is possible to capture the same information content with a smaller amount of data and produce a better quality of information;
- This new representation and model for evaluating data and information should help highlight the necessity of the consistent use of data and information terminology;
- This study shows that, for the already established attributes, a new classification should be considered, according to the moment when the analysis process is made;
- From the applicability of the CD-PI-A model, we found that the quality of information output can increase without necessarily having a corresponding increase in the quantity of data input.
2. Case of Analysis
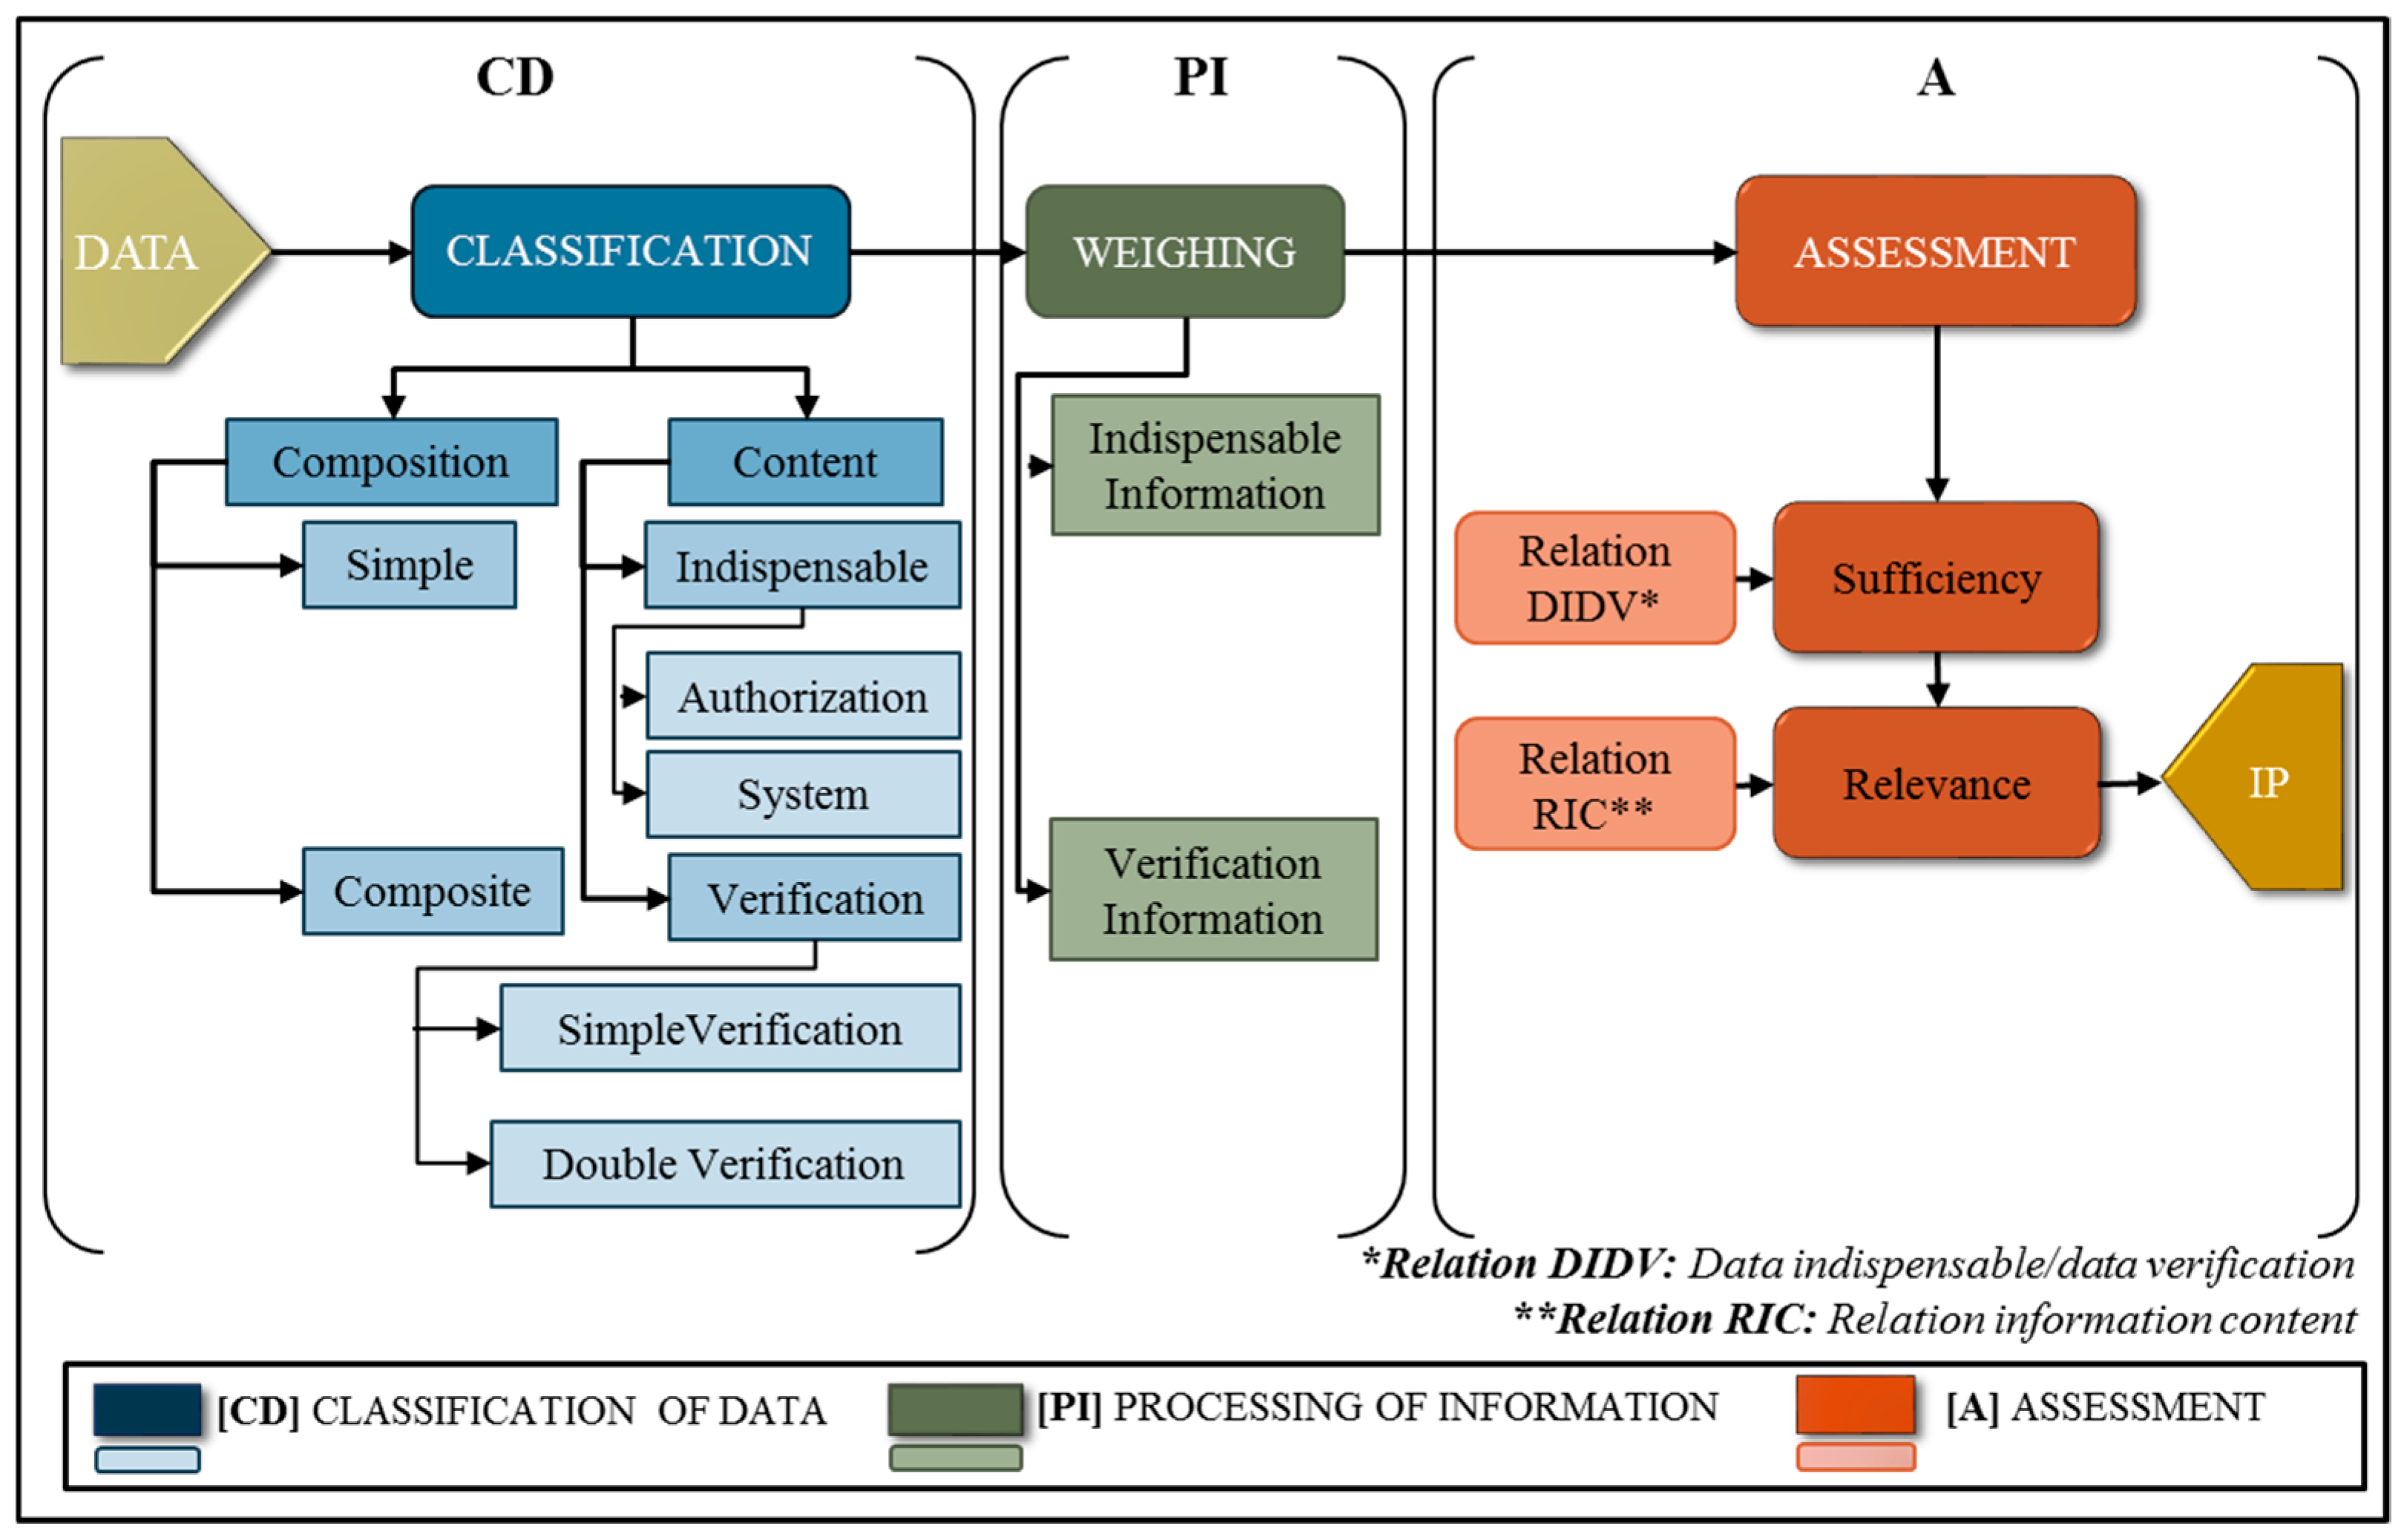
3. Model of Information Quality Assessment: CD-PI-A
3.1. Classification of Data (CD)
- For their composition, the data units can be tagged into two types: (1) simple or (2) composite.(1) Simple (Ds). Ds = {Dsi|i = 1, …, I}. This is the set of simple data units, where Dsi is the ith data unit and I is the total number of simple dus. This type of du is composed of one and only one element, such as a name, local identification number, date, signature, and so on. In its transformation into information, the data unit takes the weight value w. The value of w is assigned according to the content classification, which is explained via(2) Composite (Dc) Dc = {Dck|k = 1, …, K}. This is the set of data unit composites, where Dck is the kth du and K is the total number of composite data units. This type of data unit is a compound of two or more simple data units, which can be, for example, a registration number, social security number, institutional code, and so on. In its transformation into information, the corresponding weight w is multiplied by the factor x, which depends on the number of simple data (Ds) units that form the composite data unit:where
- For content, the data units are classified into two types of data representation. These two types of data are indispensable and verification data.
- (1)
- Indispensable data (DI), DI = {Dia + Dis}. This type of data unit always appears at some stage in the process and can be one of the following two types:
- Authorization (Dia): Dia = {Diam|m = 1, …, M}. This is the type of indispensable du for authorization, where Diam is the mth data unit and M is the total number of indispensable dus for authorization. This type of du corresponds to the highest value of the weight w, since it is considered to be a very important du for processing. Without this, the system cannot produce the information products. This depends on the approval (or rejection) given by the responsible personnel, according to the policies or organizational procedures.
- System (Dis): Dis = {Disn|n = 1, …, N}. This is the set of dus indispensable for the system, where Disn is the nth du and N is the total number of indispensable dus in the system. This data type is considered to be important. This du type is essential within the process and, usually, it corresponds to questions such as who, what, when, where, why, and who authorizes. Without them, the processing of information cannot be completed.
- (2)
- Verification data (DV). DV = {Dv + Dvv}. This du type is found frequently during processing; although, in some cases, document processing is carried out without it. This type of du can be of two types:
- Simple verification data (Dv). Dv = {Dvs|s = 1, …, S} This is the simple verification du set, where Dvs is the sth du and S is the total number of simple verification dus. Some decision-makers consider it necessary to have this kind of unit to make the decision-making process safer [32]. However, without some of these dus, data can still be processed. This type of du is sometimes used for processing, and it can be considered slightly important;
- Double verification data (Dvv). Dvv = {Dvvt|t= 1, …, T}. This is the double verification du set, where Dvvt is the tth du and T is the total number of double verification dus. This du type is rarely used to verify essential data and it may be not at all important to processing but, in some cases, they are still requested.
3.2. Processing Data into Information (PI)
- Indispensable information (II), which is the result of transforming indispensable du (simple or composite, catalogued as either for authorization or for the system transformation) into information through its corresponding duv assignment.
- Verification information (VI), which is the result of transforming verification du (simple or composite catalogued as either as simple verification or double verification) into information through its corresponding duv assignment.
Data Unit Value (duv)
- Information products of the indispensable units (II): this type of IP results from indispensable (simple and composite) du. It must be ordered as follows: first, the information derived from the authorization type (Dc/Dia, Ds/Dia); and second, for the system (Dc/Dis, Ds/Dis):
- Information products of the verification units (IV): this type results from simple verification and double verification data units. It must be ordered as follows: first, the information that corresponds to Dc/Dv and Ds/Dv; and second, the information that derives from the double verification du (Dc/Dvv, Ds/Dvv):
3.3. Assessment (A)
3.3.1. Relationship DIDV
3.3.2. Relationship RIC
4. Results and Discussion
4.1. Re-Engineering
4.2. Another Example of Applicability
4.3. Comparison with Previous Work
- Reports that had used the manufacturing of information approach generally used the terms data and information interchangeably, giving them the same value at the entrance and at the exit of the system [2,21,37,38,39]. Very few reports were found that made a distinction between these two terms [5,12], and those that did were only at a conceptual level. The fact of addressing the information at the same level of data leads us to consider the system by which the flow of data acts more like a transmission than a communication system. In this paper, we established, to the extent possible, the distinction between these two concepts in order to avoid misunderstandings and to be consistent with the proposal. The criterion to underline the difference between these two concepts was to use the terms according to the processing moment in which they were applied.
- With regards to the proposal of reference [12], where information was considered as an output of a communication system, different alternatives for measuring the information were presented. Three levels of information were considered: technical, semantic, and pragmatic, and a fourth level, the functional, was also added. Regarding the semantic aspect, it was mentioned that the information could be measured by the numbers of meaningful units between the sender and receiver. However, a method to carry it out was not presented. For our part, we propose a method to evaluate the semantic level, which considers the information as an output of the CS.
- Additionally, in contrast to previous reports [2,11,40] that considered the document as a data unit, this research considers one document as a data block container of several data units, dus, that are represented according to their distinctive properties. The distinction among these dus is established through a classification, in accordance with their composition and content. This representation creates a distinction between data quantification and information assessment. Furthermore, it considers that data input and data output could be useful in a technical analysis of data transmission. However, the vision of data input and information output implies that, in the quality information assessment, the finished product has a different value than the initial raw material.
5. Conclusions
Author Contributions
Funding
Acknowledgments
Conflicts of Interest
References
- IBM Big Data and Analytics Hub. Extracting Business Value from the 4 V’s of Big Data. Available online: https://www.ibmbigdatahub.com/infographic/extracting-business-value-4-vs-big-data (accessed on 24 April 2019).
- Ballou, D.P.; Wang, R.; Pazer, H.; Tayi, G.K. Modeling Information Manufacturing Systems to Determine Information Product Quality. Manag. Sci. 1998, 44, 462–484. [Google Scholar] [CrossRef]
- Arnold, S.E. Manufacturing: The Road To Database Quality. Database 1992, 15, 32–39. [Google Scholar]
- Huh, Y.; Keller, F.; Redman, T.; Watkins, A. Data quality. Inf. Softw. Technol. 1990, 32, 559–565. [Google Scholar] [CrossRef]
- Ronen, B.; Spiegler, I. Information as inventory: A new conceptual view. Inf. Manag. 1991, 21, 239–247. [Google Scholar] [CrossRef]
- Wang, R.Y.; Strong, D.M. Beyond Accuracy: What Data Quality Means to Data Consumers. J. Manag. Inf. Syst. 1996, 12, 5–33. [Google Scholar] [CrossRef]
- Wang, R.Y.; Lee, Y.W.; Pipino, L.L.; Strong, D.M. Manage Your Information as a Product. Sloan Manag. Rev. 1998, 39, 95–105. [Google Scholar]
- Wang, Y.R.; Madnick, S.E. A Polygen Model for Heterogeneous Database Systems: The Source Tagging Perspective. In Proceedings of the 16th International Conference on Very Large Data Bases, Brisbane, Australia, 13–16 August 1990; pp. 519–538. [Google Scholar] [CrossRef]
- Wang, R.Y. A Product Perspective on Total Data Quality Management. Commun. ACM 1998, 41, 58–65. [Google Scholar] [CrossRef]
- Shankaranarayanan, G.; Blake, R. From Content to Context: The Evolution and Growth of Data Quality Research. J. Data Inf. Qual. 2017, 8, 1–28. [Google Scholar] [CrossRef]
- Shankaranarayanan, G.; Cai, Y. Supporting data quality management in decision-making. Decis. Support Syst. 2006, 42, 302–317. [Google Scholar] [CrossRef]
- Masen, R.O. Measuring Information Output a communication systems approach. Inf. Manag. 1978, 1, 219–234. [Google Scholar] [CrossRef]
- Juran, J.M. Juran on Leadership for Quality; Free Press: New York, NY, USA, 1989. [Google Scholar]
- Deming, W.E. Out of the Crisis; MIT Press: Cambridge, MA, USA, 1986. [Google Scholar]
- Batini, C.; Scannapieco, M. Data and Information Quality—Dimensions, Principles and Techniques; Springer: Berlin/Heidelberg, Germany, 2016. [Google Scholar]
- Bovee, M.; Srivastava, R.P.; Mak, B. A conceptual framework and belief-function approach to assessing overall information quality. Int. J. Intell. Syst. 2003, 18, 51–74. [Google Scholar] [CrossRef]
- Wand, Y.; Wang, R.Y. Anchoring data quality dimensions in ontological foundations. Commun. ACM 1996, 39, 86–95. [Google Scholar] [CrossRef]
- Ballou, D.P.; Pazer, H.L. Modeling completeness versus consistency tradeoffs in information decision contexts. IEEE Trans. Knowl. Data Eng. 2003, 15, 241–244. [Google Scholar] [CrossRef]
- DeLone, W.H.; McLean, E.R. Information Systems Success: The Quest for the Dependent Variable. Inf. Syst. Res. 1992, 3, 60–95. [Google Scholar] [CrossRef]
- Jarke, M.; Lenzerini, M.; Vassiliou, Y.; Vassiliadis, P. Fundamentals of Data Warehouses; Springer: Berlin/Heidelberg, Germany, 1999. [Google Scholar]
- Michnik, J.; Lo, M.C. The assessment of the information quality with the aid of multiple criteria analysis. Eur. J. Oper. Res. 2009, 195, 850–856. [Google Scholar] [CrossRef]
- Redman, T.C. The impact of poor data quality on the typical enterprise. Commun. ACM 1998, 41, 79–82. [Google Scholar] [CrossRef]
- Pipino, L.L.; Lee, Y.W.; Wang, R.Y. Data Quality Assessment. Commun. ACM 2002, 45, 211. [Google Scholar] [CrossRef]
- Meadow, C.T.; Yuan, W. Measuring the impact of information: Defining the concepts. Inf. Process. Manag. 1997, 33, 697–714. [Google Scholar] [CrossRef]
- Yu, L. Back to the fundamentals again. J. Doc. 2015, 71, 795–816. [Google Scholar] [CrossRef]
- Bawden, D.; Robinson, L. A few exiting words: Information and Entropy revisited. J. Assoc. Inf. Sci. Technol. 2015, 66, 1966–1987. [Google Scholar] [CrossRef]
- Robinson, L.; Bawden, D. Mind the gap: transitions between concepts of information in varied domains. In Theories of Information, Communication and Knowledge; Ibekwe-SanJuan, F., Dousa, T.M., Eds.; Springer: Berlin/Heidelberg, Germany, 2013; pp. 121–141. ISBN 978-94-007-6973-1. [Google Scholar]
- Ruben, B. Communication and Human Behavior; Prentice-Hall: Upper Saddle River, NJ, USA, 1992. [Google Scholar]
- Denning, P.J.; Bell, T. The information paradox. Am. Sci. 2012, 470–477. [Google Scholar] [CrossRef]
- Han, J.; Pei, J.; Kamber, M. Data Mining: Concepts and Techniques, 3rd ed.; Elsevier: Boston, MA, USA, 2012. [Google Scholar]
- Tee, S.W.; Bowen, P.L.; Doyle, P.; Rohde, F.H. Factors Influencing Organizations to Improve Data Quality in their Information Systems. Account. Finance 2007, 47, 335–355. [Google Scholar] [CrossRef]
- Ackoff, R.L. Management Misinformation Systems. Manag. Sci. 1967, 14, 147–156. [Google Scholar] [CrossRef]
- Ballou, D.P.; Pazer, H.L. Modeling data and process quality in multi-input, multi-out- put information systems. Manag. Sci. 1985, 31, 123–248. [Google Scholar] [CrossRef]
- Redman, T.C. La qualité des données à l’âge de l’information; InterÉditions: Paris, France, 1998. [Google Scholar]
- Eppler, M.J.; Mengis, J. The concept of information overload: A review of literature from organization science, accounting, marketing, MIS, and related disciplines. Inf. Soc. 2004, 20, 325–344. [Google Scholar] [CrossRef]
- Edmunds, A.; Morris, A. The problem of information overload in business organisations: A review of the literature. Int. J. Inf. Manag. 2000, 20, 17–28. [Google Scholar] [CrossRef]
- Lee, Y.W.; Strong, D.M.; Kahn, B.K.; Wang, R.Y. AIMQ: A methodology for information quality assessment. Inf. Manag. 2002, 40, 133–146. [Google Scholar] [CrossRef]
- Kaomea, P.; Page, W. A flexible information manufacturing system for the generation of tailored information products. Decis. Support Syst. 1997, 20, 345–355. [Google Scholar] [CrossRef]
- Botega, L.C.; de Souza, J.O.; Jorge, F.R.; Coneglian, C.S.; de Campos, M.R.; de Almeida Neris, V.P.; de Araújo, R.B. Methodology for Data and Information Quality Assessment in the Context of Emergency Situational Awareness. Univers. Access Inf. Soc. 2016, 889–902. [Google Scholar] [CrossRef]
- Shankaranarayanan, G.; Wang, R.Y.; Ziad, M. IP-MAP: Representing the Manufacture of an Information Product. In Proceedings of the 2000 Conference on Information Quality, Cambridge, MA, USA, 20–22 October 2000; pp. 1–16. [Google Scholar]


| Section No. | Section Name | Data ID. | Data | Data Classification |
|---|---|---|---|---|
| 1 | Identification | 1 | Last name | Ds/Dis |
| 2 | First name | Ds/Dis | ||
| 3 | Home phone | Ds/Dv | ||
| 4 | Work phone | Ds/Dvv | ||
| 5 | Extension phone | Ds/Dvv | ||
| 2 | Paid Employee | 6 | Employee ID | Dc/Dis |
| 7 | Student ID | Dc/Dis | ||
| 8 | Multiple choice 1 | Ds/Dv | ||
| 3 | Paid Partial Time Teaching | 9 | Employee ID | Ds/Dvv |
| 10 | Student ID | Ds/Dvv | ||
| 11 | Multiple choice 2 | Ds/Dv | ||
| 12 | Class name | Ds/Dv | ||
| 13 | Beginning date | Ds/Dvv | ||
| 14 | End date | Ds/Dvv | ||
| 4 | Paid Researcher | 15 | Employee ID | Ds/Dvv |
| 16 | Student ID | Ds/Dvv | ||
| 5 | Student by Session | 17 | Student ID | Ds/Dvv |
| 18 | Multiple choice 3 | Ds/Dv | ||
| 19 | Club name | Ds/Dv | ||
| 20 | Tutor | Ds/Dv | ||
| 21 | Other specify 1 | Ds/Dv | ||
| 6 | Other (Unpaid or non-students) | 22 | Temporal ID | Dc/Dis |
| 23 | Multiple choice 4 | Ds/Dv | ||
| 24 | Other specify 2 | Ds/Dv | ||
| 25 | Sponsor | Ds/Dv | ||
| 26 | Reason 1 | Ds/Dv | ||
| 7 | Locals | 27 | Local numbers | Ds/Dis |
| 28 | Expiration date | Ds/Dis | ||
| 29 | Access out hours | Ds/Dv | ||
| 30 | Reason 2 | Ds/Dv | ||
| 8 | Authorization | 31 | Signature | Ds/Dia |
| 32 | Date | Ds/Dv |
| Attribute Content | w |
|---|---|
| Dia | 4 |
| Dis | 3 |
| Dv | 2 |
| Dvv | 1 |
| Information Type | Data Type | f | Dacc | Drelacc | Irel | Irelacc | ||
|---|---|---|---|---|---|---|---|---|
| II | Ds/Dia | 1 | 4 | 4 | 0.05 | |||
| Signature | ||||||||
| Dc/Dis | 1 | 15 | 15 | 0.21 | ||||
| Student ID or employee ID or other ID | ||||||||
| Ds/Dis | 4 | 6 | 0.19 | 3 | 12 | 0.17 | 0.43 | |
| Last name, first name, locals, expiration date | ||||||||
| IV | Ds/Dv | 15 | 2 | 30 | 0.42 | |||
| Home phone, multiple choice 1, multiple choice 2, class name, multiple choice 3, club, tutor, other—specify 1, multiple-choice 4, other specify 2, sponsor, raison 1, access out, raison 2, date | ||||||||
| Ds/Dvv | 11 | 26 | 0.81 | 1 | 11 | 0.15 | 0.57 | |
| Work phone, ext-phone, beginning date, end date, redundant IDs (seven times) | ||||||||
| Information Type | Data Type | f | Dacc | Drelacc | duv | duvset | Irel | Irelacc | |
|---|---|---|---|---|---|---|---|---|---|
| II | Ds/Dia | 1 | 4 | 1 | 0.08 | ||||
| Signature | |||||||||
| Dc/Dis | 1 | 15 | 15 | 0.28 | |||||
| Student ID or employee ID or other ID | |||||||||
| Dc/Dis | 1 | 6 | 6 | 0.11 | |||||
| Last name/first name | |||||||||
| Ds/Dis | 2 | 5 | 0.16 | 3 | 6 | 0.11 | 0.58 | ||
| Locals, expiration date | |||||||||
| VI | Ds/Dv | 11 | 11 | 0.34 | 22 | 22 | 0.42 | 0.42 | |
| Contact phone, phone type, satatus 1, status 2-A, out hours, specify hours, status 2-B, class name, club or tutor or another name, specify another date | |||||||||
| n/a | Ds/Dvv | - | - | - | - | - | - | - | |
| TOTALS | 16 | 0.50 | 53 | 1.00 | |||||
| Form | Relation DIDV | Relation RIC |
|---|---|---|
| F1–00 | 1:4.33 | 1.32 |
| F1–01 | 1:2.2 | 0.71 |
| Information Type | Data Type | Factor x | w | f | Dacc | Drelacc | duv | duvset | Irel | Irelacc |
|---|---|---|---|---|---|---|---|---|---|---|
| II | Ds/Dia | 4 | 2 | 4 | 8 | 0.02 | ||||
| Dc/Dis | 11 | 3 | 1 | 33 | 33 | 0.10 | ||||
| 9 | 3 | 1 | 27 | 27 | 0.08 | |||||
| 7 | 3 | 1 | 21 | 21 | 0.06 | |||||
| 6 | 3 | 2 | 18 | 36 | 0.11 | |||||
| 5 | 3 | 1 | 15 | 15 | 0.04 | |||||
| 4 | 3 | 1 | 12 | 12 | 0.03 | |||||
| 3 | 3 | 1 | 9 | 9 | 0.03 | |||||
| 2 | 3 | 1 | 6 | 6 | 0.02 | |||||
| Ds/Dis | 3 | 35 | 46 | 0.58 | 3 | 105 | 0.31 | 0.80 | ||
| VI | Ds/Dv | 2 | 33 | 2 | 66 | 0.20 | ||||
| Ds/Dvv | 1 | 0 | 33 | 0.42 | 1 | 0 | 0 | 0.20 | ||
| TOTALS | 79 | 1.00 | 338 | 1.00 | 1.00 | |||||
© 2019 by the authors. Licensee MDPI, Basel, Switzerland. This article is an open access article distributed under the terms and conditions of the Creative Commons Attribution (CC BY) license (http://creativecommons.org/licenses/by/4.0/).
Share and Cite
Blasco-Lopez, M.; Hausler, R.; Romero-Lopez, R.; Glaus, M.; Diaz-Sobac, R. Exploring Whether Data Can be Represented as a Composite Unit in Form Processing Using the Manufacturing of Information Approach. Information 2019, 10, 156. https://doi.org/10.3390/info10050156
Blasco-Lopez M, Hausler R, Romero-Lopez R, Glaus M, Diaz-Sobac R. Exploring Whether Data Can be Represented as a Composite Unit in Form Processing Using the Manufacturing of Information Approach. Information. 2019; 10(5):156. https://doi.org/10.3390/info10050156
Chicago/Turabian StyleBlasco-Lopez, Monica, Robert Hausler, Rabindranarth Romero-Lopez, Mathias Glaus, and Rafael Diaz-Sobac. 2019. "Exploring Whether Data Can be Represented as a Composite Unit in Form Processing Using the Manufacturing of Information Approach" Information 10, no. 5: 156. https://doi.org/10.3390/info10050156
APA StyleBlasco-Lopez, M., Hausler, R., Romero-Lopez, R., Glaus, M., & Diaz-Sobac, R. (2019). Exploring Whether Data Can be Represented as a Composite Unit in Form Processing Using the Manufacturing of Information Approach. Information, 10(5), 156. https://doi.org/10.3390/info10050156