Article

A Template Generation and Improvement Approach for Finger-Vein Recognition

1
Chongqing Engineering Laboratory of Detection Control and Integrated System, Chongqing Technology and Business University, Chongqing 400067, China
2
School of Computer Science and Information Engineering, Chongqing Technology and Business University, Chongqing 400067, China
3
National Research Base of Intelligent Manufacturing Service, Chongqing Technology and Business University, Chongqing 400067, China
*
Author to whom correspondence should be addressed.
Current address: School of Computer Science and Information Engineering, Chongqing Technology and Business University, Chongqing 400067, China.
Information 2019, 10(4), 145; https://doi.org/10.3390/info10040145
Submission received: 23 February 2019 / Revised: 12 April 2019 / Accepted: 15 April 2019 / Published: 18 April 2019
(This article belongs to the Section Information Applications)

Abstract

:
Finger-vein biometrics have been extensively investigated for person verification. One of the open issues in finger-vein verification is the lack of robustness against variations of vein patterns due to the changes in physiological and imaging conditions during the acquisition process, which results in large intra-class variations among the finger-vein images captured from the same finger and may degrade the system performance. Despite recent advances in biometric template generation and improvement, current solutions mainly focus on the extrinsic biometrics (e.g., fingerprints, face, signature) instead of intrinsic biometrics (e.g., vein). This paper proposes a weighted least square regression based model to generate and improve enrollment template for finger-vein verification. Driven by the primary target of biometric template generation and improvement, i.e., verification error minimization, we assume that a good template has the smallest intra-class distance with respect to the images from the same class in a verification system. Based on this assumption, the finger-vein template generation is converted into an optimization problem. To improve the performance, the weights associated with similarity are computed for template generation. Then, the enrollment template is generated by solving the optimization problem. Subsequently, a template improvement model is proposed to gradually update vein features in the template. To the best of our knowledge, this is the first proposed work of template generation and improvement for finger-vein biometrics. The experimental results on two public finger-vein databases show that the proposed schemes minimize the intra-class variations among samples and significantly improve finger-vein recognition accuracy.

1. Introduction

To meet the growing demand for secured systems, automatic human authentication using physical and behavioral modalities has received increasing attention. Currently, face, fingerprint and signature have been widely employed to identify criminals in law contexts, for granting access to electronic devices, and for securing access to sensitive facilities. A number of biometric modalities have been applied for personal verification and can be split into two categories: (1) extrinsic modalities such as iris [1], fingerprint [2], and face [3], and (2) intrinsic modalities such as hand-vein [4], finger-vein [5], and palm-vein [6]. However, extrinsic biometric modalities are prone to being copied and faked. For example, a fake version from a stolen extrinsic biometric template (i.e., face images, fingerprints, and iris) can successfully attack the verification system. Therefore, the usage of extrinsic biometrics raises some concerns on privacy and security in practical applications. Different from extrinsic modalities, intrinsic ones (i.e., hand-vein, finger-vein, and palm-vein) are under the skin and are not easily observed in visible light, so they are difficult to steal. In addition, intrinsic biometrics are much harder to forge. Intrinsic biometric modalities, are, therefore, much more secure for user. Among intrinsic modalities, finger-vein biometrics is the most convenient in practical applications. As a result, it is being increasingly investigated in recent years.
However, finger-vein verification faces serious challenges. In practical application, finger-vein image acquisition process is inherently affected by several factors: environmental illumination [7,8,9], light scattering [10,11], ambient temperature [5,9,12], physiological changes [5,12], and user behavior [13,14,15] so the finger-vein patterns acquired from an individual is prone to changes. In other words, the finger-vein measurements tend to have a large intra-class variability. Therefore, the impressions acquired from the same finger at different times may be quite different from each other, which comprises the performance of authentication system. In recent years, various methods have been employed for fingerprints to reduce intra-class variations by fusing multiple enrollment impressions. Some works [16,17,18,19,20,21] are proposed to combine multiple enrolled impressions for improvement of the system’s performance. For example, in works [16,17,18,19], several mathematical models are employed to select prototype fingerprint templates for a finger from a given set of fingerprint impressions and then merge the matching scores between a test image and several templates for verification. To improve verification accuracy, the works [20,21] are proposed to match a given impression with respect to each of the enrollment impressions, and then robust fusion strategies such as feature level and decision level have been used to combine the individual matching results for verification. However, the main drawback of these approaches is that it increases both storage and time requirements, so it is unfeasible for online fingerprint verification.
To overcome this problem, a “super-template” is generated by combining multiple capturing impressions together in works [22,23,24,25]. The “super-template” is considered as a single template which contains highly likely true minutia based on multiple fingerprint images. By matching the query against the super-template, a number of enrollment impressions are obtained by accepting the matching score which are larger than a predefined threshold, and then merged into a “super-template” to increase the accuracy of the verification system. On one hand, the super-template can be improved online during actual application of the verification system, so it reduces the intra-class variations. On the other hand, the “super-template” generation and improving process require a small memory space and short computation, so it receives more and more attention. By incorporating these approaches, the intra-class variations between the query image and enrollment template are reduced, so as to reduce the verification error of the fingerprint verification system.
For the same purpose, template generation and improvement approaches are proposed for face [26,27], gait [28], and signature [29]. However, to the best of our knowledge, there are no existing techniques designed specifically to generate and improve template for finger-vein verification. In most finger-vein verification systems [7,8,9,10,11,12,13,14,15], vein texture patterns are segmented from the grayscale finger-vein images using the preprocessing approaches and stored in a binary image. Then, vein texture features in binary images instead of minutia are employed to match for verification or identification. Therefore, we propose an approach to generate and improve the finger-vein template with binary vein features for verification.
Some research works [30,31] imply that the exposure of biometric templates of enrolled users to adversaries can affect the security of biometric systems by enabling presentation of spoofed samples and replay attacks. For example, the fake version of biometric traits such as face [32] and fingerprint [30,31] can be successfully employed to fool the biometric recognition system. The finger-vein as an inner trait is not easy to copy, but the enrollment template may be stolen. Recent studies [33] have shown that the fake vein patterns are successfully employed for registration in verification systems. However, unlike traditional authentication systems (i.e., passwords), biometric traits such as vein, face and iris are irreplaceable or cancelable in nature. Therefore, the entire biometric recognition system is likely to be completely exposed to the hacker attacks if a biometric trait is lost once. To solve this problem, the works [34,35] are proposed to generate secure finger-vein template for verification. Usage of security template [30,31,36,37,38,39] mainly has the following advantages: (1) high security. Usually, the security biometric recognition system stores the transformed templates instead of original templates. Therefore, even if the adversary compromises the generated templates, the original templates are still secure since it will not be possible (or computationally very hard) to recover it using such a transformed version. (2) Revocability or Renewability. If a biometric template is compromised, it can be simply canceled and re-enrolled using a template generation approach. (3) High privacy. Based on the generated template, it is difficult to ascertain whether two or more instances of protected biometric reference were derived from the same biometric trait of a user. The non-linkability property prevents cross-matching across different applications, thereby preserving the privacy of the individual. Different from security template generation, the enrollment template generation and improvement in works [22,23,24,25,26,27,28] is to improve recognition accuracy and its advantages are concluded as: (1) In registration phase, multiple enrollment images corresponding to each user may be stored. Matching performed among multiple templates achieves the high memory and computation consumption. To overcome this problem, one of the solutions is proposed to generate a best representative super-template based on the multiply enrollment samples and update it online. (2) During the test phase, if the template is not updated, it is possible for the stored template data to be significantly different from those obtained during verification, resulting in an inferior performance (higher false rejects) of the biometric system. Thus, it is necessary to update the enrollment template day-to-day to minimize the intra-class variations and reduce the false rejected errors. Therefore, two template generation schemes show different motivations for finger-vein recognition.
In our work, we assume that a good template can result in minimization of the intra-class variations, and then the template generation and improvement are converted into two optimization problems, which are solved to generate template and improve template. The main paper contributions are summarized as follows: first, finger-vein verification, we assume that a good vein enrollment template is capable of achieving smallest intra-class distance with respect to all enrollment images from same class. Based on this assumption, we convert the enrollment template generation and improvement into two optimization problems. Unlike existing works [22,23,24,25], our approaches directly target minimization of intra-class variations or reduction of verification errors instead of subjective human perception of enrollment template quality. Second, an automatic template generation approach is proposed for finger-vein verification. For each enrollment, we compute its average similarity with respect to remaining enrollments and assign a large weight for the samples which have large average intra-class similarity and small intra-class similarity. The template for each class is produced based on the weighted summation of all enrollments. As the weights are related to the intra-class similarity and inter-class similarity, the generated templates achieve good performance to reduce verification error. Third, we proposed a finger-vein template improvement approach. The templates are improved online during the verification process, so the proposed approach can minimize the intra-class variations. To the best of our knowledge, there has not been any study to generate and improve the finger-vein enrollment template. Finally, rigorous experiments are carried out on the two public finger-vein databases to estimate the performance of our approach. The experimental results imply that the proposed approaches effectively improve the verification accuracy.

2. Weighted Least Square Regression for Template Generation

In this section, a template generation approach is proposed for finger-vein verification. To reduce intra-class variations, similar to existing approaches [22,23,24,25], we merge multiply templates from same class to generate a “super-template” and then improve it by using the vein features in finger-vein images captured at different time. The template generation aims at reducing the intra-class variations, so a “super-template” is directly generated by minimizing the intra-class distance. First, we define the optimal template for finger-vein verification. Based on the definition, we convert the template generation into an optimization problem. Second, the weights are computed by matching the samples from same class or different class. Thirdly, a robust template is obtained by solving an optimization problem.

2.1. Template Quality Definition for Verification

Current template generation methods [16,17,18,19,20,21] aim at improving performance, mainly verification error rates. Therefore, the biometric template generation should target its minimization instead of being based on subjective human perception of enrollment template quality. In a practical verification system, a user’s biometric data is once again acquired and processed, and the extracted features are matched against the template(s) stored in the database for verification. The verification accuracy relies on the stability (permanence) of the biometric data associated with an individual over time [17]. On other words, the verification error rates are mainly triggered by the intra-class variations, so we assume that a good quality finger-vein template has smaller intra-class distance with respect to all enrollment samples.

2.2. Weight Computation

The template is constructed based the multiply enrollment samples. Practically, the enrollment samples have different discrimination, so we assign different weights for different samples. Intuitively, the sample with large intra-class similarity and small inter-class similarity has large weight for template generation. Therefore, for each sample, we compute its similarity with respect to other enrollment samples to determine weight.

2.2.1. Similarity Computation

For finger-vein verification, the vein textures are segmented and stored in binary images, which are employed for matching for verification. As the weight is related to the similarity, a similarity between two enrollments is firstly defined in Equation (2) to obtain robust weight. Then, a weight is automatically assigned for each sample based on the intra-class similarity and inter-class similarity. Assuming E and F are binarized feature maps extracted from two enrollment samples with size of x × y , respectively. The width and height of E are extended to 2 l + x and 2 h + y , and then its expanded image E ¯ is obtained and expressed as:
E ¯ ( i , j ) = E ( i l , j h ) if 1 + l i x + l , 1 + h j y + h 1 otherwise
Figure 1b has illustrated the extended image E ¯ of a template E and the extended region with values of –1 is marked in color. The similarity between E and F is obtained by
d ( E , F ) = max 0 p 2 l , 0 q 2 h i = 1 x j = 1 y Θ ( E ¯ ( i + p , j + q ) , F ( i , j ) ) i = 1 x j = 1 y ( E ¯ ( i + p , j + q ) , 1 ) ,
where
Θ ( U , V ) = 1 , if U V = 0 , 0 , otherwise ,
and
( U , V ) = 1 , if U V , 0 , otherwise .
d ( E , F ) basically computes the maximal amount of overlap between E and F at different spatial shifts excluding the pixels located in the expanded region (e.g., the pink region in Figure 1b). The red rectangle box is a map when the translation distances are p and q over horizontal and vertical directions. The parameters w and h which control the horizontal and vertical translation distance are experimentally determined to 20 and 60 in our work.

2.2.2. Intra-Class Similarity Computation

For each finger-vein image, we compute its average similarity with respect to the remaining images from the same finger by Equation (2) (as shown in Figure 2) and take it as weight. Assume there are N classes and each class provided M enrollment samples. Let x m , n be the mth sample of the nth class and its weight w m , n is computed by
w m , n = i = 1 , i m M d ( x i , n , x m , n ) M 1 ,
where d ( x i , n , x m , n ) represents the similarity between sample x i , n and sample x m , n . w m , n is factually is average intra-class similarity of x m , n with respect to the remaining M 1 enrollment samples.

2.2.3. Inter-Class Similarity Computation

Similarly, we compute inter-class similarity of each enrollment sample to obtain its weight (as shown in Figure 2). The weight w m , n for m t h enrollment sample in the n t h class is computed by
w m , n = i = 1 , i n N m = 1 M d ( x i , n , x m , n ) ( N 1 ) M ,
where d ( x i , n , x m , n ) denotes the similarity between sample x i , n and sample x k , n . Equation (6) computes average similarity of sample x m , n with respect to the enrollment samples from the remaining N 1 classes. Figure 2 shows a sample to compute the intra-class similarity and inter-class similarity of sample x 1 , 1 . In Figure 2, there are two classes and each class has three samples. The red arrows denote the intra-class similarities of x 1 , 1 with respect to x 2 , 1 and x 3 , 1 . The blue line arrows denote the inter-class similarities of x 1 , 1 with respect to x 1 , 2 , x 2 , 2 and x 3 , 2 . Using Equations (5) and (6), the average similarities w 1 , 1 and w 1 , 1 are computed based on resulting intra-class similarities and inter-class similarities.

2.2.4. Similarity Fusion

The inter-class similarity and intra-class similarity are related to discrimination of enrollment sample x m , n . If the enrollment sample x m , n achieves a large intra-class similarity and small inter-class similarity, it contains more discriminative features. Such an enrollment sample should be more important for enrollment generation. Therefore, we formulate the following equation to compute its weight by
W m , n = α w m , n + ( 1 α ) ( 1 w m , n ) ,
where α determines the contribution of inter-class similarity and intra-class similarity for template generation. From Equation (7), if a sample has a large intra-class similarity and a small inter-class similarity, it will be assigned a large weight. On the contrary, a small weight is assigned to a sample with a small intra-class similarity and a large inter-class similarity.

2.3. Template Generation

For nth class, we aim at generating a template T n that has small intra-class variations to its enrollment samples, so the template generation is converted to solve the following optimization problem:
T n * = a r g min T n m M ( W m , n T n x m , n 2 ) ,
where w m , n is the weight of the mth sample in nth class. Note that the T n and x m , n have the same dimension. There are many approaches to solve Equation (8). Least-squares estimation is the most common estimator. When the experimental errors belong to a normal distribution, the least-squares estimator is also a maximum likelihood estimator. These properties underpin the use of the method of least squares for all types of data fitting, even when the assumptions are not strictly valid. Currently, least squares have been widely applied for computer vision tasks such as face recognition [40,41,42]. Therefore, the closed-form solution of Equation (8) can be easily obtained by using a least square regression method [36,37] and the optimal solution T n * of nth class is computed as
T n * = m = 1 M W m , n x m , n m = 1 M W m , n .
From Equations (3) and (9), we see that the samples with large intra-class similarity and small inter-class similarity have large contributions for the enrollment template generation.

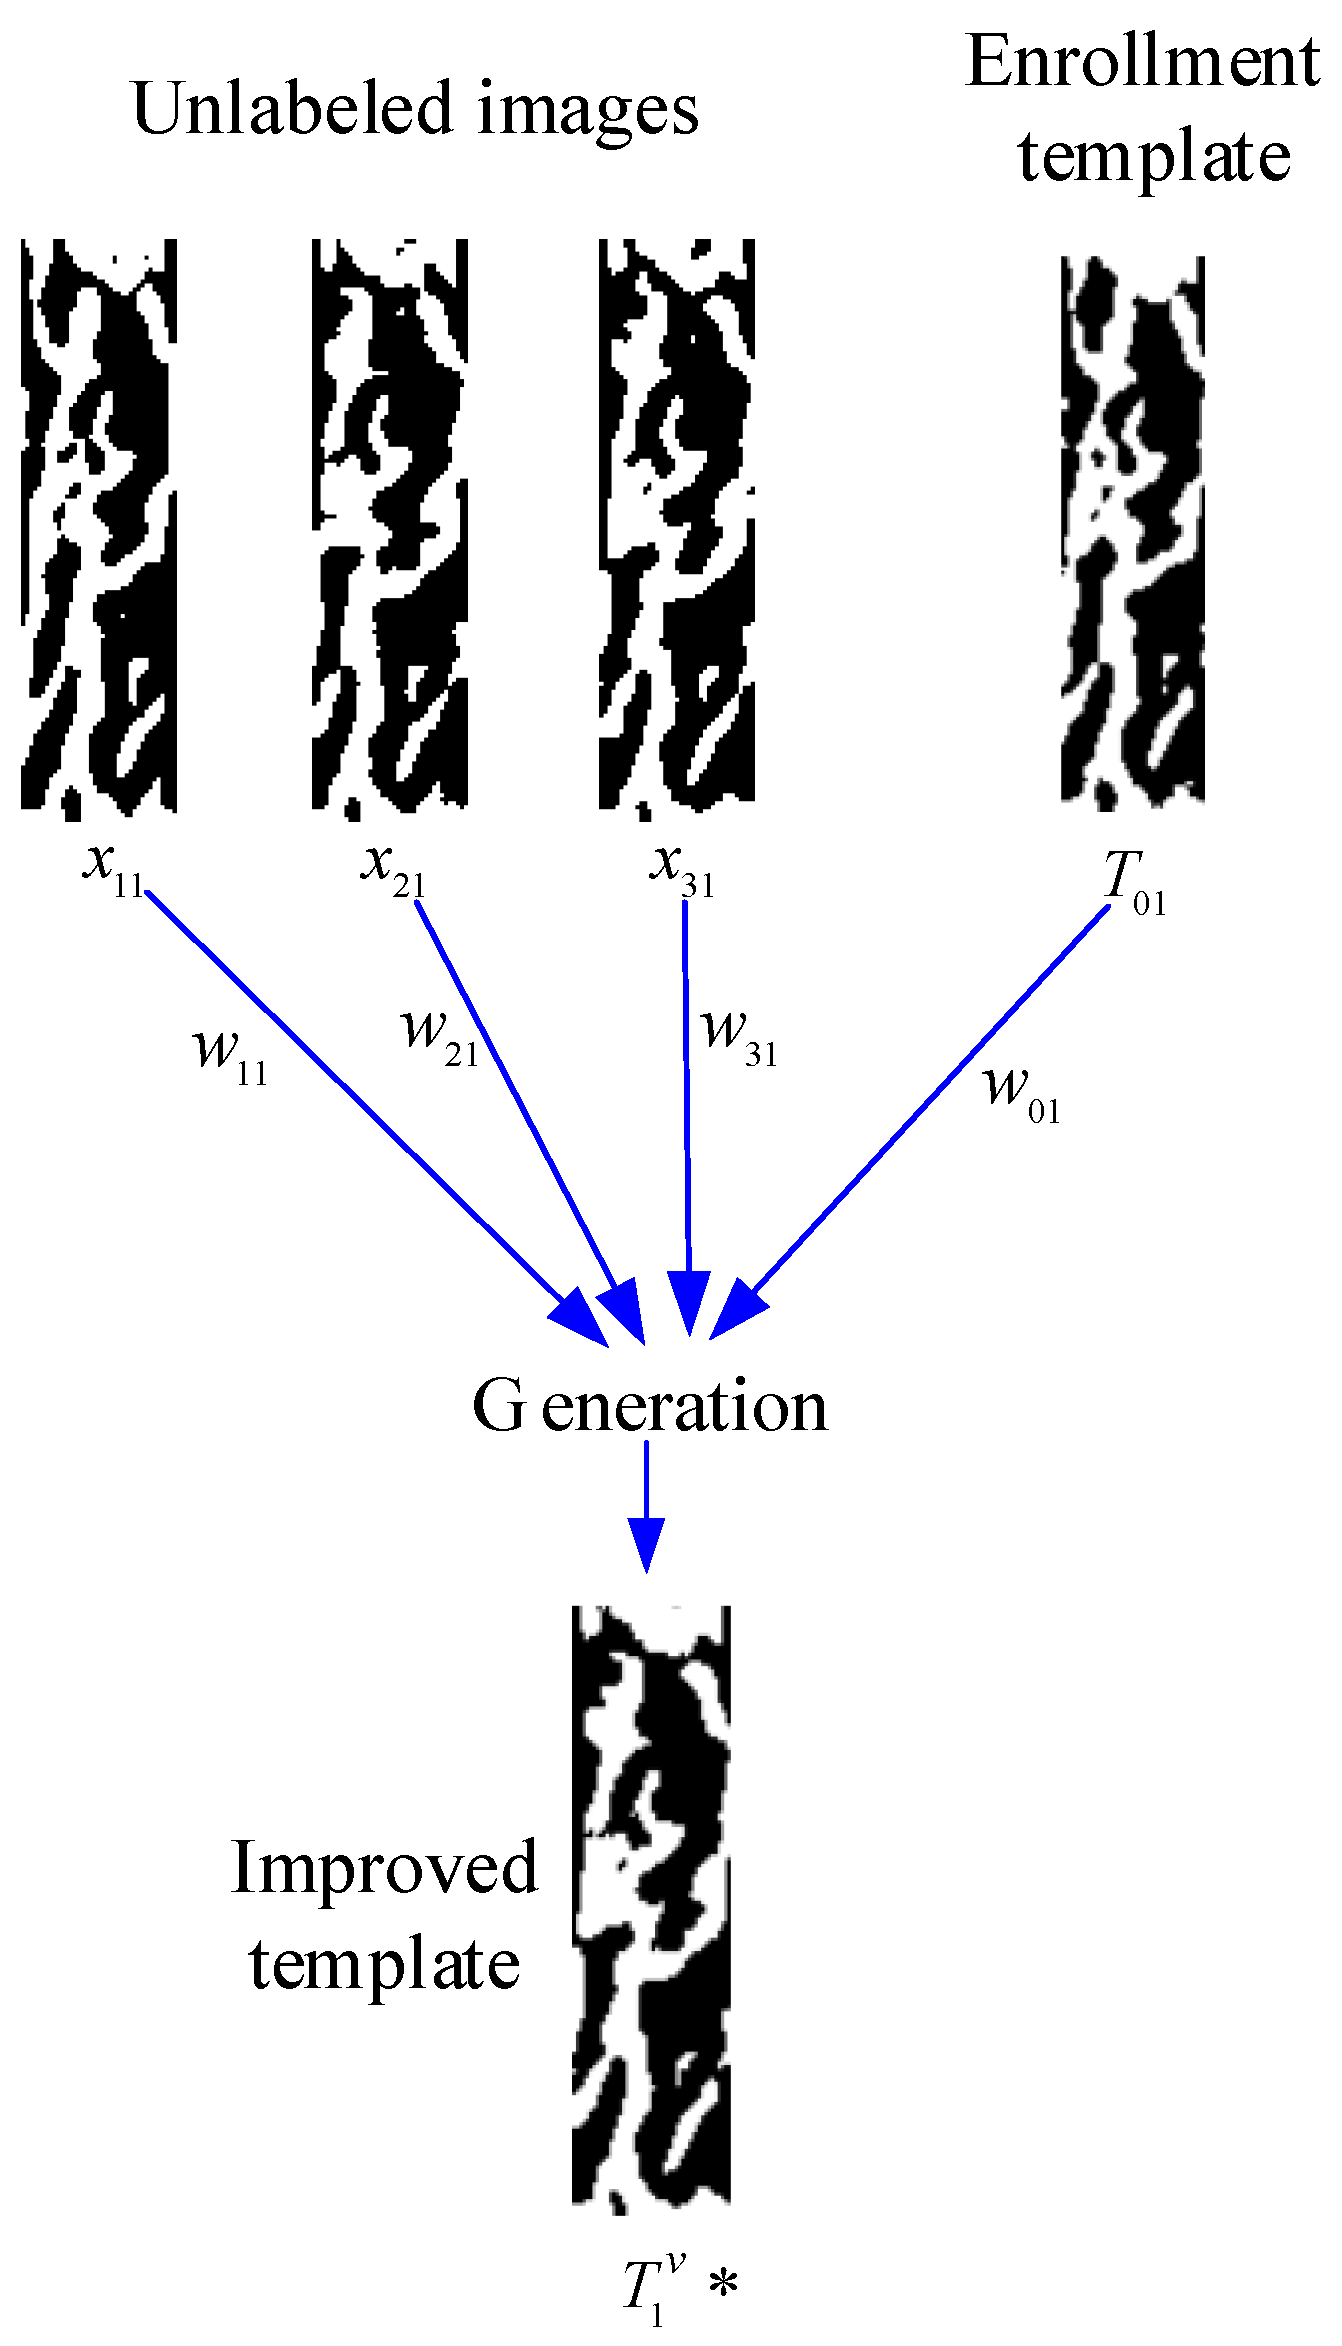
3. Finger-Vein Template Improvement

During the verification process, the vein patterns in capturing image will change due to the changes in imaging conditions, which results in large intra-class variations and poor performance of the system (as shown in Figure 3).It is not feasible to capture a number of finger-vein images from the same finger at long intervals in the registration due to limited memory and computation time. To solve this problem, in our approach, the enrollment template is improved day-to-day by using a set of unlabeled images acquired during online operation.

3.1. Weight Computation

During the test stage, each input image is subject to feature extraction and the similarity between the resulting feature map and its template is computed for verification. To update the template, an input image (unlabeled image) will be stored during the verification procedure if its similarity is larger than a predefined threshold. Assume that there are N templates for N classes and each class has stored K input images. As the template is improved based on the N templates and K input images, we therefore compute their weights, respectively.
Let x k , n denote the kth input image in the nth class, k = 1 , 2 , , K . The original template for the nth class is represented by T 0 , n , n = 1 , 2 , , N . The weight of original template T 0 , n is denoted as W 0 , n and is obtained by
W 0 , n = α w 0 , n + ( 1 α ) ( 1 w 0 , n ) ,
where w 0 , n is its intra-class average similarity with respect to the K input samples and computed as
w 0 , n = k = 1 K d ( x k , n , T 0 , n ) K
and w m , n is obtained by
w 0 , n = i = 1 , i n N d ( T 0 , i , T 0 , n ) N 1 .
Equation (12) actually computes average inter-class similarity of template T 0 , 1 with respect to the remaining N 1 templates. Figure 3 has shown a sample to compute the intra-class similarity and inter-class similarity of original template T 0 , 1 . In Figure 3, there are three templates. T 0 , 1 is the original template of the first class and the corresponding three unlabeled samples are stored during testing process. The intra-class similarities between T 0 , 1 and three unlabeled samples are d ( x 1 , n , T 0 , n ) , d ( x 2 , 1 , T 0 , 1 ) and d ( x 3 , 1 , T 0 , 1 ) which are input into Equation (11) to obtain the average intra-class similarity w 0 , 1 . The inter-class similarities between template T 0 , 1 and remaining templates ( T 0 , 2 and T 0 , 2 ) are d ( T 0 , 2 , T 0 , 1 ) and d ( T 0 , 3 , T 0 , 1 ) , based on which the averaged inter-class similarity w 0 , 1 of T 0 , 1 is computed by Equation (12). In this way, we can compute the intra-class similarity and inter-class similarity of remaining templates T 0 , 2 and T 0 , 3 if their unlabeled samples are stored during the testing process.
Similarly, the weight for kth input sample x k , n is presented as
W k , n = α w k , n + ( 1 α ) ( 1 w k , n )
in Equation (13), w k , n is average intra-class similarity of x k , n with respect to the K 1 input samples and template T 0 , n .
w k , n = i = 1 , i k K d ( x k , n , x i , n ) + d ( x k , n , T 0 , n ) K
and w k , n are the average inter-class similarity of x k , n with respect to the N 1 templates, which is computed by
w k , n = j = 1 , j n N d ( x k , n , T 0 , j ) ( N 1 ) .
Figure 4 has shown the intra-class similarity and inter-class similarity of unlabeled images x 1 , 1 . The intra-class similarities between x 1 , 1 and remaining two unlabeled images are d ( x 1 , 1 , x 2 , 1 ) and d ( x 1 , 1 , x 3 , 1 ) . The intra-class similarity of x 1 , 1 with respect to the template T 0 , 1 is d ( x 1 , 1 , T 0 , 1 ) . Then, the average inter-class similarity w 1 , 1 is obtained using Equation (14). The inter-class similarities of x 1 , 1 with respect to the templates from different classes are d ( x 1 , 1 , T 0 , 2 ) and d ( x 1 , 1 , T 0 , 3 ) , based on which the average w 1 , 1 is computed by Equation (15). Similarly, the average inter-class similarities of the remaining unlabeled images x 2 , 1 and x 3 , 1 are computed in this way.

3.2. Template Improvement

Similar to Equation (8), the improved template T n ( K ) for nth class are computed by solving the following object function:
T n v * = a r g min T n ( W 0 , n T n ( K ) T 0 , n 2 + k = 1 K ( W k , n T n ( K ) x k , n 2 ) ) .
Finally, the improved template is generated by
T n v * = W 0 , n T 0 , n + k = 1 K W k , n x k , n k = 0 K W k , n .
Figure 5 shows a sample for enrollment template improvement. In Figure 5, there are three unlabeled images and one enrollment template for first class. The weights of the unlabeled images and original enrollment template are calculated by Equations (10) and (13). Then, an improved template T 1 v * is generated based on Equation (17). Note that T n * in Equation (9) and T n v * in Equation (17) are two probability maps. To achieve verification, they are subject to binarization and the resulting binary images are stored as an enrollment template for verification.

4. Experiments and Results

To estimate the performance of our approach, rigorous experiments are carried out on two realistic databases, which are described below.

4.1. Database

4.1.1. Hkpu Database

The Hong Kong Polytechnic University (HKPU) finger-vein image database [5] includes 3132 images with a resolution of 513 × 256 pixels. All images are collected from 156 subjects using an open and contactless imaging device. The first 105 subjects provided 2520 finger images (105 subjects × 2 fingers × 6 images × 2 sessions) in two separate sessions with a minimum interval of one month and a maximum of over six months, with an average of 66.8 days. In each session, each subject provided two fingers (index finger and middle finger) and each finger provided six image samples. Figure 6 shows the finger-vein images collected in two sessions. The remaining 51 subjects only provided image data in one session. To verify our approach, the 2520 finger images captured in two sessions are employed in our experiment because it is more close to a practical captured environment. A pre-processing method [5] is employed to extract the region of interest (ROI) image and carry out the translation and orientation alignment. In addition, the image background is cropped because it contributes matching errors and computation cost. As a result, all images are normalized to 39 × 146. The preprocessing images are illustrated in Figure 7.

4.1.2. Fv-Usm Database

The Finger Vein USM (FV-USM) database [43] consists of 5904 images with 640 × 480 resolution and 256 grey levels. The images (as shown in Figure 8) were collected from 123 volunteers (83 males and 40 females) in two separate sessions with an average interval of above two weeks. In each session, each of the subjects provided 24 image samples (2 hands × 2 fingers × 6 images) from the index finger and middle finger of two hands resulting in a total of 2952 images obtained. Therefore, for two sessions, there are a total of 5904 images (123 subjects × 2 hands × 2 fingers × 6 images × 2 sessions). In Ref. [43], the ROI images are extracted by preprocessed steps and are normalized to 300 × 100. Thus, a preprocessing dataset is obtained for finger-vein verification. As our work focuses on template improvement, the preprocessed images are further resized to 50 × 150 . Figure 9a,b have shown the original image and preprocessed image.

4.1.3. Finger-Vein Feature Extraction and Matching

To evaluate the performance of the proposed approach, we employ a state-of-the-art system [44] to extract and match finger-vein feature. The extracted vein features are shown in Figure 7c and Figure 9c. Like the experiment setting in [44], two public databases are split into three sub-datasets for training, validation and testing, respectively. For the HKPU Database, there are 210 classes when the different fingers of the same hand are treated as different classes. Then, the dataset is divided into training dataset A1, validation dataset A2 and test dataset A3. There are 660 (55 fingers × 12 images) images in training dataset, 600 (50 fingers × 12 images) images in validation dataset and 1260 (105 fingers × 12 images) images in the test dataset. For FV-USM Database, there are 492 fingers from 123 subjects. Similarly, it is split into three subsets: training dataset B1 with 1476 images (123 fingers 549 × 12 images), validation dataset B3 with 1476 images (123 fingers × 12 images), and test dataset B3 with 2952 images (246 fingers × 12 images). To train the method [44], patches centered on vein pixels and patches centered on background pixels are then selected as positive samples and negative samples, respectively. As a result, 60,000 training patch examples (30,000 positive examples and 30,000 negative ones) are generated from each training dataset. The validation sets are employed to determine the parameters of method [44] and the testing sets are used to evaluate the performance of the proposed method. After training, the patch of each pixel from a test image is input into the convolutional neural network in [44] and its output is the probability of the pixel to belong to a vein pattern. Then, all vein patterns are segmented based on a probability threshold of 0.5 and stored in a binary image. This results in a set with 1260 (105 fingers × 12 images) binary images for test set A3 and a set with 2952 images (246 fingers × 12 images) binary images for test set B3, which are denoted as A3 and B3 to simplify description, respectively. As the parameter α determines the contribution of intra-class similarity and inter-class similarity for template generation and improvement, it is experimentally fixed to 0.99 based on validation A2.

4.1.4. Experiment Settings for Template Generation and Improvement

In the previous section, the vein networks of finger-vein images in testing sets are segmented by model [44] and two binary images sets A3 and B3 are obtained for testing. In this section, we will employ two sets to estimate the performance of the proposed approaches. For both sets A3 and B3 , one finger provides six images in each session, resulting in 12 images in two sessions. In order to estimate the performance of the proposed template generation method, we select six images in the first session to generate a template and the remaining six images in the second session for testing. Therefore, for set A3 , there are 6 × 105 = 630 images in total to generate templates for each finger and 6 × 105 = 630 images for testing. Similarly, for set B3 , there are 6 × 246 = 1496 images for template generation and 6 × 246 = 1496 images for testing.
The second experiment aims at estimating the performance of the template improvement approach. In this experiment, for set A3 and B3 , the six images of each finger in the first session are used for enrollment template generation. Three images of each finger in the second session are used to improve the template generated from images in the first session, and the remaining three images in second session are employed for testing. Therefore, for set A3 , there are totally 105 template images for each finger, 3 × 105 = 415 images for template improvement and 3 × 105 = 415 images for testing. Similarly, for set B3 , there are 246 template images, 3 × 246 = 738 images for template improvement and 3 × 246 = 738 images for testing. To effectively evaluate the performance of our method, we report the experimental results on sets A3 and B3 in the following sections.

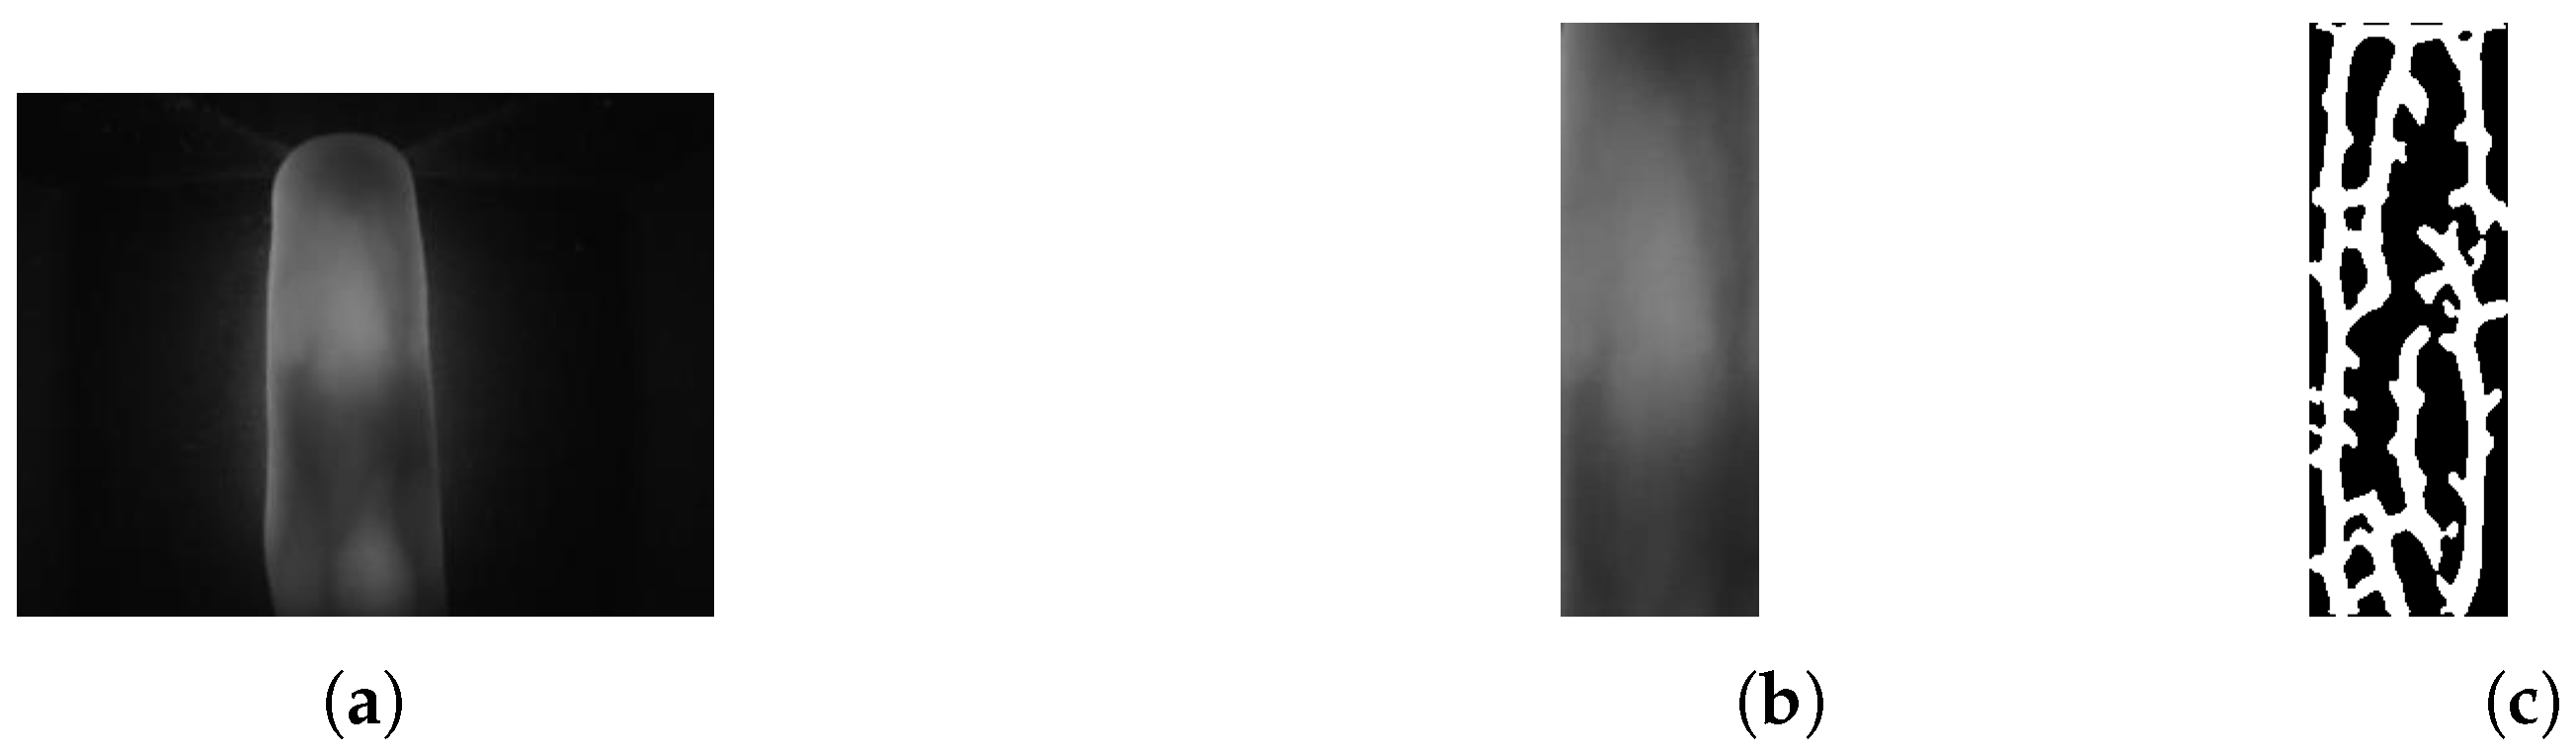
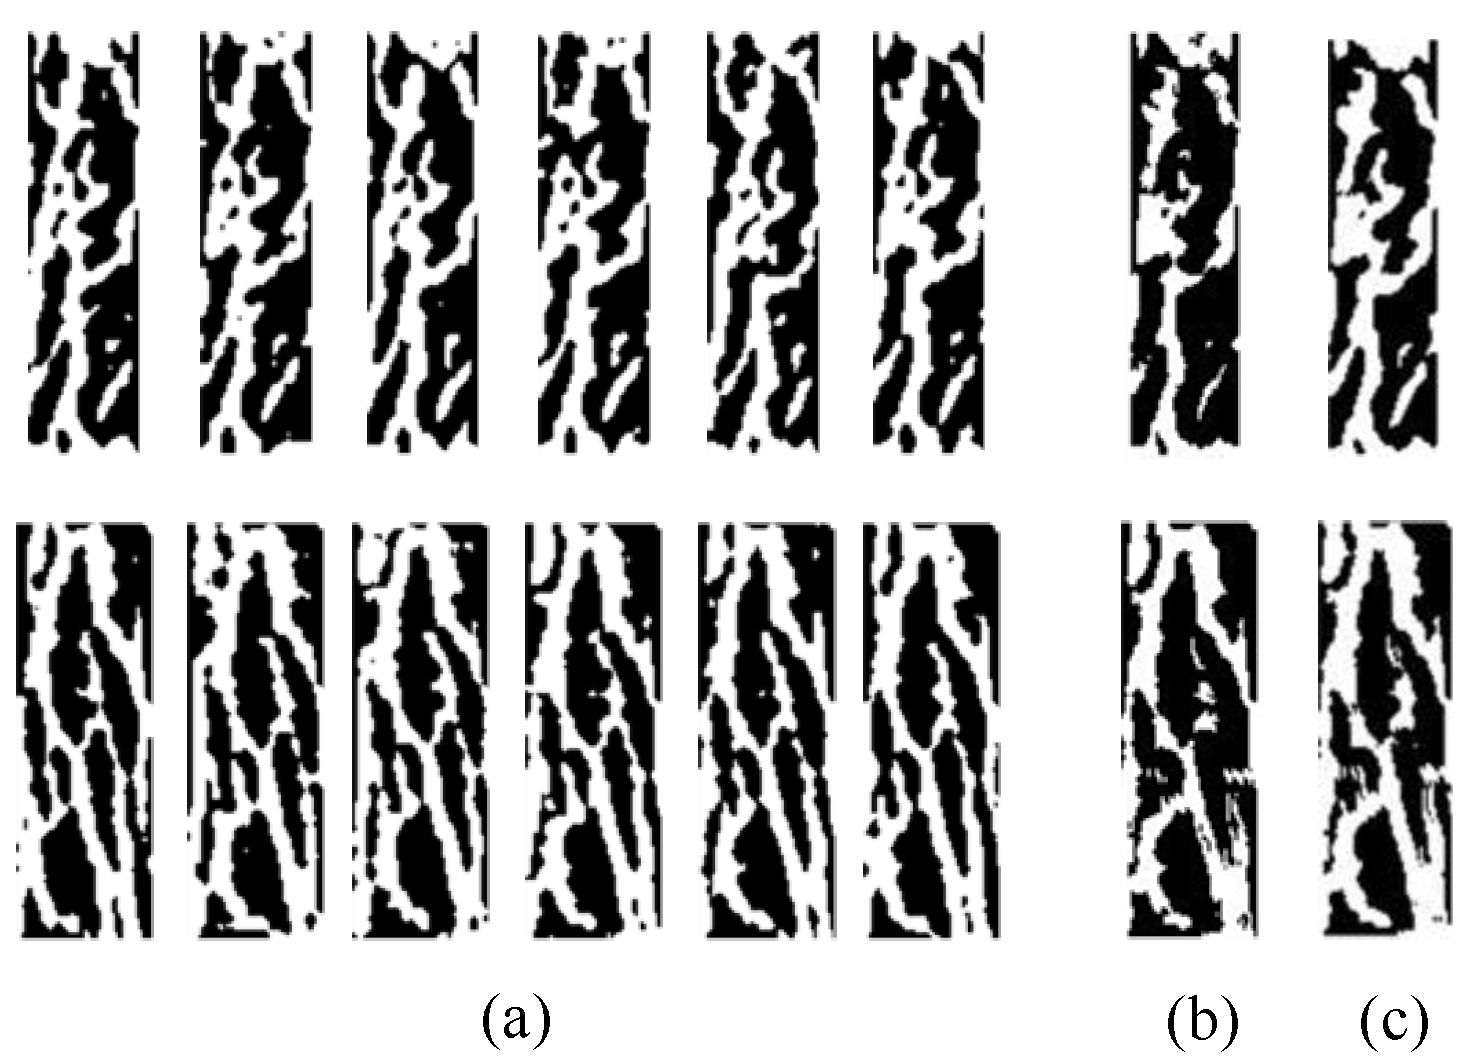
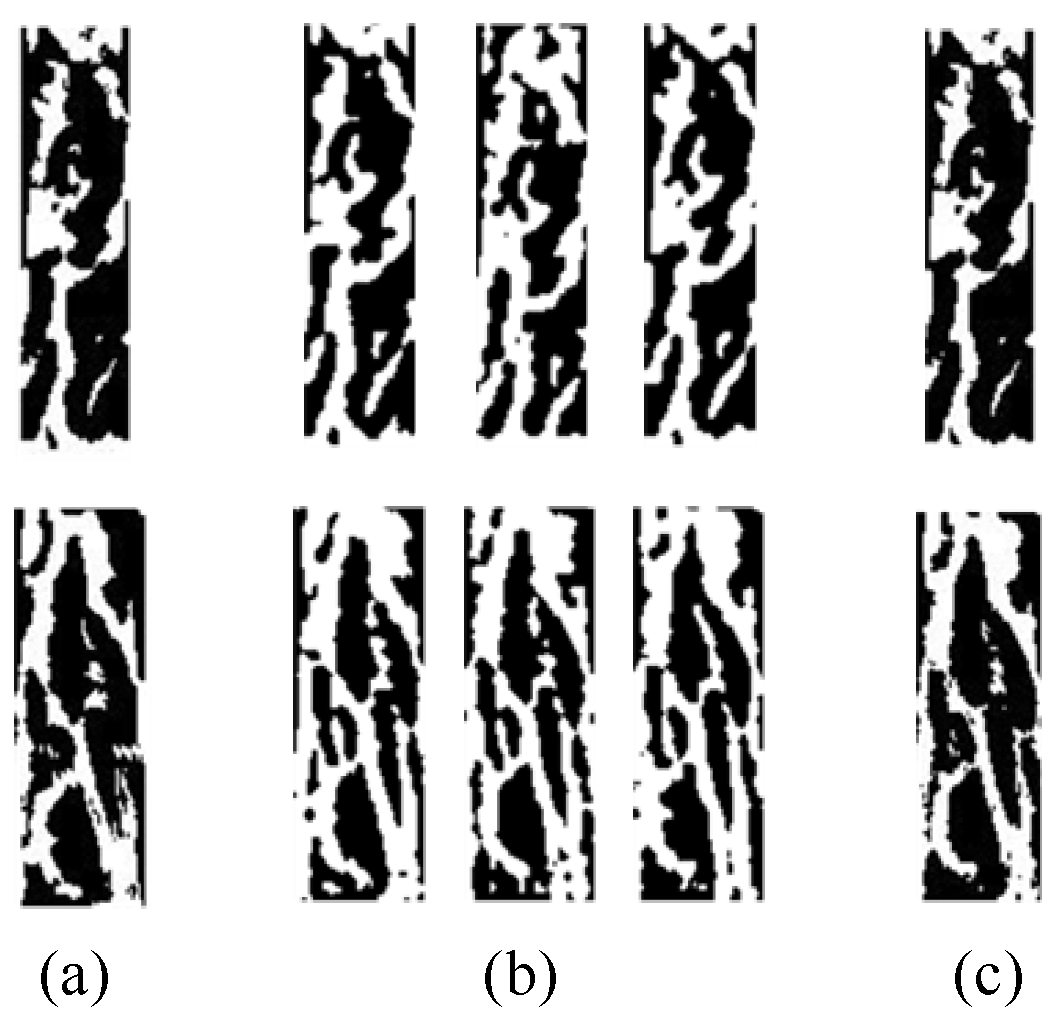
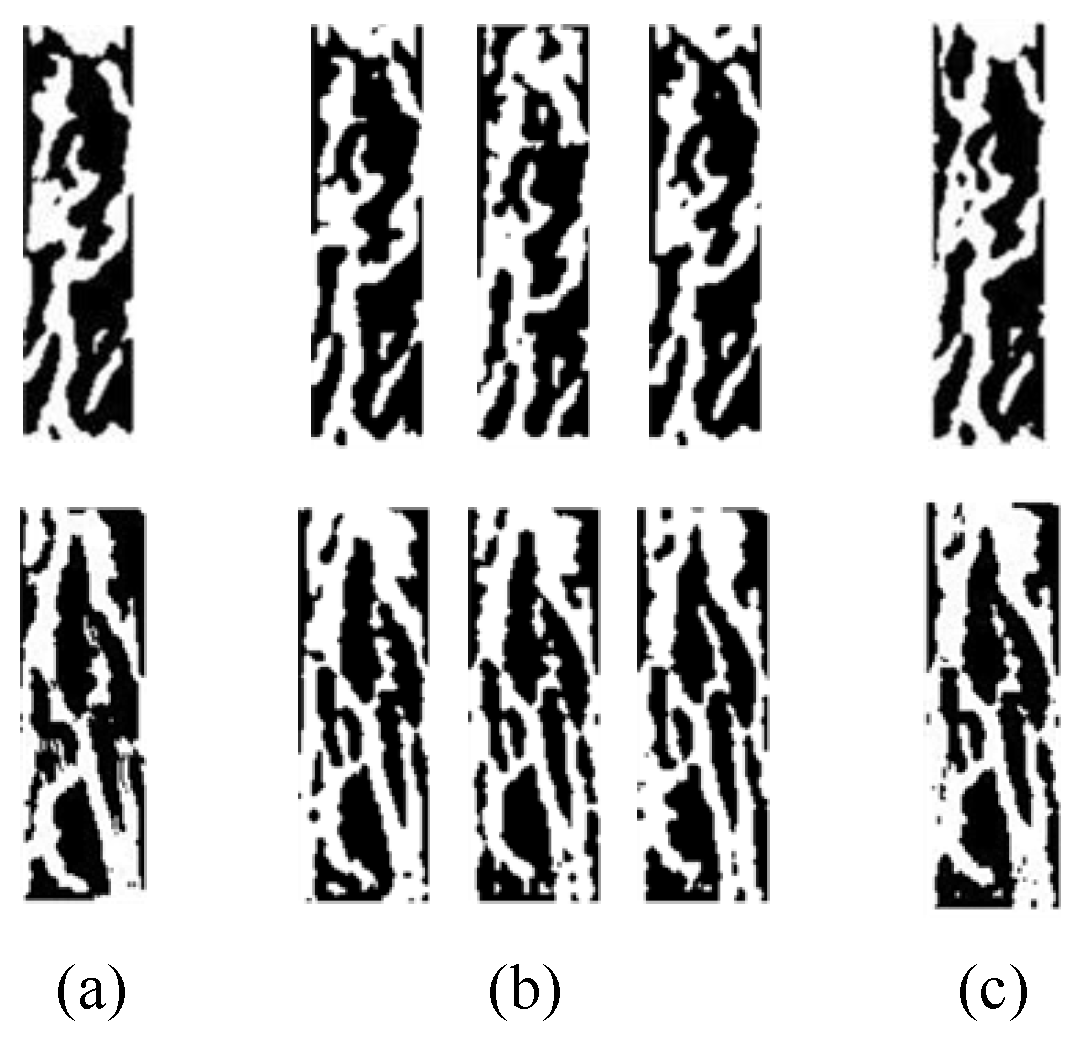
4.2. Visual Assessment

In this section, we visually analyze the generation and improvement templates using various methods. For each finger, firstly, we compute average and weight average of all enrollment images, respectively. Secondly, the resulting average image and weight average image are subject to binarization for generating enrollment templates. Figure 10 illustrates the finger-vein template generated by combining six enrollment images using average approach and weight average approach. From the experimental results, we observe that, compared to the average approach, the proposed weight average method effectively generates more common features which result in the largest intra-class similarity. In addition, the template images generated by the proposed method contain more connective vein features.
Figure 11 and Figure 12 show the improving template using average approach and weight average approach, respectively. Compared to the template before and after improving, we see that the proposed approach removes spurious vein feature and recovers the dropped vein features such that the improving template may achieve large intra-class similarity. In addition, the weight average approach generated more connective and smoothness features than the average approach.

4.3. Experiments Results with Template Generation

4.3.1. Experiments Results with Template Generation for Verification

This experiment focuses on evaluating the performance of the proposed template generation approach in terms of reduction of verification errors on the finger-vein image datasets. Equation (7) is employed to generate the template for verification. To facilitate description, the templates generated by average and weight average are denoted as “ Average template” and “ Weight average template”. In addition, the approach in work [18] is employed to generate enrollment template in the comparable experiment. As described in Section 4.1.4, six images of each finger acquired in the first session are employed to generate the template and the remaining six images are selected as testing data for the performance evaluation. Therefore, there are 105 templates for HKPU Database and 246 templates for FV-USM Database. We match the images in the testing set with the corresponding template to generate genuine scores while the impostor scores are produced by matching templates from different fingers. As a result, there are 630 (105 × 6) genuine scores and 5460 (105 × 104/2) impostor scores for the HKPU Database, and 1476 (246 × 6) genuine scores and 30,135 (246 × 245/2) impostor scores for FV-USM Database. The False Rejection Rate (FAR) is the error rate where the un-enrolled finger images are accepted as enrolled images and computed by genuine matching scores while the False Rejection Rate (FRR) is the error rate when the enrolled finger images are rejected as un-enrolled images and computed by impostor scores. The Equal Error Rate (EER) is defined as the error rate when FAR and FRR are equal. The receiver operating characteristics (ROC) curves are crated by plotting the Genuine acceptance rate (GAR = 1-FAR) against the FAR, as illustrated in Figure 13. The EERs which are computed by adopting average template and weight average template are listed in Table 1.
From the experimental results in Table 1, we can see that, based on the weight average template, the lowest EERs are 3.02% and 2.30% for HKPU Database and FV-USM Database, respectively. Compared to the average approach, the existing approach [18] achieves lower EERs e.g., 4.64% and 2.88% for both databases. Figure 13 also shows that the weight average approach achieves higher GAR than the average approach and the existing approach [18] at same FAR. Therefore, the experimental results imply that the proposed weight average template can effectively improve the verification error and outperforms the existing approach.

4.3.2. Experiments Results with Template Generation for Identification

In this section, we report the experimental results for the identification performance using an individual finger-vein template. As described in Section 4.1.4, as six images in the first session have been employed to template generation, there is one enrollment template and six testing images for each finger on the HKPU Database and the FV-USM Database. Equation (9) is employed to compute matching scores between testing images and enrollment templates for identification. The identification accuracies from various approaches are listed in Table 2.
We observe from Figure 13, Table 1 and Table 2 that the proposed weight average based approach achieves, on both datasets, the best performance for verification and identification. Such a good performance may explain that the proposed average approach does not consider different contributions for template generation as they equally treat all enrollment images from one finger. By contrast, for each finger image, the proposed weight average approach computes its average similarity with respect to the remaining images from the same class and assigns larger weight to the enrollment image with larger average similarity so that it is capable of generating a robust enrollment template to achieve high verification accuracy.

4.4. Experiment Results with Template Improvement

4.4.1. Experiment Results with Template Improvement for Verification

In this section, the experimental results of various methods are reported to assess the performance of the proposed template improvement approach. In our experiments, Equation (17) is employed to improve “average template” and “weight average template” and we denote them as “Average template + improve” and “ Weigh Average template + improve” to facility description, respectively. For comparison, the existing approach [23] is employed to improve templates (e.g., “average template” and “weight average template”). We present them as “Average template + Method [23]” and “ Weigh Average template + Method [23]”. As described in Section 4.1.4, we select three images of each finger captured in the second session to improve a template generated from six images in the first session and the remaining three images for testing the performance. This results in 105 improvement templates for HKPU Database and 246 improvement templates for the FV-USM Database. For the HKPU Database, 315 (105 × 3) genuine scores and 5460 (105 × 104/2) impostor scores are produced by matching the samples with corresponding improvement templates and matching the improvement templates from different fingers. For FV-USM Database, there are 738 (246 × 3) genuine scores and 30135 (246 × 245/2) impostor scores, respectively. To effectively estimate the performance of the proposed methods, we also compute the genuine matching scores between three testing images and corresponding templates without improvement and impostor scores between theses templates without improvement from different fingers. As a result, 315 (105 × 3) genuine scores and 5460 (105 × 104/2) impostor scores are generated for the HKPU Database, and 738 (246 × 3) genuine scores and 30,135 (246 × 245/2) impostor scores are produced for the FV-USM Database.
Figure 14a,b depict the ROC curve on the HKPU Database and FV-USM Database after adopting our enrollment template improvement scheme and existing approach [23], and Table 3 shows the corresponding EERs. To facilitate comparison, the experimental results of corresponding methods before improvement are also reported in Figure 14 and Table 3.
From the experimental results (Figure 14 and Table 3) on the two databases, the verification error is significantly reduced after updating the enrollment template using the proposed approach. For HKPU Database, the EERs (Table 3) are reduced to 2.22% and 0.63% for the average template + improve and the weight average template + improve, after using the enrollment images in second session to improve the enrollment template. From the corresponding ROC curves in Figure 14a, we also observe that a higher GAR is achieved at lower FAR using the improving scheme. For the FV-USM Database, the EER is reduced to 2.30% using average template + improve and a lower EER, namely 0.95% is achieved by the weight average template + improve. In addition, the ROC curve (as shown in Figure 14b) shows that using the improving scheme results in significant GAR improvement at different FAR regions. In addition, the experimental results show that the weight average approach outperforms the average scheme in terms of reducing EER, which implies that the intra-class distance is reduced based on the weight associated with similarity. From Figure 14 and Table 3, it can see that the proposed approach outperforms the existing approach [23] in terms of EER improvement.

4.4.2. Experiment Results with Template Improvement for Identification

As described in the last section, after improving the enrollment template, there are 105 improvement templates and 315 (105 × 3) testing images for HKPU Database, and 246 improvement templates and 738 (246 × 3) testing images for the FV-USM Database. To facilitate comparison, we match testing images with templates without improvement and report the recognition rate. The performance on the HKPU Database and FV-USM Database before and after improving enrollment template is listed in Table 4. Using Average template and Weight average template allows for achieving 94.92% and 95.56% recognition rate on the HKPU Database, which are significantly improved by adopting the proposed template improvement scheme. For the FV-USM Database, the identification accuracies increase to 99.45% and 99.59% after improving the enrollment template using our method.
The experimental results (Figure 14, Table 3 and Table 4) consistently show that the finger-vein verification/identification error rate on the two datasets is decreased by improving the enrollment template, which implies fusing vein features from matching image captured at different times into template is able to minimize the intra-class variations. This may be explained by the fact that the templates automatically change with time in line with changes of physiological and imaging condition by using our template improvement approach. For example, the proposed template improvement approach may remove spurious vein features and recovering missed the vein features during online verification/identification. In addition, the experimental results show that the proposed template improved approach achieves a higher recognition rate than the existing method [23]. The reason is that our template definition targets minimization of verification error instead of human perception and the weight in our scheme is related to intra-class similarity and inter-class similarity.

5. Conclusions and Perspectives

In this paper, we proposed a weight average method for finger-vein template generation and improvement. First, a weight average based approach is developed to generate the enrollment template for reduction of the intra-class variations. As the weight is related to intra-class similarity and inter-class similarity, so it objectively represents the importance of each enrollment sample in terms of reducing verification error. Second, to improve the performance online, we proposed a template improvement method. Experimental results show that the proposed approach reduces the intra-class distance and significantly improves the verification/identification error rate.
Currently, the images in the existing finger-vein databases are collected at no more than two sessions. In practical application, the finger-vein pattern may slightly change at different times. Therefore, in the future, we will collect images in more sessions (e.g., four sessions with an interval of three months) to test the finger-vein template improvement model.

Author Contributions

Conceptualization, H.Q.; methodology, H.Q.; software, H.Q. and P.W.; validation, H.Q. and P.W.; formal analysis, P.W.; investigation, P.W.; resources, P.W.; data curation, P.W.; writing—original draft preparation, P.W.; writing—review and editing, H.Q.; visualization, P.W.; supervision, H.Q.; project administration, H.Q.; funding acquisition, H.Q.

Funding

This research was funded by the National Natural Science Foundation of China (Grant No. 61402063), the Natural Science Foundation Project of Chongqing (Grant No. cstc2017jcyjAX0002, Grant No. cstc2018jcyjAX0095, Grant No. cstc2013kjrc-qnrc40013, Grant No. cstc2017zdcy-zdyfX0067).

Conflicts of Interest

The authors declare no conflict of interest.

References

  1. Daugman, J. How iris recognition works. IEEE Trans. Circuits Syst. Video Technol. 2004, 14, 21–30. [Google Scholar] [CrossRef]
  2. Jain, A.; Hong, L.; Bolle, R. On-line fingerprint verification. IEEE Trans. Pattern Anal. Mach. Intell. 1997, 19, 302–314. [Google Scholar] [CrossRef] [Green Version]
  3. Turk, M.A.; Pentland, A.P. Face recognition using eigenfaces. In Proceedings of the 1991 IEEE Computer Society Conference on Computer Vision and Pattern Recognition CVPR, Maui, HI, USA, 3–6 June 1991; pp. 586–591. [Google Scholar]
  4. Kumar, A.; Prathyusha, K.V. Personal authentication using hand vein triangulation and knuckle shape. IEEE Trans. Image Process. 2009, 18, 2127–2136. [Google Scholar] [CrossRef] [PubMed]
  5. Kumar, A.; Zhou, Y. Human identification using finger images. IEEE Trans. Image Process. 2012, 21, 2228–2244. [Google Scholar] [CrossRef] [PubMed]
  6. Zhou, Y.; Kumar, A. Human identification using palm-vein images. IEEE Trans. Inf. Forensics Secur. 2011, 6, 1259–1274. [Google Scholar] [CrossRef]
  7. Hashimoto, J. Finger vein authentication technology and its future. In Proceedings of the 2006 Symposium on VLSI Circuits, Honolulu, HI, USA, 15–17 June 2006; pp. 5–8. [Google Scholar]
  8. Huang, B.; Dai, Y.; Li, R.; Tang, D.; Li, W. Finger-vein authentication based on wide line detector and pattern normalization. In Proceedings of the 2010 20th International Conference on Pattern Recognition ICPR, Istanbul, Turkey, 23–26 August 2010; pp. 1269–1272. [Google Scholar]
  9. Song, W.; Kim, T.; Kim, H.C.; Choi, J.H.; Kong, H.J.; Lee, S.R. A finger-vein verification system using mean curvature. Pattern Recognit. Lett. 2011, 32, 1541–1547. [Google Scholar] [CrossRef]
  10. Yang, J.; Shi, Y. Towards finger-vein image restoration and enhancement for finger-vein recognition. Inf. Sci. 2014, 268, 33–52. [Google Scholar] [CrossRef]
  11. Lee, E.C.; Park, K.R. Image restoration of skin scattering and optical blurring for finger vein recognition. Opt. Lasers Eng. 2011, 49, 816–828. [Google Scholar] [CrossRef]
  12. Miura, N.; Nagasaka, A.; Miyatake, T. Extraction of finger-vein patterns using maximum curvature points in image profiles. IEICE Trans. Inf. Syst. 2007, 90, 1185–1194. [Google Scholar] [CrossRef]
  13. Miura, N.A.; Miyatake, T. Feature extraction of finger-vein patterns based on repeated line tracking and its application to personal identification. Mach. Vis. Appl. 2004, 15, 194–203. [Google Scholar] [CrossRef]
  14. Liu, T.; Xie, J.; Yan, W.; Li, P.; Lu, H. An algorithm for finger-vein segmentation based on modified repeated line tracking. Imaging Sci. J. 2013, 61, 491–502. [Google Scholar] [CrossRef]
  15. Gupta, P.; Gupta, P. An accurate finger vein based verification system. Digit. Signal Process. 2015, 38, 43–52. [Google Scholar] [CrossRef]
  16. Yin, Y.; Ning, Y.; Ren, C.; Liu, L. A framework of multitemplate ensemble for fingerprint verification. EURASIP J. Adv. Signal Process. 2012, 1, 1–11. [Google Scholar] [CrossRef]
  17. Abboud, A.J.; Jassim, S.A. Biometric templates selection and update using quality measures. Mob. Multimedia Image Process. Secur. Appl. 2012, 8406, 7. [Google Scholar] [CrossRef]
  18. Lumini, A.; Nanni, L. A clustering method for automatic biometric template selection. Pattern Recognit. 2006, 39, 495–497. [Google Scholar] [CrossRef]
  19. Uludag, U.; Ross, A.; Jain, A. Biometric template selection and update: A case study in fingerprints. Pattern Recognit. 2004, 37, 1533–1542. [Google Scholar] [CrossRef]
  20. Prabhakar, S.; Jain, A.K. Decision-level fusion in fingerprint verification. Pattern Recognit. 2002, 35, C861–C874. [Google Scholar] [CrossRef]
  21. Yang, C.; Zhou, J. A comparative study of combining multiple enrolled samples for fingerprint verification. Pattern Recognit. 2006, 39, 2115–2130. [Google Scholar] [CrossRef]
  22. Hu, Z.; Li, D.; Isshiki, T.; Kunieda, H. Narrow Fingerprint Template Synthesis by Clustering Minutiae Descriptors. IEICE Trans. Inf. Syst. 2017, 100, 1290–1302. [Google Scholar] [CrossRef]
  23. Jiang, X.; Ser, W. Online fingerprint template improvement. IEEE Trans. Pattern Anal. Mach. Intell. 2002, 24, 1121–1126. [Google Scholar] [CrossRef] [Green Version]
  24. Ryu, C.; Han, Y.; Kim, H. Super-template Generation Using Successive Bayesian Estimation for Fingerprint Enrollment. In Proceedings of the 5th International Conference on Audio- and Video-Based Biometric Person Authentication, Hilton Rye Town, NY, USA, 20–22 July 2005; pp. 710–719. [Google Scholar]
  25. Uz, T.; Bebis, G.; Erol, A.; Prabhakar, S. Minutiae-based template synthesis and matching for fingerprint authentication. Comput. Vis. Image Underst. 2009, 113, 979–992. [Google Scholar] [CrossRef]
  26. Marcialis, G.L.; Granger, E.; Didaci, L.; Pisano, A.; Roli, F. Why template self-update should work in biometric authentication systems? In Proceedings of the International Conference on Information Science, Signal Processing and Their Applications, Montreal, QC, Canada, 2–5 July 2012; pp. 1086–1091. [Google Scholar]
  27. Akhtar, Z.; Ahmed, A.; Erdem, C.E.; Foresti, G.L. Biometric template update under facial aging. In Proceedings of the 2014 IEEE Symposium on Computational Intelligence in Biometrics and Identity Management, Orlando, FL, USA, 9–12 December 2014; pp. 9–15. [Google Scholar]
  28. Wang, C.; Zhang, J.; Wang, L.; Pu, J.; Yuan, X. Human identification using temporal information preserving gait template. IEEE Trans. Pattern Anal. Mach. Intell. 2012, 34, 2164–2176. [Google Scholar] [CrossRef] [PubMed]
  29. Tolosana, R.; Vera-Rodriguez, R.; Ortega-Garcia, J.; Fierrez, J. Update strategies for HMM-based dynamic signature biometric systems. In Proceedings of the International Workshop on Information Forensics and Security, Rome, Italy, 16–19 November 2016; pp. 1–6. [Google Scholar]
  30. Nandakumar, K.; Jain, A.K. Biometric template protection: Bridging the performance gap between theory and practice. IEEE Signal Process. Mag. 2015, 32, 88–100. [Google Scholar] [CrossRef]
  31. Ratha, N.K.; Chikkerur, S.; Connell, J.H.; Bolle, R.M. Generating cancelable fingerprint templates. IEEE Trans. Pattern Anal. Mach. Intell. 2007, 29, 561–572. [Google Scholar] [CrossRef] [PubMed]
  32. Menotti, D.; Chiachia, G.; Pinto, A.; Schwartz, W.R.; Pedrini, H.; Falcao, A.X.; Rocha, A. Deep representations for iris, face, and fingerprint spoofing detection. IEEE Trans. Inf. Forensics Secur. 2015, 10, 864–879. [Google Scholar] [CrossRef]
  33. Tome, P.; Vanoni, M.; Marcel, S. On the vulnerability of finger vein recognition to spoofing. In Proceedings of the 2014 International Conference of the Biometrics Special Interest Group (BIOSIG), Darmstadt, Germany, 10–12 September 2014; pp. 1–10. [Google Scholar]
  34. Liu, Y.; Ling, J.; Liu, Z.; Shen, J.; Gao, C. Finger vein secure biometric template generation based on deep learning. Soft Comput. 2018, 22, 2257–2265. [Google Scholar] [CrossRef]
  35. Yang, W.; Hu, J.; Wang, S. A finger-vein based cancellable bio-cryptosystem. In Proceedings of the International Conference on Network and System Security, Madrid, Spain, 3–4 June 2013; pp. 784–790. [Google Scholar]
  36. Friedman, J.; Hastie, T.; Tibshirani, R. The Elements of Statistical Learning; Springer Series in Statistics; Springer: New York, NY, USA, 2001; Volume 1. [Google Scholar]
  37. Seber, G.A.; Lee, A.J. Linear Regression Analysis; John Wiley and Sons: Hoboken, NJ, USA, 2012; Volume 329. [Google Scholar]
  38. Nagar, A.; Nandakumar, K.; Jain, A.K. Biometric template transformation: A security analysis. In Media Forensics and Security II, Proceedings of the IS&T/SPIE Electronic Imaging, San Jose, CA, USA, 17–21 January 2010; International Society for Optics and Photonics: Bellingham, WA, USA, 2010; Volume 7541, p. 75410O. [Google Scholar]
  39. Wang, Y.; Rane, S.; Draper, S.C.; Ishwar, P. A theoretical analysis of authentication, privacy, and reusability across secure biometric systems. IEEE Trans. Inf. Forensics Secur. 2012, 7, 1825–1840. [Google Scholar] [CrossRef]
  40. Lu, J.; Tan, Y.P. Nearest feature space analysis for classification. IEEE Signal Process. Lett. 2011, 18, 55–58. [Google Scholar] [CrossRef]
  41. Naseem, I.; Togneri, R.; Bennamoun, M. Linear regression for face recognition. IEEE Trans. Pattern Anal. Mach. Intell. 2010, 32, 2106–2112. [Google Scholar] [CrossRef]
  42. Chai, X.; Shan, S.; Chen, X.; Gao, W. Locally linear regression for pose-invariant face recognition. IEEE Trans. Image Process. 2007, 16, 1716–1725. [Google Scholar] [CrossRef]
  43. Asaari, M.S.M.; Suandi, S.A.; Rosdi, B.A. Fusion of band limited phase only correlation and width centroid contour distance for finger based biometrics. Expert Syst. Appl. 2014, 41, 3367–3382. [Google Scholar] [CrossRef]
  44. Qin, H.; El-Yacoubi, M.A. Deep representation-based feature extraction and recovering for finger-vein verification. IEEE Trans. Inf. Forensics Secur. 2017, 12, 1816–1829. [Google Scholar] [CrossRef]
Figure 1. Matching sample. (a) a finger-vein template; (b) the extended image from (a); (c) a testing image. The values in pink region are −1 in (b). The red rectangle box translates in the extended images from top left corner to lower right corner.
Information 10 00145 g001
Figure 2. The intra-class similarity and inter-class similarity of sample x 1 , 1 . There are two classes and each class provides three enrollment samples. The red arrow implies that the similarity is computed based on two images from same class and the blue arrow implies that the similarity is computed based on two images from different classes.
Information 10 00145 g002
Figure 3. The intra-class similarity and inter-class similarity computation for enrollment template T 0 , 1 . There are three enrollment templates and three unlabeled samples for the first class. The red arrow implies that the similarity is computed by matching enrollment template T 0 , 1 and its three unlabeled images. The blue arrow implies that the similarity is computed by matching enrollment template T 0 , 1 and the remaining enrollment templates.
Information 10 00145 g003
Figure 4. The intra-class similarity and inter-class similarity for unlabeled sample x 1 , 1 .
Information 10 00145 g004
Figure 5. A sample for template improvement. Three unlabeled images are employed to improve the enrollment template and an improved template T 1 v * is generated for recognition.
Information 10 00145 g005
Figure 6. Finger-vein image samples collected in (a) first session and (b) second session.
Information 10 00145 g006
Figure 7. The preprocessing results. (a) original finger-vein images samples from HKPU. database; (b) ROI extracted from (a); (c) vein feature segmented from (b).
Information 10 00145 g007
Figure 8. Finger-vein image samples collected in (a) first session and (b) second session.
Information 10 00145 g008
Figure 9. The preprocessing results. (a) original finger-vein image from FV-USM. database; (b) ROI image from (a); (c) vein feature from (b).
Information 10 00145 g009
Figure 10. The results for template generation. (a) enrollment samples; (b) templates generated by the average approach; (c) template generated by the weight average approach. (Samples in the first row are from the HKPU Database and samples in the second row are from the FV-USM Database).
Information 10 00145 g010
Figure 11. The results for template improvement based on average approach. (a) templates generated by average approach; (b) samples for template improvement; (c) improving template using the average approach. (The samples in the first row are from the HKPU Database and the samples in the second row are from the FV-USM Database).
Information 10 00145 g011
Figure 12. The results for template improvement based on weight average approach. (a) templates generated by the weight average approach; (b) samples for template improvement; (c) improving template using weight average approach. (The samples in the first row are from the HKPU Database and the samples in the second row are from the FV-USM Database).
Information 10 00145 g012
Figure 13. Performance of various methods on the (a) HKPU Database and the (b) FV-USM Database.
Information 10 00145 g013
Figure 14. Performance of various methods on (a) HKPU Database and (b) FV-USM Database.
Information 10 00145 g014
Table 1. Equal error rate of various approaches on both datasets.
MethodsHKPU DatabaseFV-USM Database
Approach [18]4.642.88
Average template5.182.91
Weight average template3.022.30
Table 2. Identification accuracy of various approaches on both datasets.
MethodsHKPU DatabaseFV-USM Database
Approach [18]94.4497.56
Average template94.2997.49
Weight average template95.7197.70
Table 3. Equal error rate of various approaches on both datasets.
MethodsHKPU DatabaseFV-USM Database
Average template5.132.98
Average template + improve2.222.30
Weight average template3.491.90
Weight average template + improve0.630.95
Average template + Method [23]3.262.54
Weight average template + Method [23]1.281.43
Table 4. Identification accuracy of various approaches on both datasets.
MethodsHKPU DatabaseFV-USM Database
Average template94.9297.29
Weight average template95.5697.56
Average template + improve98.7399.45
Weight average template + improve99.3799.59
Average template + Method [23]95.2397.83
Weight average template + Method [23]96.1997.97

